Embed Size (px)
Citation preview

A Review of Current Knowledge
Plastic Pollution in Rivers
and Oceans
FR/R0030 November 2018
© Foundation for Water Research
Price: £15.00 (20% discount to FWR Members)
Foundation for Water Research Allen House, The Listons, Liston Road, Marlow, Bucks SL7 1FD, U.K. Tele: +44(0)1628 891589 Fax: +44(0)1628 472711 E-mail: [email protected] Home page: www.fwr.org

Review of Current Knowledge
© Foundation for Water Research 2018
Copyright
Apart from any fair dealing for the purposes of research or private study, or criticism or review, as permitted under the UK Copyright, Designs and Patents Act (1998), no part of this publication may be reproduced, stored or transmitted in any form or by any means, without the prior permission in writing of FWR.
Disclaimer
Whilst every effort has been made to ensure accuracy FWR will not accept responsibility for any loss or damage suffered by any person acting or refraining from acting upon any material contained in this publication.
Appropriate professional advice should be sought when making important decisions to ensure the information is correct, up-to-date and applicable to specific circumstances.
This review is one of a series of Reviews of Current Knowledge (ROCKs) produced by FWR. They focus on topics related to water supply, wastewater disposal and water environments, which may be the subject of debate and inquiry. The objective of each review is to produce concise, independent scientific and technical information on the subject to facilitate a wider understanding of the issues involved and to promote informed opinion about them.

Review of Current Knowledge
1
Plastic pollution in rivers and oceans
Installation of the OCEANCLEANUP System 001 at the Pacific Trial test site.
September 15, 2018 with permission of Oceancleanup Project
Author: Dr E M Valentine

Review of Current Knowledge
2

Review of Current Knowledge
3
CONTENTS
Page1 Introduction
5
2 Types of plastics and their uses
8
3 Sources of plastic waste 11
3.1 How plastic enters the environment 11 3.2 The major river sources of waste plastics 12 3.3 Interaction of plastics in rivers and coasts with the oceans
14
4 How persistent is plastic in the environment?
17
5 The transport and spread of plastic pollution 19
5.1 Plastic waste pathways – a mass balance 19
5.2 Transport of plastic
20
6 The environmental impact of waste plastics 23
6.1 Impact in the oceans 236.2 Impact in rivers
24
7 Potential changes in human behaviour 26
7.1 What are the key drivers of plastic pollution? 277.2 Changes in recycling and uses for waste plastics 287.3 What can we do to clean up this mess? 297.4 Examples of innovative clean-up methods
30
8 Future concerns 33
8.1 Key future research areas for scientists and policymakers
33
9 Sources of further information
37
10 References/Bibliography 40

Review of Current Knowledge
4
Figures Page
.
1 Global Plastic production from 1950 to 2014 and estimated future trends to 2050
7
2 Polymer types, symbols used to identify them, and examples their uses
10
3 Principal types of waste plastics
11
4 The Indian Government has vowed to clean up the sacred river Ganges
13
5 Plastic waste pathways
15
6 Country sources of waste plastics and ocean storage zones
16
7 Estimated time taken for plastics to degrade
17
8 Pathways of plastic in the marine environment
20
9 The tracks of ocean currents showing the locations of the 5 major gyres
22
10 The fate of floating plastic released in the Severn Estuary after 9 years
22
11 Green sea turtle entangled in debris
24
12 The DPSIR framework in relation to inputs and impacts of plastics and microplastics in the marine environment
28
13 Illustration of OCEANCLEANUP collecting surface plastic
31
14 How the Seabin is deployed from a floating dock
32
15 A Seabin ready for installation
32
16 Bongo nets being deployed from a vessel to sample oceanic plastics
36
Review of Current Knowledge
5
1 Introduction The presence of waste plastic in the surface water environment has developed into a serious problem. It is not only unpleasant, but is a threat to sea birds, aquatic mammals, fish and ultimately to human health. Plastic waste in the marine environment was first reported in the 1970s. However, in early 2018 the BBC TV series Blue Planet II had a major effect on the public consciousness, when the global issue of plastic pollution in the natural world was addressed by the series presenter, Sir David Attenborough. The topic has captured the media and public interest. The debate on what can be done has developed day to day and the issue has rarely been out of the news. Some dramatic and questionable statistics on the amount of plastic in the sea have been published. Among this avalanche of media concern, this ROCK seeks to explore the present problem in the surface waters of the planet and to review information on our behaviour and potential solutions. Plastics production began in the 1940s. These materials have found widespread uses in packaging and manufacturing with inadequate attention to waste control and recycling. Most plastics are not biodegradable and some can take up to centuries to break down. Consequently, contamination of the marine and freshwater environment has been a growing problem. Plastics are both abundant and widespread within the marine and freshwater environment, found in their highest concentrations along coastlines. Ingestion of the small particles which result as products break down (microplastics), has been demonstrated in a range of freshwater and marine organisms, a process which may facilitate the transfer of chemical additives or waterborne pollutants to biota. There is, therefore, concern about the effects of this material in the environment. Figure 1 shows the growth in global plastic production from 1950 to 2014 and estimated future trends to 2050. It must be acknowledged that not all plastics and their uses are “bad”. There are reasonable arguments for their use in packaging to prolong the shelf-life of food products. There are many uses where it protects products effectively. However, plastic packaging has become so ubiquitous that it is being used in many unnecessary ways. It has become a cheap and effective method. One problem is that the disposal of waste has not adapted to the very different properties of plastic. It does not readily break down and is persistent in the environment in ways which more traditional paper-based products are not. Although recycling has improved, the variety of types of plastic waste make a coherent strategy for reuse and methods of processing more difficult. In the UK it is local authorities who have the responsibility for recycling. This has created confusion due to the many different types of plastic waste and the different local approaches. This has led to a lack of coherence between the types of plastics which are accepted in recycling schemes.
Review of Current Knowledge
6
It is suggested that reducing the number of different plastics used, to simplify processing, clearly labelling the recycling type, and a more uniform national approach would help to reduce pollution. Most urgently, it is the globally widespread plastic waste in our waters which is damaging the natural world and which must be addressed to avert environmental catastrophe. There are three basic questions: 1. How much plastic is in the marine environment? 2. What are the impacts of plastics in the marine environment? 3. What is the risk to a particular organism or species from a particular type of
plastic debris? Chapter 2 describes the different types of plastics and their uses. Chapter 3 considers sources of waste plastic and how it gets into the environment. Chapter 4 examines the persistence of plastic in terms of the long periods taken to decay. The movement of waste material and the paths and places it accumulates are described in Chapter 5. Chapter 6 examines the environmental impacts. Potential changes in the way we use and dispose of plastics are discussed in Chapter 7. Chapter 8 considers the knowledge we will need and how this can be acquired. Sources of further information are listed and a bibliography is provided to enable further reading.

Review of Current Knowledge
7
Figure 1 Global Plastic production from 1950 to 2014 and estimated future trends to
2050 Source: Ryan, P.G. (2015) A Brief History of Marine Litter Research. In: M.
Bergmann, L. Gutow and M. Klages (eds.) Marine Anthropogenic Litter. Cham: Springer

Review of Current Knowledge
8
2. Types of plastics and their uses Plastics are polymers which are large molecules made of repeating units of smaller molecules (monomers) that are chemically bound together. A polymer is like a chain in which each link is a monomer. All plastic is made of carbon. Man-made plastic uses carbon derived from oil, while biopolymers or bioplastics use carbon derived from natural materials. Plastics can be divided into two major categories called thermosetting plastics and thermoplastics (Kutz, 2002). Thermosetting or thermoset plastics retain their shapes once cooled and cannot return to their original form. They are hard and durable. They can be used for car parts, aircraft parts and tyres. Examples include polyurethanes, polyesters, epoxy resins and phenolic resins. Thermoplastics are less rigid than thermosets and can soften upon heating and return to their original form. They are easily moulded and extruded into films, fibres and packaging. Examples are polyethylene (PE), polypropylene (PP) and polyvinyl chloride (PVC). In 1941 John Rex Whinfield invented a new polymer when he condensed ethylene glycol with terephthalic acid. The condensate was polyethylene terephthalate (PET or PETE). PET is a thermoplastic that can be drawn into fibres (like Dacron) and films (like Mylar). It is the main plastic in food storage bags and supermarket shopping bags. Polystyrene (Styrofoam) is formed by styrene molecules. The double bond between the CH2 and CH parts of the molecule rearranges to form a bond with adjacent styrene molecules, producing polystyrene. It can form a hard impact-resistant plastic for furniture, cabinets (for computer monitors and TVs), glasses and utensils. When polystyrene is heated, and air blown through the mixture, it forms Styrofoam which is lightweight, mouldable and an excellent insulator. Polyvinyl Chloride (PVC) is a thermoplastic that is formed when vinyl chloride (CH2=CH-Cl) polymerizes. When made, it is brittle, so manufacturers add a plasticizer liquid to make it soft and mouldable. PVC is commonly used for pipes and plumbing because it's durable, can't be corroded and is cheaper than metal pipes. Over long periods of time, however, the plasticizer may leach out of it, rendering it brittle and breakable. Polytetrafluoroethylene (Teflon). Teflon was first made in 1938 by DuPont. It is created by polymerization of tetrafluoroethylene molecules (CF2=CF2). The polymer is stable, heat-resistant, strong, resistant to many chemicals and has a

Review of Current Knowledge
9
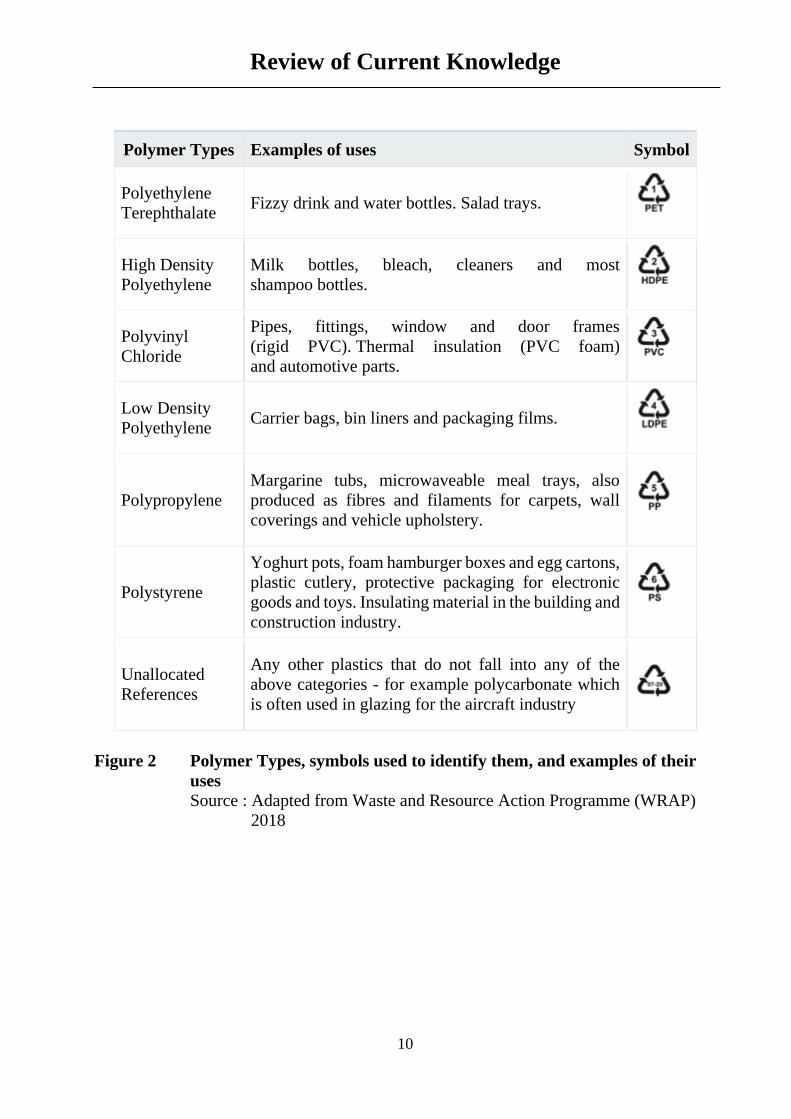
nearly frictionless surface. Teflon is used in plumbing tape, cookware, tubing, waterproof coatings, films and bearings. Polyvinylidine Chloride (PVDC or Saran). Dow makes Saran resins, which are synthesized by polymerization of vinylidine chloride molecules (CH2=CCl2). The polymer can be drawn into films and wraps that are impermeable to food odours. Saran wrap is a popular plastic for packaging foods. Polyethylene, LDPE and HDPE: The most common polymer in plastics is polyethylene, which is made from ethylene monomers (CH2=CH2). The first polyethylene was made in 1934. Today, we call it low-density polyethylene (LDPE) because it will float in a mixture of alcohol and water. In LDPE, the polymer strands are entangled and loosely organized, so it's soft and flexible. It was first used to insulate electrical wires, but today it's used in films, wraps, bottles, disposable gloves and rubbish bags. In the 1950s, Karl Ziegler polymerized ethylene in the presence of various metals. The resulting polyethylene polymer was composed of mostly linear polymers. This linear form produced tighter, denser, more organized structures and is now called high-density polyethylene (HDPE). HDPE is a harder plastic with a higher melting point than LDPE, and it sinks in an alcohol-water mixture. HDPE was first introduced in the hula hoop, but today it is mostly used in containers. Polypropylene (PP). In 1953, Karl Ziegler and Giulio Natta, working independently, prepared polypropylene from propylene monomers (CH2=CHCH3). The various forms of polypropylene have different melting points and hardnesses. Polypropylene is used in car trim, battery cases, bottles, tubes, filaments and bags. Figure 2 lists the standard plastic types and their identifying symbols often found on the respective products.
Review of Current Knowledge
10
Figure 2 Polymer Types, symbols used to identify them, and examples of their uses Source : Adapted from Waste and Resource Action Programme (WRAP) 2018
Polymer Types Examples of uses Symbol
Polyethylene Terephthalate
Fizzy drink and water bottles. Salad trays.
High Density Polyethylene
Milk bottles, bleach, cleaners and most shampoo bottles.
Polyvinyl Chloride
Pipes, fittings, window and door frames (rigid PVC). Thermal insulation (PVC foam) and automotive parts.
Low Density Polyethylene
Carrier bags, bin liners and packaging films.
Polypropylene Margarine tubs, microwaveable meal trays, also produced as fibres and filaments for carpets, wall coverings and vehicle upholstery.
Polystyrene
Yoghurt pots, foam hamburger boxes and egg cartons, plastic cutlery, protective packaging for electronic goods and toys. Insulating material in the building and construction industry.
Unallocated References
Any other plastics that do not fall into any of the above categories - for example polycarbonate which is often used in glazing for the aircraft industry

Review of Current Knowledge
11
3 Sources of plastic waste 3.1 How plastic enters the environment The low cost, the ready availability, and myriad of uses of plastics in everyday items and in packaging have led to the proliferation of consumer waste. In developing countries where many commodities are relatively expensive compared to income, the supply of goods in small quantities in plastic sachets has become the norm. However, this has not been accompanied by good waste management practices. Consequently, much of the discarded plastic is disposed of carelessly and ends up in waterways. Figure 3 indicates for a global perspective the contributions of various types of waste plastics. More than 80 percent of the annual input of plastic litter, such as drink bottles and plastic packaging, comes from land-based sources. The remainder comes from plastics released at sea, such as lost and discarded fishing gear.
Figure 3 Principal types of waste plastics Source: BilkulOnline.
Vehicle tyres are a significant problem, releasing 270 thousand tonnes of debris into global waterways annually. The tiny non-biodegradable pieces of plastic from

Review of Current Knowledge
12
tyres are a cause for concern as they are ingested by plankton and juvenile fish and work their way up the food chain. Microplastics have been found in ice cores, across the seafloor, vertically throughout the ocean and on every beach worldwide. EcoWatch has pointed out that microplastics are also very absorbent, meaning they pick up the chemicals they float in. The most visible waste is macroplastic (generally greater than 1mm) which breaks down to smaller sizes (microplastics), making the problem of management even more difficult. The issue of microplastics in freshwater systems has been covered in an associated ROCK. Readers are referred to this publication to complement the descriptions here. See Microplastics in the Freshwater Environment FR/R0027, October 2017. Eunomia Research and Consulting ( http://www.eunomia.co.uk ) has produced an estimate of annual global emissions of "primary" microplastics, such as microbeads, fibres or pellets. "Secondary" microplastics are the result of larger pieces of plastic breaking down into smaller pieces. It calculated that emissions of microplastics range from 0.5 to 1.4 million tonnes per year, with a medium estimate of 0.95 million tonnes. 3.2 The major river sources of waste plastics Transport of plastics by rivers is a potential mechanism that connects plastic debris generated on land with the marine environment. Plastic loads in rivers are directly related to mis-managed plastic waste. Population size and the quality of waste management systems largely determine which countries contribute the greatest mass of uncaptured waste available to become plastic marine debris. (Jambeck et al., 2015). It has been estimated that about 90 percent of the plastic polluting our oceans comes from just ten rivers (Schmidt et al., 2017). Eight of these rivers are in Asia, while the remaining two, the Nile and the Niger, are in Africa. These river catchments are in countries with large populations and high economic growth but a poor waste infrastructure. Without waste management infrastructure improvements, the cumulative quantity of plastic waste available to enter the ocean from land is predicted to increase by an order of magnitude by 2025. Of the total waste generated within river catchments, only a small fraction of about 0.05 % has been found to be mobile in rivers. This suggests that a substantial fraction of plastic debris accumulates in river systems. The view in Figure 4 below has become a common sight in developing countries.

Review of Current Knowledge
13
Figure 4 The Indian government has vowed to clean up the sacred river Ganges. Source: REUTERS/Rupak De Chowdhuri The biggest offenders are two of the largest rivers in the world. The Yangtze and the Ganges carry over 900,000 tons of plastic between them to the ocean every year. By comparison, the Thames dumps 19 tons of plastic into the sea annually. It is estimated that between 4m and 12m metric tonnes of plastic makes its way into the ocean each year. This is likely to rise, and it has been suggested that by 2050 the amount of plastic in the sea will outweigh the amount of fish. The Indus and the Ganges, which flow through India, carry the second and sixth highest amounts of plastic debris to the ocean. In 2011 the Indian government launched the Namami Gange project in a bid to clean the Ganges, but recently the National Green Tribunal, India’s dedicated environmental court, said that “not a single drop of the Ganga has been cleaned so far”. At the United Nations Environment Assembly in December 2017, India along with 193 other nations, signed a resolution to reduce marine plastic waste. In 2010, the National Green Tribunal Act of the Indian parliament introduced a ban on disposable plastics in Delhi, while non-biodegradable plastic bags are banned in many states. It is claimed that halving the plastic input from the catchment areas of these rivers would already be a major success (Schmidt et al., 2017). To achieve this, it will be necessary to improve the waste management and raise public awareness for the issue. It is hoped that the Indian study will contribute to positive development so

Review of Current Knowledge
14
that the plastic problem in our oceans can be curbed in the long run. While it would be practically impossible to clean up the damage already done, tackling the sources of pollution along these rivers could see overall plastic pollution from rivers almost halved. It is claimed in that reducing plastic loads by 50 percent in the 10 top-ranked rivers this would reduce the total river-based load to the sea by 45 percent. Analysis reveals that plastic loads of large rivers disproportionately increase in relation to the increase of plastic debris available for transport. 3.3 Interaction of plastics in rivers and coasts with the oceans Eunomia have compiled a report ( http://www.eunomia.co.uk/reports-tools/plastics-in-the-marine-environment/ ) of their research. The report shows that 94 percent of the plastic that enters the ocean ends up on the ocean floor, with an estimated average of 70 kilograms of plastic per square kilometre of sea bed. Figure 5 demonstrates the sources and fates of plastics. The report highlights a common misunderstanding in which ocean plastic is often portrayed as a rubbish patch about the size of France floating in the middle of the ocean. Despite the high profile of projects intended to clean up plastics floating in mid-ocean, relatively little actually ends up there. Only 1% of marine plastics are found floating at or near the ocean surface, with an average global concentration of less than 1kg/km2. This concentration increases at certain mid-ocean locations, with the highest concentration recorded in the North Pacific Gyre at 18kg/km2. By contrast, the amount estimated to be on beaches globally is five times greater, and importantly, the concentration is much higher, at 2,000kg/km2. While some may have been dropped directly, and other plastics may have been washed up, what is clear is that there is a "flux" of litter between beaches and the sea. By removing beach litter, we are therefore cleaning the oceans.

Review
of Cu
rrent K
now
ledge
15
Figure 5 Plastic waste pathways Source: Reproduced with the permission of Eunomia Consultants
Review of Current Knowledge
16
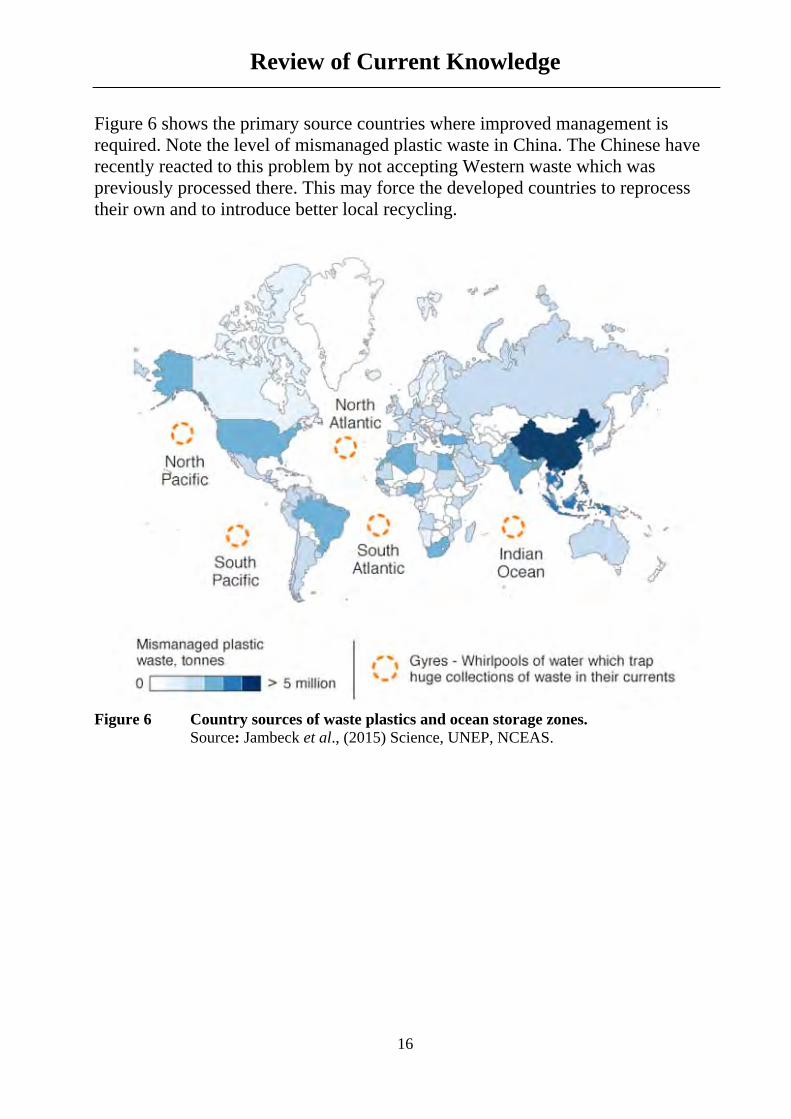
Figure 6 shows the primary source countries where improved management is required. Note the level of mismanaged plastic waste in China. The Chinese have recently reacted to this problem by not accepting Western waste which was previously processed there. This may force the developed countries to reprocess their own and to introduce better local recycling.
Figure 6 Country sources of waste plastics and ocean storage zones. Source: Jambeck et al., (2015) Science, UNEP, NCEAS.

Review of Current Knowledge
17
4 How persistent is plastic in the environment? A normal plastic bottle takes about 450 years to break down completely, so the components of a bottle dropped in the ocean today could still be polluting the waters for 16 generations. Plastic bags can take 20 years to decompose and fishing line, 600 years; but in fact, no one really knows how long plastics will remain in the ocean (See Figure 7). With exposure to UV rays and the ocean environment, plastic breaks down into smaller and smaller fragments and some proportion eventually to nanoplastics of 100 nanometres or less (Microplastics in the Freshwater Environment, FWR (2017). Plastic waste has accumulated in the oceans since mass production began in the 1940s. Some of it was just dumped from ships, as international agreements banning the waste disposal at sea only came into force in 1988. Today, however, experts estimate that most of the waste found in the oceans, whether it is washed up on their shores or spiralling in their gyres, comes from land-based sources. For instance, winds blow litter from the shores into the sea, and rivers also deliver much of the waste load that ends up in the oceans. The delivery of plastic waste from the erosion of coastal landfill sites could continue for centuries, exacerbated by sea level rise.
Figure 7 Estimated time taken for plastics to biodegrade (years) Source: NOAA/ WOODS HOLE SEA GRANT
As stated previously a lot of plastic debris in the ocean breaks down into smaller pieces and is ingested by marine life, and it is thought that a significant amount sinks to the sea bed. Bottles and plastic bags drifting around on the oceans may be unsightly and disturb marine ecosystems but more and more research suggests that the visible pollution is only the tip of a vast iceberg of invisibly small plastic particles (FWR, 2017). Studies by the National Oceanic and Atmospheric Administration (NOAA) of the plastic content of zooplankton samples collected in ecosystem surveys off the Pacific coast of the US found that plastic waste was
Plastic bags Foamed plastic cups
Aluminium drinks cans Straws
Nappies Plastic bottles
Six-pack beer holders Fishing lines

Review of Current Knowledge
18
ubiquitous, with product fragments in the size range below 2.5 mm being the most abundant kind (Doyle et al., 2011). These fragments are believed to arise from the slow degradation of larger plastic debris items through the influence of sunlight and oxygen. Other categories of small plastic particles include pellets used for production of plastic goods, and grains included in cosmetic or cleaning products as abrasives.

Review of Current Knowledge
19
5 The transport and spread of plastic pollution 5.1 Plastic waste pathways – a mass balance To address the movement of plastic in the oceans it is useful to consider amounts in a mass balance exercise (Figure 8) in a similar way to how carbon budgeting has been carried out since the 1990s to uncover the “missing sink” of anthropogenic carbon dioxide (Law, 2017). The mass balance can be evaluated using two approaches: first, assessing the plastic inputs into and outputs from the marine environment as a whole and second, quantifying the standing stock of plastics in major marine reservoirs. Of course, reliance on our knowledge of the present amounts alone is a gross oversimplification of time-dependent processes, ignoring the flux of plastics between accumulation zones as well as their transformation within those zones. In addition, the term plastics refers to a broad collection of synthetic materials that is further diversified by innumerable combinations of chemical additives; thus, their behaviour upon entering the marine environment is not easily generalised. However, the simple box model shown in Figure 8 provides a useful starting point to evaluate available information and to highlight major gaps in data or understanding. In this mass balance of plastics in the marine environment the arrows indicate fluxes into and out of the marine environment, including potential biodegradation of plastics. The boxes indicate storage zones of plastic debris, and the black arrows indicate potential pathways of plastics between these zones. Fragmentation of plastics caused by weathering and biological processes can occur in all areas, especially when exposed to sunlight (at the sea surface and along coastlines).

Review of Current Knowledge
20
Figure 8 Pathways of plastic in the marine environment Source:Law, K.L., 2017 5.2 Transport of plastic Oceanographer Erik van Sebille of Imperial College London, and Utrecht University in the Netherlands, (van Sebille E. et al., 2012) has shown that thanks to strong ocean currents known as gyres, huge amounts of plastic end up in six “garbage patches” around the world, the largest one being in the north Pacific. However, a large proportion of it simply floats around, and thanks to sophisticated modelling of ocean currents using drifting buoys, we can see where much of it ends up. The winds, ocean tides and temperature and salinity gradients drive various types of currents. The larger and more permanent currents make up the systems of currents known as gyres. There are different scales of currents, such as eddies, whirlpools, or deep ocean currents. Larger, sustained currents such as the Gulf Stream are very important drivers of local climate. There are five major gyres: the

Review of Current Knowledge
21
North and South Pacific Subtropical Gyres, the North and South Atlantic Subtropical Gyres, and the Indian Ocean Subtropical Gyre. In some instances, the term “gyre” is used to refer to the collections of plastic waste and other debris found in higher concentrations in certain parts of the ocean. While this use of "gyre" is increasingly common, the term traditionally refers simply to large, rotating ocean currents. As can be seen in Figure 9, which shows the tracks of the ocean currents, a bottle dropped in the water off the coast of China, near Shanghai, is likely be carried eastward by the north Pacific gyre and end up circulating a few hundred miles off the coast of the US. A bottle dropped off the Mexican coast, near Acapulco, is likely to be caught in the same gyre. Some of the plastic waste drifts south, but a huge amount is swept west towards Asia before floating north and ending up in the same area – the so-called Great Pacific Garbage Patch. The North Atlantic is home to another powerful current. The image suggests that plastic debris that enters the ocean around New York initially heads towards Europe, with concentration in the Bay of Biscay and, to a lesser extent, the North Sea, but, in fact, most of it is trapped by the current and ends up floating in the middle of the ocean. India is one of the world’s biggest plastic polluters, creating more than 15,000 tonnes of plastic waste a day. The plastic waste that enters the water around Mumbai is likely to end up either being caught in the Indian Ocean gyre and floating close to Madagascar, or being swept east and into the Bay of Bengal, one of the worst places in the world for plastic pollution. It’s a similar story in the UK. A bottle dropped in the sea off the south coast of Cornwall may well be dragged through the channel towards Scandinavia, but the greatest concentrations are again in the Bay of Biscay and the western North Atlantic. Figure 10 shows the potential destinations of a plastic bottle dropped in the Severn Estuary. This graphic can be viewed at http://www.plasticadrift.org/ where an online model permits the tracking of floating material from any chosen location. This is a useful and easy way of understanding the consequences of local careless disposal. Currents don’t just move water. They move people and goods, as well as pollution and debris. To better understand how currents move people and things, NOAA (National Oceanic and Atmospheric Administration) collects and shares data on

Review of Current Knowledge
22
tides and currents. These data guide safe navigation of coastal waters, search and rescue operations, disaster clean up, and design of coastal development projects.
Figure 9 The tracks of ocean currents showing the locations of the 5 major gyres. Source: National Oceanic and Atmospheric Administration.
Figure 10 The fate of floating plastic released in the Severn Estuary after 9 years. Source: van Sebille et al (2012) Environmental Research Letters.
North Pacific Gyre
South Pacific Gyre
North Atlantic Gyre
South Atlantic Gyre

Review of Current Knowledge
23
6 The environmental impact of waste plastics 6.1 Impact in the oceans The amount of plastic in our oceans is killing wildlife and damaging habitats. Ecological problems arise when sea birds mistake plastic items for food. Albatrosses, for example, are known to feed plastic debris to their chicks, often with fatal consequences. The northern fulmar (Fulmarus glacialis), an ocean-foraging bird found on the shores of both the North Atlantic and the North Pacific, accumulates plastics in its stomach to such an extent that it now routinely serves as a biomarker for plastic pollution. Floating debris could also cause ecological havoc in other ways by carrying species to places where they are not native and entangling air-breathing organisms, preventing animals from being able to swim to the surface, causing them to drown (Figure 11). There is concern that these particles may be ingested by organisms such as various zooplankton species in marine pelagic ecosystems and enter the food chain with unknown consequences. While most plastics are assumed to be chemically inert, the small fragments could accumulate environmental toxins, and in some cases, release chemicals used in their production. In order to understand the potential for ingestion of debris particles by such organisms, there is a need for rigorous investigations of particle encounter rates and incidence of ingestion of plastic debris across a wide size spectrum of particles and by a diverse range of zooplankton taxa in different ocean ecosystems. The authors suggest that routine combination of plankton sampling studies with an analysis of plastic particles could help to better understand the scale and implications of the problem, but so far there is still a shortage of data (Doyle et al., 2011). If the plastic doesn’t get eaten, the further fate of plastic microparticles in the oceans is not yet clear. It has been proposed that the further decay leads to plastic nanoparticles in the oceans, which could introduce pollutants into cells by endocytosis. This occurs when a cell is engulfed by the material (Andrady, 2011). So far, very little is known about the abundance of such particles or their possible ecological effects. Investigation into the physical and chemical composition of plastic waste in the oceans is limited. A study of the composition of plastic debris in the western North Atlantic Ocean (Morét-Ferguson et al., 2010) found that more than 88 % of particles were less than 10mm in length and 69 % measuring between 2 and 6 mm. Over time the percentage of smaller sized particles has increased. In the 1990s, 16 % of plastic particles were 10mm or larger, while in a more recent study, only 6 % were 10 mm or larger. This suggests that mechanical abrasion and photochemical breakdown are causing plastic particles to decrease in size.

Review of Current Knowledge
24
Studies indicate the density of plastic particles on coastlines is similar to that of virgin plastics. That is, the plastic had changed little from its original form, whereas at sea the density of plastic particles was greater, indicating a change from its time at sea. This was thought to be due to biomass accumulation on the plastic or biofouling, which is likely to increase the density of the plastic. Data on particle density could help us understand what types of plastics are sinking or floating and the potential impact of plastics on wildlife.
Figure 11 Green sea turtle entangled in debris. Source: Public Domain, NOAA 6.2 Impact in rivers
We are familiar with the shocking plastic-related headlines and imagery that has filled the media channels recently, but a large part of our plastic problem begins upstream. Plastic pollution is frequently described as an ‘ocean epidemic’. Although this is true, plastics are much more than an ocean specific issue. Plastics are everywhere in soil, air and our rivers but for the most part these are overlooked. As noted earlier, around 80% of marine microplastics come from freshwater run-off, meaning there is a whole period where microplastics persist in

Review of Current Knowledge
25
rivers before they are flushed into the ocean. It is important that we stop seeing rivers simply as plastic ‘couriers’ and answer the big question: what impact are these plastic particles having on life in freshwater?
It is already known that there is an energy cost associated with ingestion of microplastics by organisms. That is, plastic consumption affects the survival of freshwater wildlife because it changes their normal behaviour. (https://www.salmon-trout.org/2018/08/31/plastic-rivers/ )
For example, when plastic particles are consumed, they mimic fullness, so animals stop eating and suffer from poor nutrition. There is also potential for ecotoxicological harm, as plastics act like sponges, absorbing chemicals in the water. Once eaten, these chemicals can be released from the plastic into whatever has eaten it, and so forth up the food chain. For salmon and sea trout, we know chemicals in water have a directly negative effect on completion of their life cycles, particularly the phase where they transform to become ready for life at sea. So, it is logical to ask an important question: are these damaging chemicals becoming more available to these fish - and in higher doses - through the ingestion of plastic particles?
Wastewater treatment plants (a large input of microplastics comes from domestic and industrial sources) are currently not designed to remove microplastics effectively, but new filtration options are being discussed.

Review of Current Knowledge
26
7 Potential changes in human behaviour
There is huge scope for positive change, with people and businesses being more aware of their plastic footprints than ever before. From paper straws to reusable cups, every change we make is a win for the water environment. Awareness of the problem is increasing, and advocacy groups, such as Ocean Conservancy, Plastic Pollution Coalition, and 5 Gyres, are working with scientists, politicians, and industry to find viable solutions. Small steps that have been taken include local bans on the most avoidable single-use plastic products like shopping bags and small water bottles. The company Unilever announced that it would phase out the use of plastic particles (‘microbeads’) in its cosmetics products. The website http://www.marinedebrissolutions.com/ lists further measures taken by the industry. Solutions will necessarily require a combination of more scientific research to determine where to best put effort and resources; technological innovations; and public and policy initiatives to reduce, reuse, and recycle so that the flow of plastic to the ocean is stemmed. Finding solutions Many important questions concerning the plastic pollution of the oceans remain unanswered (Law, 2017). For instance, there are no reliable data regarding how much plastic goes into the system, and on what timescale it decays to microplastics. The abundant evidence of the presence of this contaminant in the ocean, combined with a precautionary approach, suggests that we should not wait for the preponderance of evidence before acting to reduce potential threats of plastic debris. So what is to be done to clean up this global mess we created in less than a century? As most of the plastic waste that floats seems to accumulate in gyres, could it be harvested from there systematically? Observers of the Great Pacific Garbage Patch have been sceptical about the possibility of removal. There are zooplankton and other organisms attached to the plastic. If we try to remove the plastic from the ocean, we could simultaneously remove the normal flora and fauna and disrupt the ocean ecosystem. A better option may be to stop more plastic from entering the ocean. Perhaps removal of a significant proportion of the plastic would simply not be feasible in terms of the resources needed. It is not necessarily helpful if the plastic waste is labelled ‘biodegradable’. ‘Biodegradable’ materials are not currently a solution, as most materials are

Review of Current Knowledge
27
designed to degrade in industrial composting facilities, and their behaviour is untested in seawater. Some materials are designed to rapidly break up into small pieces, however the remaining fragments present a larger risk since they are accessible to a larger suite of organisms. 7.1 What are the key drivers of plastic pollution? In the marine environment most litter is plastic, with items of metal, glass and paper being considerably less abundant (Galgani et al., 2010). These trends are consistent worldwide and, as a consequence, the accumulation of plastic litter has been identified as a major global problem by the United Nations Environment Assembly and in the G7 Leader´s declaration 2015 (Werner et al., 2016). While the focus was on the marine environment, freshwater habitats are also contaminated with plastic, and rivers provide major pathways of plastics to the ocean (GESAMP, 2016). The most common polymers, polyethylene (PE), polypropylene (PP), polyvinyl chloride (PVC) polyethylene terephthalate (PET) and polystyrene (PS) can be made into a vast range of inexpensive, light-weight and durable products that bring numerous societal benefits. This has resulted in an exponential increase in global demand, from around 5 million tonnes in the 1950s to over 300 million tonnes today. Current annual demand in the UK is around 37 million tonnes (www.plasticseurope.org). Some applications of plastics have a long service life, such as PVC and PP components in vehicles or the construction industry. However, around 40 per cent of all the plastic produced is used for packaging, which is predominantly single-use. These items are frequently made of PE or PET and represent a substantial proportion of the waste managed via landfill, incineration and recycling (Barnes et al. 2009). Single-use items, together with rope and netting, are also the most abundant types of litter found in the marine environment (Ocean Conservancy 2017; see Nelms et al., 2017). Interactions between society and the environment can be described and summarised using the Driver-Pressure-State-Impact-Response (DPSIR) framework (Figure 12). In this regard, an overriding Driver, leading to accumulation of litter is the demand for plastic items. These include items used in a range of applications, for example in transport, construction and packaging. The associated waste, which is dominated by single-use items, puts Pressure on waste management systems. Evidence shows that a combination of ineffective waste capture and ineffective sewage treatment, together with product designs that do not reflect end-of-life scenarios and littering behaviour, all contribute to the release of plastics to the environment. Since plastics are persistent, they are accumulating, leading to the current State of environmental contamination and this leads to a wide range of Impacts. In this context, waste can

Review of Current Knowledge
28
be defined as something of little or no value and hence the problem may be exacerbated by the inexpensive nature of most plastics, which facilitates short-lived applications and can also present an obstacle to the viability of recycling; which is one of the potential solutions or Responses that could help reduce the accumulation of plastics.
Figure 12 The DPSIR framework in relation to inputs and impacts of plastics and microplastics in the marine environment Source: Modified from original by Kershaw (ed) in GESAMP, 2015. 7.2 Changes in recycling and uses for waste plastics Public awareness, improved recycling and uses for waste plastics are clearly ways in which the amount of plastic waste in the environment can be reduced. More careful and essential commercial use of plastic wrapping and containers would also reduce waste, which a proportion of inevitably ends up in waterways and the oceans. The following specific behaviours may help to control the problem. There is a great deal of media discussion about better recycling; using fewer plastic types to simplify recycling and incentives, taxes, and education. (Poortinga, et al., 2016).
Review of Current Knowledge
29
7.3 What can we do to clean up this mess? Reduce use of single-use plastics Single-use plastics include plastic bags, water bottles, straws, cups, utensils, dry cleaning bags, take-away containers, and any other plastic items that are used once and then discarded. This can be done by refusing any single-use plastics that you do not need (e.g. straws, plastic bags, takeaway utensils), purchasing, and carrying with you, reusable versions of those products, including reusable supermarket bags, bottles, utensils, coffee cups, and dry cleaning bags. A UK levy of 5p per bag introduced in 2015 has already reduced single-use plastic bags given out by major retailers by 85% – down from 140 to 25 bags for the average person each year, (WRAP, 2014). Plastic “ear buds” have become well known as a public health hazard. Some have never been near ears. The governments in Scotland and England have announced plans to ban them. Recycle and improve recycling instructions. When you use single-use (and other) plastics that can be recycled, always be sure to recycle them. This helps keep them out of the ocean and reduces the amount of “new” plastic in circulation. We know the basics: tins, glass and paper but plastic film is uncertain. We use more than a million tonnes of plastic film per annum, most of which isn’t recycled. What about those trays that fish comes in, with no information on them? Manufacturers and retailers should be encouraged to label every piece of packaging, including lids and fastenings so we know what to do with them. Each council collects their plastic recycling differently. BBC analysis shows there are 39 different sets of rules for what can be put in plastic recycling collections. Homogenisation is required to improve recycling rates. Landfill practice needs to be improved to prevent plastic waste from getting into watercourses or coastal water. Reduce single-use plastics Plastic forks are more ubiquitous than ever, as salads and other non-hand-held lunch options proliferate. Biodegradable alternatives or reusable ones should be encouraged. The government has announced a deposit return scheme for plastic bottles (in a reverse vending machine), and the Glastonbury festival has announced a ban. We need to go further, faster. Drinking fountains must become the standard in public and private places. Plastic cups, including coffee cups should be reusable or biodegradable. Biodegradable means that the product may be broken down by living organisms, such as bacteria and fungi (eventually becoming wholly or partly mineralized to CO2 and water). In fact, a polymer can only be legitimately termed biodegradable when it passes a composting test under standard conditions and within a set timeframe. However, such conditions are not found in the environment

Review of Current Knowledge
30
at large and such polymers therefore do not biodegrade to any significant extent under natural conditions; this includes the marine environment. Participate in a Beach or River Clean-up Help remove plastics from rivers and beaches and prevent them from getting there in the first place by participating in, or organizing, a clean-up of your local beach or waterway. This could be one of the most direct ways to reduce ocean plastic pollution. Support Bans Many local authorities around the world have enacted bans on single use plastic bags, take-away containers, and bottles. Avoid Microbeads The tiny plastic particles, called “microbeads” have become a growing source of water plastic pollution in recent years. Microbeads are found in some face scrubs, toothpastes, and bodywashes, and they readily enter our oceans and waterways through our sewer systems, affecting hundreds of marine species. Avoid products containing plastic microbeads by looking for “polyethylene” and “polypropylene” on the ingredient labels of your cosmetic products. (See a list of products: http://www.beatthemicrobead.org/product-lists/ ) Spread the Word Stay informed on issues related to plastic pollution and help make others aware of the problem. There are many non-profit organizations working to tackle the problem of river and ocean plastic pollution in a variety of different ways. Blue Planet’s footage of albatross nests full of rubbish may have been (literally) the last plastic straw for public indifference. It must be emphasized that globally 2 million plastic bags and 1 million plastic bottles are bought per minute. The fishing industry loses 1 million tonnes of plastic gear per annum (see https://www.statista.com for some general statistical information.). A return to the use of hemp for nets should be examined. 7.4 Examples of innovative clean-up methods Prevention of the waste problem by recycling is obviously an important strategy. However, given the problem of large quantities of waste plastics at sea, methods of collecting this material are being implemented.

Review of Current Knowledge
31
The Ocean Cleanup system 101. The Ocean Cleanup is a passive system, using the natural oceanic forces to catch and concentrate the plastic. The frontispiece shows this system being launched in the Pacific. Both the plastic and system are carried by the current. However, wind and waves propel only the system, as the floater sits just above the water surface, while the plastic is primarily just beneath it. The system thus moves faster than the plastic, allowing the plastic to be captured. This system has been deployed as shown in Figure 13 to attempt to clean half the Great Pacific Garbage Patch in a decade (https://www.theoceancleanup.com/).
Figure 13 Illustration of OCEANCLEANUP collecting surface plastic Source: Permission of Oceancleanup North Pacific Foundation The Seabin Project At a more local level the Seabin is a floating rubbish bin that is located in the water at marinas, docks, yacht clubs and commercial ports. The Seabin moves up and down with the range of tide collecting floating rubbish. Water is sucked in from the surface and passes through a catch bag inside the Seabin, with a submersible water pump, capable of displacing 25.000 litres per hour plugged directly into a 110/220 V outlet. The water is then pumped back into the marina leaving litter and debris trapped in the catch bag to be disposed of properly. The Seabin also has the potential to collect a proportion of oils and pollutants floating on the water surface. The diagram in Figure 14 shows how this device is located on a floating marina and Figure 15 shows an example ready for deployment.

Review of Current Knowledge
32
Figure 14 How the Seabin is deployed from a floating dock Source: Permission of The Seabin Project (https://www.seabinproject.com/ ) Figure 15 A Seabin ready for installation Source: Permission of The Seabin Project (https://www.seabinproject.com/ )

Review of Current Knowledge
33
8 Future concerns Almost all research on plastic contamination in water systems focuses on oceans. However, a major problem is plastic in freshwater ecosystems, according to a Norwegian University of Science and Technology (NTNU) biologist (Wagner et al., 2014). It must be remembered that this impact extends well beyond the marine environment. In fact, most plastic pollution begins in our rivers, where it will also be having an impact - one that often seems overlooked. New research is being commissioned and investigations are being made into understanding and controlling the freshwater element of plastic pollution. The Foundation for Water Research ROCK on Microplastics in the Freshwater Environment deals with this aspect. This chapter therefore concentrates on ocean concerns. 8.1 Key future research areas for scientists and policymakers While the visual impact of waste plastic on beaches, on surface water in rivers and on the ocean is obvious and some knowledge of the sources and quantities are understood, there are many aspects of the problem which remain to be investigated. Better information is required by labelling plastic products to enable improved consumer choices. The main research issues can be summarised as:
1) measurement of plastic contamination; 2) risks to the environment and humans; 3) toxic chemicals in plastic waste; 4) mitigation of the effects of plastic waste and removal from the rivers and
oceans.
Researchers now plan to study how long plastic takes to get to the sea once in the river, which is key to working out how best to prevent it. Some difficulties and ambitions with this research are expanded in the following: The marine surface - monitoring plastic waste floating at sea. Surveys at sea are more expensive and challenging than beach surveys and can only assess standing (or floating) quantities rather than accumulation rates because it is impossible to perform a complete clean-up. Amounts of floating debris can be estimated either by direct observation or by net trawls. Most observation surveys are conducted from ships or small boats. Aerial surveys have also been used which have the advantage of covering large areas but the disadvantage of only detecting large items of waste (Ryan et al., 2009). In 2008, an assessment prepared by MED

Review of Current Knowledge
34
POL (the marine pollution assessment and control component of the Mediterranean Action Plan) reported finding 2.1 items of general debris per km2 floating in the Mediterranean Sea (observation with binoculars) and 83 per cent of this waste was plastic (Cheshire et al.,2009). All observation surveys suffer discrepancies between individual observers (inter-observer variability), but variability can also occur for other reasons, such as meteorological conditions, ocean currents and the constant movement of plastic waste. For example, in a visual survey of general debris conducted in the north-western Mediterranean 15-25 items per km2 were reported in 1997, and just 1.5-3 items per km2 were reported in 2000 (Aliani et al., 2003). In general, net-based surveys tend to be less subjective. Most research has been done using Neuston or Manta trawl nets, which have a small mesh (usually 0.3mm), and small net opening and thus focus on microplastics. Manta trawls have been used to sample and characterise the large gyre systems in the oceans with elevated amounts of clustered marine litter (Pichel et al., 2007). One of the most well-known research programmes that use this method is the Algalita Centre, which regularly monitors the North Pacific Subtropical Gyre (see Figure 9). Monitoring plastic debris in rivers and estuaries Studying plastic waste in rivers and estuaries could prove useful in trying to identify sources. Browne et al. (2010) investigated the composition of plastic debris on the banks of a UK estuary from both the surface and the underlying 3cm of sediment. Microplastic (less than 1mm) accounted for 65 per cent of debris and mainly (80 per cent) consisted of the denser plastics such as PVC, polyester and polyamide. Macroplastics tended to be less dense. There are a number of possible explanations for this. For example, it could be that denser plastics are more likely to suffer weathering as they are in contact with abrasive particles in sediment, or it could be that denser microplastics are easier to distinguish from the sediment so appear to be more abundant. The research found a larger amount of microplastics at the more exposed sites towards the mouth of the estuary where debris is likely to experience strong wave action and abrasion. Another possible source is the discharge from sewage treatment, as domestic laundry acts a source of fibres or microplastics. The consumer needs to be informed about which clothing products produce microplastic fibres when washed. Strong currents in large rivers may transport litter offshore while in the smaller rivers, where currents are weaker, the litter tends to become beached in the estuaries. As existing research indicates, there is much speculation about the reasons for the composition and distribution of plastic debris and much still needs to be done on the major influences to identify where policy can be effective. More systematic monitoring could provide a picture of how much debris is being

Review of Current Knowledge
35
transported by rivers, which in turn could provide a baseline to support decisions by policymakers on how to prevent plastic entering rivers. Monitoring plastic waste in the water column and on the seafloor Most studies tend to sample floating plastic debris, but it is also important to monitor suspended plastic and plastic on the seabed. Bongo nets (used for plankton sampling. See Figure 16) can be used to sample suspended debris, while trawl surveys, scuba diver surveys, and submarine vehicles can be used to sample plastic waste on the sea bottom. Data from ‘Fishing for Litter’ activities organised by national governments in the Netherlands, Scotland, England and Wales found that plastic made up a large percentage of marine litter on the seabed. For example, in Scotland 55 per cent of the 3464 items of marine litter recovered (which made up 117 tonnes in weight) were plastic (KIMO, 2008). Plastic Waste: Ecological and Human Health Impacts There are knowledge gaps concerning exposure levels to chemicals associated with plastic waste. Better understanding is needed of the impact of chemicals associated with plastic waste on the environment and human health. This would include the differential impacts of chemicals on different forms of wildlife. Better understanding is needed of the biological mechanisms involved in the exposure of humans and animals to chemicals associated with plastic waste and the transfer of chemicals into biological systems. In terms of management, it would be useful to identify the sources and routes by which wildlife and humans are exposed to chemicals in plastic waste. If possible, some kind of identification of which plastics transfer contaminants and which contaminants are most likely to be adsorbed and transferred. This would include more land-based research on plastic waste and research on chemicals in landfills, particularly measuring level of additives leached into the environment (Oehlmann et al., 2009).

Review of Current Knowledge
36
Figure 16 Bongo nets being deployed from a vessel to sample oceanic plastics Source: NOAA Policy research There are a number of research gaps that need to be addressed to provide a stronger evidence-base on which to develop policy. Some of these are at the detailed level of impact, such as the actual levels of chemical exposure caused by plastic waste. Others are more action-orientated, for example, identifying potential hotspots where plastic waste is problematic, identifying high-risk products that use plastic or identifying wildlife and human groups that are more vulnerable to the impacts of plastic waste. However, the very nature of plastic waste as a fluctuating and mobile issue means that science is unlikely to be able to answer all the questions. It may be preferable to take policy action before waiting for a completely clear research picture to emerge to avoid the risk of impacts worsening and becoming more difficult to manage in the future. (See http://ec.europa.eu/environment/integration/research/newsalert/pdf/IR1_en.pdf).

Review of Current Knowledge
37
9 Sources of further information (All websites accessed on 10/11/2018) https://www.ceh.ac.uk/get-involved/ceh-newsletter-mailing-list Centre for Ecology and Hydrology Newsletter and further information on microplastics. http://www.beatthemicrobead.org/ProductTable.php?colour=2&country=GB&language=EN Cosmetics containing microplastics can harm the ocean. This is a list of products containing microbeads. https://www.oceanicsociety.org/blog/1720/7-ways-to-reduce-ocean-plastic-pollution-today The Oceanic Society, PO Box 844, Ross California CA 94957, USA. https://www.bbc.co.uk/news/science-environment-42264788 Seven charts that explain the plastic pollution problem. www.bpf.co.uk/packaging/environment.aspx Presents the positive case for the use of plastics. http://plastic-pollution.org/ Santa Aguila Foundation, PO Box 5006, Santa Barbara, California, 93150, USA. https://www.sas.org.uk/our-work/plastic-pollution/plastic-pollution-facts-figures/ Surfers against sewage. https://www.theguardian.com/environment/2017/jun/28/a-million-a-minute-worlds-plastic-bottle-binge-as-dangerous-as-climate-change The Guardian http://www.eunomia.co.uk/ Specialist, independent consultants concerned with the environment. https://www.ecowatch.com/80-of-ocean-plastic-comes-from-land-based-sources-new-report-finds-1891173457.html EcoWatch is an environmental news site. https://www.theguardian.com/environment/ng-interactive/2018/apr/18/the-great-australian-garbage-map-75-of-beach-rubbish-made-of-plastic Data on Australian coastal pollution.

Review of Current Knowledge
38
https://www.greenfacts.org/en/marine-litter/l-3/2-kinds-of-plastic-waste.htm Digest on plastic in the environment. https://www.britannica.com/science/plastic-pollution Encyclopaedia Britannica entry on plastic pollution. www.bpf.co.uk/plastipedia/Default.aspx Commercial information on plastic types and uses. https://www.lifewithoutplastic.com/store/common_plastics_no_1_to_no_7#.W-W5NfZ2uUm Alternatives to plastic in everyday life. http://2016.igem.org/Team:KoreaSonyeodul/HP/Silver Views of a private sponsored interest group.
https://science.howstuffworks.com/plastic4.htm and https://science.howstuffworks.com/plastic2.htm Information on how plastics work. https://granthaminstitute.com/2015/09/08/where-can-we-best-tackle-the-ocean-plastics-problem/ Blog run by the Grantham Institute - Climate Change and the Environment. An Institute of Imperial College London. www.wrap.org.uk/ WRAP works with governments, businesses and communities to deliver practical solutions to improve resource efficiency. https://www.abc.net.au/news/science/2017-02-27/plastic-and-plastic-waste-explained/8301316 An Australian media perspective. https://www.ncl.ac.uk/press/articles/latest/2018/09/plastics/ Work at Newcastle University. https://www.theoceancleanup.com/technology/ The Ocean Cleanup technologies to rid the world's oceans of plastic. https://www.seabinproject.com/ A rubbish collector for marinas and harbours. https://www.darrinqualman.com/global-plastics-production/ Information on global plastic production.

Review of Current Knowledge
39
https://oceanservice.noaa.gov/hazards/marinedebris/plastics-in-the-ocean.html US agency information on plastics in the ocean. The oceanservice website is a very wide and useful source on ocean research. http://ec.europa.eu/environment/integration/research/newsalert/pdf/IR1_en.pdf Science for Environment Policy, In-depth Reports, Plastic Waste: Ecological and Human Health Impacts, November 2011. https://orca.cf.ac.uk/94652/1/Cardiff_University_Plastic_Bag_Report_A4%20%28final%20proof%29.pdf Poortinga, W. Sautkina, E. Thomas, G.O, and Wolstenholme, E. (2016). The English plastic bag charge: Changes in attitudes and behaviour. Cardiff : Welsh School of Architecture/School of Psychology, Cardiff University. https://marinedebris.noaa.gov/sites/default/files/publications-files/2015_TurningTideonTrash_HiRes_Final.pdf A learning guide on marine debris. https://www.salmon-trout.org/2018/08/31/plastic-rivers/ A perspective on rivers from Salmon and Trout Scotland. https://www.marinelittersolutions.com/about-us/countries/united-states/ Potentially workable solutions for the oceans. http://rstb.royalsocietypublishing.org/content/364/1526/2027 Transport and release of chemicals from plastics to the environment and to wildlife. https://library.wur.nl/WebQuery/wurpubs/fulltext/174619 Marine Strategy Framework Directive Task Group 10 Report Marine litter, April 2010. https://www.plasticseurope.org/application/files/3715/1689/8308/2015plastics_the_facts_14122015.pdf Plastics Association data. https://oceanconservancy.org/wp-content/uploads/2017/06/International-Coastal-Cleanup_2017-Report.pdf International plastic clean up data. http://web.unep.org/unepmap/mediterranean-action-plan-barcelona-convention-convention-protection-marine-environment-and-0 UN Mediterranean Action Plan.
Review of Current Knowledge
40
References / Bibliography Aliani, S., Griffa, A. and Molcard, A. (2003) Floating debris in the Ligurian Sea, north-western Mediterranean. Marine Pollution Bulletin, Vol. 46, Issue 9, pp. 1142-1149. Andrady, A.L. (2011) Microplastics in the marine environment. Marine Pollution Bulletin 62, pp.1596–1605. Barnes, D.K.A., Galgani, F., Thompson, R.C. and Barlaz, M. (2009) Accumulation and fragmentation of plastic debris in global environments. Phil. Trans. R. Soc. B., DOI: 10.1098/rstb.2008.0205 Browne M.A., Galloway T.S. and Thompson R.C. (2010) Spatial patterns of plastic debris along estuarine shorelines. Environ Sci Technol. 2010 May 1;44(9):3404-9. DOI: 10.1021/es903784e. Cheshire, A.C., Adler, E., Barbière, J., Cohen, Y., Evans, S., Jarayabhand, S., Jeftic, L., Jung, R.T., Kinsey, S., Kusui, E.T., Lavine, I., Manyara, P., Oosterbaan, L., Pereira, M.A., Sheavly, S., Tkalin, A., Varadarajan, S., Wenneker, B. and Westphalen, G. (2009) Guidelines on survey and monitoring of marine litter. UNEP Regional Seas Reports and Studies, No. 186; IOC, Technical Series No. 83: xii + 120 pp. Doyle, M.J., Watson, W., Bowlin, N.M. and Sheavly, S.B. (2011) Plastic particles in coastal pelagic ecosystems of the northeast Pacific ocean. Marine Environmental Research, Volume 71, Issue 1, February 2011, pp. 41-52. Foundation for Water Research (2017) Microplastics in the freshwater environment. FR/R0027, October 2017. Galgani, F., Fleet, D., van Franeker, J.A., Katsanevakis, S., Maes, T., Mouat, J., Oosterbaan, L., Poitou, I., Hanke, G., Thompson, R., Amato, E., Birkun, A. and Janssen, C. (2010) Marine Strategy Framework directive - Task Group 10 Marine litter. Luxembourg: Office for Official Publications of the European Communities. GESAMP (2015). Sources, fate and effects of microplastics in the marine environment: a global assessment. (Kershaw, P.J., ed.) (IMO/FAO/UNESCO-IOC/UNIDO/WMO/IAEA/UN/UNEP/UNDP Joint Group of Experts on the Scientific Aspects of Marine Environmental Protection). Rep. Stud. GESAMP No. 90, 96 p. GESAMP (2016) Sources, fate and effects of microplastics in the marine environment: Part 2 of a global assessment. (Kershaw, P.J. and Rochman, C.M., eds.) (IMO/FAO/UNESCO-IOC/UNIDO/WMO/IAEA/UN/ UNEP/UNDP Joint Group of Experts on the Scientific Aspects of Marine Environmental Protection). Rep. Stud. GESAMP No. 93, 220 p.

Review of Current Knowledge
41
Jambeck, J.R., Geyer, R., Wilcox, C., Siegler, T.R., Perryman, M., Andrady, A., Narayan, R. and Law, K.L. (2015) Plastic waste inputs from land into the ocean. Science, Vol. 347, Issue 6223, pp. 768-771. DOI: 10.1126/science.1260352 KIMO (2008) Fishing for Litter Scotland Final Report 2005-2008. Kommunenes Internasjonale Miljøorganisasjon (KIMO). Kutz, M. ed. (2002) Handbook of materials selection. New York: John Wiley & Sons. Law, K.L (2017) Plastics in the marine environment. Annual Review of Marine Science, Vol. 9:1, pp. 205-229. Law, K.L., Morét-Ferguson, S., Maximenko, N.A., Proskurowski, G., Peacock, E.E., Hafner, J. and Reddy, C.M. (2010) Plastic accumulation in the North Atlantic subtropical gyre. Science, Vol. 329, Issue 5996, pp. 1185-1188. DOI: 10.1126/science.1192321 Morét-Ferguson, S., Law, K.L., Proskurowski, G., Murphy, E.K., Peacock, E.E. and Reddy, C.M. (2010) The size, mass, and composition of plastic debris in the western North Atlantic ocean. Marine Pollution Bulletin, Volume 60, Issue 10, pp. 1873-1878. Nelms, S.E., Coombes, C., Foster, L.C., Galloway, T.C., Godley, B.J., Lindeque, P.K. and Witt, M. J. (2017) Marine anthropogenic litter on British beaches: A 10-year nationwide assessment using citizen science data. Science of the Total Environment, Volume 579, pp. 1399-1409. Oehlmann, J., Schulte-Oehlmann, U., Kloas, W., Jagnytsch, O., Lutz, I., Kusk, K.O., Wollenberger, L., Santos, E.M., Paull, G.C., Van Look, K.J.W. and Tyler, C.R. (2009) A critical analysis of the biological impacts of plasticizers on wildlife. Phil. Trans. R. Soc. B 2009 Jul 27;364(1526):2047-62. DOI: 10.1098/rstb.2008.0242 Ogunola, O.S. and Palanisami, T. (2016) Microplastics in the marine environment: current status, assessment methodologies, impacts and solutions. J Pollut Eff Cont 4:161. DOI:10.4172/2375-4397.1000161 Pichel, W.G, Churnside, J.H., Veenstra, T.S., Foley, D.G., Friedman, K.S., Brainard, R.E., Nicoll, J.B., Zheng, Q. and Clemente-Colón, P. (2007) Marine debris collects within the North Pacific Subtropical Convergence Zone. Mar Pollut Bull., 54(8):1207-11. Epub 2007 Jun 12. Poortinga, W., Sautkina, E., Thomas, G.O. and Wolstenholme, E. (2016) The English plastic bag charge: Changes in attitudes and behaviour. Cardiff: Welsh School of Architecture/School of Psychology, Cardiff University.

Review of Current Knowledge
42
Poortinga, W., Whitmarsh, L. and Suffolk, C. (2013) The introduction of a single-use carrier bag charge in Wales: attitude change and behavioural spillover effects. Journal of Environmental Psychology, 36, 240-247. Ryan, P.G. (2015) A brief history of marine litter research. In: M. Bergmann, L. Gutow and M. Klages (eds.) Marine anthropogenic litter. Cham: Springer Ryan, P.G., Moore, C.J., van Franeker, J.A. and Moloney, C.L. (2009) Monitoring the abundance of plastic debris in the marine environment. Phil. Trans. R. Soc. B, 2009 364(1526):1999-2012. DOI:10.1098/rstb.2008.0207 Schmidt, C., Krauth, T., and Wagner, S. (2017) Export of plastic debris by rivers into the sea. Environmental Science & Technology, 51 (21), 12246-12253. DOI: 10.1021/acs.est.7b02368 Teuten, E.L., Saquing, J.M., Knappe, D.R., Barlaz, M.A., Jonsson, S., Björn, A., Rowland, S.J., Thompson, R.C., Galloway, T.S., Yamashita, R, Ochi, D., Watanuki, Y., Moore, C., Viet, P.H., Tana, T.S., Prudente, M., Boonyatumanond, R., Zakaria, M.P., Akkhavong, K., Ogata, Y., Hirai, H., Iwasa, S., Mizukawa, K., Hagino, Y., Imamura, A., Saha, M. and Takada, H. (2009) Transport and release of chemicals from plastics to the environment and to wildlife. Philos Trans R Soc B, 2009 364(1526):2027-45. DOI: 10.1098/rstb.2008.0284. van Sebille, E, England, M.H. and Froyland, G. (2012) Origin, dynamics and evolution of ocean garbage patches from observed surface drifters. Environmental Research Letters, Volume 7, Number 4. Wagner, M., Scherer, C., Alvarez-Muñoz, D., Brennholt, N., Bourrain, X., Buchinger, S., Fries, E., Grosbois, C., Klasmeier, J., Marti, T., Rodriguez-Mozaz, S., Urbatzka, R., Vethaak, A.D., Winther-Nielsen, M. and Reifferscheid, G. (2014) Microplastics in freshwater ecosystems: what we know and what we need to know. Environmental Sciences Europe, 2014 26:12. DOI: 10.1186/s12302-014-0012-7 Werner, S., Budziak, A., van Franeker, J., Galgani, F., Hanke, G., Maes, T., Matiddi, M., Nilsson, P., Oosterbaan, L., Priestland, E., Thompson, R., Veiga, J. and Vlachogianni, T. (2016) Harm caused by marine litter. MSFD GES TG Marine Litter – Thematic Report. JRC Technical Report. Luxembourg: European Union. WRAP (2014) UK Voluntary Carrier Bag Agreement - 2014 Data. Governments, Retailers and the BRC. [ http://www.wrap.org.uk/category/subject/carrier-bags ] WRAP (2018) Polymer types. www.wwrap.org.uk/cotent/types-plastic