Embed Size (px)
Citation preview
Plasticity of Arabidopsis Root Gravitropism throughout aMultidimensional Condition Space Quantified byAutomated Image Analysis1[W][OA]
Tessa L. Durham Brooks2,3, Nathan D. Miller2, and Edgar P. Spalding*
Department of Botany, University of Wisconsin, Madison, Wisconsin 53706
Plant development is genetically determined but it is also plastic, a fundamental duality that can be investigated providedlarge number of measurements can be made in various conditions. Plasticity of gravitropism in wild-type Arabidopsis(Arabidopsis thaliana) seedling roots was investigated using automated image acquisition and analysis. A bank of computer-controlled charge-coupled device cameras acquired images with high spatiotemporal resolution. Custom image analysisalgorithms extracted time course measurements of tip angle and growth rate. Twenty-two discrete conditions defined byseedling age (2, 3, or 4 d), seed size (extra small, small, medium, or large), and growth medium composition (simple or rich)formed the condition space sampled with 1,216 trials. Computational analyses including dimension reduction by principalcomponents analysis, classification by k-means clustering, and differentiation by wavelet convolution showed distinct responsepatterns within the condition space, i.e. response plasticity. For example, 2-d-old roots (regardless of seed size) displayed aresponse time course similar to those of roots from large seeds (regardless of age). Enriching the growth medium withnutrients suppressed response plasticity along the seed size and age axes, possibly by ameliorating a mineral deficiency,although analysis of seeds did not identify any elements with low levels on a per weight basis. Characterizing relationshipsbetween growth rate and tip swing rate as a function of condition cast gravitropism in a multidimensional response space thatprovides new mechanistic insights as well as conceptually setting the stage for mutational analysis of plasticity in general androot gravitropism in particular.
Plant development is genetically determined, butalso importantly shaped and molded by influencesboth external and internal, and even from the previousgeneration’s life history (Roach and Wulff, 1987;Donohue, 2009). Variation in development due to localconditions, or plasticity, may be especially importantto plants due to their sessile nature (Schlichting, 1986).Understanding the consequences of external factors ongrowth and development is important for basic andpractical reasons (Sultan, 2004). Studying one standardcondition will not produce a satisfactory basic under-standing of how plants grow and develop in a variableenvironment. On the practical side is the design ofscreens for discovery of gene function through mutantanalysis. A mutant phenotype is often the single mostimportant source of information about the altered
gene’s function, but without knowledge of what con-tributes to thewild-type range of responses or behaviors(plasticity) a mutant phenotype may go undetected ormisunderstood.
The conditional nature of plant development isoften dealt with by controlling conditions as best aspossible to isolate the particular relationship understudy. In cases where the experimental method allows,the influences of multiple conditions may be examinedto create a richer description of the response, and afuller assessment of a mutant phenotype. Automationmakes this form of description more feasible. Auto-mated acquisition and computational analysis of dig-ital images could enable studies of plant growth anddevelopment that are both broad and rich in detail.This study uses such a machine vision-based approachto create a multicondition, high-resolution descriptionof root gravitropism in Arabidopsis (Arabidopsis thali-ana) seedlings, resulting in what might be termed abehavioral space.
Gravity is a constant, pervasive environmental in-fluence that significantly shapes plant form above andbelow ground. Much of what is known about gravitysensing and signal transduction in plants has beenlearned from studies of gravitropism of the seedlingprimary root. Root gravitropism has many attributesof a model stimulus-response system, being easy toinitiate, fast to react, and quantifiable with a straight-forward measurement of root tip angle (Boonsirichaiet al., 2002). Genetic screens have isolated severalmutants defective in the process (Harrison et al., 2008).
1 This work was supported by the National Science FoundationPlant Genome Research Program (grant no. DBI–0621702) and by theDepartment of Energy (grant no. DE–FG02–04ER15527).
2 These authors contributed equally to the article.3 Present address: Department of Biology, Doane College, 1014
Boswell Ave., Crete, NE 68333.* Corresponding author; e-mail [email protected] author responsible for distribution of materials integral to the
findings presented in this article in accordance with the policydescribed in the Instructions for Authors (www.plantphysiol.org) is:Edgar P. Spalding ([email protected]).
[W] The online version of this article contains Web-only data.[OA] Open Access articles can be viewed online without a sub-
scription.www.plantphysiol.org/cgi/doi/10.1104/pp.109.145292
206 Plant Physiology�, January 2010, Vol. 152, pp. 206–216, www.plantphysiol.org � 2009 American Society of Plant Biologists www.plantphysiol.orgon November 26, 2018 - Published by Downloaded from
Copyright © 2010 American Society of Plant Biologists. All rights reserved.

Their study with the full range of modern biologicaltools has produced a satisfyingly rich molecular andphysiological view of the process. Upon reorientation,statoliths in the central columella cells of the root capsediment to the new lower side of the cell (Blancafloret al., 1998; Kiss, 2000). Rapid ionic fluxes are triggeredwithin seconds, resulting in proton and possibly otherion concentration changes (Scott and Allen, 1999;Fasano et al., 2001; Hou et al., 2004) that result inredistribution of auxin efflux facilitator proteins, re-sulting in redistribution of auxin across the root (Frimlet al., 2002; Lewis et al., 2007; Harrison and Masson,2008), causing cells along the lower flank to expandmore slowly than those on the upper flank (Mullenet al., 1998). Curvature is generated (Miller et al., 2007),resulting in downward bending of the tip.While some aspects of the gravitropism mechanism
are understood in considerable detail other importantaspects such as dependence of the response on devel-opmental age or environmental conditions are un-known and perhaps not readily addressable bystandard methods. Yet, the range and plasticity ofthe underlying, causal mechanisms must be learned ifwhat governs the natural response is to be understood.This multifactorial study was designed to identify andquantify the strengths of different dependencies andinfluences of conditions on gravitropism to generate amore comprehensive characterization of this modelstimulus-response couple. The largely automated,computational approach may prove useful for thestudy of plant development in general.
RESULTS
Automated Image Acquisition and Analysis forGravitropism Studies
A machine vision acquisition and analysis platformcapable of high spatiotemporal resolution measure-ments of root gravitropism was established to charac-terize the extent and causes of variability in this modelstimulus-response process. Figure 1 shows a schema ofthe image acquisition, image processing, and post-processing analysis workflow. A bank of seven com-puter-controlled CCD cameras acquired electronicgrayscale images of roots, one per camera, at 2 minintervals over a period of 10 h (Fig. 1A). A movie madefrom the 301 high-resolution images of a root under-going gravitropism is presented in SupplementalMovie S1. Acquired image files automatically streamedto a data server (Fig. 1B). A custom image-processingalgorithm, essentially the same as that reported byMiller et al. (2007), automatically computed themidline(medial axis) of the root in each image (Fig. 1C) fromwhich root growth rate and tip angle could be com-puted (Fig. 1D). The individualmidlineswere returnedto the dataserver and linked to the experimentalmetadata via a relational database.With this workflow,1,216 gravitropism trials consisting of 366,016 separateimages were algorithmically and automatically con-
densed down to sets of midline coordinates and theirassociated metadata. These processed data sets weremined by querying the database (Fig. 1E) and perform-ing analyses such as principal components analysis(PCA) to reduce 301-point time courses to the fewestinformation-rich dimensions, simple averaging, classi-fication by k-means clustering, or differentiation bywavelet analysis (Fig. 1F).
Root Gravitropism within a Condition Space
The automated workflow (Fig. 1) made it possibleto investigate multiple experimental conditions in astudy of condition-dependent response or plasticity.Seedling age was one of the chosen variables becauseinitial pilot studies indicated that a 24-h difference inagewas enough to affect the gravitropic response. Seed-
Figure 1. A schema of the automated image acquisition, analysis, anddata-mining workflow. A, Seven CCD cameras acquired electronicimages of seedlings growing along the surface of agar-filled petri platesmaintained vertically, then rotated 90� to induce gravitropism. B, Imagesacquired at 2-min intervals streamed from the cameras to storage discsand database. C, Custom image-processing algorithms extracted the rootmidline. D, Analysis of the midlines returned tip angle and growth rateas a function of time. A relational database stored the extracted resultswith the metadata. E, Post acquisition, the database was queried withanalysis algorithms designed to identify patterns and quantify relation-ships between key parameters of the gravitropic response. F, The analysesinvolved standard statistics, classification, and signal processing.
Plasticity of Arabidopsis Root Gravitropism
Plant Physiol. Vol. 152, 2010 207 www.plantphysiol.orgon November 26, 2018 - Published by Downloaded from
Copyright © 2010 American Society of Plant Biologists. All rights reserved.

lings were systematically grown for 2, 3, or 4 d beforegravitropism was induced and the root responserecorded. Seedlings representative of these age classesand the mean lengths of their roots are shown in
Figure 2A. A previous study had shown that the sizeof the seed from which a seedling emerges influencesthe behavior of the root, and surprisingly more aspectsof development (T.L. Durham Brooks, unpublished
Figure 2. The three axes of the condition space. A,Seedling age formed one axis of the condition space.The root of a seedling between 2, 3, and 4 d (left)doubled in length (right) on average. B, The size ofthe seed formed another axis. Mechanical sievingseparated seeds (left) into subpopulations with differ-ent mean sizes and distributions (right) quantified byimage analysis. C, Composition of the agar growthmedium (either a simple mix of KCl and CaCl2 or arich mixture of all essential elements). D, The com-plete set of tip angle and growth rate versus time dataacquired in 22 different condition combinations.
Durham Brooks et al.
208 Plant Physiol. Vol. 152, 2010 www.plantphysiol.orgon November 26, 2018 - Published by Downloaded from
Copyright © 2010 American Society of Plant Biologists. All rights reserved.

data), so seed size was chosen as a variable. Seedsrepresentative of the size classes used here are shownin Figure 2B along with a quantitative description ofeach class. The third axis of the condition space isgrowth medium composition. A simple medium con-sisting of two salts and a buffer, and a rich mediumincluding Suc and all essential minerals (Fig. 2C) werethe conditions employed along the growth mediumaxis. Altogether, high-resolution assays of gravitro-pism were conducted in 22 discrete combinations ofseedling age (a developmental variable), seed size (anintrinsic variable), and medium composition (an ex-trinsic variable). The resulting set of growth rate andtip angle versus time plots is shown in Figure 2D.
Response Trends throughout the Condition Space
Figure 2D shows a large amount of variation in tipangle realignment and growth rate between discreteconditions. In some conditions, nearly agravitropicindividuals were observed while robust responses thatovershot their set-point angle and then autocorrectedduring the recorded 10 h were common in other con-ditions. One way to characterize the dependence of tipangle response on position within the condition spaceis to average the separate trials along a condition axis.Figure 3A shows the average tip angle (response) devel-opment of the different seed size classes, irrespectiveof age or growth medium. Seedlings from extra-smallseeds responded slowest, not reaching their steady-state tip angle by the end of 10 h, while seedlings fromlarge seeds responded faster and completely. Each ofthe traces consists of 301 time points; therefore, eachindividual response can be treated as a vector in 301dimensional space. PCA was employed to reduce the301 dimensions down to two that could best discrim-inate individual responses from each other. The firstprincipal component (PC1) described 85% of the var-iation in the data set. Addition of the second principalcomponent (PC2) increased the description to 99%.Determinations of these two coefficients for each in-dividual in the data set allowed any individual tipangle response to be discerned from another individ-ual 99% of the time. An alternative representation ofthe results in Figure 3A is a plot of PC2 versus PC1coefficients for each individual in the data set. Thepoints are colored to represent the seed size class theybelonged to (Fig. 3B). Colored boundaries containing75% of the data for each population were estimatedwith a Parzen window method employing a Gaussiankernel having a bandwidth of 1.75 to aid visualizingtrends in the distributions, namely that increasing seedsize was associated with amore homogenous responsepattern (less spread in the PC2 versus PC1 points).Together, sections A and B of Figure 3 indicate thatroots from large seeds respondmore robustly andwithless variability than do roots from small seeds.Averaging all trials along the seedling age axis re-
gardless of seed size or growth medium (Fig. 3C), andcircumscribing distributions of principal components
coefficients (Fig. 3D) showed that younger roots re-spondedwith rapid initial bending like roots from largeseeds, while older roots responded at a steadier, slowerrate like those from small seeds. On average, only2-d-old seedlings overshot the ultimate angle. Theresponse pattern (time course) displayed by root tipsof the three age classes differed much more than theangle finally achieved within the 10-h assay period. Ascan be seen from Figure 3D, the response of 2-d-oldseedlings was less variable than that of older roots. Inaddition, the PC coefficients of 3-d-old roots weresimilar to that of roots from small and medium seeds.
Growth medium composition also had a large effecton root gravitropism. Seedlings grown on a nutrient-rich medium responded like young seedlings fromlarge seeds based on the mean response curves (Fig.3E) and the PC2 versus PC1 distributions (Fig. 3F).One possible interpretation of the seed size effect isthat large seeds contain more resources than small
Figure 3. Tip angle development throughout the conditional space. A,Average tip angle development for each seed size class. B, Principalcomponents coefficients of the entire root data set colored according toseed size class. C, Average tip angle development across developmen-tal time. D, Principal components coefficients colored according todevelopmental age. E, Average tip angle development of seedlingsgrown on either rich or simple medium. F, Principal componentscoefficients of all individuals colored according to media condition.The contours in each principle components plot outline where 75% ofthe data for each population should lie.
Plasticity of Arabidopsis Root Gravitropism
Plant Physiol. Vol. 152, 2010 209 www.plantphysiol.orgon November 26, 2018 - Published by Downloaded from
Copyright © 2010 American Society of Plant Biologists. All rights reserved.

seeds, that resources become depleted between day 2and day 4, and that enriching the medium counteractsthis resource limitation. Levels of 19 elements in theseeds were measured by inductively coupled plasma-mass spectrometry (Lahner et al., 2003) in two separategenerations of seeds. The results are presented inSupplemental Tables S1 and S2. On a tissue weightbasis (Supplemental Table S1), none of the 19 ele-ments was less abundant in small seeds than largeseeds. In fact, small seeds contained more sodium(Na), potassium, rubidium, magnesium, cadmium,nickel, and molybdenum than large seeds on a tissueweight basis, though only the Na difference exceeded2-fold. This result argues against the effect of me-dium enrichment on gravitropism being due to ame-lioration of an embryonic mineral deficiency. Perindividual seed (Supplemental Table S2), sulfur,calcium, phosphorus, magnesium, zinc, manganese,iron, and copper were less abundant in small seedsthan large seeds by amounts roughly proportional tothe difference in seed size. No element was lessabundant in small seeds compared to large seeds ona per weight basis. If expressing levels on a per seedbasis better describes the environment within whichseeds germinate then the seed size effect on rootgrowth observed here could be due to a deficiency insmall seeds of one or more of these elements. Again,Na was more abundant in small seeds than largeseeds when the results were expressed per seed.Whether the higher levels of some elements in smallseeds, particularly Na, relates to the different behav-ior of the seedlings they produce is worthy of furtherstudy.
Classifying Patterns in the Pooled Data
The large, all-trials-pooled data set was subjected toclassification by a k-means clustering algorithm, whichiteratively segmented the population of results into aprechosen number of classes until within-class vari-ance was minimized. Selecting three as the number ofclasses to create followed by averaging all the trialsascribed to a particular class produced the averageresponse curves shown in Figure 4A. Class A rootsresponded vigorously to gravistimulation and over-shot the final angle. The class B response was lessvigorous, but on average achieved the same final angleas class A. Class C roots displayed a longer lag and didnot reach a steady state during the 10-h assay period.The average growth rate within each of the threeclasses is shown in Figure 4B. Roots of class A indi-viduals grew approximately twice as fast as class Broots, raising the possibility that overshooting ismechanistically linked to growth rate. Class A, B,and C roots make up 56%, 27%, and 17% of thepopulation. Shown in Figure 4C are representativeroots of each class after 10 h of gravistimulation.
In addition to obvious differences in root length,root width also differed (Fig. 4C). Class A roots were165 mm on average, approximately 15 mm wider thanclass B and C roots. The widths of class B and C rootswere similar, averaging 148 and 142 mm, respectively.Width was plotted versus average growth rate for eachindividual root in Figure 4D, with classes indicated bycolor and the class mean by a bull’s eye point anddotted lines. The large scatter of the points precludesgrowth rate predictions based on root width, but themore distinct upper edge of the distribution indicates
Figure 4. k-means clustering of tip angle responsesinto three distinct classes. A, Average tip angle de-velopment of each k-means defined class. B, Averagegrowth rates of the k-means defined tip angle re-sponses. C, Representative roots at 10 h after gravi-stimulation from each of the classes. In addition toshowing differences in final root length and tip anglebetween the classes, there is an apparent differencein root width. D, Average growth rate plotted againstroot width at 10 h of gravistimulation. The data arecolored according to k-means class.
Durham Brooks et al.
210 Plant Physiol. Vol. 152, 2010 www.plantphysiol.orgon November 26, 2018 - Published by Downloaded from
Copyright © 2010 American Society of Plant Biologists. All rights reserved.

that width may constrain growth rate. For example, a150 mm-wide root can apparently elongate at any rateup to 0.25 mm h21 and this upper limit increaseslinearly with width.Figure 5 presents class frequencies according to
position with the condition space. The proportion ofclass A roots increased with seed size and decreasedwith seedling age, while the proportion of class C rootsshowed the complementary pattern. No class C indi-viduals were found in the population of 2-d-old seed-lings coming from large seeds. Thus, the likelihood ofa particular response pattern being displayed by a rootvaried greatly across the condition space. Figure 5 canbe viewed as a graphical representation of a gravi-tropism behavioral space containing informationabout response plasticity. Only results obtained onthe simple growth medium are shown in Figure 5because enriching the medium eliminated much of theresponse heterogeneity. Nearly all 2- and 3-d seedlingsindependent of seed size were class A on the richmedium (data not shown).
Relationships between Growth Rate and Tip Angle
throughout the Condition Space
The variability of response parameters observedacross the condition space provided an opportunityto test relationships between parameters, such asgrowth rate and tip angle. Figure 6 shows a plot ofPC1, which correlates well with magnitude of the tipangle response (data not shown), versus the averagerate at which that root elongated for each separatetrial. This plot of all 1,216 trials shows that growth rateand responsemagnitude were strongly correlated untilgrowth rate exceeded 0.1 mm h21, after which no rela-tionship was apparent. Forty-one percent of the re-sponses lay within the linear range. Thus, for morethan half of the individuals, growth rate and tip angle
were not correlated. Perhaps different gravitropismmechanisms with different growth rate dependenciespertain in different conditions. Evidence of this may beseen in Figure 7, which shows the same information asFigure 6 except that the points obtained in each dis-crete condition (simple media only) are colored. Olderseedlings or those from smaller seeds tended to oper-ate in the growth rate-dependent mode whereas youn-ger seedlings or those from larger seeds responded ina growth rate-independent mode. Responses of 4-dseedlings from large seeds mapped fairly uniformlyacross the population.
Rate of Tip Angle Change throughout theCondition Space
To take advantage of the temporal informationprovided by capturing images at 2-min intervals, therate of root tip realignment was estimated by convolv-ing each separate tip angle time course with a first-order Gaussian derivative wavelet. The resulting tipswing rate, also called tropic speed (Chavarrıa-Krauser, 2006), was plotted versus time for each trialand then all trials in the entire data set were averagedand plotted along with the average tip angle response(also entire data set) in Figure 8A. The average swingrate plot shows a rapid initial acceleration phasefollowed by a longer decelerating phase as the tipapproaches its steady-state angle. From each trial inthe full data set, the time point at which swing ratepeaked and the tip angle accrued at that time wereextracted and plotted against each other in Figure 8B.The points were broadly distributed, though a largepercentage of them clustered within the 15� to 40� and1- to 2.5-h range. The green circle and dotted lines of
Figure 5. Distribution of class A, B, and C roots throughout thecondition space. Percentage of roots falling into each class wasdetermined by k-means clustering for plants on simple medium only.Class A roots increased with seed size and decreased with age.
Figure 6. Relationship between tip angle and average growth ratethroughout the condition space. PCA was performed on the entirepopulation of tip angle responses. Plotted is PC1 of the tip angle versusthe average growth rate of the same individual for each individual in thedata set. Growth rates below 0.10 mm h21 reasonably predict tip angledevelopment of an individual. Growth rate is not a good predictor of tipangle when the root grows faster than 0.10 mm h21. The line is aBoltzman equation fit to the data.
Plasticity of Arabidopsis Root Gravitropism
Plant Physiol. Vol. 152, 2010 211 www.plantphysiol.orgon November 26, 2018 - Published by Downloaded from
Copyright © 2010 American Society of Plant Biologists. All rights reserved.

Figure 4B show the average of the population, ap-proximately 30�, 2.5 h. Thus, sections A and B of Figure8 together demonstrate that swing rate peaks when theresponse is approximately 40% complete.
Swing rate also varied along the condition spaceaxes, with maxima ranging from approximately 10�h21 (extra-small seeds) to more than 30� h21 (richgrowth medium). Shown in Figure 9A is the largedependence of maximum swing rate on seed size.Figure 9B, which is a seed size coded version of Figure8B, shows that the fastest-bending roots came from thelarger seed classes while slower-responding rootswere much more likely to come from smaller seeds.The white circles and dashed lines indicate groupmeans. The time it took for a root tip to swing at itsmaximal rate varied considerably, but the tip angle atthat time point was a remarkably consistent 30�. Seed-ling age also had a large effect on swing rate magni-tude and time course, with the youngest roots showingthe most rapid and dynamic response. As seen for tipangle (Fig. 3, C and E), enriching the growth mediumshifted the swing rate profile from a response similarto that of a 4-d seedling to something like a 2-dseedling, with comparable peaks in excess of 30� h21
(Fig. 9, C and E). Much more clearly than the tip angleplots of Figure 3, this derivative analysis shows howthe response builds up and slows down as the objec-tive angle is achieved. Large swing rate maxima infast-swinging groups are followed by minima that dipbelow even the slowest phases of the slow-swinginggroups. Also, analysis of peaks in the derivative (Fig. 9,D and F) shows again how remarkably consistent roottip angle is at the time of its maximal swing rate.Conservation of this feature in the face of large plas-ticity in tip angle development across the conditionalspace (e.g. Figs. 2D and 5) is striking and perhapsmechanistically meaningful.
Curvature Distribution throughout the Condition Space
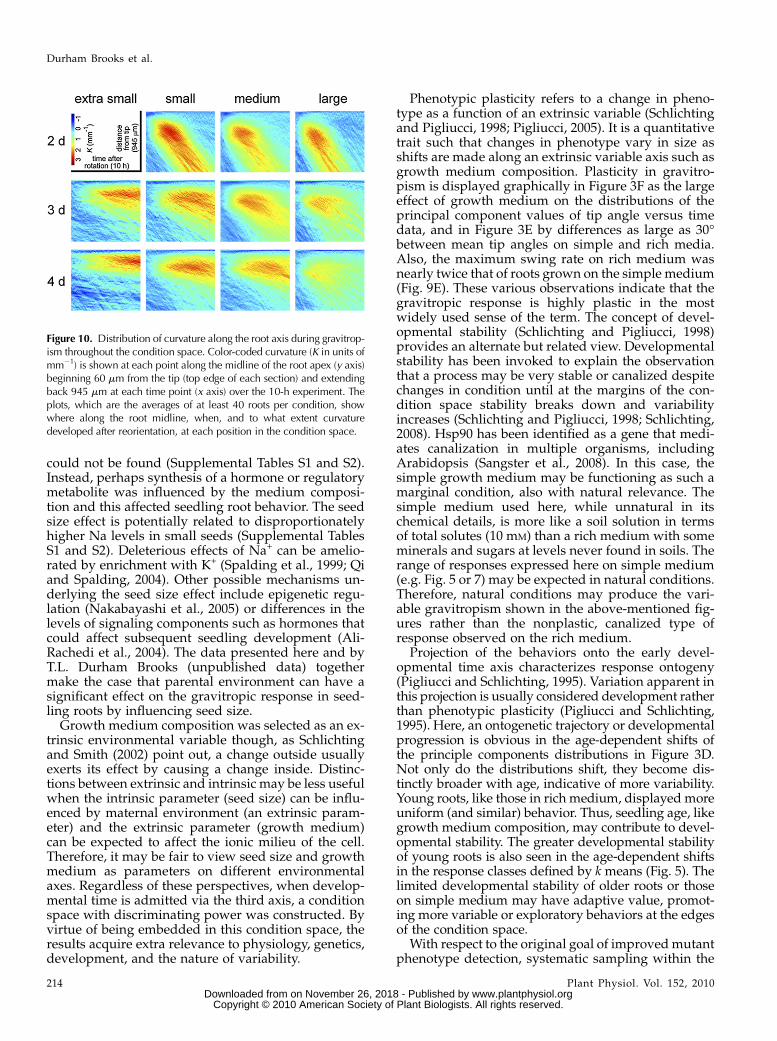
In the previous figures, root tip angle was the solemeasure of the gravitropic response. However, for anygiven tip angle curvature may be concentrated towardthe base, toward the tip, or evenly distributed alongthe root axis. Local curvature measurements give moreinformation than angle measurements about the dy-namics of a tropic response and its kinematic basis(Silk and Erickson, 1978; Chavarrıa-Krauser et al.,2008; Moulia and Fournier, 2009). Therefore, curvatureat each point along each midline at each time pointwas determined essentially as in Miller et al. (2007). InFigure 10, the y axis marks position along a constant-sized portion of root midline with the apex at the top,the x axis represents time, and curvature (K) isrepresented by a color scale. The results show when,to what extent, and where along the root curvaturedevelops, on average, in each condition. The rootswere initially straight; blue representing low curvaturedominates the early midlines. The curved portion ofthe root (red) spreads over time more in some condi-tions than others (e.g. compare 3- to 4-d seedlings from
Figure 7. The relationship between tip angle and growth rate variesthroughout the conditional space. Shown in gray in each figure are thePC1 coefficients and average growth rate for all 1,216 individuals in thedata set, as was shown in Figure 6. In vermillion are the PC1 coeffi-cients and average growth rates for the individuals at each develop-mental age and seed size on simple media.
Figure 8. Relationship between swing rate and tip angle. A, The tipangle at the time of maximum swing rate versus the time when swingrate was maximal. The dashed lines show that the average maximumswing rate of the data set occurred when the tip angle was 30� onaverage, and 2.5 h after gravistimulation, on average. B, The averageswing rate (gray) and the average tip angle (black) response of the entiredata set.
Durham Brooks et al.
212 Plant Physiol. Vol. 152, 2010 www.plantphysiol.orgon November 26, 2018 - Published by Downloaded from
Copyright © 2010 American Society of Plant Biologists. All rights reserved.

small seeds) but the most obvious feature in thisdisplay is the difference in slope of the curved regionbetween the top and bottom rows (2- and 4-d seed-lings). An explanation of this difference can be foundin the growth rate and classification analyses in Fig-ures 4D and 5. The top row of the grid (2-d seedlings)is predominantly populated by class A root behavior(Fig. 5), which correlates with above-average growthrate (Fig. 4D). Therefore, the larger blue area above thecurvature patch in 2-d seedlings (Fig. 10, top row)reflects the greater speed with which the tips of theseroots reorient and are displaced by growth from thecurved region.
DISCUSSION
The original motivation for understanding variabil-ity in gravitropism displayed by genetically identical,homozygous wild-type plants was to facilitate detec-tion of subtle mutant phenotypes. Machine visiontools and a computational workflow made it feasibleto study this variability, which is a reflection of ge-nome function with evolutionary and ecological con-
sequences (Tonsor et al., 2005). The thousands ofmeasurements made from the image sets cast thegravitropic response as a multidimensional behaviorspace coordinated by the condition axes.
The intention was to frame the condition space withthree orthogonal or qualitatively different axes: intrin-sic (seed size), extrinsic (medium composition), andearly developmental time (seedling age). But it isprobably more realistic to recognize some interdepen-dence between the axes. The intrinsic property of seedsize includes elements of life history and influences ofthe previous generation. The effects of maternal envi-ronment can be large and may have important eco-logical and evolutionary consequences (Roach andWulff, 1987; Schmitt et al., 1992). Indeed, a recent studyshowed a heavy maternal condition influence on seedsize affected seedling development and even aspectsof adult plant development (T.L. Durham Brooks,unpublished data). The seed size effect describedhere was largely suppressed by enriching the growthmedium. The rich medium may have exerted itsinfluence less directly than by rescuing a particularmineral deficiency, because evidence of a deficiency
Figure 9. Patterns in swing rate and time to reachmaximum swing rate throughout the condition space.A, Average swing rates of roots coming from eachseed size class. B, Tip angle and time to maximumswing rate by seed size class for each individual root.C, Average swing rates of roots over developmentaltime. D, Tip angle and time at the maximum swingrate grouped by developmental age. E, Average swingrates of roots grown on simple or rich medium. F, Tipangle and time at the maximum swing rate groupedby growth medium. The enlarged points within theseplots indicate the population means for each condi-tion.
Plasticity of Arabidopsis Root Gravitropism
Plant Physiol. Vol. 152, 2010 213 www.plantphysiol.orgon November 26, 2018 - Published by Downloaded from
Copyright © 2010 American Society of Plant Biologists. All rights reserved.
could not be found (Supplemental Tables S1 and S2).Instead, perhaps synthesis of a hormone or regulatorymetabolite was influenced by the medium composi-tion and this affected seedling root behavior. The seedsize effect is potentially related to disproportionatelyhigher Na levels in small seeds (Supplemental TablesS1 and S2). Deleterious effects of Na+ can be amelio-rated by enrichment with K+ (Spalding et al., 1999; Qiand Spalding, 2004). Other possible mechanisms un-derlying the seed size effect include epigenetic regu-lation (Nakabayashi et al., 2005) or differences in thelevels of signaling components such as hormones thatcould affect subsequent seedling development (Ali-Rachedi et al., 2004). The data presented here and byT.L. Durham Brooks (unpublished data) togethermake the case that parental environment can have asignificant effect on the gravitropic response in seed-ling roots by influencing seed size.
Growth medium composition was selected as an ex-trinsic environmental variable though, as Schlichtingand Smith (2002) point out, a change outside usuallyexerts its effect by causing a change inside. Distinc-tions between extrinsic and intrinsic may be less usefulwhen the intrinsic parameter (seed size) can be influ-enced by maternal environment (an extrinsic param-eter) and the extrinsic parameter (growth medium)can be expected to affect the ionic milieu of the cell.Therefore, it may be fair to view seed size and growthmedium as parameters on different environmentalaxes. Regardless of these perspectives, when develop-mental time is admitted via the third axis, a conditionspace with discriminating power was constructed. Byvirtue of being embedded in this condition space, theresults acquire extra relevance to physiology, genetics,development, and the nature of variability.
Phenotypic plasticity refers to a change in pheno-type as a function of an extrinsic variable (Schlichtingand Pigliucci, 1998; Pigliucci, 2005). It is a quantitativetrait such that changes in phenotype vary in size asshifts are made along an extrinsic variable axis such asgrowth medium composition. Plasticity in gravitro-pism is displayed graphically in Figure 3F as the largeeffect of growth medium on the distributions of theprincipal component values of tip angle versus timedata, and in Figure 3E by differences as large as 30�between mean tip angles on simple and rich media.Also, the maximum swing rate on rich medium wasnearly twice that of roots grown on the simple medium(Fig. 9E). These various observations indicate that thegravitropic response is highly plastic in the mostwidely used sense of the term. The concept of devel-opmental stability (Schlichting and Pigliucci, 1998)provides an alternate but related view. Developmentalstability has been invoked to explain the observationthat a process may be very stable or canalized despitechanges in condition until at the margins of the con-dition space stability breaks down and variabilityincreases (Schlichting and Pigliucci, 1998; Schlichting,2008). Hsp90 has been identified as a gene that medi-ates canalization in multiple organisms, includingArabidopsis (Sangster et al., 2008). In this case, thesimple growth medium may be functioning as such amarginal condition, also with natural relevance. Thesimple medium used here, while unnatural in itschemical details, is more like a soil solution in termsof total solutes (10 mM) than a rich medium with someminerals and sugars at levels never found in soils. Therange of responses expressed here on simple medium(e.g. Fig. 5 or 7) may be expected in natural conditions.Therefore, natural conditions may produce the vari-able gravitropism shown in the above-mentioned fig-ures rather than the nonplastic, canalized type ofresponse observed on the rich medium.
Projection of the behaviors onto the early devel-opmental time axis characterizes response ontogeny(Pigliucci and Schlichting, 1995). Variation apparent inthis projection is usually considered development ratherthan phenotypic plasticity (Pigliucci and Schlichting,1995). Here, an ontogenetic trajectory or developmentalprogression is obvious in the age-dependent shifts ofthe principle components distributions in Figure 3D.Not only do the distributions shift, they become dis-tinctly broader with age, indicative of more variability.Young roots, like those in rich medium, displayed moreuniform (and similar) behavior. Thus, seedling age, likegrowth medium composition, may contribute to devel-opmental stability. The greater developmental stabilityof young roots is also seen in the age-dependent shiftsin the response classes defined by k means (Fig. 5). Thelimited developmental stability of older roots or thoseon simple medium may have adaptive value, promot-ing more variable or exploratory behaviors at the edgesof the condition space.
With respect to the original goal of improvedmutantphenotype detection, systematic sampling within the
Figure 10. Distribution of curvature along the root axis during gravitrop-ism throughout the condition space. Color-coded curvature (K in units ofmm21) is shown at each point along the midline of the root apex (y axis)beginning 60 mm from the tip (top edge of each section) and extendingback 945 mm at each time point (x axis) over the 10-h experiment. Theplots, which are the averages of at least 40 roots per condition, showwhere along the root midline, when, and to what extent curvaturedeveloped after reorientation, at each position in the condition space.
Durham Brooks et al.
214 Plant Physiol. Vol. 152, 2010 www.plantphysiol.orgon November 26, 2018 - Published by Downloaded from
Copyright © 2010 American Society of Plant Biologists. All rights reserved.

condition space may be expected to help in caseswhere the altered gene’s function is conditional. Aphenotype could be manifested, for example, as achange in distribution of the class frequency plots inFigure 5. Such a mutation that alters behavior within acondition space may provide key information aboutthe gene’s primary function. For example, weak gravi-tropism in a mutant could be a symptom of an onto-genetic shift along the seedling-age axis (see the effects48 h has on the response as quantified in Figs. 3, C andD, 5, 7, and 9, C and D). To label the affected gene as acomponent of the gravitropism response when in factthe mutant is aging more quickly would be to miss thelarger point. Such refinement of explanations is ananticipated premium derived from characterizing aprocess within the context of a condition space.Also regarding phenotype detection, this work
highlights the importance of growth medium. Richmedium reduced the response plasticity such thatresponses regardless of condition resembled those ofyoung seedlings from large seeds. The equivalent ofFigure 5 for rich medium was so uniform that it wasnot shown. This equalizing effect of medium indicatesthat the common practice of screening for mutantphenotypes on a rich medium such as 0.53Murashigeand Skoog may minimize phenotype expression.The wild-type condition space characterized here
may serve as a reference for future genetic compari-sons but it also provides independent insights intoplant growth and development. For example, on thesimple growth medium, root tip reorientation wasmost rapidly achieved at the minimum possiblegrowth rate by 2-d roots, regardless of seed size(Figs. 3, C and D, and 7). This may reflect a principalrole of gravity sensing by the seedling primary root innature, namely reorientation of the tip upon germina-tion even as it emerges from the randomly orientedseed. Two days later, an overriding gravity responsemay be less advantageous as guidance responses tovarious soil factors such as obstacle avoidance (Massaand Gilroy, 2003) must be accommodated.Other dimensions could be added to the behavior
space, such as extending the age range studied, orpotentially even from further analysis of the originalimage set. Also, the cellular basis of gravitropic bendingcould be explored by kinematic assays (Silk, 1984) thatmayshowinformativepatterns in localgrowth rates, cellproduction rates, and cell displacements relative to thetip throughout the condition space (Walter et al., 2009).Anext step in the systems-level direction would be to addroot gene expression profiles at different positions in thecondition space such that the molecular underpinningsof the different behaviors could be inferred.
MATERIALS AND METHODS
Seeds, Solutions, and Plant Culture
Seven separately raised lots of Arabidopsis (Arabidopsis thaliana; Columbia
ecotype) seeds harvested over a 12-month period were used here. After
harvesting, seeds were passed through a series of U.S. standard brass test
sieves (Fisher Scientific Co.; http://www.fishersci.com) with grading sizes of
212, 250, 280, 300, or 355 mm. Morphological characteristics of the resulting
four seed populations were determined by collecting images of approximately
1,000 seeds spread over the bottom of a dish with a high-resolution flatbed
scanner. An image analysis algorithm used thresholding and blob detection
routines to quantify the area of each seed. The recorded seed areas were used
to construct the distributions in Figure 2B. For each gravitropism experiment,
two seeds were sown on either simple or rich medium in petri plates and then
stratified at 4�C for 2 to 6 d to synchronize germination. The simple medium
consisted of 1 mM KCl, 1 mM CaCl2, 5 mM MES, and 1% agar adjusted to pH 5.7
with BisTris propane. The rich medium consisted of 3 mM KNO3, 2 mM Ca
(NO3)2·4H2O, 0.5 mM MgSO4·7H2O, 1 mM (NH4)H2PO4, 0.56 mM myoinositol,
2.3 mM MES, 10 g/L Suc, micronutrients, and 1% agar and was adjusted to pH
5.7 with KOH or HCl. The micronutrients consisted of 25 mM KCl, 17.5 mM
H3BO3, 1 mM MnSO4·H2O, 1 mM ZnSO4·7H2O, 0.25 mM CuSO4·5H2O, 0.25 mM
(NH4)6Mo7O24·4H2O, and 25 mM (ethylene-dinitrilo)tetraacetic acid (Fe-Na
EDTA). After stratification, plates were placed vertically under continuous
white fluorescent light at a photon fluence rate of 50 mmol m22 s21 in a room
used only for these experiments maintained at approximately 25�C.
Image Acquisition
A Marlin F146B CCD camera (Allied Vision Technologies; http://www.
alliedvisiontec.com) outfitted with a macro-zoom lens (model NT59-157;
Edmund Optics; http://www.edmundoptics.com) and an infrared-passing
filter (UV/Vis-Cut R-72; Edmund Optics Inc.; http://www.edmundoptics.
com) formed the basis of an imaging station. The petri plate with seedling to
be imaged was held vertically and transverse to the optical axis of the camera
in a fixture mounted on an x,y,z positioning device. An hour after the plates
with seedlings were placed in front of the cameras, the plate was rotated
clockwise until the tip of the root being imaged was aligned by eye with the
camera horizon. An infrared backlight with peak output at 880 nm (model
NT55-819; Edmund Optics Inc.) behind the sample formed the captured
image while white fluorescent light provided illumination for the seedlings.
More details of the custom image acquisition system are presented here:
http://phytomorph.wisc.edu/parts_list.htm. Seven identical stations were
closely spaced to reduce any microenvironmental differences in the room. A
single computer acquired images every 2 min for 10 h from each of the seven
cameras. The resulting 8-bit grayscale tagged image format files each
consisted of 1,392 3 1,040 pixels. The combination of lens and CCD sensor
gave a spatial resolution of 8 mm pixel21. Typically, two 10-h experiments
employing the bank of seven cameras were performed each day. The system-
atized workflow made it possible to control seedling age (2, 3, or 4 d after
removal from stratification) within a range that did not exceed 4 h. Each
discrete condition is represented by at least 40 independent trials.
Image Analysis
The root midline or medial axis was extracted from each image using
the distance transform-based method described by Miller et al. (2007). The
direction of the root tip in each image was determined by determining the
first principal component of the last 10 midline points. Tip angle was taken as
the angle formed between the first principal component and the camera’s
horizon. Growth rate was calculated as the derivative of the midline length
over time. Tip angle and root length measurements were indexed into a
database containing the metadata related to each experiment. Access to the
entire database is available on request. To measure root width, a region from
100 mm back from the root tip was isolated from the final image of each trial.
The average distance from the midline to the nearest root contour point within
this isolated region was found and then multiplied by 2 to estimate the root
width. The curvature distributions were determined as previously described
(Miller et al., 2007) except that instead of extending the analysis window over
time at a rate equal to the average growth rate, a fixed-length section of
midline anchored at the tip was analyzed over time. The color curvature plots
in Figure 10 cover this portion of the root except for the apical-most 60microns
because curve fitting required for curvature determination was not reliable at
the terminus and this portion of the root does not undergo differential growth.
Data Analysis
All image processing and post-processing analyses were performed by
algorithms custom coded in the MATLAB programming language (Math-
Plasticity of Arabidopsis Root Gravitropism
Plant Physiol. Vol. 152, 2010 215 www.plantphysiol.orgon November 26, 2018 - Published by Downloaded from
Copyright © 2010 American Society of Plant Biologists. All rights reserved.
works Inc.; http://www.mathworks.com). Eigenvector decomposition,
k-means clustering, and wavelet analysis were performed using built-in
MATLAB functions. For k-means clustering, each trial was treated as a point
in 301-dimensional space and the entire population of trials was optimally
separated into three groups without respect to condition. Three was chosen as
the number of classes for k-means classification because inspection of the results
by eye showed under benders, normal benders, and overshooters were natural,
useful categories. Also, three categories displayed the informative trends shown
in Figure 5 while useful, integrative trends were not obvious when larger
numbers of classes were tried. After classification was performed, each trial was
parsed out by position in the conditional space to which it belonged to create
Figure 5. PCA was also performed on the covariance matrix, with column
vectors as tip angle observations at a particular time. PC1 and PC2 of each
response were then categorized according to position within the conditional
space. Wavelet analysis was performed on each individual tip angle response
using the derivative of the Gaussian as the transforming function. A window
size of 3 was used, which resulted in some smoothing of the resulting curve.
Supplemental Data
The following materials are available in the online version of this article.
Supplemental Table S1. Elemental content of small and large seeds
expressed per microgram of tissue.
Supplemental Table S2. Elemental content of small and large seeds
expressed per seed.
Supplemental Movie S1. Example movie of an Arabidopsis root under-
going gravitropism.
ACKNOWLEDGMENT
We thank David Salt, Purdue University, for performing the elemental
analysis on seeds.
Received July 23, 2009; accepted November 13, 2009; published November 18,
2009.
LITERATURE CITED
Ali-Rachedi S, Bouinot D, Wagner M, Bonnet M, Sotta B, Grappin P,
Jullien M (2004) Changes in endogenous abscisic acid levels during
dormancy release and maintenance of mature seeds: studies with the
Cape Verde Islands ecotype, the dormant model of Arabidopsis thali-
ana. Planta 219: 479–488
Blancaflor EB, Fasano JM, Gilroy S (1998) Mapping the functional roles of
cap cells in the response of Arabidopsis primary roots to gravity. Plant
Physiol 116: 213–222
Boonsirichai K, Guan C, Chen R, Masson PH (2002) Root gravitropism: an
experimental tool to investigate basic cellular and molecular processes
underlying mechanosensing and signal transmission in plants. Annu
Rev Plant Biol 53: 421–447
Chavarrıa-Krauser A (2006) Quantification of curvature production in
cylindrical organs, such as roots and hypocotyls. New Phytol 171:
633–641
Chavarrıa-Krauser A, Nagel KA, Palme K, Schurr U, Walter A, Scharr H
(2008) Spatio-temporal quantification of differential processes in root
growth zones based on a novel combination of image sequence pro-
cessing and refined concepts describing curvature production. New
Phytol 177: 811–821
Donohue K (2009) Completing the cycle: maternal effects as the missing
link in plant life histories. Philos Trans R Soc Lond B Biol Sci 364:
1059–1074
Fasano JM, Swanson SJ, Blancaflor EB, Dowd PE, Kao T, Gilroy S (2001)
Changes in root cap pH are required for the gravity response of the
Arabidopsis root. Plant Cell 13: 907–922
Friml J, Wisniewska J, Benkova E, Mendgen K, Palme K (2002) Lateral
relocation of auxin efflux regulator PIN3 mediates tropism in Arabi-
dopsis. Nature 415: 806–809
Harrison B, Morita M, Masson P, Tasaka M (2008) Chapter 2: Signal
transduction in gravitropism. In S Gilroy, P Masson, eds, Plant Tro-
pisms. Blackwell Publishing, Ames, IA, pp 21–45
Harrison BR, Masson PH (2008) ARL2, ARG1 and PIN3 define a gravity
signal transduction pathway in root statocytes. Plant J 53: 380–392
Hou G, Kramer VL, Wang YS, Chen R, Perbal G, Gilroy S, Blancaflor EB
(2004) The promotion of gravitropism in Arabidopsis roots upon actin
disruption is coupled with the extended alkalinization of the columella
cytoplasm and a persistent lateral auxin gradient. Plant J 39: 113–125
Kiss JZ (2000) Mechanisms of the early phases of plant gravitropism. CRC
Crit Rev Plant Sci 19: 551–573
Lahner B, Gong J, Mahmoudian M, Smith EL, Abid KB, Rogers EE,
Guerinot ML, Harper JF, Ward JM, McIntyre L, et al (2003) Genomic
scale profiling of nutrient and trace elements in Arabidopsis thaliana. Nat
Biotechnol 21: 1215–1221
Lewis DR, Miller ND, Splitt BL, Wu G, Spalding EP (2007) Separating the
roles of acropetal and basipetal auxin transport on gravitropism with
mutations in two Arabidopsis Multidrug Resistance-like ABC transporter
genes. Plant Cell 19: 1838–1850
Massa GD, Gilroy S (2003) Touch modulates gravity sensing to regu-
late the growth of primary roots of Arabidopsis thaliana. Plant J 33:
435–445
Miller ND, Parks BM, Spalding EP (2007) Computer-vision analysis of
seedling responses to light and gravity. Plant J 52: 374–381
Moulia B, Fournier M (2009) The power and control of gravitropic
movements in plants: a biomechanical and systems biology view. J
Exp Bot 60: 461–486
Mullen JL, Ishikawa H, Evans ML (1998) Analysis of changes in relative
elemental growth rate patterns in the elongation zone of Arabidopsis
roots upon gravistimulation. Planta 206: 598–603
Nakabayashi K, Okamoto M, Koshiba T, Kamiya Y, Nambara E (2005)
Genome-wide profiling of stored mRNA in Arabidopsis thaliana seed
germination: epigenetic and genetic regulation of transcription in seed.
Plant J 41: 697–709
Pigliucci M (2005) Evolution of phenotypic plasticity: where are we going
now? Trends Ecol Evol 20: 481–486
Pigliucci M, Schlichting CD (1995) Ontogenetic reaction norms in Lobelia
siphilitica (Lobeliaceae): response to shading. Ecology 76: 2134–2144
Qi Z, Spalding EP (2004) Protection of plasma membrane K+ transport by
the salt overly sensitive1 Na+-H+ antiporter during salinity stress. Plant
Physiol 136: 2548–2555
Roach DA, Wulff RD (1987) Maternal effects in plants. Annu Rev Ecol Syst
18: 209–235
Sangster TA, Salathia N, Undurraga S, Milo R, Schellenberg K, Lindquist
S, Queitsch C (2008) HSP90 affects the expression of genetic variation
and developmental stability in quantitative traits. Proc Natl Acad Sci
USA 105: 2963–2968
Schlichting CD (1986) The evolution of phenotypic plasticity in plants.
Annu Rev Ecol Syst 17: 667–693
Schlichting CD (2008) Hidden reaction norms, cryptic genetic variation,
and evolvability. Ann N Y Acad Sci 1133: 187–203
Schlichting CD, Pigliucci M (1998) Phenotypic Evolution: A Reaction
Norm Perspective. Sinauer, Sunderland, MA
Schlichting CD, Smith H (2002) Phenotypic plasticity: linking molecular
mechanisms with evolutionary outcomes. Evol Ecol 16: 189–211
Schmitt J, Niles J, Wulff RD (1992) Norms of reaction of seed traits to
maternal environments in Plantago lanceolata. Am Nat 139: 451–466
Scott AC, Allen NS (1999) Changes in cytosolic pH within Arabidopsis
root columella cells play a key role in the early signaling pathway for
root gravitropism. Plant Physiol 121: 1291–1298
Silk WK (1984) Quantitative descriptions of development. Annu Rev Plant
Physiol 35: 479–518
Silk WK, Erickson RO (1978) Kinematics of hypocotyl curvature. Am J Bot
65: 310–319
Spalding EP, Hirsch RE, Lewis DR, Qi Z, Sussman MR, Lewis BD (1999)
Potassium uptake supporting plant growth in the absence of AKT1
channel activity: inhibition by ammonium and stimulation by sodium. J
Gen Physiol 113: 909–918
Sultan SE (2004) Promising directions in plant phenotypic plasticity.
Perspect Plant Ecol Evol Syst 6: 227–233
Tonsor SJ, Alonso-Blanco C, Koornneef M (2005) Gene function beyond
the single trait: natural variation, gene effects, and evolutionary ecology
in Arabidopsis thaliana. Plant Cell Environ 28: 2–20
Walter A, Silk WK, Schurr U (2009) Environmental effects on spatial and
temporal patterns of leaf and root growth. Annu Rev Plant Biol 60:
279–304
Durham Brooks et al.
216 Plant Physiol. Vol. 152, 2010 www.plantphysiol.orgon November 26, 2018 - Published by Downloaded from
Copyright © 2010 American Society of Plant Biologists. All rights reserved.


![Root Gravitropism Is Regulated by a Crosstalk between para ... · Root Gravitropism Is Regulated by a Crosstalk between para -Aminobenzoic Acid, Ethylene, and Auxin 1[OPEN] Hugues](https://img.pdfslide.net/doc/110x75/5e1aefaa14977d6de02f88d9/root-gravitropism-is-regulated-by-a-crosstalk-between-para-root-gravitropism.jpg)


![Plasticity of the Arabidopsis Root System - Plant Physiology · Plasticity of the Arabidopsis Root System under Nutrient Deficiencies1[C][W][OPEN] Benjamin D. Gruber2,RicardoF.H.Giehl2,](https://img.pdfslide.net/doc/110x75/5afe5b1e7f8b9a864d8ed0cb/plasticity-of-the-arabidopsis-root-system-plant-of-the-arabidopsis-root-system.jpg)


![Switching the Direction of Stem Gravitropism by Altering Two … · Switching the Direction of Stem Gravitropism by Altering Two Amino Acids in AtLAZY11[OPEN] Takeshi Yoshihara and](https://img.pdfslide.net/doc/110x75/5f1d8a26b146120a885fa1eb/switching-the-direction-of-stem-gravitropism-by-altering-two-switching-the-direction.jpg)