Embed Size (px)
Citation preview

DOI: 10.1126/science.1214209, 838 (2012);335 Science
, et al.Attreyee GhoshPlate Motions and Stresses from Global Dynamic Models
This copy is for your personal, non-commercial use only.
clicking here.colleagues, clients, or customers by , you can order high-quality copies for yourIf you wish to distribute this article to others
here.following the guidelines
can be obtained byPermission to republish or repurpose articles or portions of articles
): February 19, 2012 www.sciencemag.org (this infomation is current as of
The following resources related to this article are available online at
http://www.sciencemag.org/content/335/6070/838.full.htmlversion of this article at:
including high-resolution figures, can be found in the onlineUpdated information and services,
http://www.sciencemag.org/content/suppl/2012/02/15/335.6070.838.DC1.html can be found at: Supporting Online Material
http://www.sciencemag.org/content/335/6070/838.full.html#ref-list-1, 2 of which can be accessed free:cites 33 articlesThis article
http://www.sciencemag.org/cgi/collection/geochem_physGeochemistry, Geophysics
subject collections:This article appears in the following
registered trademark of AAAS. is aScience2012 by the American Association for the Advancement of Science; all rights reserved. The title
CopyrightAmerican Association for the Advancement of Science, 1200 New York Avenue NW, Washington, DC 20005. (print ISSN 0036-8075; online ISSN 1095-9203) is published weekly, except the last week in December, by theScience
on
Feb
ruar
y 19
, 201
2w
ww
.sci
ence
mag
.org
Dow
nloa
ded
from
with promoters that limit the hydrogenation re-actions (8), thus favoring chain growth and thetermination step via b-hydride abstraction thatcannot give rise to CH4 production. The sup-pression of the methanation reaction induced bythe promoters was only observed when using CNFor a-Al2O3 because these “inert” supports arethought to favor the proximity between iron andpromoters (Na plus S), in contrast to reactive sup-ports such as g-Al2O3 that lead to more methane(Fig. 3). In the case of the bulk catalysts, CH4
selectivities coincided with the values predictedby the ASF model or were slightly above.
Mössbauer spectroscopy of the spent cata-lysts after reaction at 1 bar (table S5) showedthat the nature of the iron phases varied whenusing different support materials. Although someof the iron carbides may be oxidized after ex-posure to air, FexCy was detected on the sam-ples with moderate to high catalytic activity.In contrast, the samples with the lowest catalyticactivity, Fe/SiO2 and Fe/g-Al2O3, did not containany carbides. A strong metal-support interactionclearly inhibits the formation of catalytically ac-tive iron carbides, as observed for conventionalhigh-surface-area support materials. Note that inthe size range of iron particles dispersed on inertsupports (7 to 20 nm), particle size effects seemto be minimal.
TEM performed on spent catalysts revealedthat the iron nanoparticles in the supported sam-ples increased in size. The particle size distributionsof the fresh and spent Fe/a-Al2O3 and Fe/CNFare shown in fig. S2. For Fe/CNF, changes in thecatalytic activity were only observed during thefirst 4 hours of reaction, which suggests thatthe changes in the catalyst structure took placeduring catalyst activation and initial usage. In thecase of Fe/a-Al2O3, the average iron nanoparticlesize increased from 14 T 5 nm to 17 T 5 nm(Fig. 1C). The promoted bulk iron oxide showed
extensive particle fragmentation and carbon fil-ament growth, which brings about the poor me-chanical stability of this catalyst (Fig. 1D).
The spent catalysts were characterized withthermogravimetric analysis to determine the extentof carbon lay-down. Carbon burn-off experimentswere performed for all the samples, except for theFe/CNF catalyst. Although extensive carbon dep-osition on the samples after reaction with CO-richsyngas and high temperatures could be expected,most of the samples exhibited low solid carbonformation. After 64 hours of reaction at 340°C and20 bar, the levels of carbon lay-down measuredon the spent catalysts were lower than 10 wt %.In contrast, Fe/a-Al2O3 (25 wt % Fe) and Fe-Cu-K-SiO2 exhibited a higher extent of coke for-mation (23 wt % and 40 wt %, respectively).
The FTO process represents a strong alter-native route for the sustainable production oflower olefins from biomass-derived synthesis gas.The industrial potential of this process is greatlyenhanced by the reported development of active,selective, and mechanically stable catalysts thatconsist of promoted iron nanoparticles dispersedon weakly interactive supports. Further suppres-sion of methane production, maximization ofthe C2-C4 olefins fraction, and reduction of car-bon lay-down by addition of promoters and byoptimization of physical properties (e.g., Fe par-ticle size, distribution of Fe nanoparticles on thesupport) will allow us to further understand anddevelop the performance of these catalysts.
References and Notes1. A. Corma, F. V. Melo, L. Sauvanaud, F. Ortega,
Catal. Today 107–108, 699 (2005).2. R. Diercks et al., Chem. Eng. Technol. 31, 631 (2008).3. S. Wang, Z. H. Zhu, Energy Fuels 18, 1126 (2004).4. E. L. Kunkes et al., Science 322, 417 (2008).5. T. P. Vispute, H. Zhang, A. Sanna, R. Xiao, G. W. Huber,
Science 330, 1222 (2010).6. X. Dupain, R. A. Krul, C. J. Schaverien, M. Makkee,
J. A. Moulijn, Appl. Catal. B 63, 277 (2006).
7. G. A. Olah, Angew. Chem. Int. Ed. 44, 2636 (2005).8. C. Wang, L. Xu, Q. Wang, J. Nat. Gas Chem. 12, 10
(2003).9. B. Büssemeier, C. D. Frohning, G. Horn, W. Kluy, U.S.
Patent 4564642 (1986).10. B. H. Davis, Catal. Today 84, 83 (2003).11. S. Soled, E. Iglesia, R. A. Fiato, Catal. Lett. 7, 271 (1990).12. Y. Jin, A. K. Datye, J. Catal. 196, 8 (2000).13. A. P. Steynberg, M. E. Dry, Eds., Fischer-Tropsch
Technology (Elsevier, Amsterdam, 2004).14. M. D. Shroff et al., J. Catal. 156, 185 (1995).15. J. Barrault, C. Forquy, J. C. Menezo, R. Maurel, React.
Kinet. Catal. Lett. 15, 153 (1980).16. B. G. Baker, N. J. Clark, H. MacArthur, E. Summerville,
U.S. Patent 4610975 (1986).17. D. B. Bukur et al., Ind. Eng. Chem. Res. 29, 1588
(1990).18. L. Xu, Q. Wang, Y. Xu, J. Huang, Catal. Lett. 31, 253
(1995).19. M. L. Cubeiro et al., Appl. Catal. A 167, 183 (1998).20. V. K. Jones, L. R. Neubauer, C. H. Bartholomew, J. Phys.
Chem. 90, 4832 (1986).21. A. P. B. Sommen, F. Stoop, K. van der Wiele, Appl. Catal.
14, 277 (1985).22. K. P. de Jong, Oil Gas Sci. Technol. 61, 527 (2006).23. K. P. de Jong, J. W. Geus, Catal. Rev., Sci. Eng. 42,
481 (2000).24. E. van Steen, F. F. Prinsloo, Catal. Today 71, 327 (2002).25. W. Chen, Z. Fan, X. Pan, X. Bao, J. Am. Chem. Soc. 130,
9414 (2008).26. A. J. van Dillen, R. J. A. M. Terörde, D. J. Lensveld,
J. W. Geus, K. P. de Jong, J. Catal. 216, 257 (2003).
Acknowledgments: Supported by ACTS-ASPECT (NWO) and byNWO-TOP and NRSCC. We thank M. Van de Vijver for thecatalytic tests at 20 bar performed at DOW Benelux, E. J. M.Hensen for his contribution in the discussion of the Mössbauerspectroscopy results, and C. van der Spek for the TEM images.ACTS-ASPECT (NWO) has filed a patent application based onthe work reported here.
Supporting Online Materialwww.sciencemag.org/cgi/content/full/335/6070/835/DC1Materials and MethodsEqs. S1 and S2Tables S1 to S6Figs. S1 to S6References (27–35)
21 October 2011; accepted 6 January 201210.1126/science.1215614
Plate Motions and Stresses fromGlobal Dynamic ModelsAttreyee Ghosh* and William E. Holt
Delineating the driving forces behind plate motions is important for understanding the processesthat have shaped Earth throughout its history. However, the accurate prediction of plate motions,boundary-zone deformation, rigidity, and stresses remains a difficult frontier in numericalmodeling. We present a global dynamic model that produces a good fit to such parameters byaccounting for lateral viscosity variations in the top 200 kilometers of Earth, together with forcesassociated with topography and lithosphere structure, as well as coupling with mantle flow. Therelative importance of shallow structure versus deeper mantle flow varies over Earth’s surface.Our model reveals where mantle flow contributes toward driving or resisting plate motions.Furthermore, subducted slabs need not act as strong stress guides to satisfy global observationsof plate motions and stress.
Predicting plate motions correctly, along withstresses within the plates, has been a chal-lenge for global dynamic models. Accurate
predictions are vitally important for understand-ing the forces responsible for the movement ofplates, mountain building, rifting of continents,
and strain accumulation released in earthquakes.Previous studies have investigated these drivingforces by either predicting stresses in the platesalone (1, 2) or plate motions alone (3–5). Otherstudies have taken the important step of predict-ing both plate motions and stresses in a singlemodel (6–8). However, in addition to predict-ing plate motions, a successful global dynamicmodel must also explain plate rigidity and plateboundary-zone deformation, as well as intraplatestress patterns. Furthermore, the presence of lat-eral viscosity variations within the top 200 kmof Earth influences the coupling between litho-sphere and mantle convection. A systematic inves-tigation of this influence is needed to improveour understanding of the driving mechanismsfor plate tectonics.
Geosciences Department, Stony Brook University, Stony Brook,NY 11794, USA.
*To whom correspondence should be addressed. E-mail:[email protected]
17 FEBRUARY 2012 VOL 335 SCIENCE www.sciencemag.org838
REPORTS
on
Feb
ruar
y 19
, 201
2w
ww
.sci
ence
mag
.org
Dow
nloa
ded
from
We used global dynamic models to investi-gate the influence of lateral viscosity variationsin the lithosphere and asthenosphere on both sur-face motions and stresses within the plates andplate boundary zones. Our models include in-corporation of the effects of topography andlithosphere structure and a lithosphere coupledwith whole-mantle convection, driven by densi-ty buoyancies within the mantle. Our modelingreveals the lateral viscosity variations that arenecessary for matching observations. The resultsfurther emphasize the relative contributions of(i) topography and lithosphere structure and (ii)coupling with whole-mantle convection, both ofwhich vary over Earth’s surface.
We solved the three-dimensional (3D) forcebalance equations after depth-integrating themfrom a surface of variable elevation to a commondepth reference level (100 km below sea level)to obtain deviatoric stresses, strain rates, andhorizontal velocities within the top 100 km ofthe planet (9). The body forces in these equa-tions were derived from two sources: (i) topog-raphy and lithosphere density structure and (ii)density-driven convection within the mantle con-strained by tomography and history of subduc-tion. Benchmarking tests have demonstrated thatdespite the simplification used in this method,we are able to recover the horizontal components
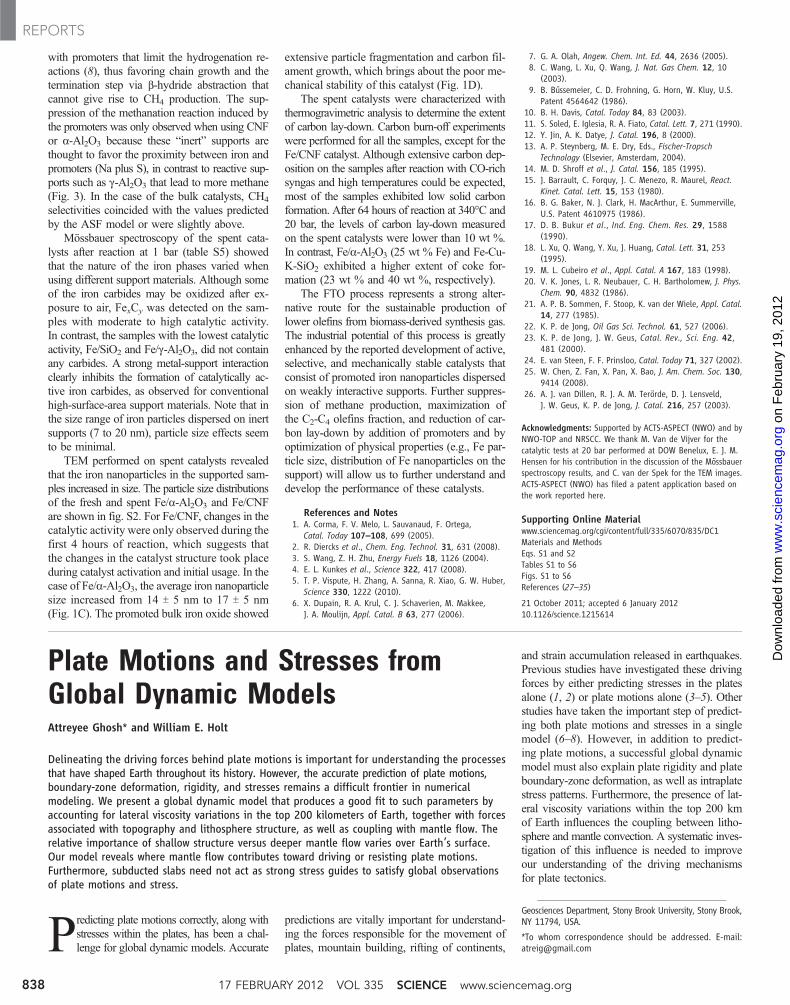
of stress, strain rate, and velocity in the upper100 km of a full 3D whole-mantle convectionmodel with better than 99% accuracy (10). Wetested different radial and lateral viscosity varia-tions in the lithosphere and asthenosphere, wherethe lateral variations were assigned based on po-sitions of cratons and weak plate boundary zones(Fig. 1A). A relatively narrow range of viscositymodels gave acceptable fits to the observations.Viscosity models that simultaneously gave a goodfit to both plate motions and stresses requireda stiff lithosphere (1023 Pa · s) with stiffer (1024
Pa · s) cratons (white regions in Fig. 1A) andweaker plate boundary zones (1020 to 1022 Pa · s)in the top 100 km and a moderately strongasthenosphere (300-km thickness, 1020 Pa · s).The successful models had keels beneath the cra-tons with viscosities less than 1023 Pa · s betweendepths of 100 to 200 km.
The velocity field predicted by our best-fitdynamic model in a no-net-rotation (NNR) frameshows a remarkably good fit to the NNR platemotion model defined by Global Positioning Sys-tem (GPS) (Fig. 1B) (11). The root mean squaremisfit of the velocity field from our completedynamic model (mantle flow–associated trac-tions plus lithosphere structure and topography)compared at 63,000 spaced points (1° by 1°) withthe kinematic NNR model is ~1 cm/year. The
relative contribution of motions associated withcoupling with whole-mantle flow versus topog-raphy and lithosphere structure can be under-stood by inspection of Fig. 1C, which is basedon the contribution from mantle circulation trac-tions only. The relative driving mechanisms oftopography and lithosphere structure versuscoupling with mantle flow varies from plate toplate. The India and Nazca plates have a domi-nant influence from coupling with mantle flow,whereas other plates and regions approach pari-ty in the relative contribution, with mantle-flowtractions dominating slightly. It is obvious, how-ever, that the contribution from coupling withmantle circulation alone fails to predict surfacemotions.
We calculated the poles of rotation (table S1)for the angular velocities of the major tectonicplates that were predicted by the dynamic modeland compared them with the latest NNR kine-matic model, MORVEL (Fig. 1D) (12). The ve-locity of any given patch on the surface of ourdynamic model was parameterized by an angularvelocity possessing a pole position. The smallscatter in the pole positions for these patches(blue dots) shows that the plates are behavingalmost rigidly at the stress levels output by thedynamic model and for an effective viscosity ofthe plates of 1 × 10²³ Pa · s. A comparison of the
Fig. 1. (A) Absolute viscosity model (top 100 km) that provided a best fit toour observations. (B) Kinematic NNR model from (11) (blue arrows), along withpredicted velocities from our global dynamic model (red arrows) in an NNRframe. The dynamic model includes contributions from both coupling with whole-mantle convection and lithosphere structure and topography. (C) Same as in(B), except the predicted velocities (red arrows) are from mantle tractions only.
(D) Average poles of rotation of major tectonic plates (yellow stars) predictedby the dynamic model on top of individually inferred poles from relativelyundeformed patches on the respective plates (blue dots). The NNR MORVEL polesfrom (12) are shown as black dots within their respective 95% confidence levelerror ellipses (in red). PAC, Pacific; NAM, North America; SAM, South America;ARB, Arabia; NUB, Nubia; NAZ, Nazca; EUR, Eurasia; and AUS, Australia.
www.sciencemag.org SCIENCE VOL 335 17 FEBRUARY 2012 839
REPORTS
on
Feb
ruar
y 19
, 201
2w
ww
.sci
ence
mag
.org
Dow
nloa
ded
from
poles of rotation from the NNR MORVEL mod-el (red 95% confidence ellipse) with the averagepole positions (yellow stars) shows that the pre-dictions for the North and the South Americanplates are nearly perfect (Fig. 1D and table S1).The predicted poles of the Pacific, Europe, Nubia,Nazca, and Arabia plates also lie fairly close tothe respective poles of the kinematic MORVELmodel.
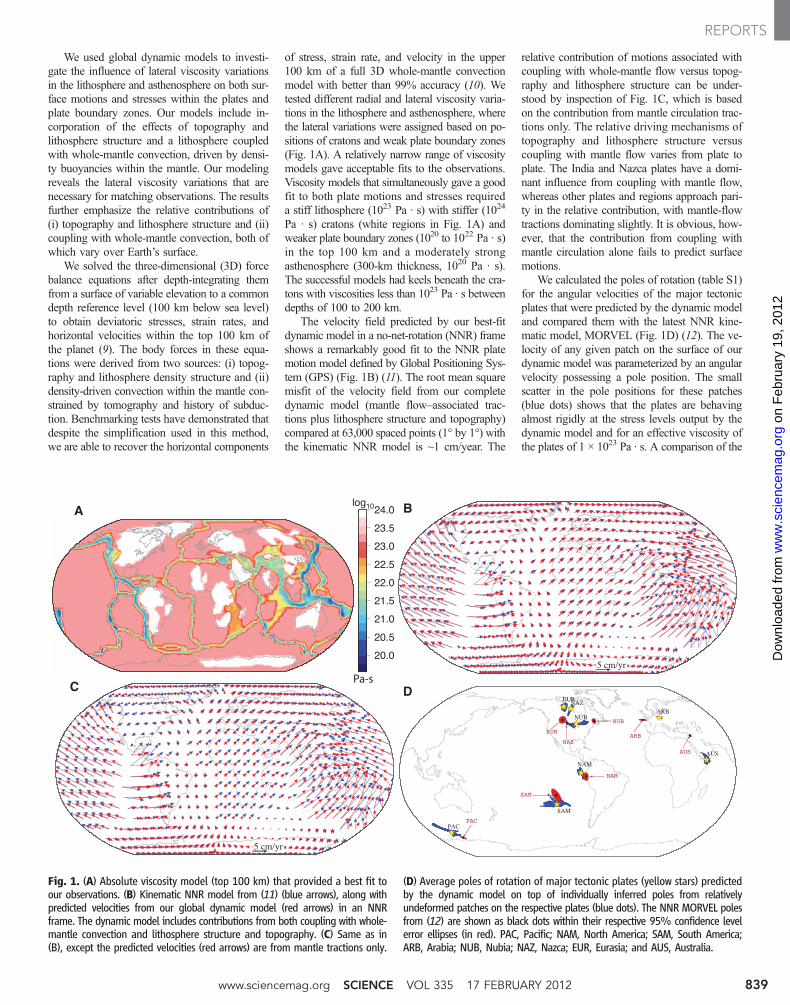
Comparison of relative surface motions pro-vided by our best-fit dynamic model in selectedframes of reference with GPS observations (11)shows that the dynamic model is predicting mo-tions in both the plates and plate boundary zones(Fig. 2, A to C). The poles of rotation for therelative angular velocities predicted by the dy-namic model (red stars) are, in most cases, closeto angular velocities (blue stars) from the latestkinematic plate-motion estimates (13). The gen-
eral agreement of the predicted velocities fromthe dynamic model to the GPS vectors demon-strates that the model is predicting the correctdeformation tensor field within plate boundaryzones, including diffuse plate boundary zones,which is a difficult problem for global dynamicmodels.
Earth’s lithospheric stress field gives an in-dication of the driving forces that cause conti-nental deformation and form mountain rangesand plateaus (1, 14, 15). We compared the ori-entation and style of our predicted deviatoricstresses with the World Stress Map (WSM) data(16) in the intraplate areas. Our predicted mostcompressive principal stresses (Fig. 3B) are ingood agreement with the WSM horizontal mostcompressive stress (SHmax) directions and style(Fig. 3A). We show the stress results in three im-portant continental deformation zones: western
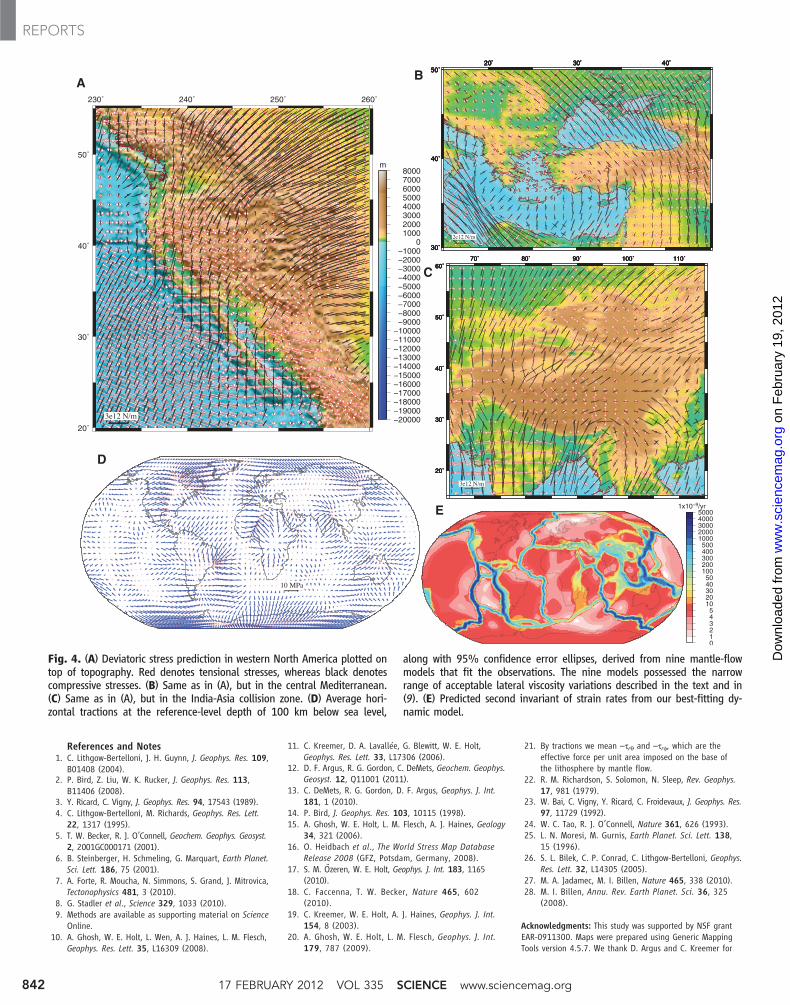
North America, the India-Asia collision zone,and the central Mediterranean. In western NorthAmerica, deviatoric stresses from the dynamicmodel predict the opening of the Basin and RangeProvince, strike-slip along the San Andreas sys-tem, compression within the Juan de Fuca trench,and north-south compression over the Cascadiaforearc (Fig. 4A). In the central Mediterraneanand eastern Turkey regions, the modeled stresses(Fig. 4B) are compatible with findings of theknown deformation field (17). The Hellenic arcdisplays trench-perpendicular compression, where-as clear strike-slip deformation is predicted alongthe North Anatolian fault. Improvement in pre-diction for these continental regions is possiblethrough incorporation of the influence of smaller-scale convection (18). The predicted deviatoricstresses in Tibet show a predominantly strike-slipstyle of deformation (alsomixedwith normal fault-
Fig. 2. (A) Model velocity vectors (redarrows) from our global dynamic mod-el plotted along with GPS vectors (11)(blue arrows) over North America in aPacific fixed reference frame. A zoom-in view of the western U.S. region isshown in the inset map. Poles predictedby the dynamic model (red star) andthe MORVEL plate-motion model (13)(blue star) are shown for PAC-NAM rela-tive motion. (B) Same as in (A), but withNubia fixed. Poles are for ARB-EUR rel-ativemotion. (C) Same as in (A), but withIndia fixed. Poles are for AUS-Indiarelative motion.
17 FEBRUARY 2012 VOL 335 SCIENCE www.sciencemag.org840
REPORTS
on
Feb
ruar
y 19
, 201
2w
ww
.sci
ence
mag
.org
Dow
nloa
ded
from
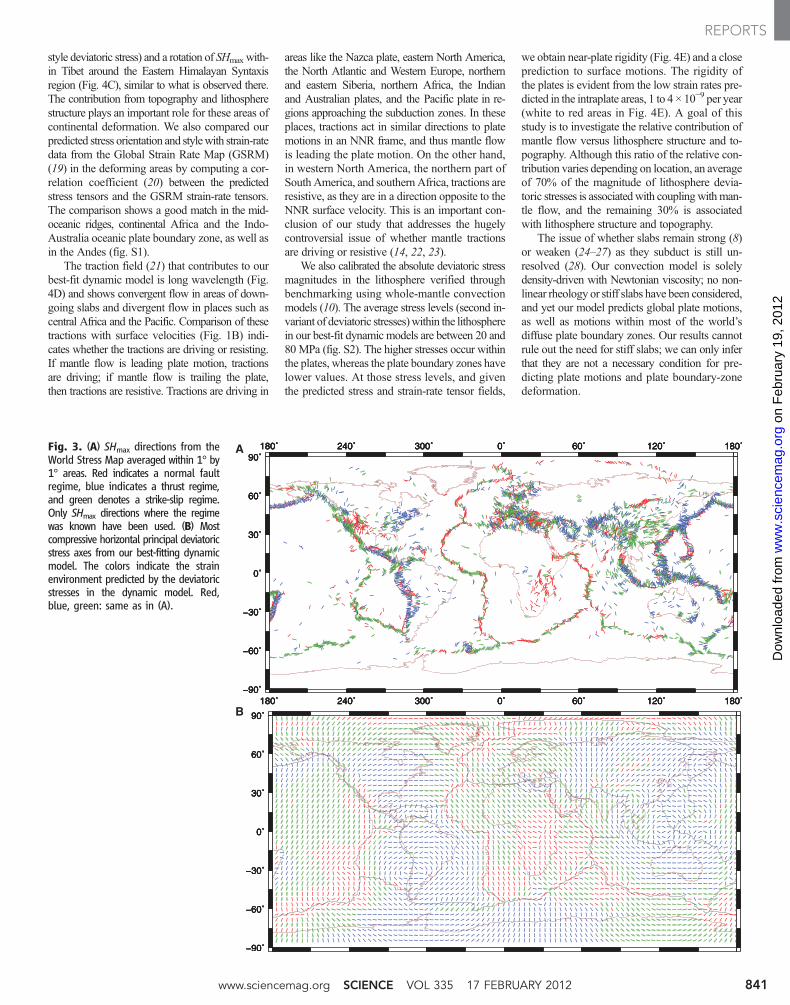
style deviatoric stress) and a rotation of SHmax with-in Tibet around the Eastern Himalayan Syntaxisregion (Fig. 4C), similar to what is observed there.The contribution from topography and lithospherestructure plays an important role for these areas ofcontinental deformation. We also compared ourpredicted stress orientation and stylewith strain-ratedata from the Global Strain Rate Map (GSRM)(19) in the deforming areas by computing a cor-relation coefficient (20) between the predictedstress tensors and the GSRM strain-rate tensors.The comparison shows a good match in the mid-oceanic ridges, continental Africa and the Indo-Australia oceanic plate boundary zone, as well asin the Andes (fig. S1).
The traction field (21) that contributes to ourbest-fit dynamic model is long wavelength (Fig.4D) and shows convergent flow in areas of down-going slabs and divergent flow in places such ascentral Africa and the Pacific. Comparison of thesetractions with surface velocities (Fig. 1B) indi-cates whether the tractions are driving or resisting.If mantle flow is leading plate motion, tractionsare driving; if mantle flow is trailing the plate,then tractions are resistive. Tractions are driving in
areas like the Nazca plate, eastern North America,the North Atlantic and Western Europe, northernand eastern Siberia, northern Africa, the Indianand Australian plates, and the Pacific plate in re-gions approaching the subduction zones. In theseplaces, tractions act in similar directions to platemotions in an NNR frame, and thus mantle flowis leading the plate motion. On the other hand,in western North America, the northern part ofSouth America, and southern Africa, tractions areresistive, as they are in a direction opposite to theNNR surface velocity. This is an important con-clusion of our study that addresses the hugelycontroversial issue of whether mantle tractionsare driving or resistive (14, 22, 23).
We also calibrated the absolute deviatoric stressmagnitudes in the lithosphere verified throughbenchmarking using whole-mantle convectionmodels (10). The average stress levels (second in-variant of deviatoric stresses)within the lithospherein our best-fit dynamic models are between 20 and80 MPa (fig. S2). The higher stresses occur withinthe plates, whereas the plate boundary zones havelower values. At those stress levels, and giventhe predicted stress and strain-rate tensor fields,
we obtain near-plate rigidity (Fig. 4E) and a closeprediction to surface motions. The rigidity ofthe plates is evident from the low strain rates pre-dicted in the intraplate areas, 1 to 4 × 10⁻⁹ per year(white to red areas in Fig. 4E). A goal of thisstudy is to investigate the relative contribution ofmantle flow versus lithosphere structure and to-pography. Although this ratio of the relative con-tribution varies depending on location, an averageof 70% of the magnitude of lithosphere devia-toric stresses is associatedwith couplingwithman-tle flow, and the remaining 30% is associatedwith lithosphere structure and topography.
The issue of whether slabs remain strong (8)or weaken (24–27) as they subduct is still un-resolved (28). Our convection model is solelydensity-driven with Newtonian viscosity; no non-linear rheology or stiff slabs have been considered,and yet our model predicts global plate motions,as well as motions within most of the world’sdiffuse plate boundary zones. Our results cannotrule out the need for stiff slabs; we can only inferthat they are not a necessary condition for pre-dicting plate motions and plate boundary-zonedeformation.
Fig. 3. (A) SHmax directions from theWorld Stress Map averaged within 1° by1° areas. Red indicates a normal faultregime, blue indicates a thrust regime,and green denotes a strike-slip regime.Only SHmax directions where the regimewas known have been used. (B) Mostcompressive horizontal principal deviatoricstress axes from our best-fitting dynamicmodel. The colors indicate the strainenvironment predicted by the deviatoricstresses in the dynamic model. Red,blue, green: same as in (A).
www.sciencemag.org SCIENCE VOL 335 17 FEBRUARY 2012 841
REPORTS
on
Feb
ruar
y 19
, 201
2w
ww
.sci
ence
mag
.org
Dow
nloa
ded
from
References and Notes1. C. Lithgow-Bertelloni, J. H. Guynn, J. Geophys. Res. 109,
B01408 (2004).2. P. Bird, Z. Liu, W. K. Rucker, J. Geophys. Res. 113,
B11406 (2008).3. Y. Ricard, C. Vigny, J. Geophys. Res. 94, 17543 (1989).4. C. Lithgow-Bertelloni, M. Richards, Geophys. Res. Lett.
22, 1317 (1995).5. T. W. Becker, R. J. O’Connell, Geochem. Geophys. Geosyst.
2, 2001GC000171 (2001).6. B. Steinberger, H. Schmeling, G. Marquart, Earth Planet.
Sci. Lett. 186, 75 (2001).7. A. Forte, R. Moucha, N. Simmons, S. Grand, J. Mitrovica,
Tectonophysics 481, 3 (2010).8. G. Stadler et al., Science 329, 1033 (2010).9. Methods are available as supporting material on Science
Online.10. A. Ghosh, W. E. Holt, L. Wen, A. J. Haines, L. M. Flesch,
Geophys. Res. Lett. 35, L16309 (2008).
11. C. Kreemer, D. A. Lavallée, G. Blewitt, W. E. Holt,Geophys. Res. Lett. 33, L17306 (2006).
12. D. F. Argus, R. G. Gordon, C. DeMets, Geochem. Geophys.Geosyst. 12, Q11001 (2011).
13. C. DeMets, R. G. Gordon, D. F. Argus, Geophys. J. Int.181, 1 (2010).
14. P. Bird, J. Geophys. Res. 103, 10115 (1998).15. A. Ghosh, W. E. Holt, L. M. Flesch, A. J. Haines, Geology
34, 321 (2006).16. O. Heidbach et al., The World Stress Map Database
Release 2008 (GFZ, Potsdam, Germany, 2008).17. S. M. Özeren, W. E. Holt, Geophys. J. Int. 183, 1165
(2010).18. C. Faccenna, T. W. Becker, Nature 465, 602
(2010).19. C. Kreemer, W. E. Holt, A. J. Haines, Geophys. J. Int.
154, 8 (2003).20. A. Ghosh, W. E. Holt, L. M. Flesch, Geophys. J. Int.
179, 787 (2009).
21. By tractions we mean –trq and –trf, which are theeffective force per unit area imposed on the base ofthe lithosphere by mantle flow.
22. R. M. Richardson, S. Solomon, N. Sleep, Rev. Geophys.17, 981 (1979).
23. W. Bai, C. Vigny, Y. Ricard, C. Froidevaux, J. Geophys. Res.97, 11729 (1992).
24. W. C. Tao, R. J. O’Connell, Nature 361, 626 (1993).25. L. N. Moresi, M. Gurnis, Earth Planet. Sci. Lett. 138,
15 (1996).26. S. L. Bilek, C. P. Conrad, C. Lithgow-Bertelloni, Geophys.
Res. Lett. 32, L14305 (2005).27. M. A. Jadamec, M. I. Billen, Nature 465, 338 (2010).28. M. I. Billen, Annu. Rev. Earth Planet. Sci. 36, 325
(2008).
Acknowledgments: This study was supported by NSF grantEAR-0911300. Maps were prepared using Generic MappingTools version 4.5.7. We thank D. Argus and C. Kreemer for
Fig. 4. (A) Deviatoric stress prediction in western North America plotted ontop of topography. Red denotes tensional stresses, whereas black denotescompressive stresses. (B) Same as in (A), but in the central Mediterranean.(C) Same as in (A), but in the India-Asia collision zone. (D) Average hori-zontal tractions at the reference-level depth of 100 km below sea level,
along with 95% confidence error ellipses, derived from nine mantle-flowmodels that fit the observations. The nine models possessed the narrowrange of acceptable lateral viscosity variations described in the text and in(9). (E) Predicted second invariant of strain rates from our best-fitting dy-namic model.
17 FEBRUARY 2012 VOL 335 SCIENCE www.sciencemag.org842
REPORTS
on
Feb
ruar
y 19
, 201
2w
ww
.sci
ence
mag
.org
Dow
nloa
ded
from
sharing their kinematic models and GPS data for comparisonwith the dynamic models, L. Wen for help with using hiscode, and three anonymous reviewers for their commentsthat substantially improved the manuscript. We are gratefulto UNAVCO, Incorporated Research Institutions for Seismology,NSF-EarthScope, International GNSS Service, NASA, andcountless researchers for facilitation and availability of
geodetic and seismic data. The codes are available as azip file as part of the supporting online material.
Supporting Online Materialwww.sciencemag.org/cgi/content/full/335/6070/838/DC1MethodsSOM Text
Figs. S1 and S2Table S1References (29–37)Computer Codes
20 September 2011; accepted 24 January 201210.1126/science.1214209
Cyanophora paradoxa GenomeElucidates Origin of Photosynthesisin Algae and PlantsDana C. Price,1 Cheong Xin Chan,1* Hwan Su Yoon,2,3 Eun Chan Yang,2 Huan Qiu,2
Andreas P. M. Weber,4 Rainer Schwacke,5 Jeferson Gross,1 Nicolas A. Blouin,6 Chris Lane,6
Adrián Reyes-Prieto,7 Dion G. Durnford,8 Jonathan A. D. Neilson,8 B. Franz Lang,9
Gertraud Burger,9 Jürgen M. Steiner,10 Wolfgang Löffelhardt,11 Jonathan E. Meuser,12
Matthew C. Posewitz,13 Steven Ball,14 Maria Cecilia Arias,14 Bernard Henrissat,15
Pedro M. Coutinho,15 Stefan A. Rensing,16,17,18 Aikaterini Symeonidi,16,17
Harshavardhan Doddapaneni,19 Beverley R. Green,20 Veeran D. Rajah,1
Jeffrey Boore,21,22 Debashish Bhattacharya1†
The primary endosymbiotic origin of the plastid in eukaryotes more than 1 billion years ago led to theevolution of algae and plants. We analyzed draft genome and transcriptome data from the basallydiverging alga Cyanophora paradoxa and provide evidence for a single origin of the primary plastid in theeukaryote supergroup Plantae. C. paradoxa retains ancestral features of starch biosynthesis, fermentation,and plastid protein translocation common to plants and algae but lacks typical eukaryotic light-harvestingcomplex proteins. Traces of an ancient link to parasites such as Chlamydiae were found in the genomesof C. paradoxa and other Plantae. Apparently, Chlamydia-like bacteria donated genes that allow exportof photosynthate from the plastid and its polymerization into storage polysaccharide in the cytosol.
Eukaryote evolution has largely been shapedby the process of primary endosymbiosis,whereby bacterial cells were taken up and
over time evolved into double membrane–boundorganelles, the plastid and the mitochondrion[e.g., (1, 2)]. The cyanobacterium-derived plastidis found in diverse photosynthetic organisms,including Glaucophyta, Rhodophyta, and greenalgae and their land plant descendants (theViridiplantae). These three lineages are postu-lated to form the monophyletic group Plantae (orArchaeplastida) (3–6), a hypothesis that suggeststhe primary cyanobacterial endosymbiosis oc-curred exclusively in their single common ances-tor. Plastid gene trees demonstrate a single originof the Plantae (5, 7); however, many nuclear, mul-tiprotein phylogenies provide little (8) or no support(9, 10) for their monophyly. These latter resultsmay reflect a reticulate ancestry among genesthat can mislead phylogenetic inference (11).Furthermore, glaucophytes retain ancestral cya-nobacterial features not found in other Plantae(12)—such as the presence of peptidoglycan be-tween the two bounding membranes of the plastid(13)—that cast doubt on their evolutionary his-tory. It is therefore unclear whether the Plantaehost and its plastid, with its associated complexmachinery (e.g., for plastid protein import andsolute transport) (14, 15), had a single origin ormultiple origins. To elucidate the evolutionaryhistory of key algal and land plant traits and to
test Plantaemonophyly, we have generated a draftassembly of the≈70Mbp nuclear genome from theglaucophyte Cyanophora paradoxa CCMP329(Pringsheim strain) (Fig. 1A).
A total of 27,921 C. paradoxa proteins werepredicted from the genome data, and 4628 hadsignificant BLASTp hits (e ≤ 10−10) to prokaryoteand eukaryote genome data in our comprehensivelocal database (table S1). Using phylogenomics(16), we generated 4445 maximum likelihoodtrees from the C. paradoxa proteins and foundthat >60% support a sister-group relationshipbetween glaucophytes and red and/or green algaewith a bootstrap value ≥90% (Fig. 1B and fig.S1). The Plantae clade in many of these trees is,however, interrupted by chlorophyll a + c contain-ing “chromalveolates.” An example of this typeof tree is fructose-1,6-bisphosphatase (Fig. 1Cand fig. S2), which has cytosolic and plastidicisoforms. The gene for this enzyme, found instramenopiles (e.g., diatoms) and haptophytes,originated from the red algal secondary endo-symbiont that gave rise to the plastid in these taxa(2, 9). This sort of intracellular gene transfer asso-ciated with endosymbiosis (EGT) has greatlyenriched algal and land plant genomes (17, 18).
We estimated the “footprint” of cyanobacterium-derived EGT in Plantae genomes. The proportionof cyanobacterium-derived nuclear genes variesfrom 18% inArabidopsis thaliana (19) to ~7% inmesophilic red algae and 6% in Chlamydomonas
reinhardtii (20, 21). Phylogenomic analysis ofthe predicted C. paradoxa proteins showed 274to be of cyanobacterial provenance (22). Thisconstitutes ~6% of proteins in the glaucophytethat have significant BLASTp hits (i.e., 274 out of4628), as found in other algae (20, 21). BLASTpanalysis identified 2029 proteins that are puta-tively destined for the plastid, of which 293 con-tain the transit sequence for plastid import [identifiedby the presence of phenylalanine (F) within thefirst four amino acids:MF,MAF,MNAF,MSAF,and MAAF] (23, 24) (fig. S4B). Of these 293proteins, 80% are derived from Cyanobacteria.
Another source of foreign genes in Plantaeis horizontal gene transfer (HGT), which is notassociated with endosymbiosis. Using 35,126bacterial sequences as a query, we found 444noncyanobacterial gene families with a commonorigin shared amongstBacteria andPlantae.Amongthem, 15 genes are present in all three Plantaephyla. An example of a gene derived fromBacte-ria after an ancient HGT event that is shared by
1Department of Ecology, Evolution, and Natural Resources andInstitute of Marine and Coastal Sciences, Rutgers University,New Brunswick, NJ 08901, USA. 2Bigelow Laboratory for OceanSciences, West Boothbay Harbor, ME 04575, USA. 3Depart-ment of Biological Sciences, Sungkyunkwan University, Suwon440-746, Korea. 4Institute for Plant Biochemistry, Heinrich-Heine-University, D-40225 Duesseldorf, Germany. 5BotanicalInstitute, Biocenter Cologne, University of Cologne, ZülpicherStrasse 47b, 50674 Cologne, Germany. 6Department of Bio-logical Sciences, University of Rhode Island, Kingston, RI 02881,USA. 7Canadian Institute for Advanced Research, Departmentof Biology, University of New Brunswick, Fredericton, NewBrunswick E3B 5A3, Canada. 8Department of Biology, Uni-versity of New Brunswick, Fredericton, New Brunswick E3B 5A3,Canada. 9Centre Robert Cedergren, Département de Biochimie,Université de Montréal, Montréal, Québec H3C 3J7, Canada.10Department ofBiology/Plant Physiology,Martin-Luther-UniversityHalle-Wittenberg, Germany. 11Max F. Perutz Laboratories, De-partment of Biochemistry and Cell Biology, University of Vienna,Vienna, Austria. 12Department of Civil and Environmental En-gineering, Colorado School of Mines, Golden, CO 80401, USA.13Department of Chemistry and Geochemistry, Colorado Schoolof Mines, Golden, CO 80401, USA. 14Unité de GlycobiologieStructurale et Fonctionnelle, UMR 8576 CNRS-USTL, Universitédes Sciences et Technologies de Lille, 59655 Villeneuve d’AscqCedex, France. 15Universités Aix-Marseille I & II, Case 932, 163Avenue de Luminy, 13288 Marseille Cedex 9, France. 16Facultyof Biology, University of Freiburg, Freiburg, Germany. 17FRISYSFreiburg Initiative in Systems Biology, University of Freiburg,Freiburg, Germany. 18BIOSS Centre for Biological SignallingStudies, University of Freiburg, Freiburg, Germany. 19Roy J. CarverCenter for Genomics, Department of Biology, University of Iowa,Iowa City, IA, 52242, USA. 20Department of Botany, University ofBritish Columbia, Vancouver, British Columbia V6T 1Z4, Canada.21Genome Project Solutions, Hercules, CA 94547, USA. 22Depart-ment of Integrative Biology, University of California, Berkeley,CA 94720, USA.
*Present address: Institute for Molecular Bioscience, Univer-sity of Queensland, Brisbane, QLD 4072, Australia.†To whom correspondence should be addressed. E-mail:[email protected]
www.sciencemag.org SCIENCE VOL 335 17 FEBRUARY 2012 843
REPORTS
on
Feb
ruar
y 19
, 201
2w
ww
.sci
ence
mag
.org
Dow
nloa
ded
from


![Link to VoR: Angewandte Angew. Chem. Angew. Chem. Int. Ed ...liuyi-group.dlut.edu.cn/yjcg/28.2018-Angewandte_In... · [9a,9b] Second, microwave-assisted hydrothermal Figure 1. Schematic](https://img.pdfslide.net/doc/110x75/5f926cbb573a2573600d1a2e/link-to-vor-angewandte-angew-chem-angew-chem-int-ed-liuyi-groupdluteducnyjcg282018-angewandtein.jpg)