Embed Size (px)
Citation preview

3rd of June 2015 Mr Jan Pettersson
General Presentation KPIs and benchmarking
1
P R I M E Platform of Rail Infrastructure
Managers in Europe
• KPIs for Capacity
• KPIs for Environment
• KPIs for Cost efficiency
• Pilot 1
• Time plan
• Proposal for decision
Agenda

Our subjects
Resources
Finance
Charging
Railway Infrastructure
Assets types
(i.e. ERTMS)
Asset quality
Condition
Robustness
Satisfied
Stakeholders
Safety
Punctuality
Capacity
Utilisation
Environment
Cost Efficiency
Capability, Intermobility,
Interoperability tbd Customer
satisfaction
Bac
kgro
un
d in
form
atio
n
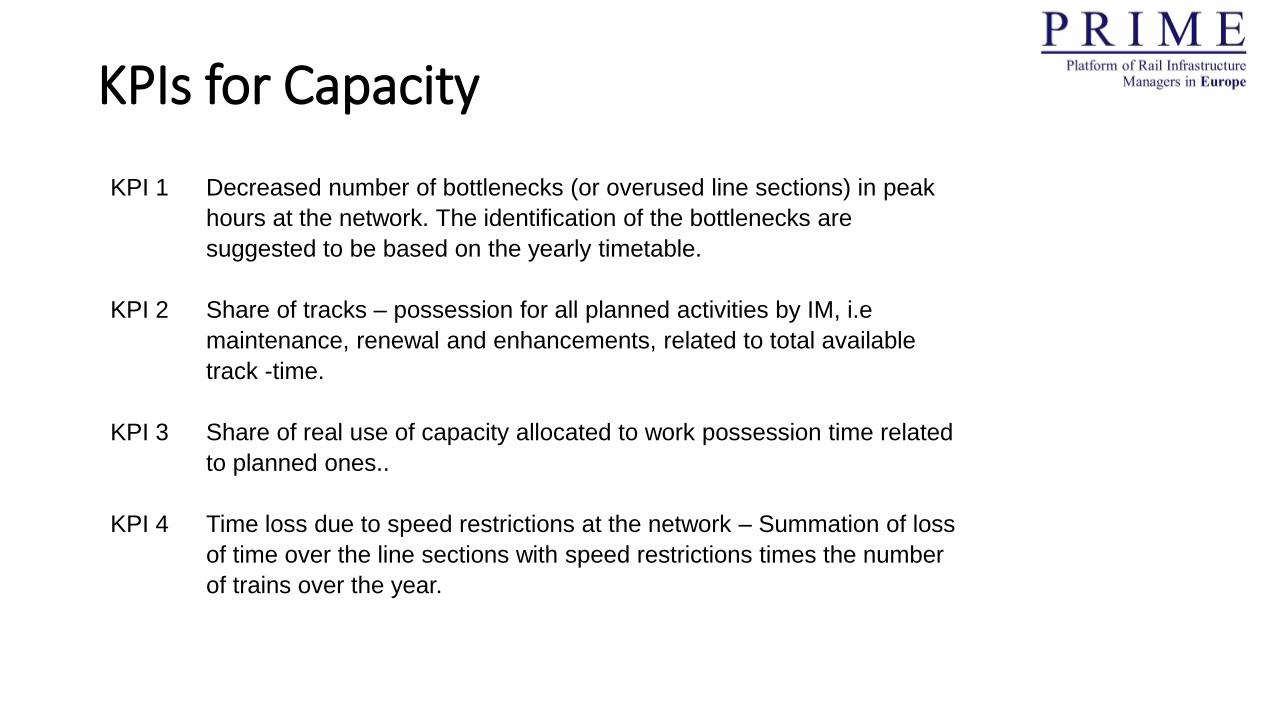
KPIs for Capacity
KPI 1 Decreased number of bottlenecks (or overused line sections) in peak
hours at the network. The identification of the bottlenecks are
suggested to be based on the yearly timetable.
KPI 2 Share of tracks – possession for all planned activities by IM, i.e
maintenance, renewal and enhancements, related to total available
track -time.
KPI 3 Share of real use of capacity allocated to work possession time related
to planned ones..
KPI 4 Time loss due to speed restrictions at the network – Summation of loss
of time over the line sections with speed restrictions times the number
of trains over the year.
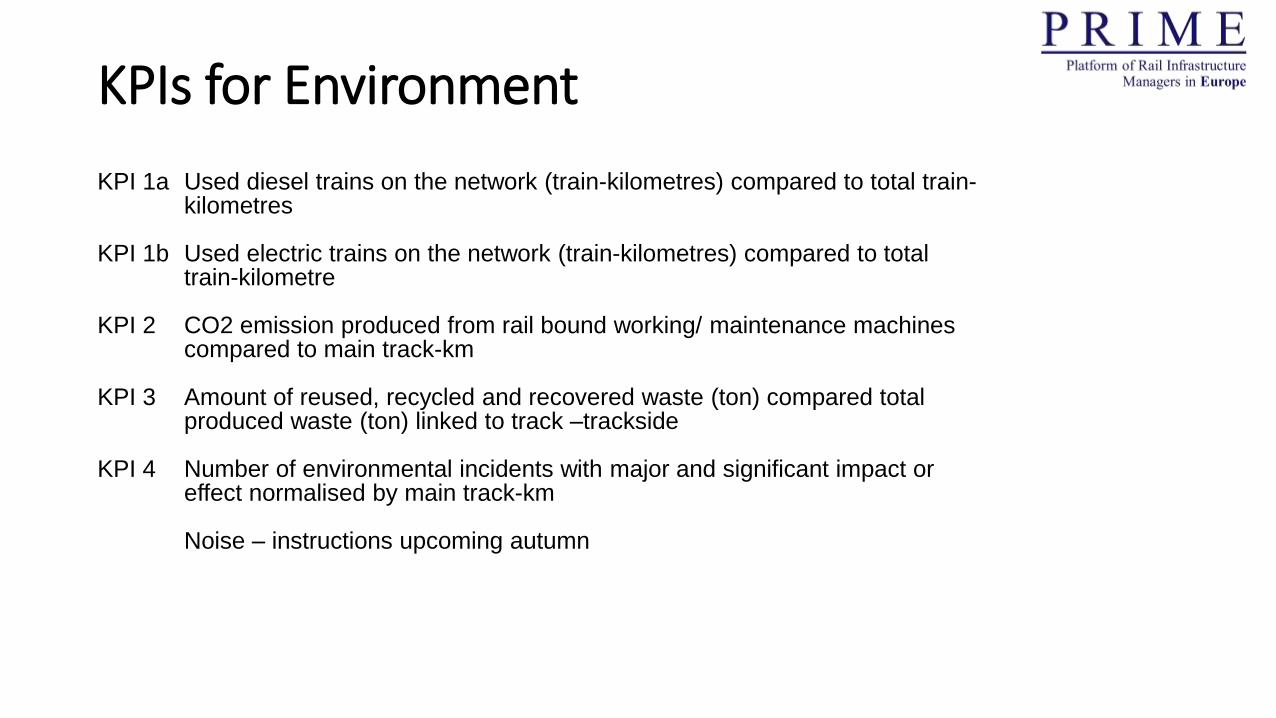
KPIs for Environment
KPI 1a Used diesel trains on the network (train-kilometres) compared to total train- kilometres KPI 1b Used electric trains on the network (train-kilometres) compared to total train-kilometre KPI 2 CO2 emission produced from rail bound working/ maintenance machines compared to main track-km KPI 3 Amount of reused, recycled and recovered waste (ton) compared total produced waste (ton) linked to track –trackside KPI 4 Number of environmental incidents with major and significant impact or effect normalised by main track-km
Noise – instructions upcoming autumn
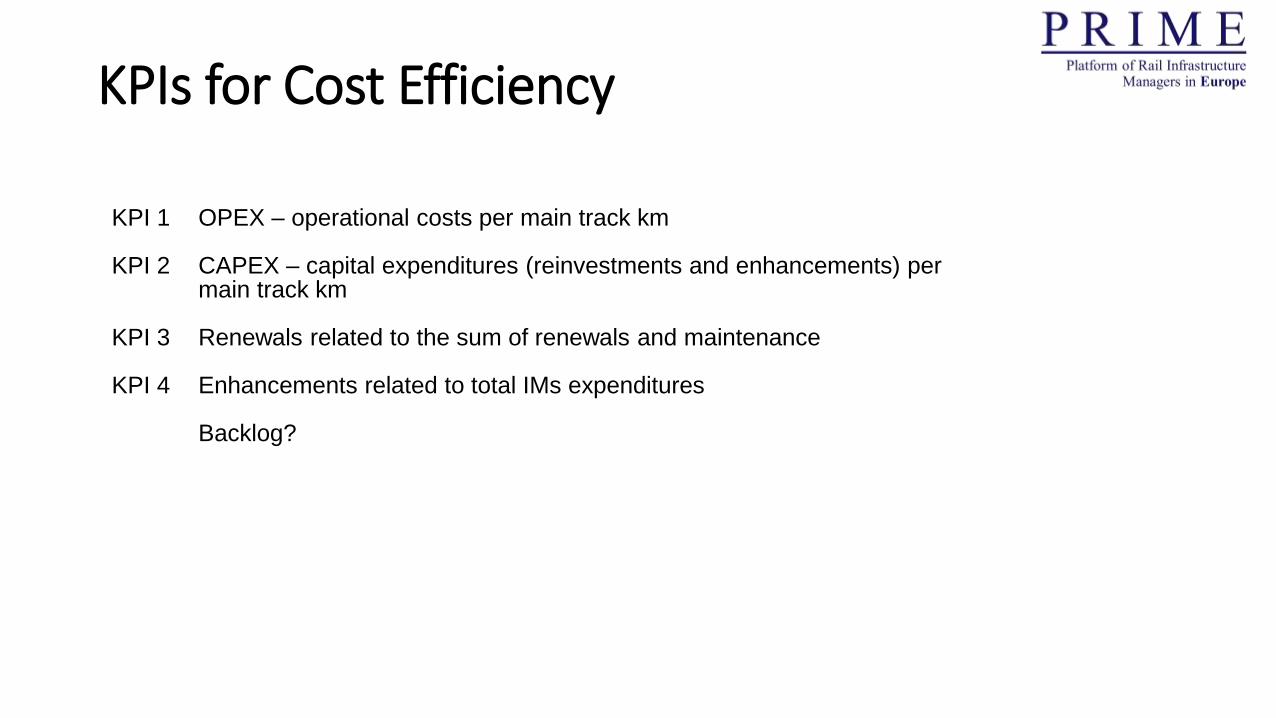
KPIs for Cost Efficiency
KPI 1 OPEX – operational costs per main track km KPI 2 CAPEX – capital expenditures (reinvestments and enhancements) per main track km KPI 3 Renewals related to the sum of renewals and maintenance KPI 4 Enhancements related to total IMs expenditures
Backlog?
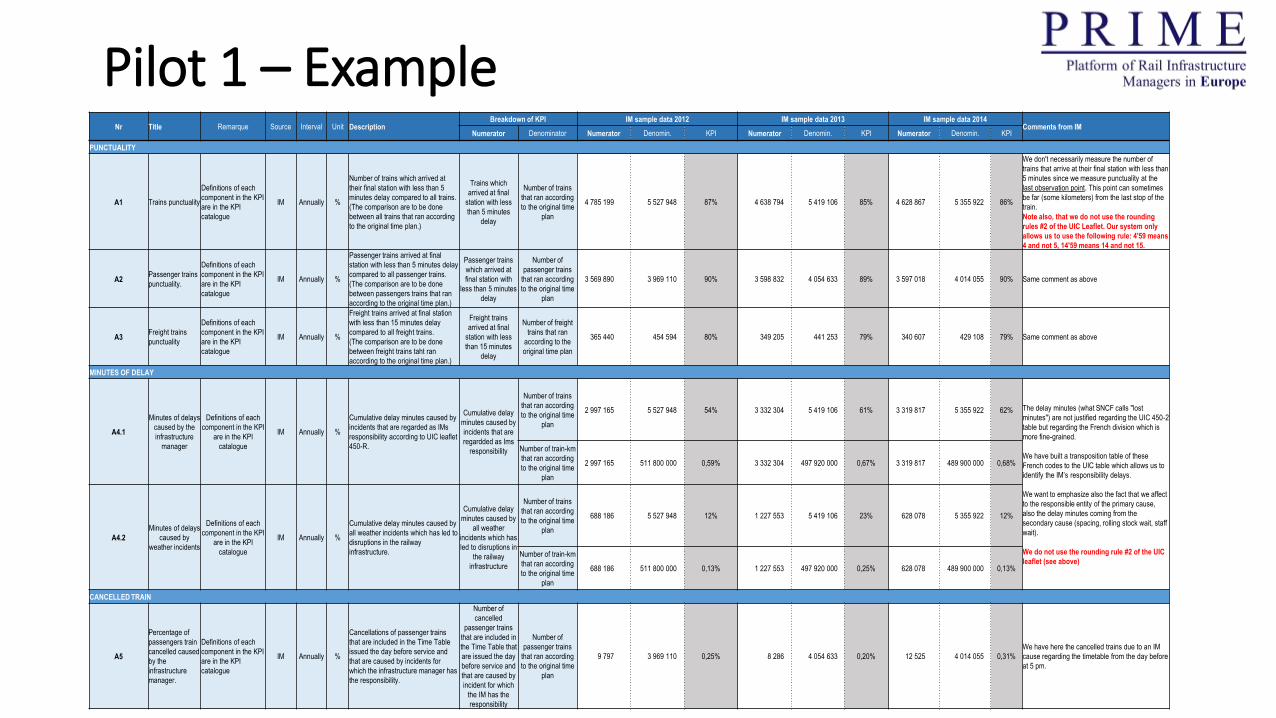
Pilot 1 – Example Nr Title Remarque Source Interval Unit Description
Breakdown of KPI IM sample data 2012 IM sample data 2013 IM sample data 2014 Comments from IM
Numerator Denominator Numerator Denomin. KPI Numerator Denomin. KPI Numerator Denomin. KPI
PUNCTUALITY
A1 Trains punctuality
Definitions of each
component in the KPI
are in the KPI
catalogue
IM Annually %
Number of trains which arrived at
their final station with less than 5
minutes delay compared to all trains.
(The comparison are to be done
between all trains that ran according
to the original time plan.)
Trains which
arrived at final
station with less
than 5 minutes
delay
Number of trains
that ran according
to the original time
plan
4 785 199 5 527 948 87% 4 638 794 5 419 106 85% 4 628 867 5 355 922 86%
We don't necessarily measure the number of
trains that arrive at their final station with less than
5 minutes since we measure punctuality at the
last observation point. This point can sometimes
be far (some kilometers) from the last stop of the
train.
Note also, that we do not use the rounding
rules #2 of the UIC Leaflet. Our system only
allows us to use the following rule: 4'59 means
4 and not 5, 14'59 means 14 and not 15.
A2 Passenger trains
punctuality.
Definitions of each
component in the KPI
are in the KPI
catalogue
IM Annually %
Passenger trains arrived at final
station with less than 5 minutes delay
compared to all passenger trains.
(The comparison are to be done
between passengers trains that ran
according to the original time plan.)
Passenger trains
which arrived at
final station with
less than 5 minutes
delay
Number of
passenger trains
that ran according
to the original time
plan
3 569 890 3 969 110 90% 3 598 832 4 054 633 89% 3 597 018 4 014 055 90% Same comment as above
A3 Freight trains
punctuality
Definitions of each
component in the KPI
are in the KPI
catalogue
IM Annually %
Freight trains arrived at final station
with less than 15 minutes delay
compared to all freight trains.
(The comparison are to be done
between freight trains taht ran
according to the original time plan.)
Freight trains
arrived at final
station with less
than 15 minutes
delay
Number of freight
trains that ran
according to the
original time plan
365 440 454 594 80% 349 205 441 253 79% 340 607 429 108 79% Same comment as above
MINUTES OF DELAY
A4.1
Minutes of delays
caused by the
infrastructure
manager
Definitions of each
component in the KPI
are in the KPI
catalogue
IM Annually %
Cumulative delay minutes caused by
incidents that are regarded as IMs
responsibility according to UIC leaflet
450-R.
Cumulative delay
minutes caused by
incidents that are
regardded as Ims
responsibility
Number of trains
that ran according
to the original time
plan
2 997 165 5 527 948 54% 3 332 304 5 419 106 61% 3 319 817 5 355 922 62% The delay minutes (what SNCF calls "lost
minutes") are not justified regarding the UIC 450-2
table but regarding the French division which is
more fine-grained.
We have built a transposition table of these
French codes to the UIC table which allows us to
identify the IM’s responsibility delays.
We want to emphasize also the fact that we affect
to the responsible entity of the primary cause,
also the delay minutes coming from the
secondary cause (spacing, rolling stock wait, staff
wait).
We do not use the rounding rule #2 of the UIC
leaflet (see above)
Number of train-km
that ran according
to the original time
plan
2 997 165 511 800 000 0,59% 3 332 304 497 920 000 0,67% 3 319 817 489 900 000 0,68%
A4.2
Minutes of delays
caused by
weather incidents
Definitions of each
component in the KPI
are in the KPI
catalogue
IM Annually %
Cumulative delay minutes caused by
all weather incidents which has led to
disruptions in the railway
infrastructure.
Cumulative delay
minutes caused by
all weather
incidents which has
led to disruptions in
the railway
infrastructure
Number of trains
that ran according
to the original time
plan
688 186 5 527 948 12% 1 227 553 5 419 106 23% 628 078 5 355 922 12%
Number of train-km
that ran according
to the original time
plan
688 186 511 800 000 0,13% 1 227 553 497 920 000 0,25% 628 078 489 900 000 0,13%
CANCELLED TRAIN
A5
Percentage of
passengers train
cancelled caused
by the
infrastructure
manager.
Definitions of each
component in the KPI
are in the KPI
catalogue
IM Annually %
Cancellations of passenger trains
that are included in the Time Table
issued the day before service and
that are caused by incidents for
which the infrastructure manager has
the responsibility.
Number of
cancelled
passenger trains
that are included in
the Time Table that
are issued the day
before service and
that are caused by
incident for which
the IM has the
responsibility
Number of
passenger trains
that ran according
to the original time
plan
9 797 3 969 110 0,25% 8 286 4 054 633 0,20% 12 525 4 014 055 0,31%
We have here the cancelled trains due to an IM
cause regarding the timetable from the day before
at 5 pm.
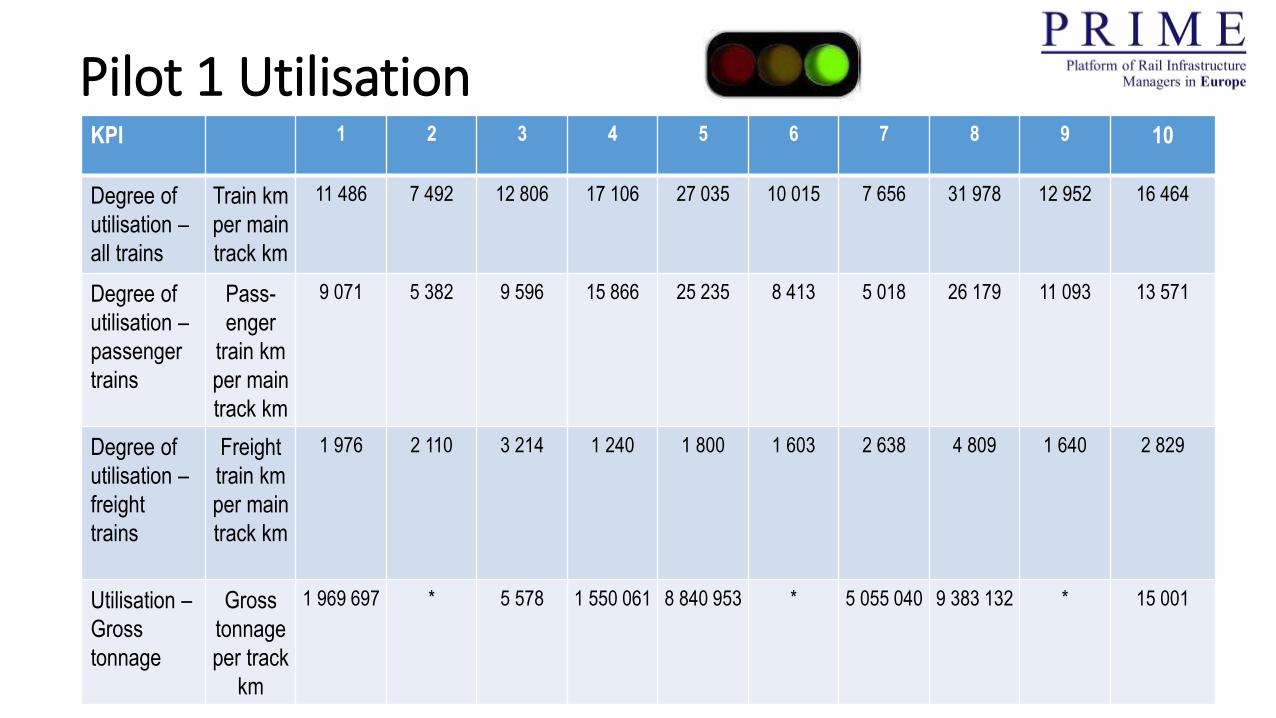
Pilot 1 Utilisation KPI 1 2 3 4 5 6 7 8 9 10
Degree of
utilisation –
all trains
Train km
per main
track km
11 486 7 492 12 806 17 106 27 035
10 015 7 656 31 978 12 952 16 464
Degree of
utilisation –
passenger
trains
Pass-
enger
train km
per main
track km
9 071 5 382 9 596 15 866 25 235
8 413 5 018 26 179 11 093 13 571
Degree of
utilisation –
freight
trains
Freight
train km
per main
track km
1 976 2 110 3 214 1 240 1 800 1 603 2 638 4 809 1 640 2 829
Utilisation –
Gross
tonnage
Gross
tonnage
per track
km
1 969 697
* 5 578 1 550 061 8 840 953 * 5 055 040 9 383 132 * 15 001
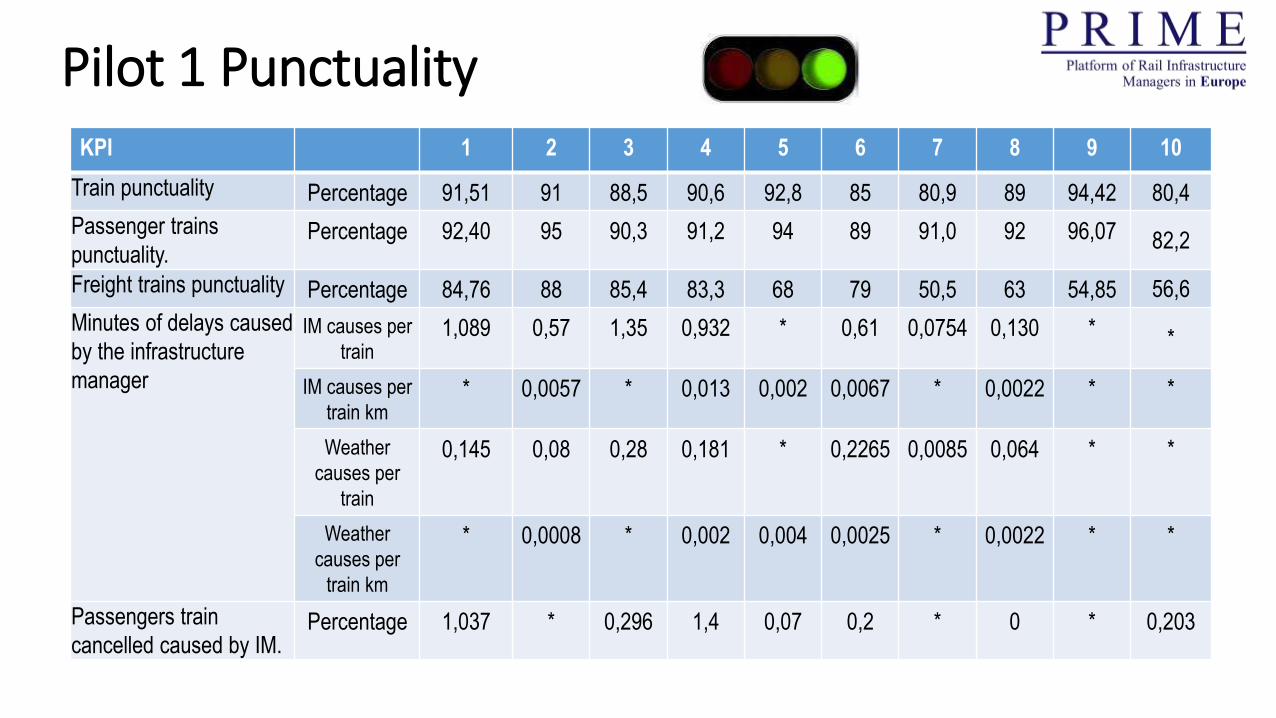
Pilot 1 Punctuality KPI 1 2 3 4 5 6 7 8 9 10
Train punctuality Percentage 91,51 91 88,5 90,6 92,8 85 80,9 89 94,42 80,4
Passenger trains
punctuality. Percentage 92,40 95 90,3 91,2 94 89 91,0 92 96,07 82,2
Freight trains punctuality Percentage 84,76 88 85,4 83,3 68 79 50,5 63 54,85 56,6
Minutes of delays caused
by the infrastructure
manager
IM causes per
train 1,089 0,57 1,35 0,932 * 0,61 0,0754 0,130 * *
IM causes per
train km * 0,0057 * 0,013 0,002 0,0067 * 0,0022 * *
Weather
causes per
train
0,145 0,08 0,28 0,181 * 0,2265 0,0085 0,064 * *
Weather
causes per
train km
* 0,0008 * 0,002 0,004 0,0025 * 0,0022 * *
Passengers train
cancelled caused by IM. Percentage 1,037 * 0,296 1,4 0,07 0,2 * 0 * 0,203
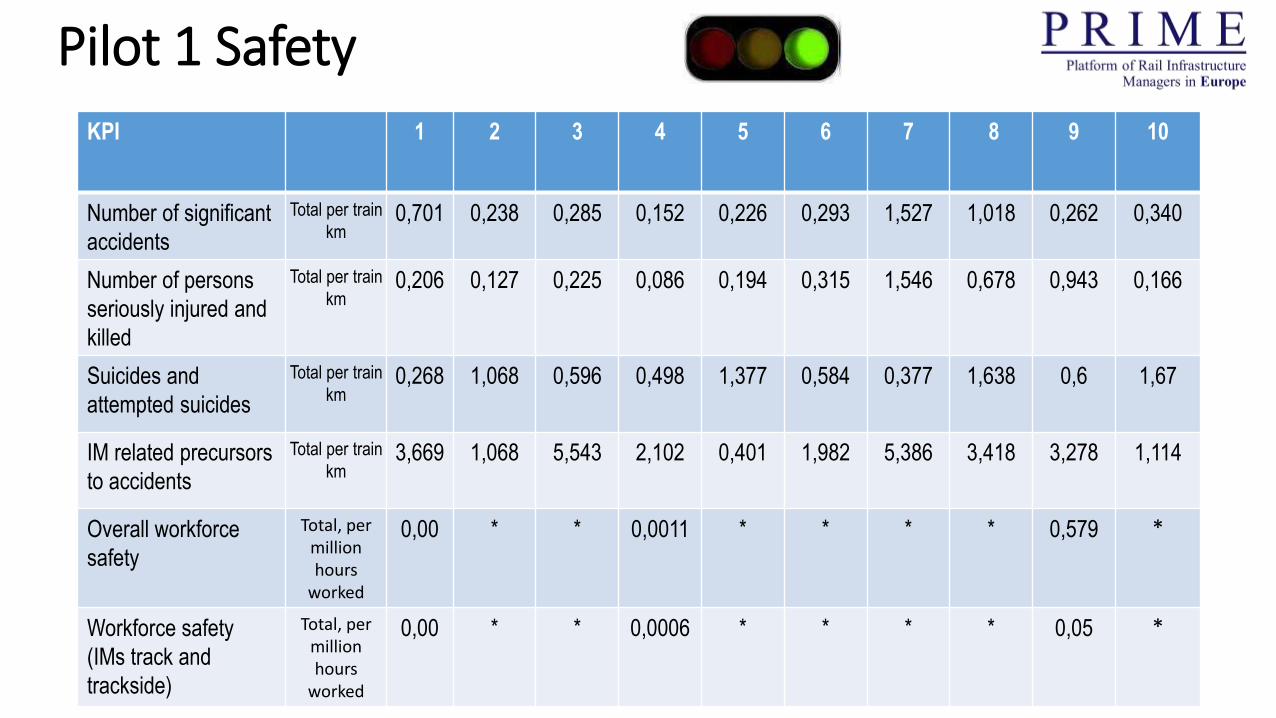
Pilot 1 Safety
KPI 1 2 3 4 5 6 7 8 9 10
Number of significant
accidents
Total per train
km 0,701 0,238 0,285 0,152 0,226 0,293 1,527 1,018 0,262 0,340
Number of persons
seriously injured and
killed
Total per train
km
0,206 0,127 0,225 0,086 0,194 0,315 1,546 0,678 0,943 0,166
Suicides and
attempted suicides
Total per train
km
0,268 1,068 0,596 0,498 1,377 0,584 0,377 1,638 0,6 1,67
IM related precursors
to accidents
Total per train
km
3,669 1,068 5,543 2,102 0,401 1,982 5,386 3,418 3,278 1,114
Overall workforce
safety
Total, per million hours
worked
0,00 * * 0,0011 * * * * 0,579 *
Workforce safety
(IMs track and
trackside)
Total, per million hours
worked
0,00 * * 0,0006 * * * * 0,05 *
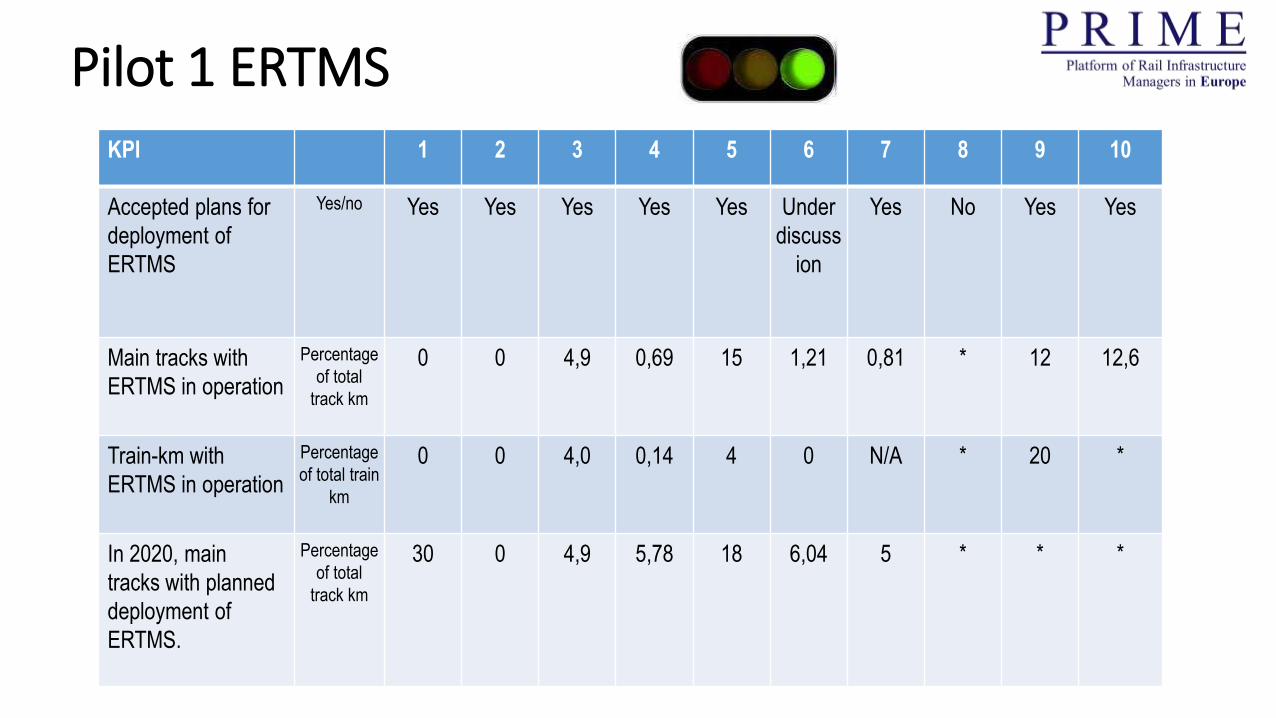
Pilot 1 ERTMS KPI 1 2 3 4 5 6 7 8 9 10
Accepted plans for
deployment of
ERTMS
Yes/no Yes Yes Yes Yes Yes Under
discuss
ion
Yes No Yes Yes
Main tracks with
ERTMS in operation
Percentage
of total
track km
0 0 4,9 0,69 15 1,21 0,81 * 12 12,6
Train-km with
ERTMS in operation
Percentage
of total train
km
0 0 4,0 0,14 4 0 N/A * 20 *
In 2020, main
tracks with planned
deployment of
ERTMS.
Percentage
of total
track km
30 0 4,9 5,78 18 6,04 5 * * *
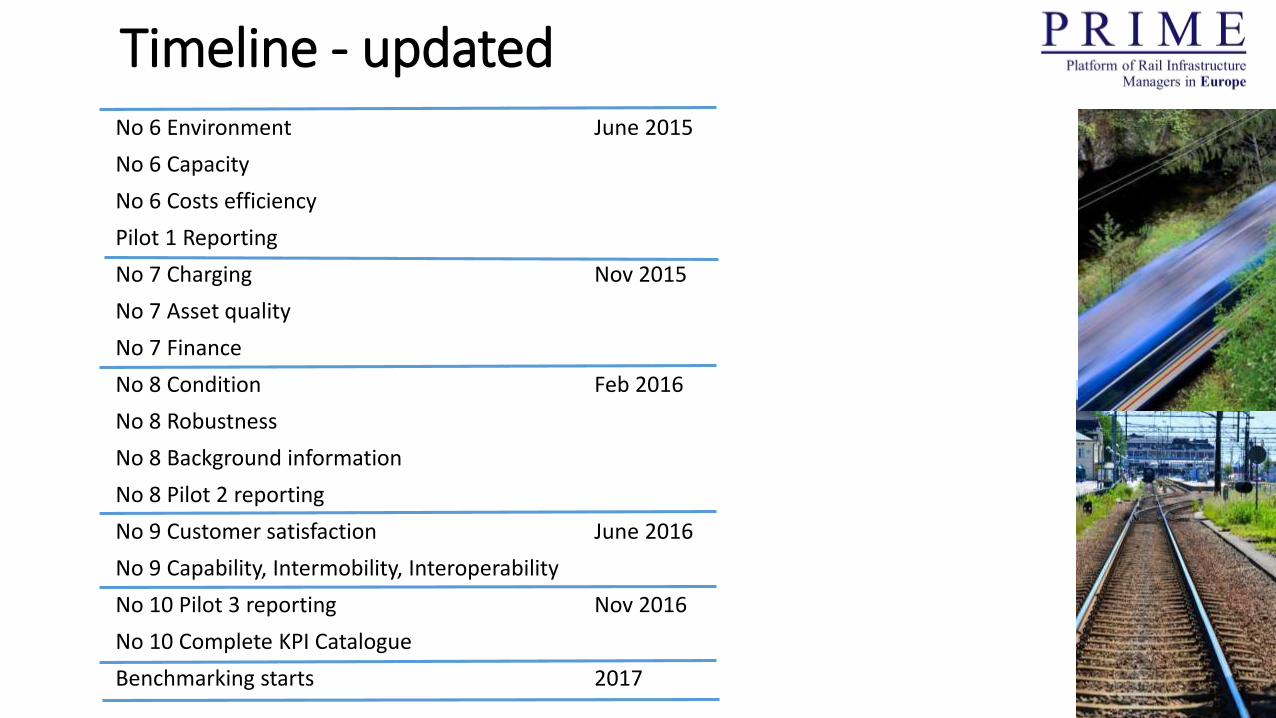
Timeline - updated No 6 Environment June 2015
No 6 Capacity
No 6 Costs efficiency
Pilot 1 Reporting
No 7 Charging Nov 2015
No 7 Asset quality
No 7 Finance
No 8 Condition Feb 2016
No 8 Robustness
No 8 Background information
No 8 Pilot 2 reporting
No 9 Customer satisfaction June 2016
No 9 Capability, Intermobility, Interoperability
No 10 Pilot 3 reporting Nov 2016
No 10 Complete KPI Catalogue
Benchmarking starts 2017
Proposal for decision
PRIME members are asked to discuss and agree upon;
a) the presented KPIs on Capacity
b) the presented KPIs on Environment (+noise)
c) the presented KPIs on Cost Efficiency
d) the presented need of starting Pilot 2
e) the presented timeline