Embed Size (px)
Citation preview
PLATINUM
ANGLO AMERICAN PLATINUM LIMITEDANNUAL RESULTS PRESENATION 2012
REVIEWING THE PORTFOLIO WITH THE FUTURE IN MIND
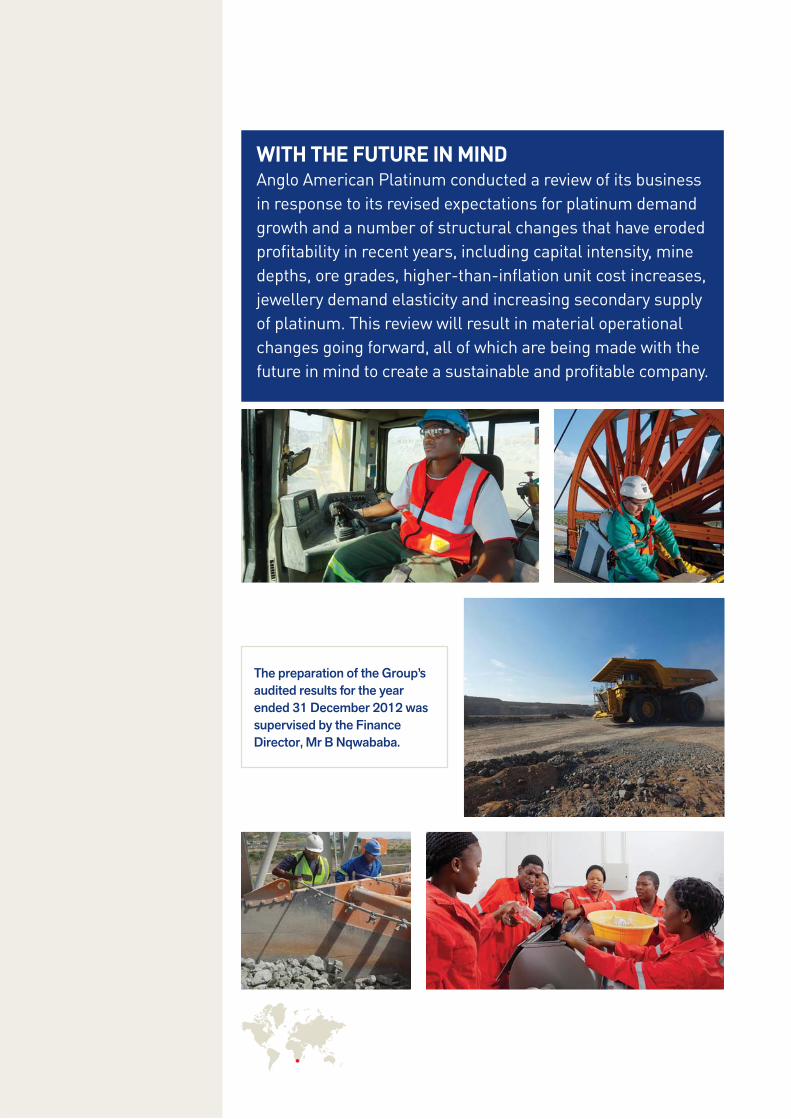
The preparation of the Group’s audited results for the year
WITH THE FUTURE IN MINDAnglo American Platinum conducted a review of its business
in response to its revised expectations for platinum demand
growth and a number of structural changes that have eroded
profitability in recent years, including capital intensity, mine
depths, ore grades, higher-than-inflation unit cost increases,
jewellery demand elasticity and increasing secondary supply
of platinum. This review will result in material operational
changes going forward, all of which are being made with the
future in mind to create a sustainable and profitable company.
Anglo American Platinum Annual Results Presentation 2012 1
4 Commentary
1414
15
1617 Consolidated changes in equity18 Abridged notes to the consolidated
21 Annual performance data
27 Annual results analyst presentation
IBC Administration
PERFORMANCE HIGHLIGHTS CONTENTS
OPERATIONAL INDICATORS 2011
Tonnes milled 000 tonnes4E built-up head grade g/t
1 000 Pt oz
employee Per annum
REFINED PRODUCTION
000 oz000 oz000 oz000 oz
PGMs 000 oz
FINANCIAL PERFORMANCE
R millionR million 8,555R million 3,566
Net debt R million 3,662Debt:equity ratio
R million%
R/oz Pt sold 19,595Cost of sales R/oz Pt sold 16,306Cash on-mine costs R/tonne milled 529Cash operating costs 12,869
ENVIRONMENTAL, SOCIAL AND GOVERNANCE (ESG)
Number 58,541HDSAs in management % 56Fatalities Number 12Lost-time injury-frequency rate Rate/200,000 hrs
000 tonnesGHG emissions, CO2 000 tonnes 5,991
Megalitres 31,248Energy use Terajoules 25,168
Number 0R million
1 Mines’ production and purchases of metal in concentrate, secondary metals and other metals converted to equivalent refined production using Anglo American Platinum Limited’s standard smelting and refining recoveries.
PERFORMANCE OVERVIEWWITH THE FUTURE IN MIND
2
ANNUAL RESULTS PRESENTAION 2012 COMMENTARY
Anglo American Platinum Annual Results Presentation 2012
STRATEGIC ELEMENT: Understand and develop the market
MARKET ASSESSMENTWITH THE FUTURE IN MIND

Anglo American Platinum Annual Results Presentation 2012 3
Com
mentaryThe platinum market moved into deficit in 2012 due to
a fall in newly mined and recycle supplies. Supplies of
platinum were negatively impacted by labour stoppages
and mine closures in South Africa, with supplies from
the region their lowest in 11 years as a result.
Overall platinum demand in the China jewellery sector rose by 14% to 1.9 million ounces in 2012 which is the highest since 2009.
5.86 MozGLOBAL PLATINUM SUPPLY IN 2012
1,532 US$/ozAVERAGE PLATINUM PRICE ACHIEVED
3.04 MozOF PLATINUM WAS USED IN AUTOCATALYSTS IN 2012
MARKET DEVELOPMENT AND BENEFICIATION
focused on South Africa, so as to facilitate
ANNUAL RESULTS PRESENTAION 2012 COMMENTARY
4 Anglo American Platinum Annual Results Presentation 2012
RESULTS COMMENTARY
Employee health
Treatment for HIV and Aids Maintained 81% Voluntary Counselling and Testing
Reductions in our water consumption and increase in
potable water
Labour Plans include the following:
better: Total women in management stands at 20% with
Three years ago, we committed to promote employee home ownership and entered into a partnership with the then Department of Housing to build 20,000 housing units
Following the implementation of Project Alchemy, the
SAFETY
The number of lost-time injuries decreased by 10% year-on-year while serious injuries incurred decreased by
agency for most lost-time injuries, we are encouraged by the 14% decrease in lost-time injuries caused by materials
in a decrease in the number of safety stoppages during the
The management systems, engineering and technological
fatalities which occurred in 2012, one was caused by fall of
Our safety strategy has four main pillars: Appropriate safety
harm in action programme introduced at the end of 2011
SUSTAINABLE DEVELOPMENT AND TRANSFORMATION
Anglo American Platinum recognises the importance and impact of sustainability on both our legal and social licence
tracked and includes employee safety, employee health, compliance with mineral policy and legislation, access to
Anglo American Platinum Annual Results Presentation 2012
Com
mentary
beyond the recording of numbers to focusing on creating
surrounding a number of our prospecting rights that are
incorrectly awarded to third-party entities
FINANCIAL REVIEW
Headline earnings per ordinary share decreased year-on-
period were lower primarily due to the two-month illegal
During the period of the illegal industrial action, Anglo American Platinum prioritised sales in line with its contractual
suspension and subsequent illegal industrial action, and the
and assets, which are considered uneconomical in the current
while the adjustment arising following the physical stock
under pressure due to illegal industrial action during the
the disruption in production and additional once-off costs as
primarily due to the illegal industrial action and increases in the cost of labour, electricity, diesel, caustic soda, process
illegal industrial action contributed around R900 per
the effects of the illegal industrial action, unit cash operating
disproportionately impacted by the illegal industrial action,
margin before write-downs, declined from 16% in 2011 to
61% increase in net working capital days, predominantly
ANNUAL RESULTS PRESENTAION 2012 COMMENTARY
Anglo American Platinum Annual Results Presentation 2012
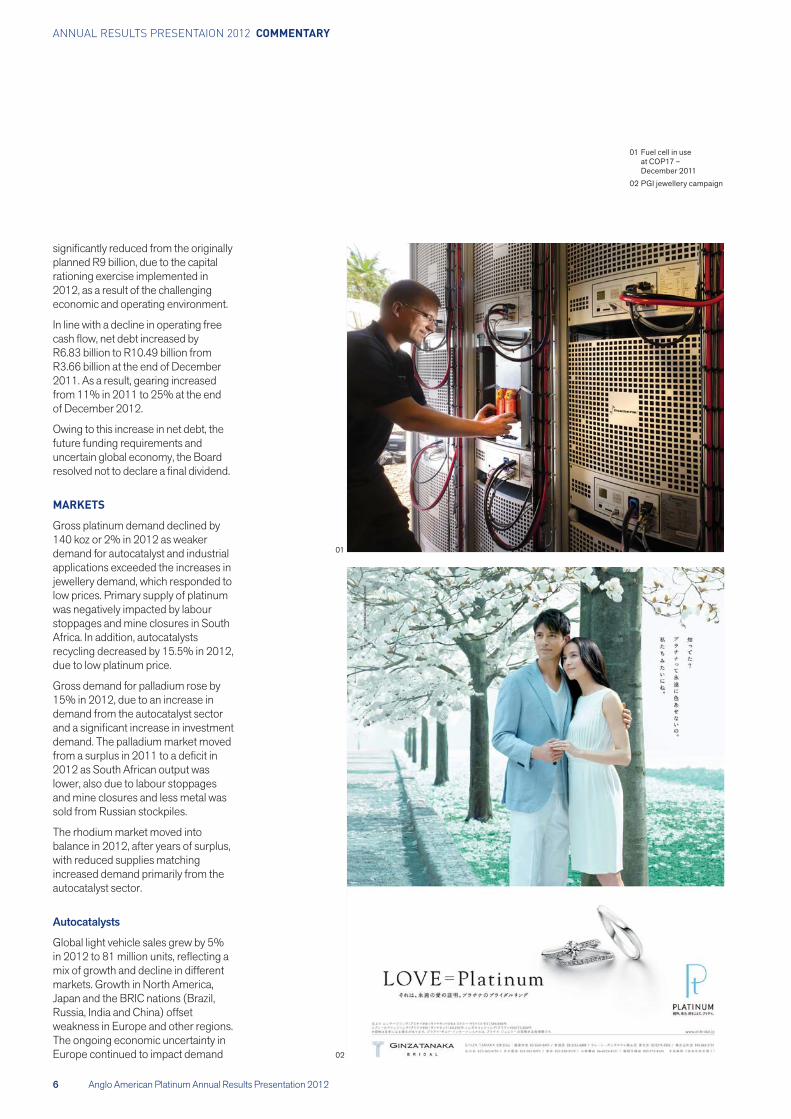
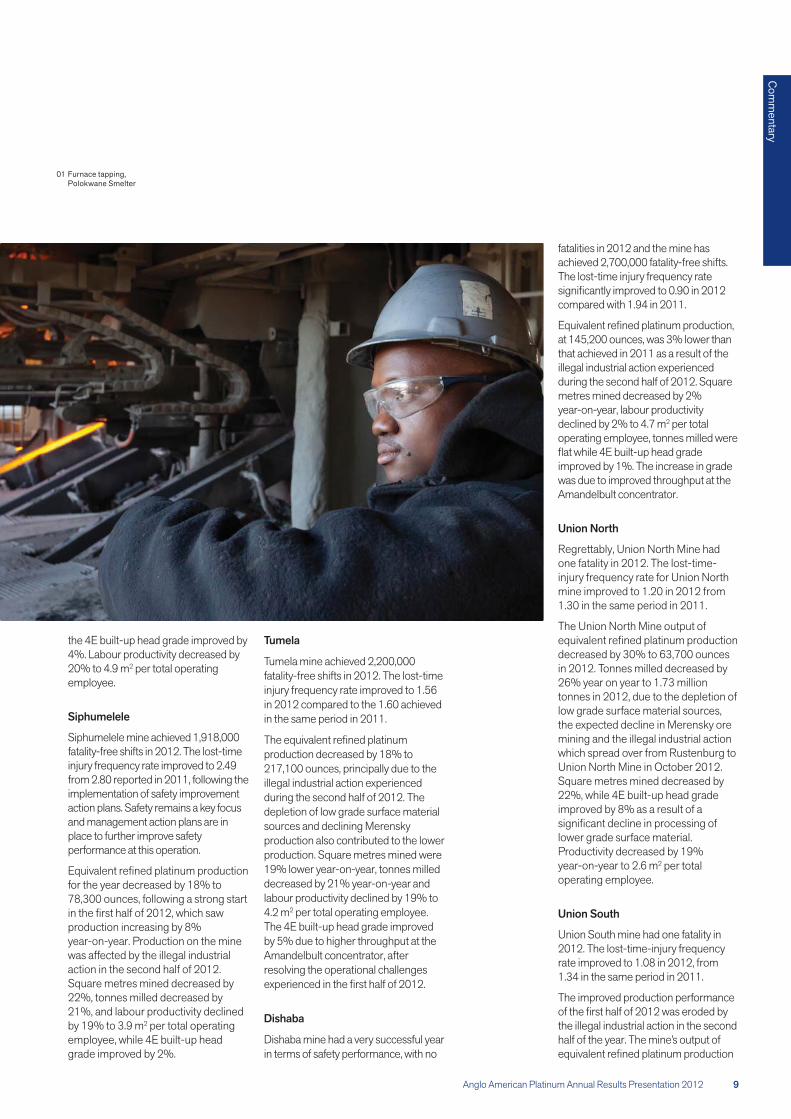
01
02
01
02
planned R9 billion, due to the capital
2012, as a result of the challenging
In line with a decline in operating free
from 11% in 2011 to 25% at the end
Owing to this increase in net debt, the future funding requirements and uncertain global economy, the Board
MARKETS
Gross platinum demand declined by 140 koz or 2% in 2012 as weaker demand for autocatalyst and industrial
jewellery demand, which responded to
stoppages and mine closures in South
Gross demand for palladium rose by 15% in 2012, due to an increase in demand from the autocatalyst sector
2012 as South African output was lower, also due to labour stoppages and mine closures and less metal was
balance in 2012, after years of surplus, with reduced supplies matching increased demand primarily from the
Autocatalysts
The ongoing economic uncertainty in Europe continued to impact demand
PIC TO COME
Anglo American Platinum Annual Results Presentation 2012
Com
mentary
premier status attracting a premium
Investment
although the performance during the
Canadian Platinum Maple Leaf and the Australian Platinum Platypus bullion coins also boosted interest in demand
resulted in a 16% increase in net
OPERATIONS
mines managed by Anglo American
for the year ended 31 December 2012
2012 as a result of the illegal industrial
associates, amounted to 305,600
from own mines and the Western Limb Tailings Retreatment plant decreased by 143,600 ounces or 9% year-on-year
due to the impact of the illegal industrial
production at Rustenburg mines
decreased by 43,300 ounces or 8%
year-on-year decreases of 52,000 ounces or 13% and 58,500 or 23%
platinum ounces, down 6,100 or 2% year-on-year due to lower throughput at the concentrators and lower head
partly offset by higher production
ounces, or 20% year on year, as the
production, was down 3% year-on-year
2012 was impacted mainly by industrial
the Marikana mine in June 2012
purchased from third parties decreased
Anglo American Platinum’s share of
by 6% compared to the same period in
loss was primarily due to the impact of the illegal industrial action, offset by the
duration of the illegal industrial action, as a precautionary measure, we prioritised our sales in line with contractual commitments and suspended spot sales which resulted in
Own mines
Anglo American Platinum had a good
performances from underground
mining operations were more localised
Gross demand for platinum in
the increase in demand in Japan and other regions unable to make up for
The increased production of gasoline
increase in palladium demand and a
from continuing substitution of platinum by palladium in diesel
Supplies of platinum group metals
catalysts decreased 12% in 2012 to
in Europe and North America was
holding back stock in anticipation of higher PGM prices, while lower stainless steel prices kept dismantlers
Japan, recycled supplies increased as
Industrial
Gross platinum demand for industrial
in 2011, addressing delayed consumption, was unlikely to be
the glass and electrical sectors in 2012 resulted in a decrease of 16% in demand for platinum for industrial
Jewellery
Gross platinum demand for the fabrication of jewellery rose by 10% in
underpinned by growth in Chinese
jewellery in China increased by 14% in
manufacturers and retailers to make
ANNUAL RESULTS PRESENTAION 2012 COMMENTARY
8 Anglo American Platinum Annual Results Presentation 2012
and for a shorter period and, as a result, 14,321 ounces of platinum, compared with 101,068 platinum ounces in 2011, were lost due to non fatality related
performances were principally impacted by the illegal industrial
Tonnes milled from underground
reduced by 29% due to depletion at
The decline in underground performances was further impacted
illegal industrial action at its Rustenburg, Union and Amandelbult mining operations during the second half
started on 18 September 2012, following the initial safety suspension
action was initially contained to the Rustenburg mining operations before commencing at Union and Amandelbult
after Rustenburg, Union and Amandelbult employees accepted the
operations resumed and gradually ramped up, taking due cognizance of
action by around 600 miners around
the Western Limb Tailings Retreatment
were as follows:
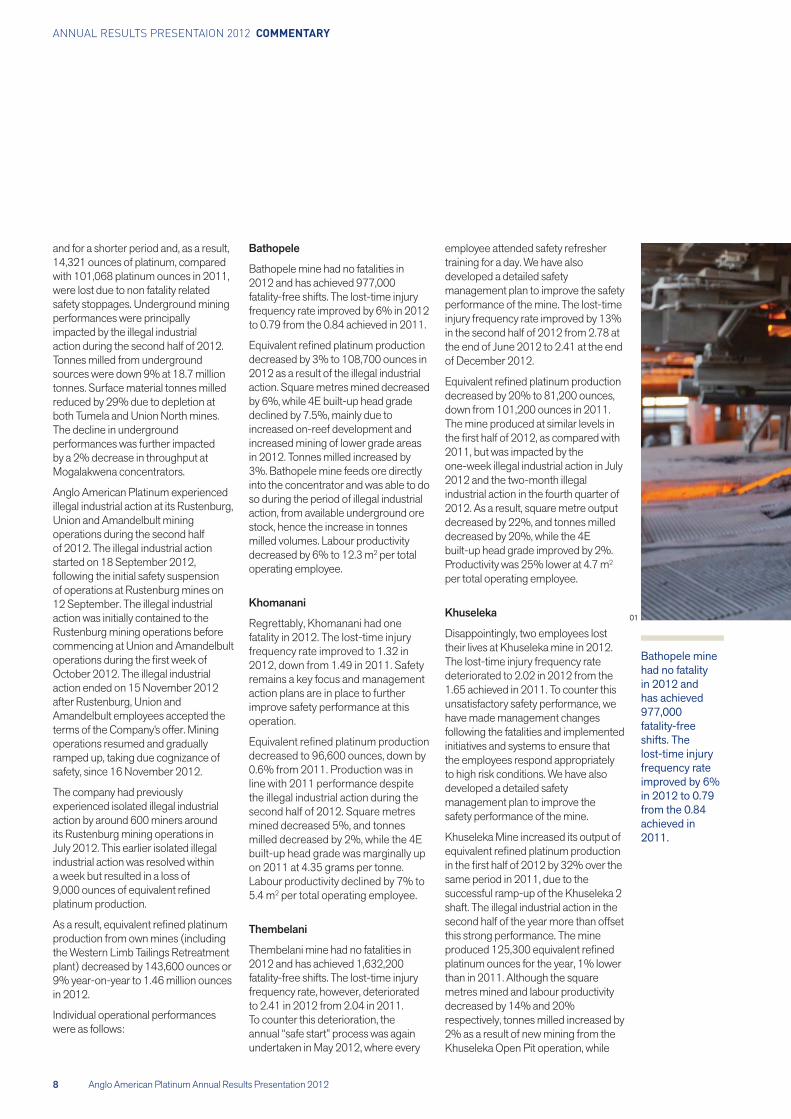
Bathopele mine had no fatalities in
2012 as a result of the illegal industrial
by 6%, while 4E built-up head grade
increased mining of lower grade areas
into the concentrator and was able to do so during the period of illegal industrial
stock, hence the increase in tonnes
2 per total
Khomanani
Regrettably, Khomanani had one
remains a key focus and management action plans are in place to further
decreased to 96,600 ounces, down by
line with 2011 performance despite the illegal industrial action during the
mined decreased 5%, and tonnes milled decreased by 2%, while the 4E built-up head grade was marginally up
2
Thembelani mine had no fatalities in
employee attended safety refresher
decreased by 20% to 81,200 ounces,
2011, but was impacted by the one-week illegal industrial action in July 2012 and the two-month illegal industrial action in the fourth quarter of
decreased by 22%, and tonnes milled decreased by 20%, while the 4E
2
Khuseleka
Disappointingly, two employees lost
The lost-time injury frequency rate
unsatisfactory safety performance, we
following the fatalities and implemented
the employees respond appropriately
Khuseleka Mine increased its output of
same period in 2011, due to the successful ramp-up of the Khuseleka 2
second half of the year more than offset
platinum ounces for the year, 1% lower
decreased by 14% and 20%
2% as a result of new mining from the Khuseleka Open Pit operation, while
01
Anglo American Platinum Annual Results Presentation 2012
Com
mentary
fatalities in 2012 and the mine has
The lost-time injury frequency rate
at 145,200 ounces, was 3% lower than
metres mined decreased by 2%
2 per total operating employee, tonnes milled were
Regrettably, Union North Mine had
injury frequency rate for Union North
The Union North Mine output of
tonnes in 2012, due to the depletion of low grade surface material sources,
mining and the illegal industrial action
Square metres mined decreased by 22%, while 4E built-up head grade
2 per total
Union South
Union South mine had one fatality in
the illegal industrial action in the second
2 per total operating
Siphumelele
and management action plans are in
for the year decreased by 18% to
production increasing by 8%
was affected by the illegal industrial
Square metres mined decreased by 22%, tonnes milled decreased by
2 per total operating employee, while 4E built-up head
Tumela
production decreased by 18% to
depletion of low grade surface material sources and declining Merensky production also contributed to the lower
19% lower year-on-year, tonnes milled decreased by 21% year-on-year and
2
by 5% due to higher throughput at the Amandelbult concentrator, after
in terms of safety performance, with no
01
ANNUAL RESULTS PRESENTAION 2012 COMMENTARY
Anglo American Platinum Annual Results Presentation 2012
decreased by 19% to 132,000 ounces
Square metres decreased by 16%, tonnes milled decreased by 11% and 4E built-up head grade declined by 8%
2 per total
Regrettably, one employee was fatally
is focusing on focusing on enhancing
production, at 300,200 ounces, was down 2% compared to the same period in 2011 due to lower throughput at the concentrators and lower head grade, caused by lower production from the high grade
Sandsloot pit was curtailed due to
decreased by 3% while the 4E built-up
Unki
Unki mine had no fatalities in 2012 and
increased by 20% year-on-year to
increased by 41% year-on-year, tonnes milled increased by 20%,
2 per operating employee, while the 4E built-up head grade was down 6% due to the blasting of large underground waste rock to establish infrastructure for future mining as well
as the processing of lower grade
Joint venture and associate mines
operations had a challenging start to the
of the year in fall-of-ground incidents
the Bokoni, Kroondal and BRPM
mines subsequently proceeded to end
rate per 200,000 hours deteriorated,
reductions in the LTIFR at the BRPM,
While the total number section 54
associate operations remained the same year-on-year at 48, the total
decreased from 25,000 ounces in 2011
Regrettably, two employees lost their
incident in January 2012, after the mine had reached an unprecedented
Production decreased by 4% compared with 2011, to 119,600
The decrease in production was largely attributable to a prolonged industrial
Mototolo was fatality free in 2012 and the lost-time-injury frequency rate
increased by 9% compared to 2011, to
in tonnes milled to 206,000 tonnes per
Kroondal
Disappointingly, one employee lost his
Production increased by 2% compared to 2011, to 213,200
The increase in production was largely attributable to the implementation of a
migrated from contractor mining to an owner-miner model during the second
Marikana mine was placed on care and maintenance in June 2012 due to the
successfully redeployed at other
Regrettably, one employee lost his life in a fall of ground incident in February 2012, shortly after the mine had
The lost-time injury-frequency rate at
principally due to safety-related
Disappointingly, one employee was fatally injured in a fall of ground
Notwithstanding the fatal incident, the
decreased by 8% compared with
platinum ounces, due to illegal industrial action which resulted in lost
action started on 1 October 2012 and
Anglo American Platinum Annual Results Presentation 2012 11
Com
mentary
Twickenham Mine UG2 Reef:
Siphumelele 1 and 2 mines Merensky and UG2 Reef: Reallocated 16 million tonnes or
Additional new information resulted
Platreef in localised areas to the west and below the original 2011 pit shell
The decrease in the Mogalakwena Mineral resources is offset mainly by
primarily due to the economic assumptions and secondarily due to
Bathopele Phase 4 and 5 and the
The Twickenham Platinum Mine
Current major work on the project includes primary and decline
furnace 2 and Thembelani 2 projects
MINERAL RESOURCES AND RESERVES
Anglo American Platinum’s total Ore
design was the result of Pit Optimisation work done by Mogalakwena and has resulted in the
tonnes of Mineral Resources to
The increase in the Mogalakwena Ore
to Mineral Resources due to the
the industrial action, the mine had
months of 2012 had increased by 21% compared to the same period in 2011,
CAPITAL EXPENDITURE PROJECTS
ensuring projects are set up in line with the company safety management
capitalised interest, amounted to
planned R9 billion, due to the capital
2012, as a result of the challenging
decreased to R399 million in 2012 from
capitalised was R416 million, up 15% or
The majority of the project capital
Unki Mine, Mogalakwena North
01
02
0102
ANNUAL RESULTS PRESENTAION 2012 COMMENTARY
Anglo American Platinum Annual Results Presentation 2012
Primary supply challenges are
pressure on margins and increased risk of supply disruptions from
Supplies of metal from the recycle of
production growth and tightening emissions legislation, with growth in
demand, dominated by the electronics
to be constrained by the same factors impacting platinum production and
The palladium market is therefore
continues to grow resulting in the
commercial strategy includes
contracts representing 20% of sales were either renegotiated or terminated,
discounts and commissions, that terminate in 2013, will not be renewed
commercial strategy is on track to
end of 2013, reaching R1 billion per
Anglo American Platinum announced the recommendations of its portfolio
changes that had eroded the
changes required to create a
of Human Resources, was appointed
American South Africa with effect
Khanyisile Kweyama was appointed as
OUTLOOK
Despite the less than optimistic outlook for global economic growth,
the global platinum market is likely to be balanced in the short term, as result of reduced production by Anglo American Platinum and possible
platinum production returned to
grow marginally in 2013, despite the lack of economic growth in the
emissions legislation in all markets, particularly the implementation of
primarily due to increased disposable income spent on platinum jewellery in China and India, and underpinned by an increase in organised retail and strong
China by Hong Kong jewellers
Industrial demand for platinum in 2012
The growing popularity of cloud computing and the associated demand
increase platinum demand from the
the increase in the minimum mining
Tumela, Twickenham and Siphumelele
ounces increase is related to the
resources while the remaining 12% is related to the increase in mining cut
During 2011, a new Resource
mining lease held by Southridge
tonnes in 2011 and the 4E ounce
report disclosed the Mineral Resources of the Unki East and West mines while the 2012 annual report incorporates all
BOARD AND EXCO CHANGES
On 30 June 2012, the Company Secretary, Sarita Martin, resigned from
director with effect from 25 September
Sonja Sebotsa resigned as an
American Platinum Limited
Anglo American Platinum Annual Results Presentation 2012 13
Com
mentary
into account the company’s future capital
Anglo American Platinum is committed to the highest standards of safety and continues to make a meaningful and sustainable difference in the
its operations
For further information, please contact:
Investors
structure to support the proposed
also affected by the postponement of
are well entrenched and continue to
present the company with challenges
will see another increase in Eskom’s electricity tariffs while the second half of
Illegal industrial action presents new challenges for the company as it has impacted production and costs
for 2013, Anglo American Platinum aims to contain cash unit costs to between R16,000 and R16,500 per
with the proposed portfolio option to
years is forecast to be between R6 and
optimise capital allocation to focus on the highest return and lowest risk
Anglo American Platinum aims to
of between 2 and 3 times, after taking
mining to processing, marketing and commercial strategy, as well as the shape and size of portfolio which will
stakeholders and thereafter, the implementation of the proposals of the
The key recommendation of the
Khuseleka and Khomanani mines
maintenance and by consolidating
Production at Rustenburg mines would
we would replace production from high-cost assets with production from
capacity in the short to medium term
recommendations continue to require
other stakeholders prior to
28th of January 2013, Anglo American Platinum, the Department of Mineral
to postpone the continuation of the Section 189 process under the Labour Relations Act, which had commenced on 15 January 2013, in order to allow
We also agreed that the consultation process will take no more than 60 days,
production, we are in the process of adjusting our cost base to align with the
ANNUAL RESULTS PRESENTATION 2012 FINANCIAL RESULTS 31 DECEMBER 2012
14 Anglo American Platinum Annual Results Presentation 2012
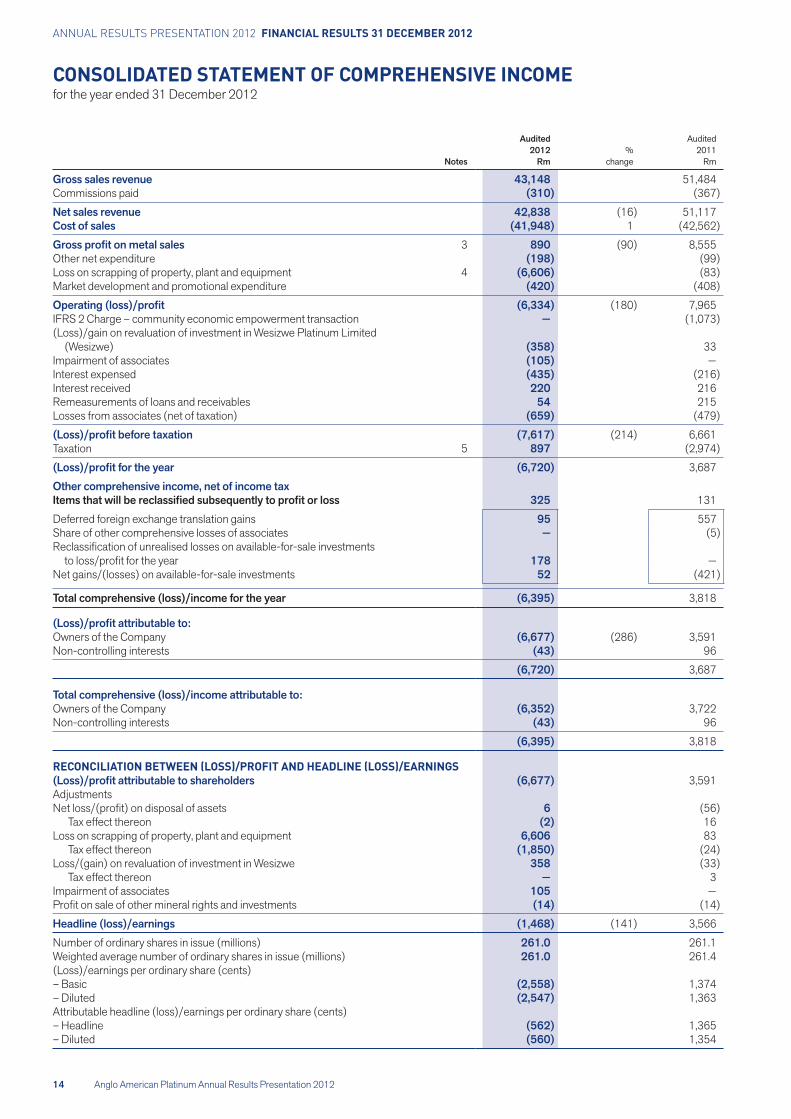
CONSOLIDATED STATEMENT OF COMPREHENSIVE INCOMEfor the year ended 31 December 2012
Audited2011
Gross sales revenue 51,484Commissions paid
Cost of sales 1
3 8,555
Loss on scrapping of property, plant and equipment 4
IFRS 2 Charge – community economic empowerment transaction —
33Impairment of associates —
216215
6,6615
131
—
—
3,818
Owners of the Company 3,591Non-controlling interests 96
Owners of the CompanyNon-controlling interests 96
3,818
RECONCILIATION BETWEEN (LOSS)/PROFIT AND HEADLINE (LOSS)/EARNINGS3,591
Adjustments
16Loss on scrapping of property, plant and equipment 83
— 3Impairment of associates —
3,566
– Basic– Diluted 1,363
– Headline 1,365– Diluted 1,354
Anglo American Platinum Annual Results Presentation 2012
Financial results 31 Decem
ber 2012
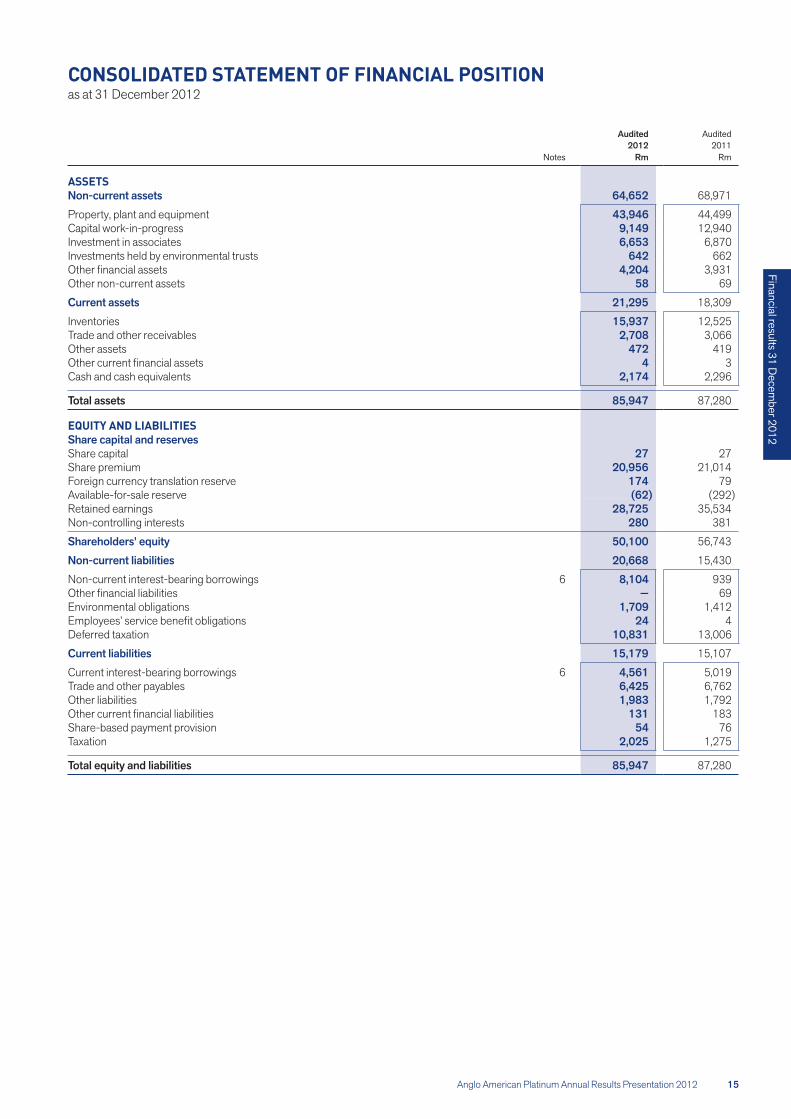
CONSOLIDATED STATEMENT OF FINANCIAL POSITIONas at 31 December 2012
Audited2011
ASSETS
Property, plant and equipment 44,499Capital work-in-progress 12,940
6623,931
Other non-current assets 69
Current assets 18,309
12,5253,066
Other assets 4194 3
2,296
Total assets
EQUITY AND LIABILITIESShare capital and reservesShare capital Share premium 21,014
Retained earnings 35,534Non-controlling interests 381
15,430
Non-current interest-bearing borrowings 6 939— 69
1,4124
13,006
Current interest-bearing borrowings 6 5,019Trade and other payablesOther liabilities
131 183
ANNUAL RESULTS PRESENTATION 2012 FINANCIAL RESULTS 31 DECEMBER 2012
Anglo American Platinum Annual Results Presentation 2012
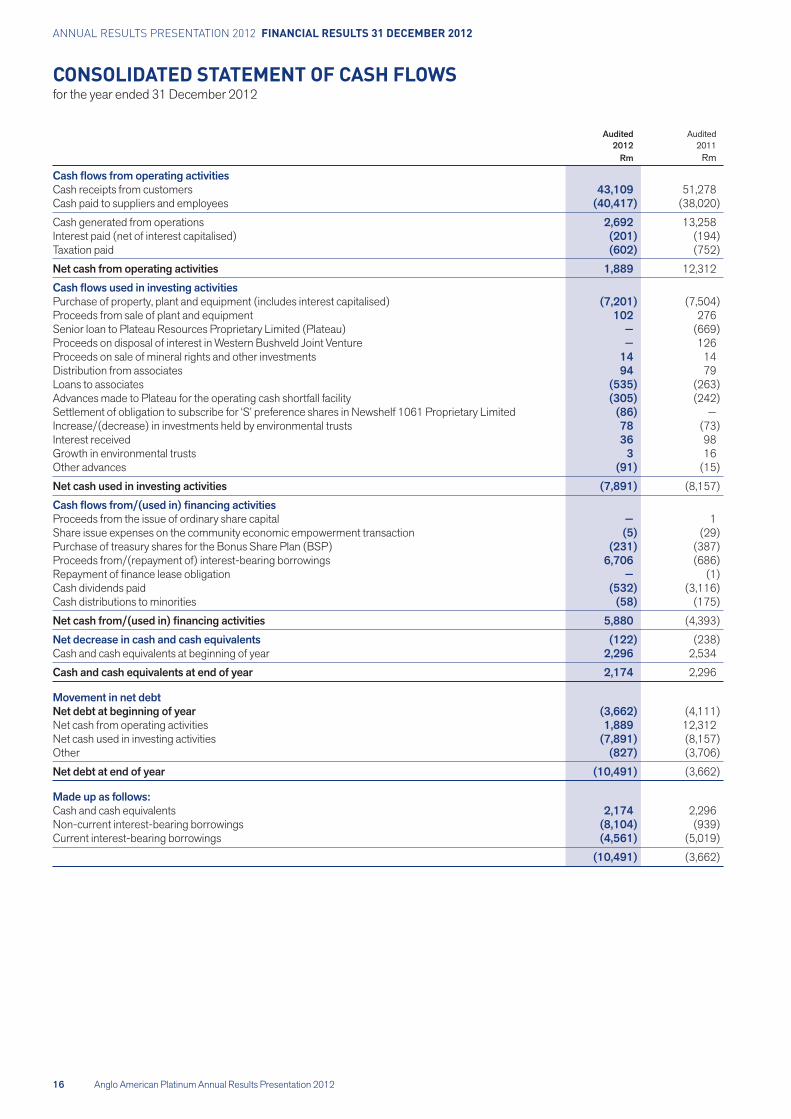
CONSOLIDATED STATEMENT OF CASH FLOWSfor the year ended 31 December 2012
Audited2011
Cash receipts from customersCash paid to suppliers and employees
Cash generated from operations 13,258
12,312
Proceeds from sale of plant and equipment—— 126
14 14Distribution from associatesLoans to associates
—
983 16
Proceeds from the issue of ordinary share capital — 1
—
Cash distributions to minorities
2,534
2,296
12,312
Other
2,296Non-current interest-bearing borrowingsCurrent interest-bearing borrowings
Anglo American Platinum Annual Results Presentation 2012
Financial results 31 Decem
ber 2012
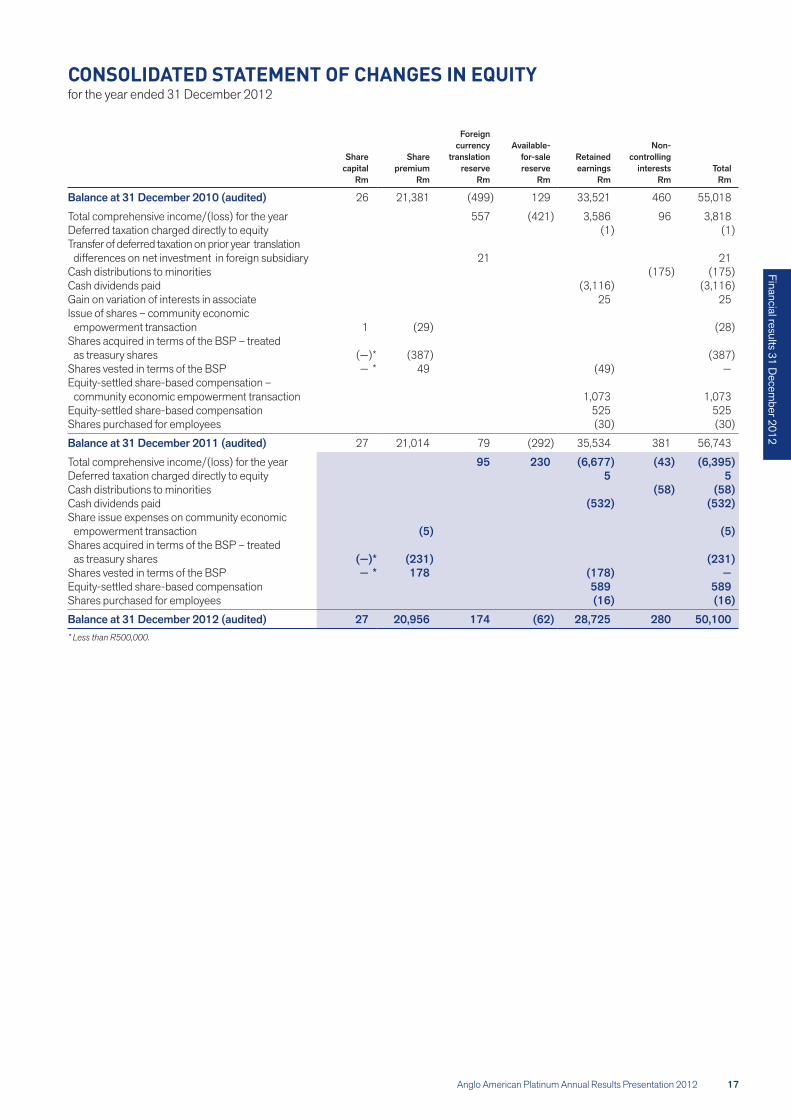
CONSOLIDATED STATEMENT OF CHANGES IN EQUITYfor the year ended 31 December 2012
currencyShare Share translation controlling
capital premium reserve reserve earnings interests Total
26 21,381 129 33,521 460 55,018
3,586 96 3,818
21 21
Cash distributions to minorities
25 25Issue of shares – community economic empowerment transaction 1Shares acquired in terms of the BSP – treated as treasury shares
— 49 —Equity-settled share-based compensation – community economic empowerment transactionEquity-settled share-based compensation 525 525Shares purchased for employees
21,014 35,534 381
Cash distributions to minorities
empowerment transactionShares acquired in terms of the BSP – treated as treasury shares
— —Equity-settled share-based compensationShares purchased for employees
* Less than R500,000.

ANNUAL RESULTS PRESENTATION 2012 FINANCIAL RESULTS 31 DECEMBER 2012
18 Anglo American Platinum Annual Results Presentation 2012
ABRIDGED NOTES TO THE CONSOLIDATED FINANCIAL STATEMENTSfor the year ended 31 December 2012
1.Standards Board, the SAICA Financial Reporting Guides as issued by the Accounting Practices Committee and Financial Reporting
2. SEGMENT REVENUE AND RESULTS
Audited Audited Audited2011 2011 2011
OperationsBathopele Mine 2,284 548 318 309Khomanani Mine 1,925 234Thembelani Mine 2,055 396 210Khuseleka Mine 2,538 341 236Siphumelele Mine 1,865 381 229Tumela Mine 5,285 1,481Dishaba Mine 2,995Union North Mine 1,844 338 164Union South Mine 3,282 308Mogalakwena Mine 8,403 3,413 1,332Twickenham Platinum Mine 1 36 1 16 — 1Unki Platinum Mine 946 104Modikwa Platinum Mine 1,415 141 312 165Kroondal Platinum Mine 2,095 536 65Marikana Platinum Mine 544 42 14Mototolo Platinum Mine 1,066 329 111 98
4,209Western Limb Tailings
240 92451 2
Total – mined 39,805 4,303Purchased metals 11,312 224
Other costs
8,555
Audited2011
3. GROSS PROFIT ON METAL SALESGross sales revenue 51,484Commissions paid
Cost of sales
Cash operating costsDepreciationDeferred waste stripping
Purchase of metals and leasing activitiesSmelting
Cash operating costsDepreciation
Cash operating costsDepreciation
Other costs
8,555
Anglo American Platinum Annual Results Presentation 2012
Financial results 31 Decem
ber 2012
Audited2011
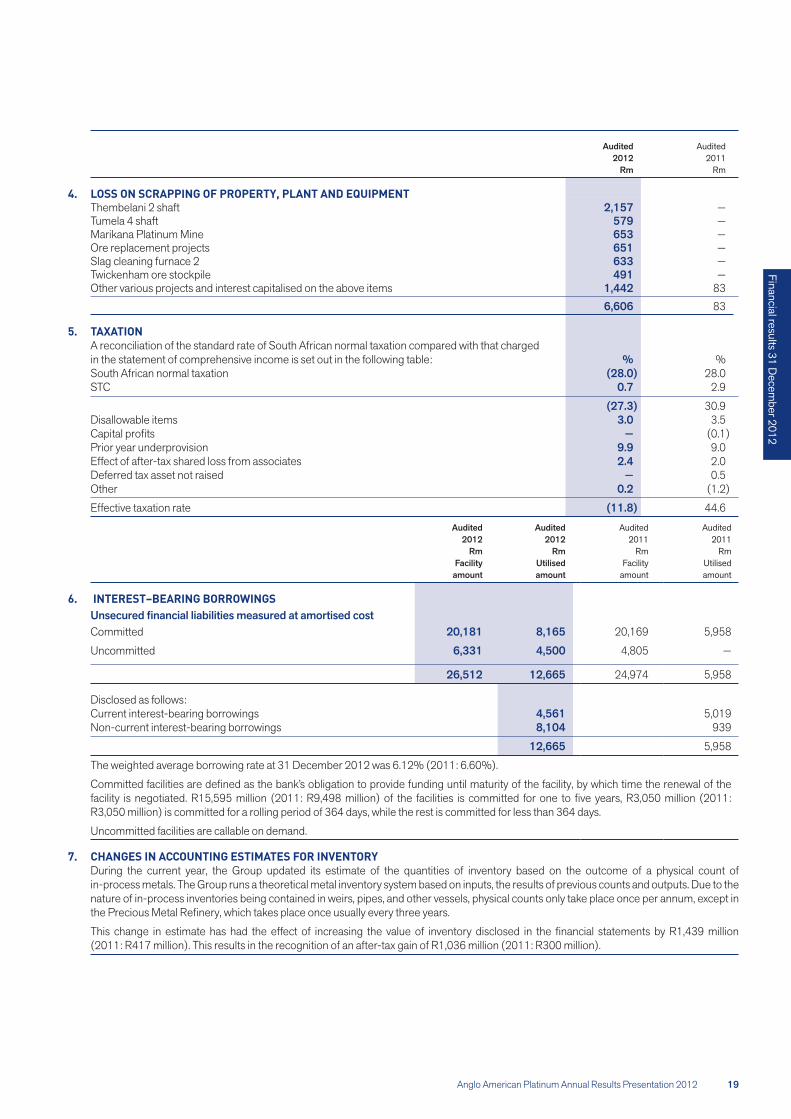
4. LOSS ON SCRAPPING OF PROPERTY, PLANT AND EQUIPMENTThembelani 2 shaft —Tumela 4 shaft —Marikana Platinum Mine —Ore replacement projects —Slag cleaning furnace 2 —Twickenham ore stockpile —
8383
5. TAXATION
% %
STC
Disallowable items—
—Other
Audited Audited2011 2011
Utilisedamount amount
6. INTEREST–BEARING BORROWINGS
Committed 20,169 5,958
Uncommitted 4,805 —
5,958
Disclosed as follows:Current interest-bearing borrowings 5,019Non-current interest-bearing borrowings 939
5,958
7. CHANGES IN ACCOUNTING ESTIMATES FOR INVENTORY
ANNUAL RESULTS PRESENTATION 2012 FINANCIAL RESULTS 31 DECEMBER 2012
Anglo American Platinum Annual Results Presentation 2012
ABRIDGED NOTES TO THE CONSOLIDATED FINANCIAL STATEMENTSfor the year ended 31 December 2012
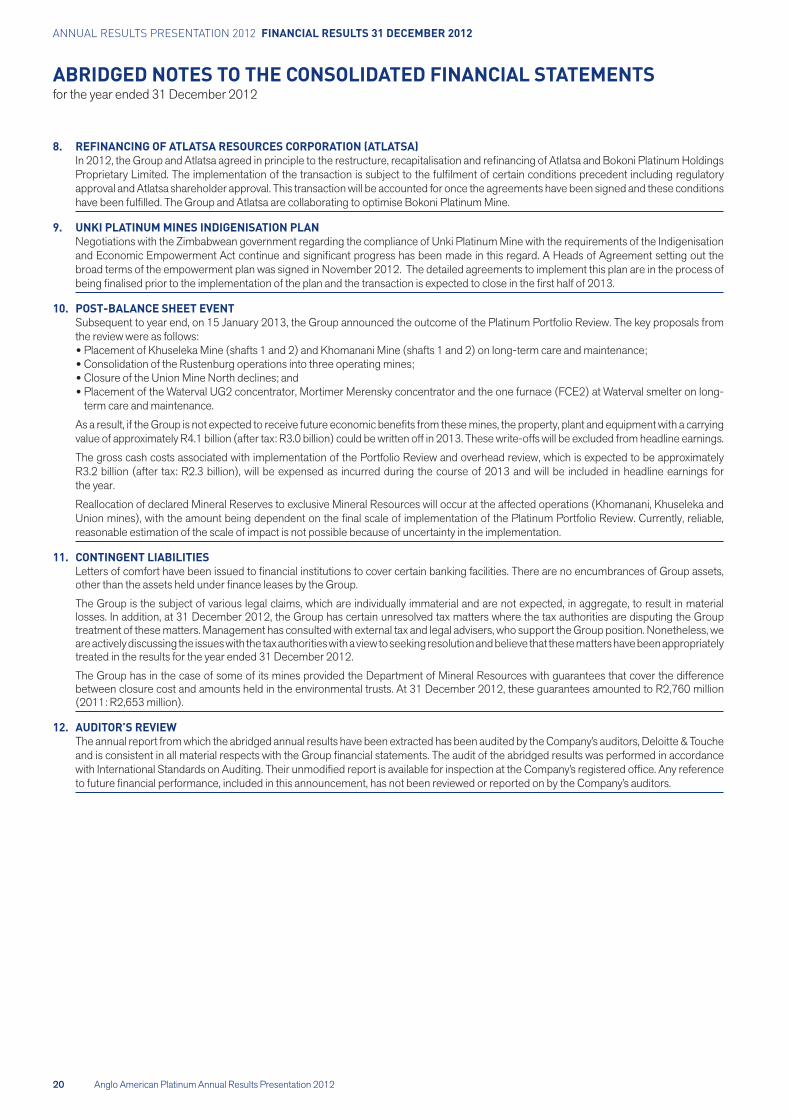
8. REFINANCING OF ATLATSA RESOURCES CORPORATION (ATLATSA)
9. UNKI PLATINUM MINES INDIGENISATION PLAN
10. POST-BALANCE SHEET EVENT
11. CONTINGENT LIABILITIES
12. AUDITOR’S REVIEW
Anglo American Platinum Annual Results Presentation 2012
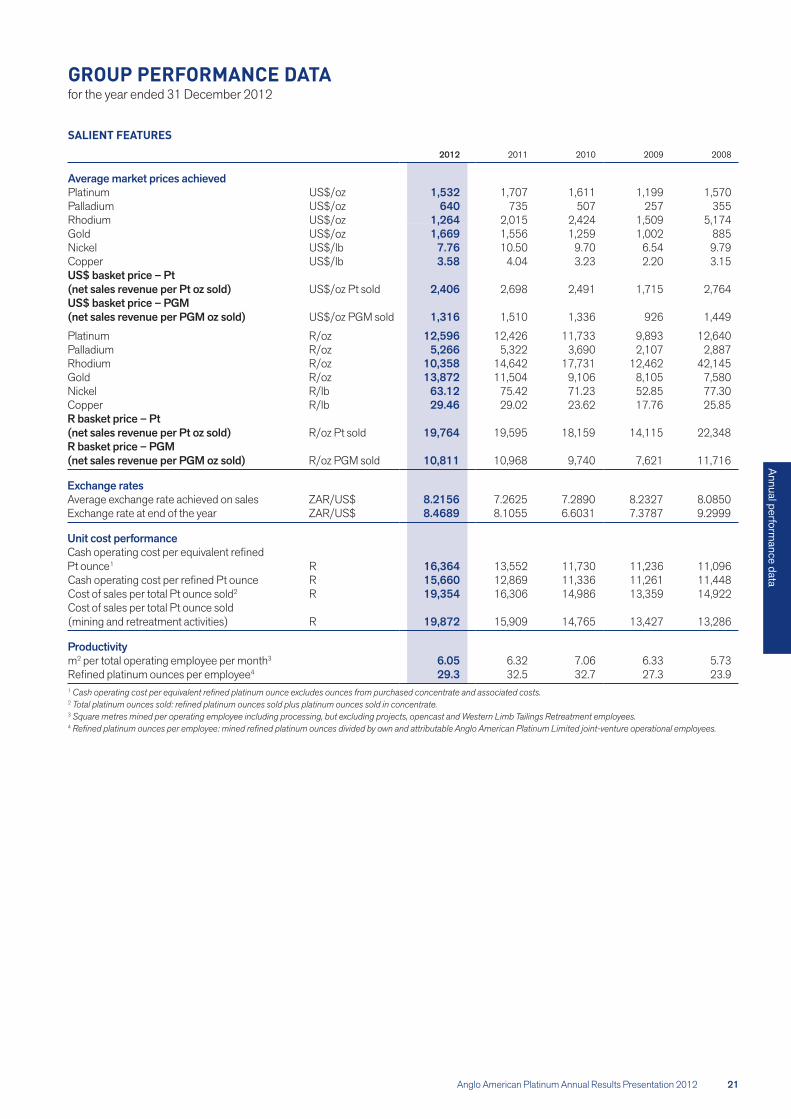
Annual performance data
SALIENT FEATURES2011 2010 2008
Average market prices achievedPlatinum US$/oz 1,611 1,199Palladium US$/oz 355Rhodium US$/oz 2,015 2,424 1,509Gold US$/oz 1,556 1,259 1,002 885Nickel US$/lbCopper US$/lb
US$/oz Pt sold 2,698 2,491
US$/oz PGM sold 1,510 1,336 926 1,449
Platinum R/oz 12,426 9,893 12,640Palladium R/oz 5,322 3,690Rhodium R/oz 14,642 12,462 42,145Gold R/oz 11,504 9,106 8,105Nickel R/lbCopper R/lb
R/oz Pt sold 19,595 18,159 14,115 22,348
R/oz PGM sold 10,968
ZAR/US$ZAR/US$
Unit cost performance
Pt ounce1 R 13,552 11,236 11,096R 12,869 11,336 11,261 11,448
Cost of sales per total Pt ounce sold2 R 16,306 14,986 13,359 14,922Cost of sales per total Pt ounce sold
R 15,909 13,286
Productivitym2 per total operating employee per month3
4
1 Cash operating cost per equivalent refined platinum ounce excludes ounces from purchased concentrate and associated costs.2 Total platinum ounces sold: refined platinum ounces sold plus platinum ounces sold in concentrate.3 Square metres mined per operating employee including processing, but excluding projects, opencast and Western Limb Tailings Retreatment employees.4 Refined platinum ounces per employee: mined refined platinum ounces divided by own and attributable Anglo American Platinum Limited joint-venture operational employees.
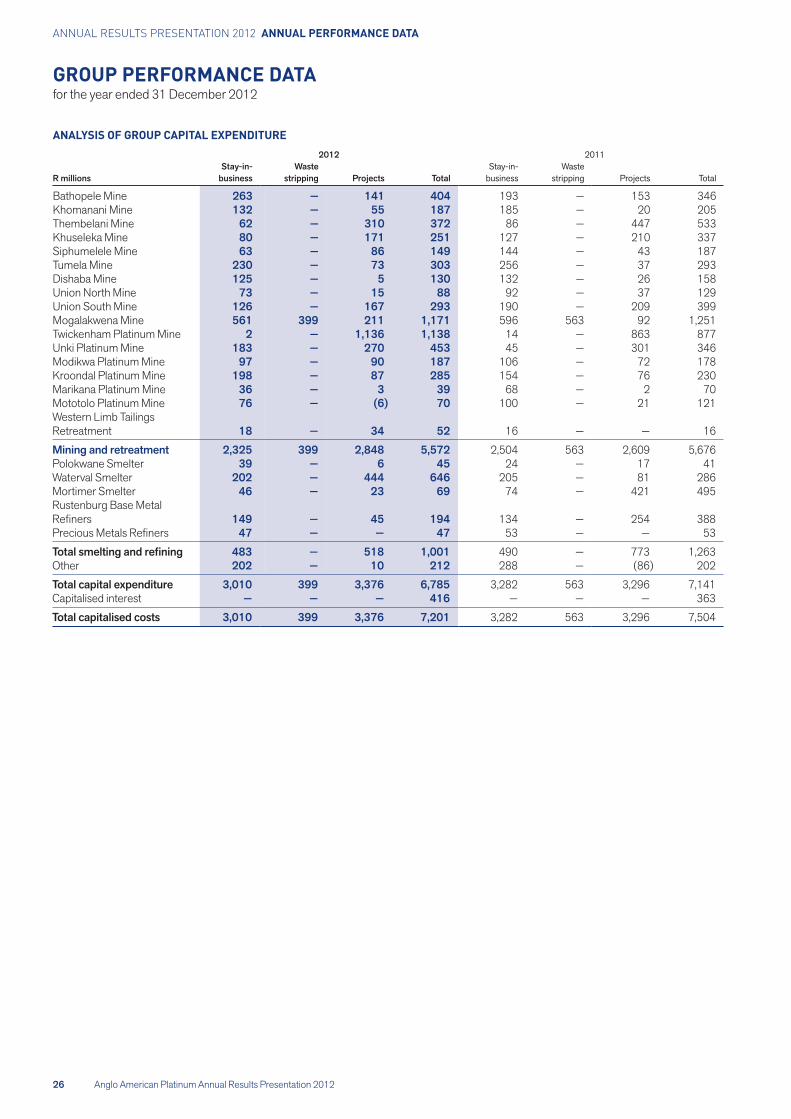
GROUP PERFORMANCE DATAfor the year ended 31 December 2012
ANNUAL RESULTS PRESENTATION 2012 ANNUAL PERFORMANCE DATA
Anglo American Platinum Annual Results Presentation 2012
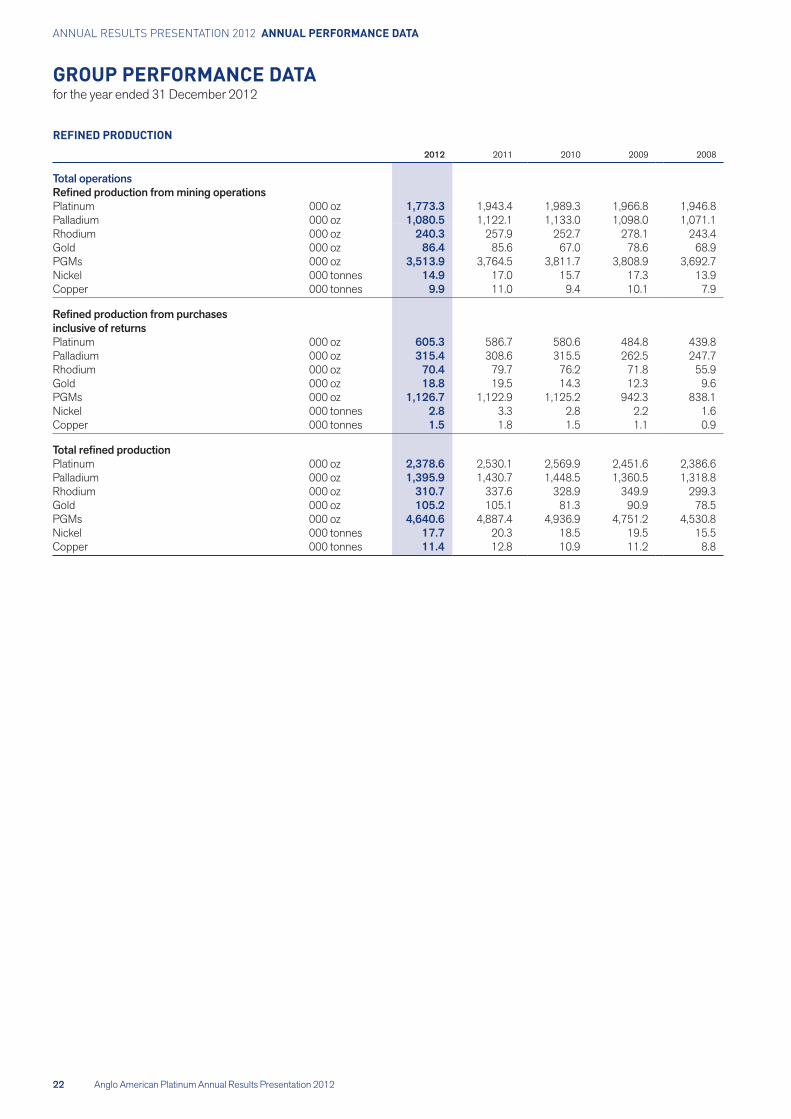
GROUP PERFORMANCE DATAfor the year ended 31 December 2012
REFINED PRODUCTION2011 2010 2008
Total operations
Platinum 000 ozPalladium 000 ozRhodium 000 ozGold 000 ozPGMs 000 ozNickel 000 tonnesCopper 000 tonnes
Platinum 000 ozPalladium 000 ozRhodium 000 ozGold 000 oz 18.8PGMs 000 ozNickel 000 tonnesCopper 000 tonnes
Platinum 000 ozPalladium 000 ozRhodium 000 ozGold 000 ozPGMs 000 ozNickel 000 tonnesCopper 000 tonnes 11.4
Anglo American Platinum Annual Results Presentation 2012
Annual performance data
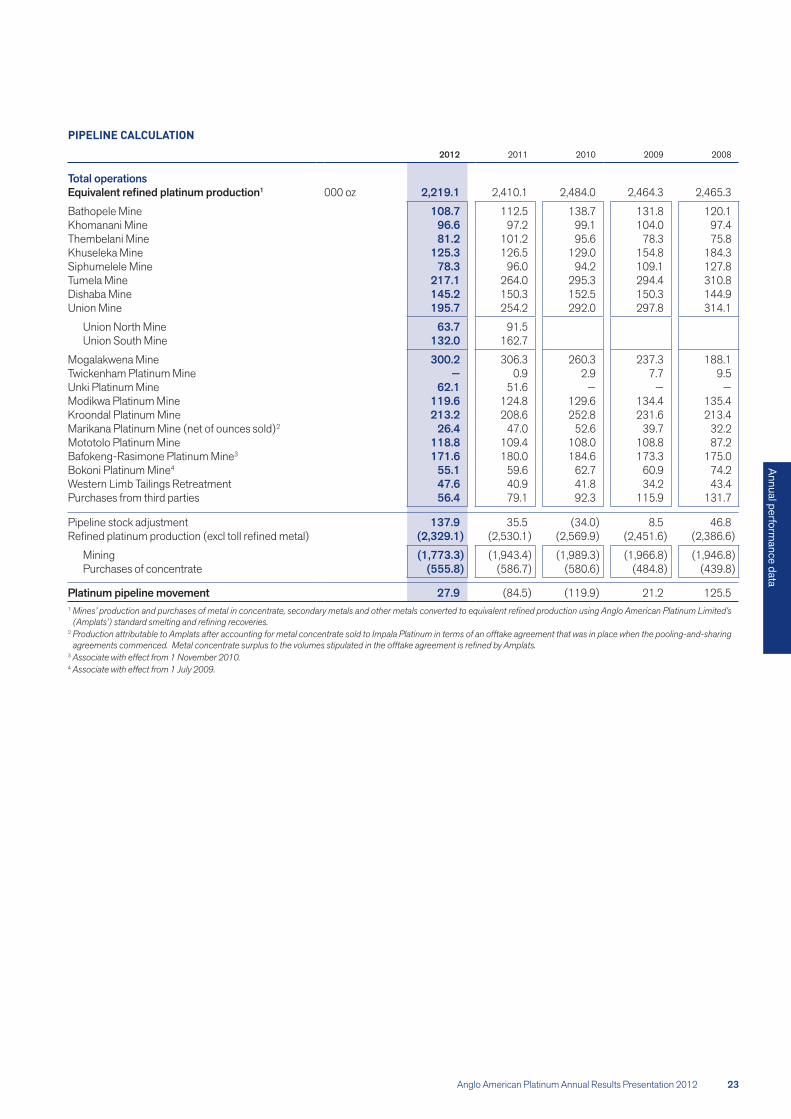
PIPELINE CALCULATION2011 2010 2008
Total operations1 000 oz
Bathopele MineKhomanani MineThembelani MineKhuseleka MineSiphumelele MineTumela MineDishaba MineUnion Mine
Union North MineUnion South Mine
Mogalakwena MineTwickenham Platinum Mine —Unki Platinum Mine — — —Modikwa Platinum MineKroondal Platinum Mine
2
Mototolo Platinum Mine 118.8Bafokeng-Rasimone Platinum Mine3
Bokoni Platinum Mine4
Western Limb Tailings RetreatmentPurchases from third parties
Pipeline stock adjustment
MiningPurchases of concentrate
Platinum pipeline movement1 Mines’ production and purchases of metal in concentrate, secondary metals and other metals converted to equivalent refined production using Anglo American Platinum Limited’s
(Amplats’) standard smelting and refining recoveries.2 Production attributable to Amplats after accounting for metal concentrate sold to Impala Platinum in terms of an offtake agreement that was in place when the pooling-and-sharing
agreements commenced. Metal concentrate surplus to the volumes stipulated in the offtake agreement is refined by Amplats.3 Associate with effect from 1 November 2010.4 Associate with effect from 1 July 2009.
ANNUAL RESULTS PRESENTATION 2012 ANNUAL PERFORMANCE DATA
Anglo American Platinum Annual Results Presentation 2012
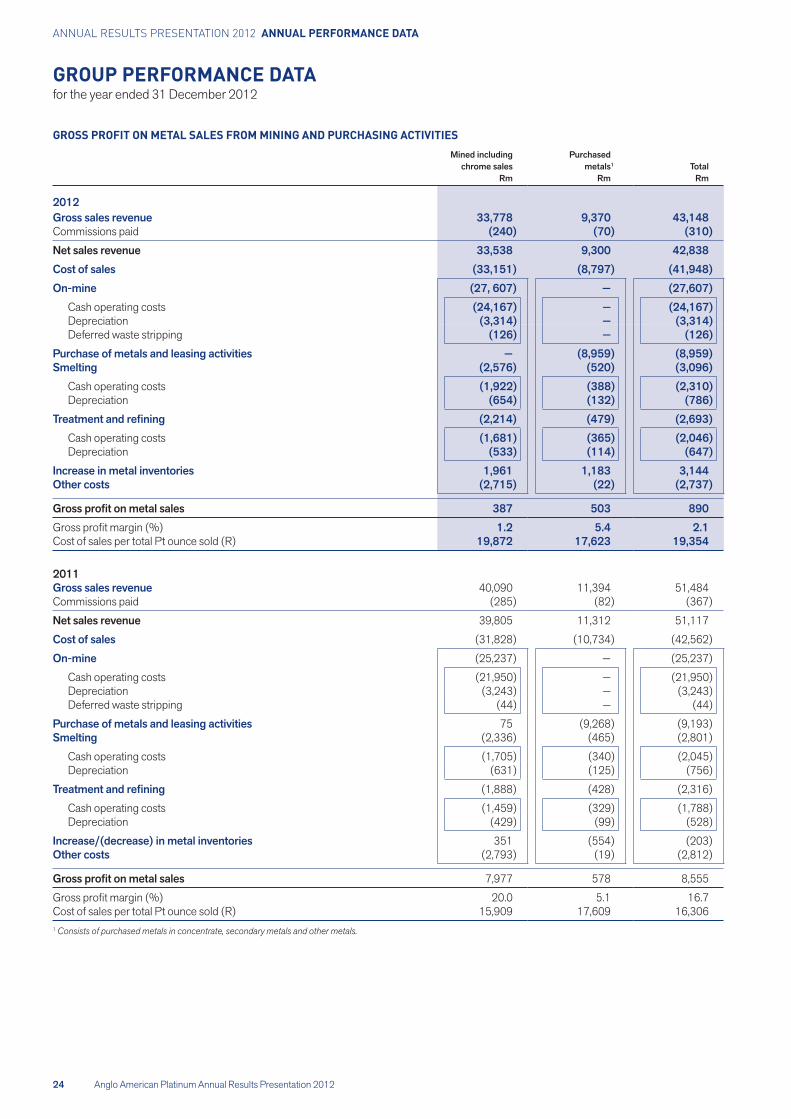
GROUP PERFORMANCE DATAfor the year ended 31 December 2012
GROSS PROFIT ON METAL SALES FROM MINING AND PURCHASING ACTIVITIESPurchased
chrome sales metals1 Total
Gross sales revenueCommissions paid
Cost of sales
—
Cash operating costs —Depreciation —Deferred waste stripping —
Purchase of metals and leasing activities —Smelting
Cash operating costsDepreciation
Cash operating costsDepreciation
Increase in metal inventoriesOther costs
Gross sales revenue 40,090 11,394 51,484Commissions paid
39,805 11,312
Cost of sales
—
Cash operating costs —Depreciation —Deferred waste stripping —
Purchase of metals and leasing activitiesSmelting
Cash operating costsDepreciation
Cash operating costsDepreciation
351Other costs
8,555
15,909 16,3061 Consists of purchased metals in concentrate, secondary metals and other metals.
Anglo American Platinum Annual Results Presentation 2012
Annual performance data
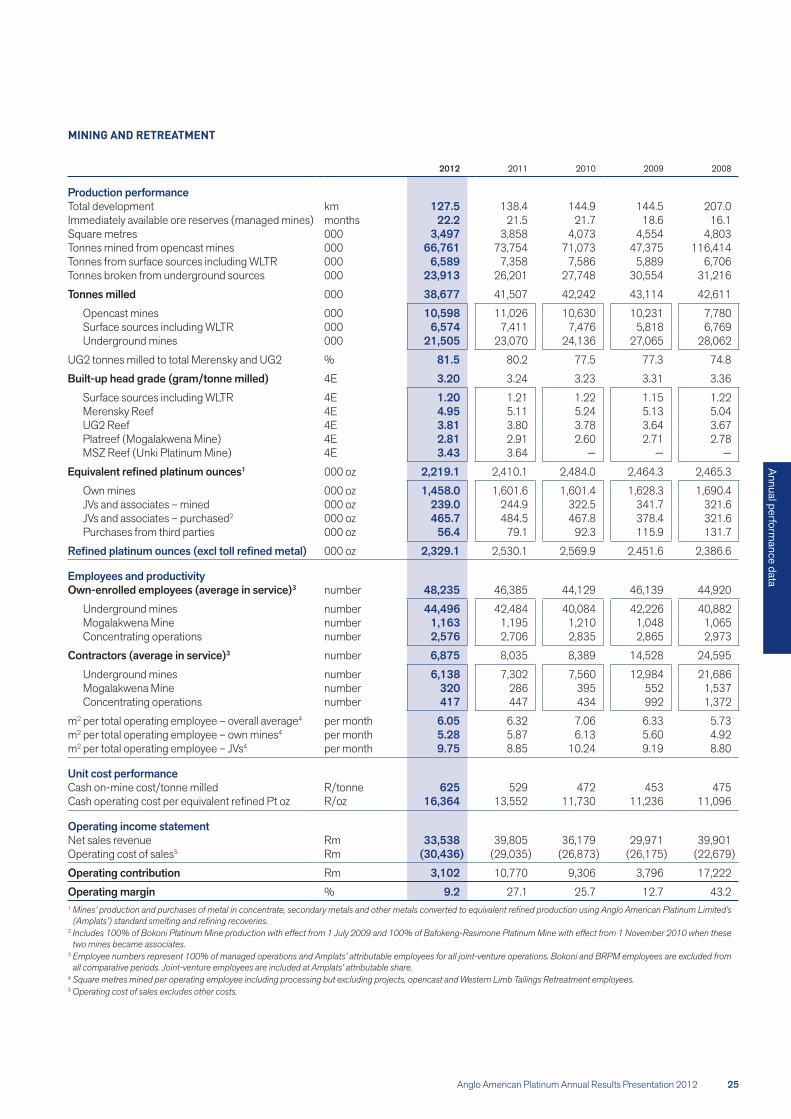
MINING AND RETREATMENT
2011 2010 2008
Production performancekmmonths
Square metres 000 3,858 4,554 4,803Tonnes mined from opencast mines 000 116,414Tonnes from surface sources including WLTR 000 5,889Tonnes broken from underground sources 000 26,201 30,554 31,216
Tonnes milled 000 42,242 43,114 42,611
Opencast mines 000 11,026 10,630 10,231Surface sources including WLTR 000 5,818Underground mines 000 24,136 28,062
UG2 tonnes milled to total Merensky and UG2 %
4E
Surface sources including WLTR 4EMerensky Reef 4EUG2 Reef 4E 3.81
4E4E 3.43 — — —
1 000 oz
Own mines 000 ozJVs and associates – mined 000 ozJVs and associates – purchased2 000 ozPurchases from third parties 000 oz
000 oz
Employees and productivity3 number 46,385 44,129 46,139 44,920
Underground mines number 42,484 40,084 42,226 40,882Mogalakwena Mine number 1,195 1,210 1,048 1,065Concentrating operations number 2,835 2,865
3 number 8,035 8,389 14,528 24,595
Underground mines number 12,984 21,686Mogalakwena Mine number 286 395 552Concentrating operations number 434 992
m2 4 per monthm2 per total operating employee – own mines4 per monthm2 per total operating employee – JVs4 per month
Unit cost performanceCash on-mine cost/tonne milled R/tonne 529 453
R/oz 13,552 11,236 11,096
Operating income statementRm 39,805 39,901
Operating cost of sales5 Rm
Rm 9,306
Operating margin %1 Mines’ production and purchases of metal in concentrate, secondary metals and other metals converted to equivalent refined production using Anglo American Platinum Limited’s
(Amplats’) standard smelting and refining recoveries.2 Includes 100% of Bokoni Platinum Mine production with effect from 1 July 2009 and 100% of Bafokeng-Rasimone Platinum Mine with effect from 1 November 2010 when these
two mines became associates.3 Employee numbers represent 100% of managed operations and Amplats’ attributable employees for all joint-venture operations. Bokoni and BRPM employees are excluded from
all comparative periods. Joint-venture employees are included at Amplats’ attributable share.4 Square metres mined per operating employee including processing but excluding projects, opencast and Western Limb Tailings Retreatment employees.5 Operating cost of sales excludes other costs.
ANNUAL RESULTS PRESENTATION 2012 ANNUAL PERFORMANCE DATA
Anglo American Platinum Annual Results Presentation 2012
GROUP PERFORMANCE DATAfor the year ended 31 December 2012
ANALYSIS OF GROUP CAPITAL EXPENDITURE2011
Wastestripping Projects Total
Bathopele Mine — 141 193 — 153 346Khomanani Mine — 185 — 20 205Thembelani Mine — 86 — 533Khuseleka Mine — — 210Siphumelele Mine — 144 — 43Tumela Mine — 256 — 293Dishaba Mine — 132 — 26 158Union North Mine — 88 92 — 129Union South Mine — 190 — 209 399Mogalakwena Mine 596 563 92 1,251Twickenham Platinum Mine — 14 — 863Unki Platinum Mine 183 — 45 — 301 346Modikwa Platinum Mine — 106 —Kroondal Platinum Mine — 154 — 230Marikana Platinum Mine — 3 68 — 2Mototolo Platinum Mine — 100 — 21 121Western Limb Tailings Retreatment 18 — 34 16 — — 16
2,504 563 2,609Polokwane Smelter — 24 — 41
— 444 205 — 81 286Mortimer Smelter — — 421 495Rustenburg Base Metal
— 134 — 254 388— — 53 — — 53
483 — 490 — 1,263Other — 288 — 202
3,282 563 3,296Capitalised interest — — — — — — 363
Total capitalised costs 3,282 563 3,296
Anglo American Platinum Annual Results Presentation 2012
Analyst results presentation 2013
2012 RESULTS PRESENTATIONfor the year ended 31 December 2012
ANGLO AMERICAN PLATINUM LIMITED
4 February 2013
2012 ANNUAL RESULTS

ANNUAL RESULTS PRESENTATION 2012 ANALYSTS RESULTS PRESENTATION 2012
Anglo American Platinum Annual Results Presentation 2012
2012 RESULTS PRESENTATIONfor the year ended 31 December 2012
2
CAUTIONARY STATEMENT
Disclaimer: This presentation has been prepared by Anglo American Platinum Limited (“Anglo American Platinum”) and comprises the written materials/slides for a presentation concerning Anglo American Platinum. By attending this presentation and/or reviewing the slides you agree to be bound by the following conditions.
This presentation is for information purposes only and does not constitute an offer to sell or the solicitation of an offer to buy shares in Anglo American Platinum. Further, it does not constitute a recommendation by Anglo American Platinum or any other party to sell or buy shares in Anglo American Platinum or any other securities. All written or oral forward-looking statements attributable to Anglo American Platinum or persons acting on their behalf are qualified in their entirety by these cautionary statements.
Forward-Looking Statements
This presentation includes forward-looking statements. All statements other than statements of historical facts included in this presentation, including, without limitation, those regarding Anglo American Platinum’s financial position, business and acquisition strategy, plans and objectives of management for future operations (including development plans and objectives relating to Anglo American Platinum’s products, production forecasts and reserve and resource positions), are forward-looking statements. Such forward-looking statements involve known and unknown risks, uncertainties and other factors which may cause the actual results, performance or achievements of Anglo American Platinum, or industry results, to be materially different from any future results, performance or achievements expressed or implied by such forward-looking statements.
Such forward-looking statements are based on numerous assumptions regarding Anglo American Platinum’s present and future business strategies and the environment in which Anglo American Platinum will operate in the future. Important factors that could cause Anglo American Platinum’s actual results, performance or achievements to differ materially from those in the forward-looking statements include, among others, levels of actual production during any period, levels of global demand and commodity market prices, mineral resource exploration and development capabilities, recovery rates and other operational capabilities, the availability of mining and processing equipment, the ability to produce and transport products profitably, the impact of foreign currency exchange rates on market prices and operating costs, the availability of sufficient credit, the effects of inflation, political uncertainty and economic conditions in relevant areas of the world, the actions of competitors, activities by governmental authorities such as changes in taxation or safety, health, environmental or other types of regulation in the countries where Anglo American Platinum operates, conflicts over land and resource ownership rights and such other risk factors identified in Anglo American Platinum’s most recent Annual Report. Forward-looking statements should, therefore, be construed in light of such risk factors and undue reliance should not be placed on forward-looking statements. These forward-looking statements speak only as of the date of this presentation. Anglo American Platinum expressly disclaims any obligation or undertaking (except as required by applicable law, the Listings Requirements of the securities exchange of the JSE Limited in South Africa and any other applicable regulations) to release publicly any updates or revisions to any forward-looking statement contained herein to reflect any change in Anglo American Platinum’s expectations with regard thereto or any change in events, conditions or circumstances on which any such statement is based.
Nothing in this presentation should be interpreted to mean that future earnings per share of Anglo American Platinum will necessarily match or exceed its historical published earnings per share.
Certain statistical and other information about Anglo American Platinum included in this presentation is sourced from publicly available third party sources. As such it presents the views of those third parties, but may not necessarily correspond to the views held by Anglo American Platinum.
No Investment Advice
This presentation has been prepared without reference to your particular investment objectives, financial situation, taxation position and particular needs. It is important that you view this presentation in its entirety. If you are in any doubt in relation to these matters, you should consult your stockbroker, bank manager, solicitor, accountant, taxation adviser or other independent financial adviser (where applicable, as authorised under the Financial Advisory and Intermediary Services Act 37 of 2002 in South Africa).
Anglo American Platinum Annual Results Presentation 2012
Analyst results presentation 2013
3
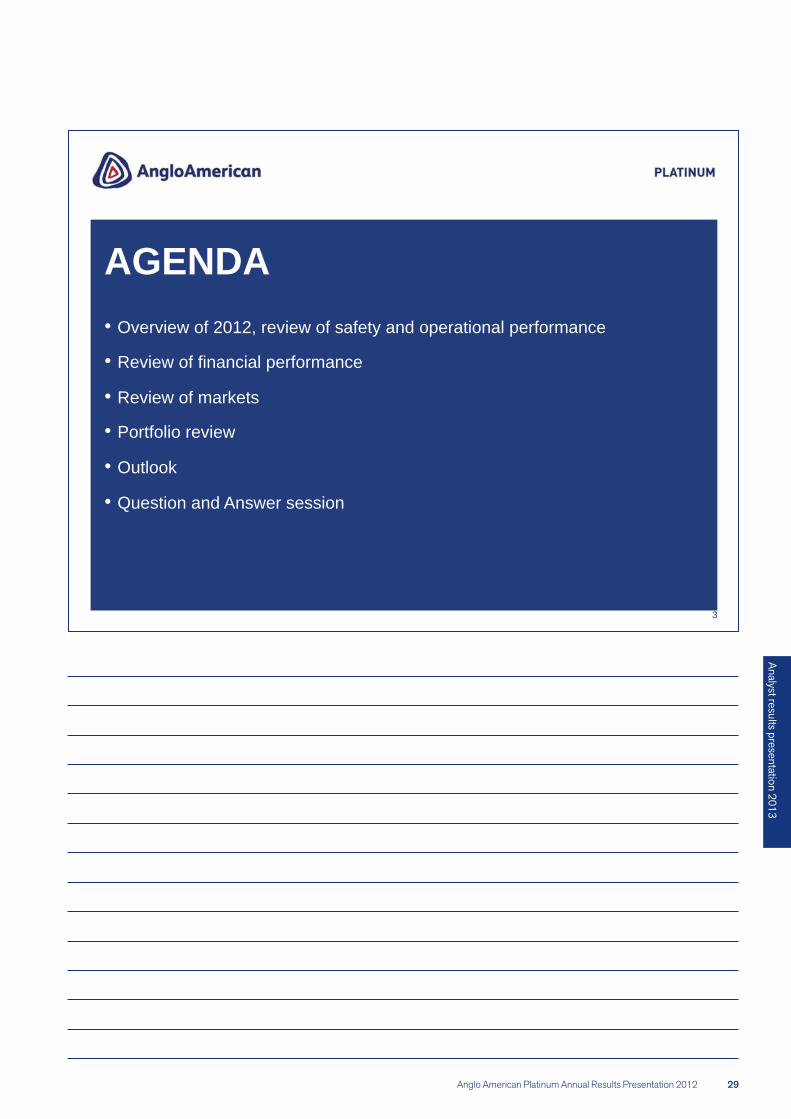
AGENDA Overview of 2012, review of safety and operational performance
Review of financial performance
Review of markets
Portfolio review
Outlook
Question and Answer session
ANNUAL RESULTS PRESENTATION 2012 ANALYSTS RESULTS PRESENTATION 2012
Anglo American Platinum Annual Results Presentation 2012
2012 RESULTS PRESENTATIONfor the year ended 31 December 2012
Anglo American Platinum Annual Results Presentation 2012 31
Analyst results presentation 2013
5
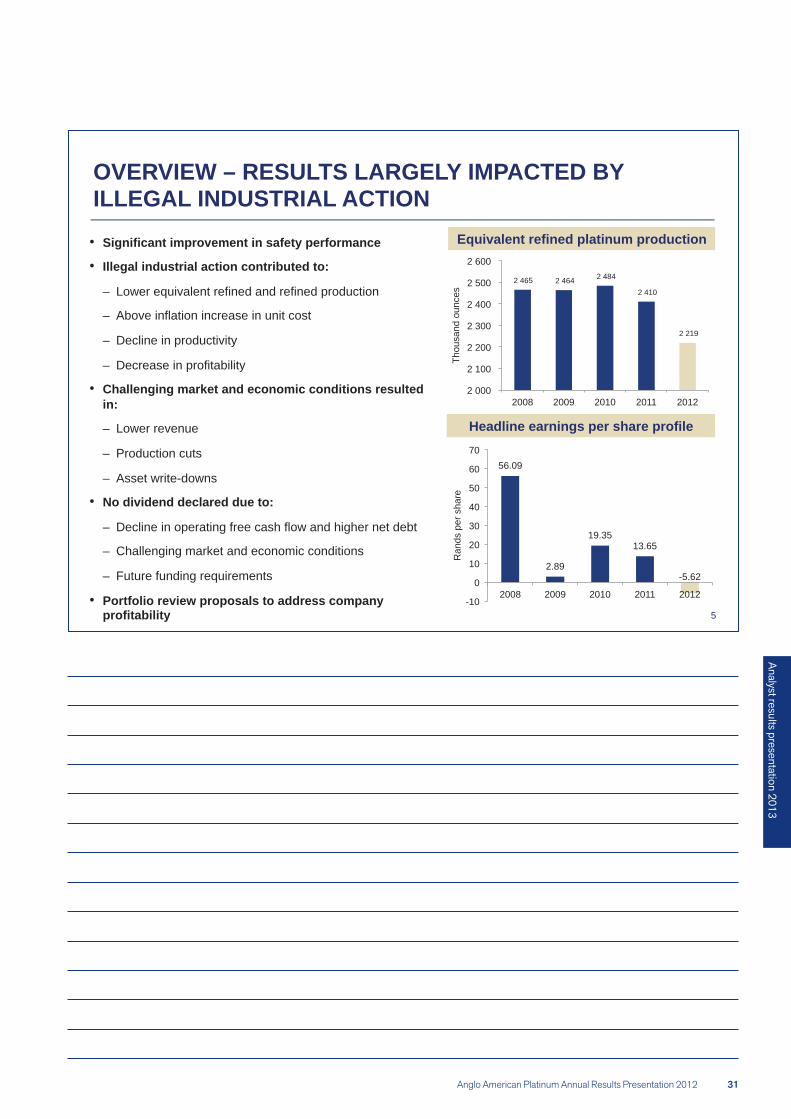
Significant improvement in safety performance
Illegal industrial action contributed to:
– Lower equivalent refined and refined production
– Above inflation increase in unit cost
– Decline in productivity
– Decrease in profitability
Challenging market and economic conditions resulted in:
– Lower revenue
– Production cuts
– Asset write-downs
No dividend declared due to:
– Decline in operating free cash flow and higher net debt
– Challenging market and economic conditions
– Future funding requirements
Portfolio review proposals to address company profitability
OVERVIEW – RESULTS LARGELY IMPACTED BY ILLEGAL INDUSTRIAL ACTION
Equivalent refined platinum production
Headline earnings per share profile
2 465 2 464 2 484
2 410
2 219
2 000
2 100
2 200
2 300
2 400
2 500
2 600
2008 2009 2010 2011 2012
Thou
sand
oun
ces
56.09
2.89
19.35 13.65
-5.62
-10
0
10
20
30
40
50
60
70
2008 2009 2010 2011 2012
Ran
ds p
er s
hare
ANNUAL RESULTS PRESENTATION 2012 ANALYSTS RESULTS PRESENTATION 2012
Anglo American Platinum Annual Results Presentation 2012
2012 RESULTS PRESENTATIONfor the year ended 31 December 2012
SAFETY
Anglo American Platinum Annual Results Presentation 2012 33
Analyst results presentation 2013
7
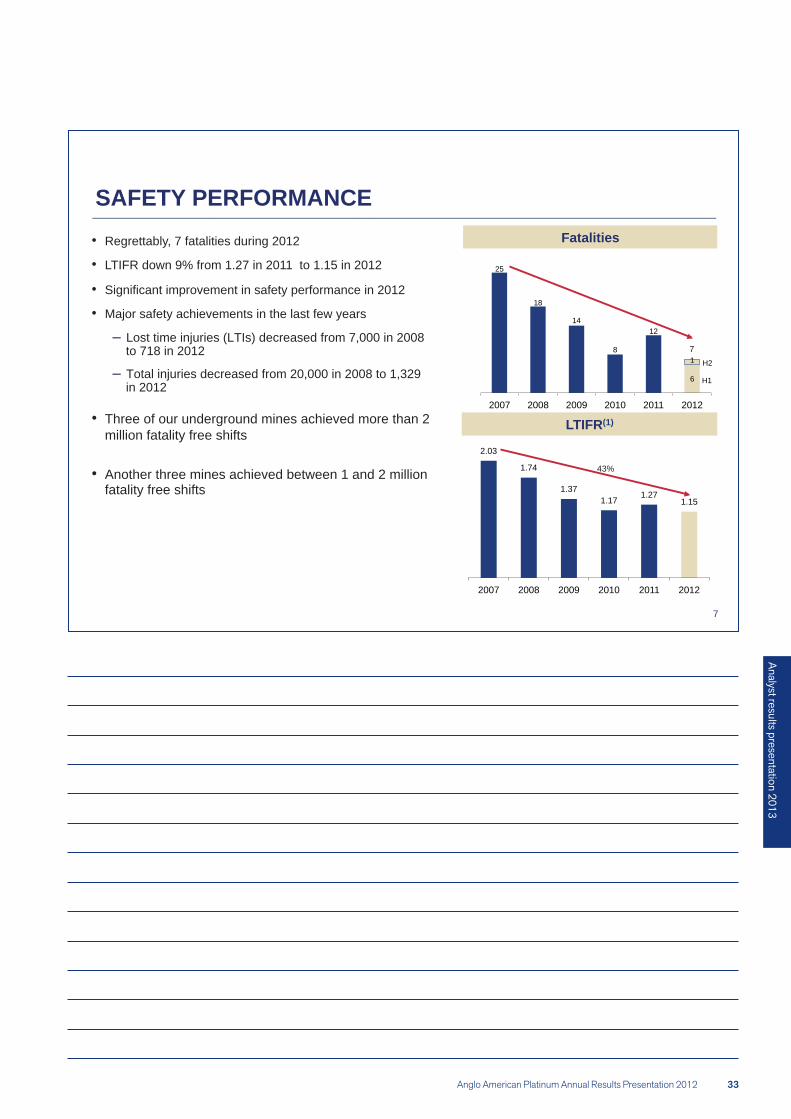
25
18
14
8
12
6
1
2007 2008 2009 2010 2011 2012
H2
H1
2.03
1.74
1.37 1.17
1.27 1.15
2007 2008 2009 2010 2011 2012
Regrettably, 7 fatalities during 2012
LTIFR down 9% from 1.27 in 2011 to 1.15 in 2012
Significant improvement in safety performance in 2012
Major safety achievements in the last few years
Lost time injuries (LTIs) decreased from 7,000 in 2008 to 718 in 2012
Total injuries decreased from 20,000 in 2008 to 1,329 in 2012
Three of our underground mines achieved more than 2 million fatality free shifts
Another three mines achieved between 1 and 2 million fatality free shifts
SAFETY PERFORMANCE Fatalities
LTIFR(1)
43%
7
ANNUAL RESULTS PRESENTATION 2012 ANALYSTS RESULTS PRESENTATION 2012
34 Anglo American Platinum Annual Results Presentation 2012
2012 RESULTS PRESENTATIONfor the year ended 31 December 2012
OPERATIONAL REVIEW
Anglo American Platinum Annual Results Presentation 2012
Analyst results presentation 2013
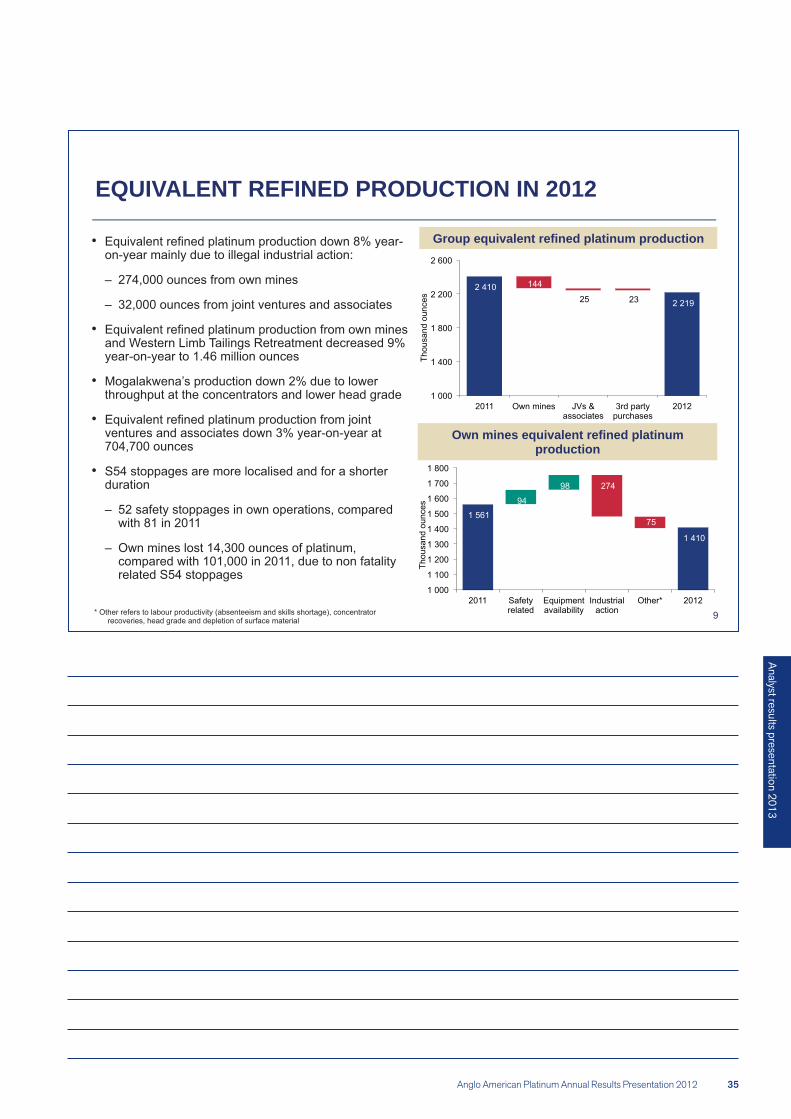
EQUIVALENT REFINED PRODUCTION IN 2012
Group equivalent refined platinum production
Own mines equivalent refined platinum production
ANNUAL RESULTS PRESENTATION 2012 ANALYSTS RESULTS PRESENTATION 2012
Anglo American Platinum Annual Results Presentation 2012
2012 RESULTS PRESENTATIONfor the year ended 31 December 2012
10
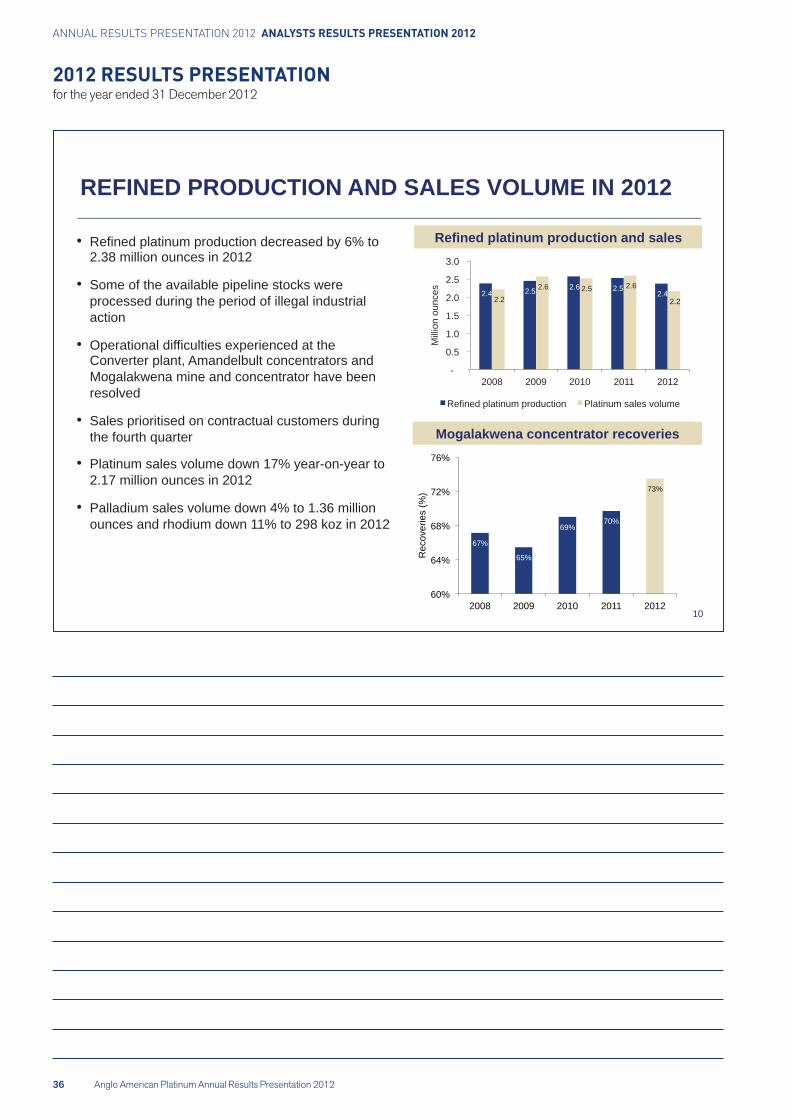
Refined platinum production decreased by 6% to 2.38 million ounces in 2012
Some of the available pipeline stocks were processed during the period of illegal industrial action
Operational difficulties experienced at the Converter plant, Amandelbult concentrators and Mogalakwena mine and concentrator have been resolved
Sales prioritised on contractual customers during the fourth quarter
Platinum sales volume down 17% year-on-year to 2.17 million ounces in 2012
Palladium sales volume down 4% to 1.36 million ounces and rhodium down 11% to 298 koz in 2012
REFINED PRODUCTION AND SALES VOLUME IN 2012
Refined platinum production and sales
Mogalakwena concentrator recoveries
10
2.4 2.5 2.6 2.5 2.4
2.2 2.6 2.5 2.6
2.2
-
0.5
1.0
1.5
2.0
2.5
3.0
2008 2009 2010 2011 2012
Mill
ion
ounc
es
Refined platinum production Platinum sales volume
67%
65%
69% 70%
73%
60%
64%
68%
72%
76%
2008 2009 2010 2011 2012
Rec
over
ies
(%)
Anglo American Platinum Annual Results Presentation 2012
Analyst results presentation 2013
11
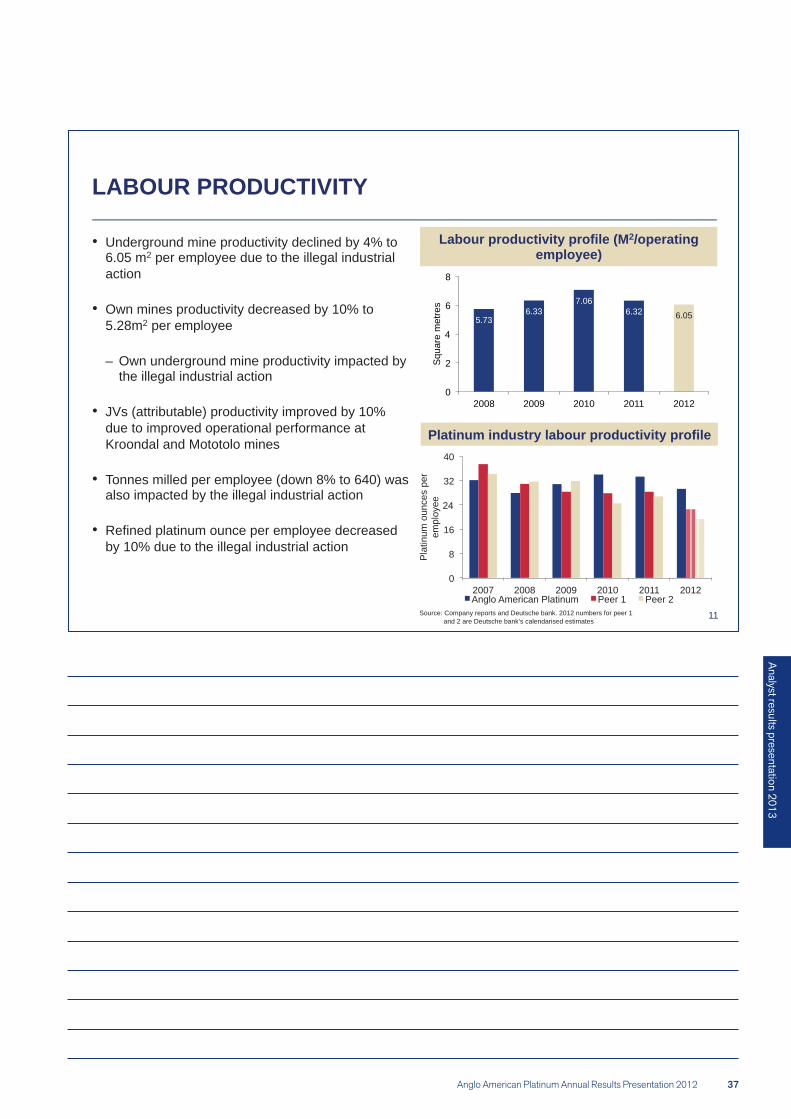
LABOUR PRODUCTIVITY
Underground mine productivity declined by 4% to 6.05 m2 per employee due to the illegal industrial action
Own mines productivity decreased by 10% to 5.28m2 per employee
– Own underground mine productivity impacted by the illegal industrial action
JVs (attributable) productivity improved by 10% due to improved operational performance at Kroondal and Mototolo mines
Tonnes milled per employee (down 8% to 640) was also impacted by the illegal industrial action
Refined platinum ounce per employee decreased by 10% due to the illegal industrial action
Labour productivity profile (M2/operating employee)
Platinum industry labour productivity profile
5.73 6.33
7.06 6.32 6.05
0
2
4
6
8
2008 2009 2010 2011 2012
Squ
are
met
res
0
8
16
24
32
40
2007 2008 2009 2010 2011 2012
Pla
tinum
oun
ces
per
empl
oyee
Anglo American Platinum Peer 1 Peer 2 Source: Company reports and Deutsche bank. 2012 numbers for peer 1 and 2 are Deutsche bank‘s calendarised estimates
ANNUAL RESULTS PRESENTATION 2012 ANALYSTS RESULTS PRESENTATION 2012
38 Anglo American Platinum Annual Results Presentation 2012
2012 RESULTS PRESENTATIONfor the year ended 31 December 2012
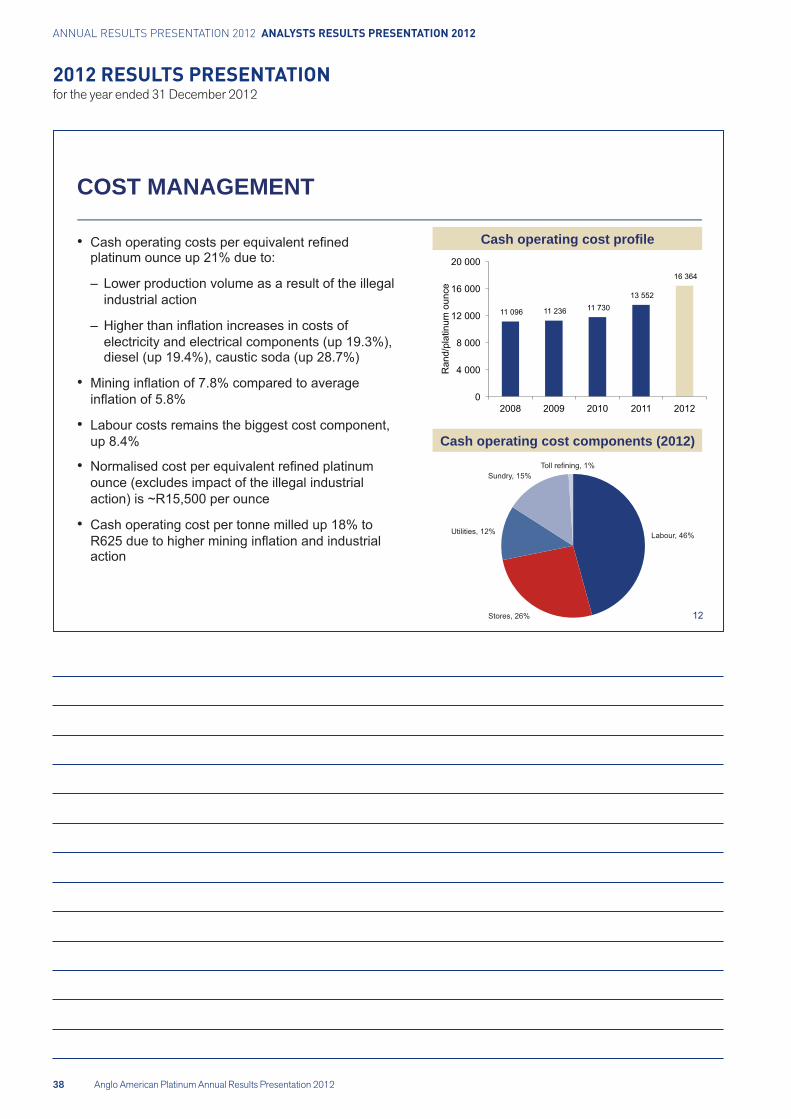
COST MANAGEMENT
Cash operating cost profile
Cash operating cost components (2012)
Anglo American Platinum Annual Results Presentation 2012
Analyst results presentation 2013
REVIEW OF FINANCIAL PERFORMANCE
ANNUAL RESULTS PRESENTATION 2012 ANALYSTS RESULTS PRESENTATION 2012
Anglo American Platinum Annual Results Presentation 2012
2012 RESULTS PRESENTATIONfor the year ended 31 December 2012
14
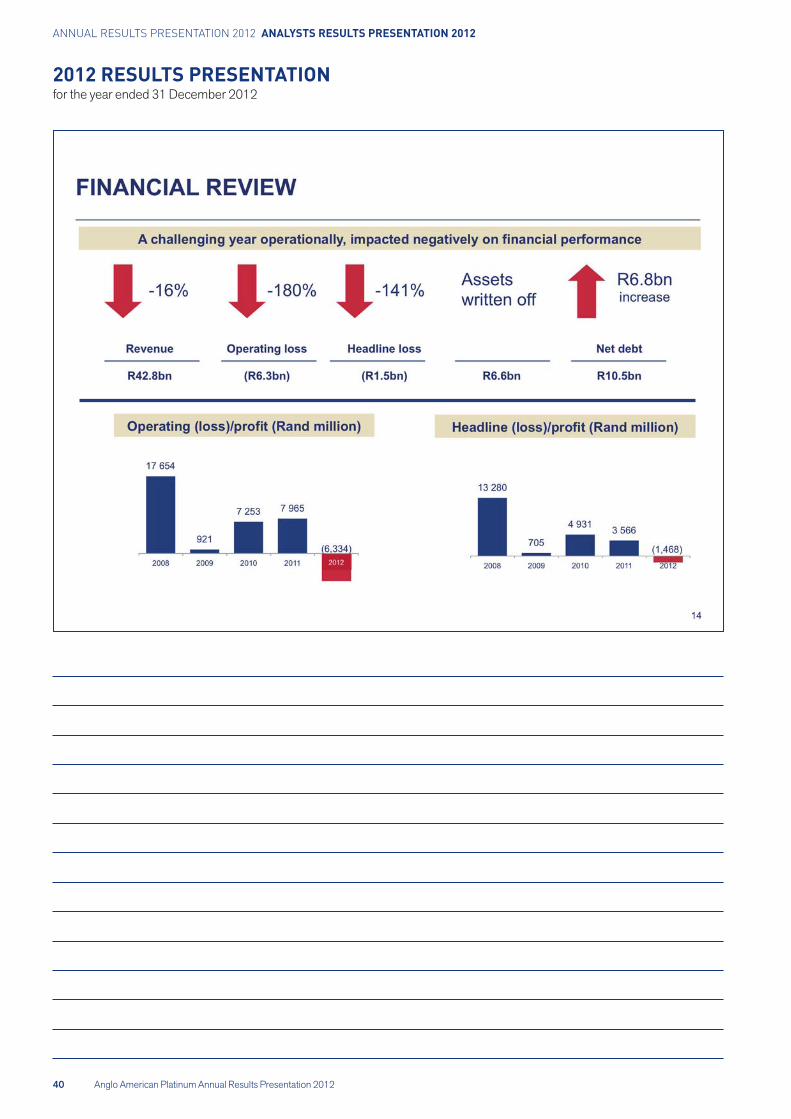
FINANCIAL REVIEW
A challenging year operationally, impacted negatively on financial performance
-141% -16% R6.8bn increase
Revenue Operating loss Headline loss Net debt
R42.8bn (R6.3bn) (R1.5bn) R6.6bn R10.5bn
17 654
921
7 253 7 965
(6,334) 2008 2009 2010 2011 2012
-180% Assets written off
13 280
705
4 931 3 566
(1,468) 2008 2009 2010 2011 2012
Headline (loss)/profit (Rand million) Operating (loss)/profit (Rand million)
Anglo American Platinum Annual Results Presentation 2012 41
Analyst results presentation 2013
15
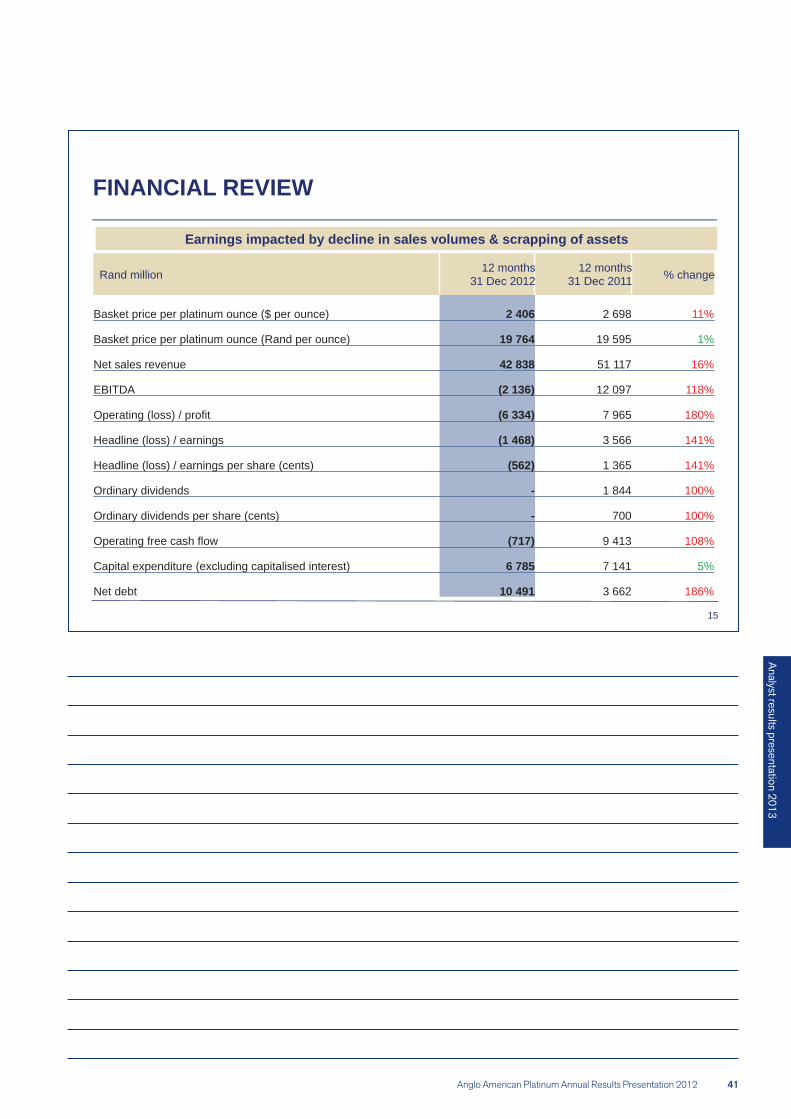
FINANCIAL REVIEW
Rand million 12 months 31 Dec 2012
12 months 31 Dec 2011 % change
Basket price per platinum ounce ($ per ounce) 2 406 2 698 11%
Basket price per platinum ounce (Rand per ounce) 19 764 19 595 1%
Net sales revenue 42 838 51 117 16%
EBITDA (2 136) 12 097 118%
Operating (loss) / profit (6 334) 7 965 180%
Headline (loss) / earnings (1 468) 3 566 141%
Headline (loss) / earnings per share (cents) (562) 1 365 141%
Ordinary dividends - 1 844 100%
Ordinary dividends per share (cents) - 700 100%
Operating free cash flow (717) 9 413 108%
Capital expenditure (excluding capitalised interest) 6 785 7 141 5%
Net debt 10 491 3 662 186%
Earnings impacted by decline in sales volumes & scrapping of assets
ANNUAL RESULTS PRESENTATION 2012 ANALYSTS RESULTS PRESENTATION 2012
Anglo American Platinum Annual Results Presentation 2012
2012 RESULTS PRESENTATIONfor the year ended 31 December 2012
16
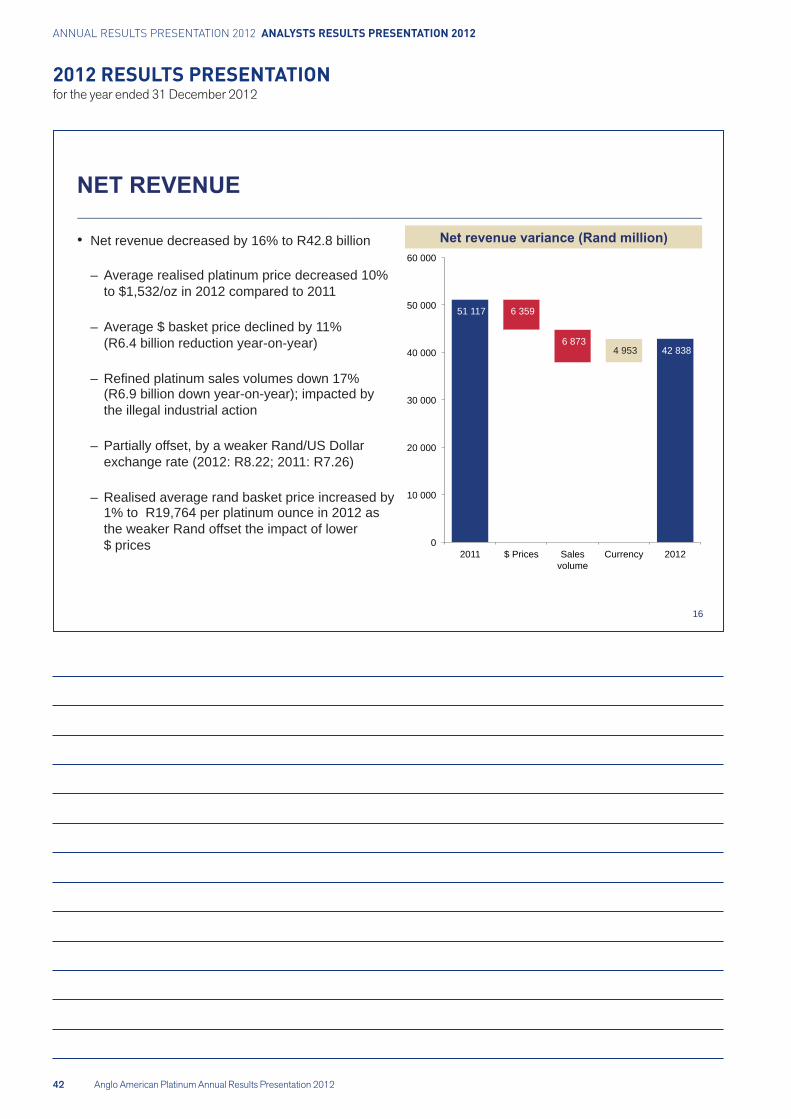
Net revenue decreased by 16% to R42.8 billion
– Average realised platinum price decreased 10% to $1,532/oz in 2012 compared to 2011
– Average $ basket price declined by 11% (R6.4 billion reduction year-on-year)
– Refined platinum sales volumes down 17% (R6.9 billion down year-on-year); impacted by the illegal industrial action
– Partially offset, by a weaker Rand/US Dollar exchange rate (2012: R8.22; 2011: R7.26)
– Realised average rand basket price increased by 1% to R19,764 per platinum ounce in 2012 as the weaker Rand offset the impact of lower $ prices
51 117 6 359
6 873 4 953 42 838
0
10 000
20 000
30 000
40 000
50 000
60 000
2011 $ Prices Sales volume
Currency 2012
Anglo American Platinum Annual Results Presentation 2012 43
Analyst results presentation 2013
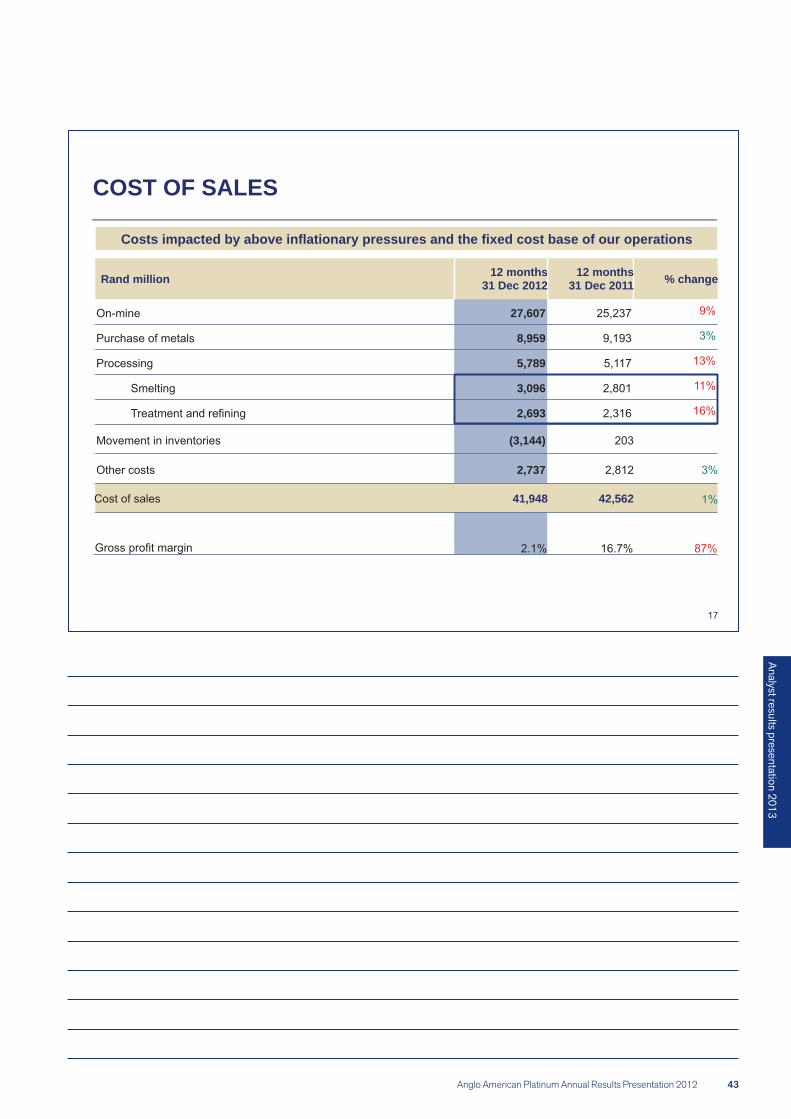
COST OF SALES
Rand million 12 months 31 Dec 2012
12 months 31 Dec 2011 % change
27,607
8,959
5,789
3,096
2,693
(3,144)
2,737
41,948 42,562
Costs impacted by above inflationary pressures and the fixed cost base of our operations
ANNUAL RESULTS PRESENTATION 2012 ANALYSTS RESULTS PRESENTATION 2012
44 Anglo American Platinum Annual Results Presentation 2012
2012 RESULTS PRESENTATIONfor the year ended 31 December 2012
18
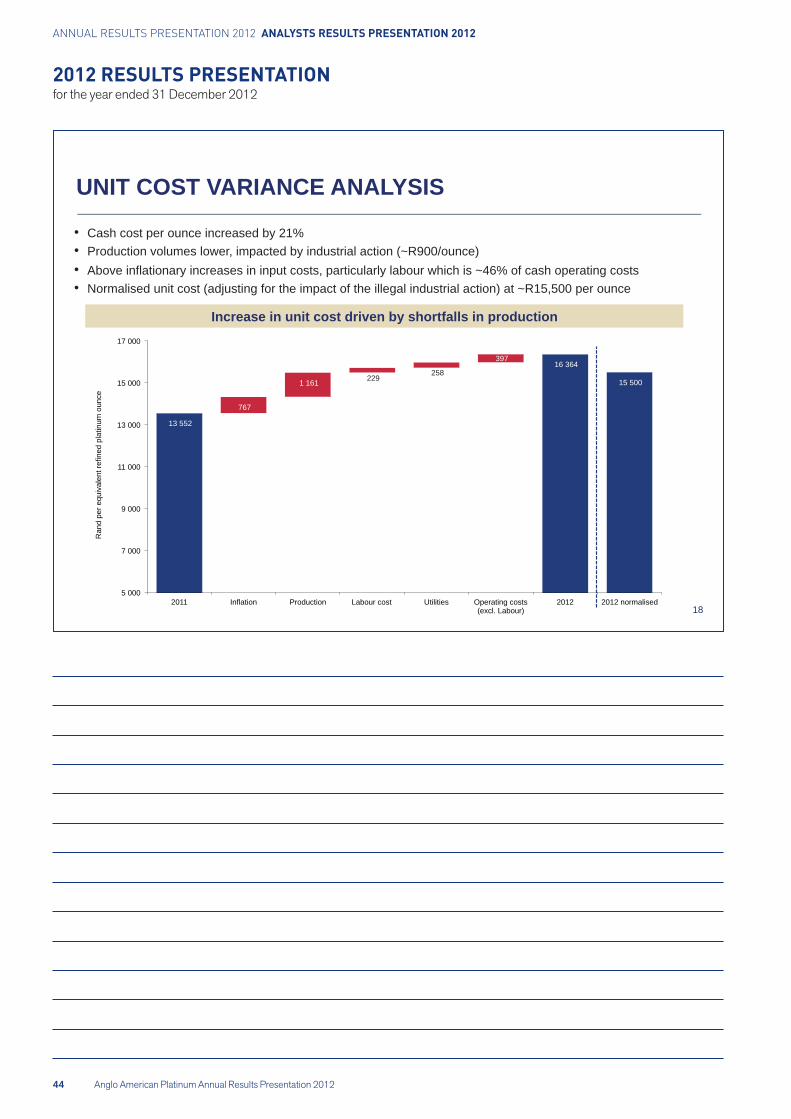
UNIT COST VARIANCE ANALYSIS
Increase in unit cost driven by shortfalls in production
Cash cost per ounce increased by 21% Production volumes lower, impacted by industrial action (~R900/ounce) Above inflationary increases in input costs, particularly labour which is ~46% of cash operating costs Normalised unit cost (adjusting for the impact of the illegal industrial action) at ~R15,500 per ounce
13 552
767
1 161 229 258
397 16 364
15 500
5 000
7 000
9 000
11 000
13 000
15 000
17 000
2011 Inflation Production Labour cost Utilities Operating costs (excl. Labour)
2012 2012 normalised
Ran
d pe
r equ
ival
ent r
efin
ed p
latin
um o
unce
Anglo American Platinum Annual Results Presentation 2012
Analyst results presentation 2013
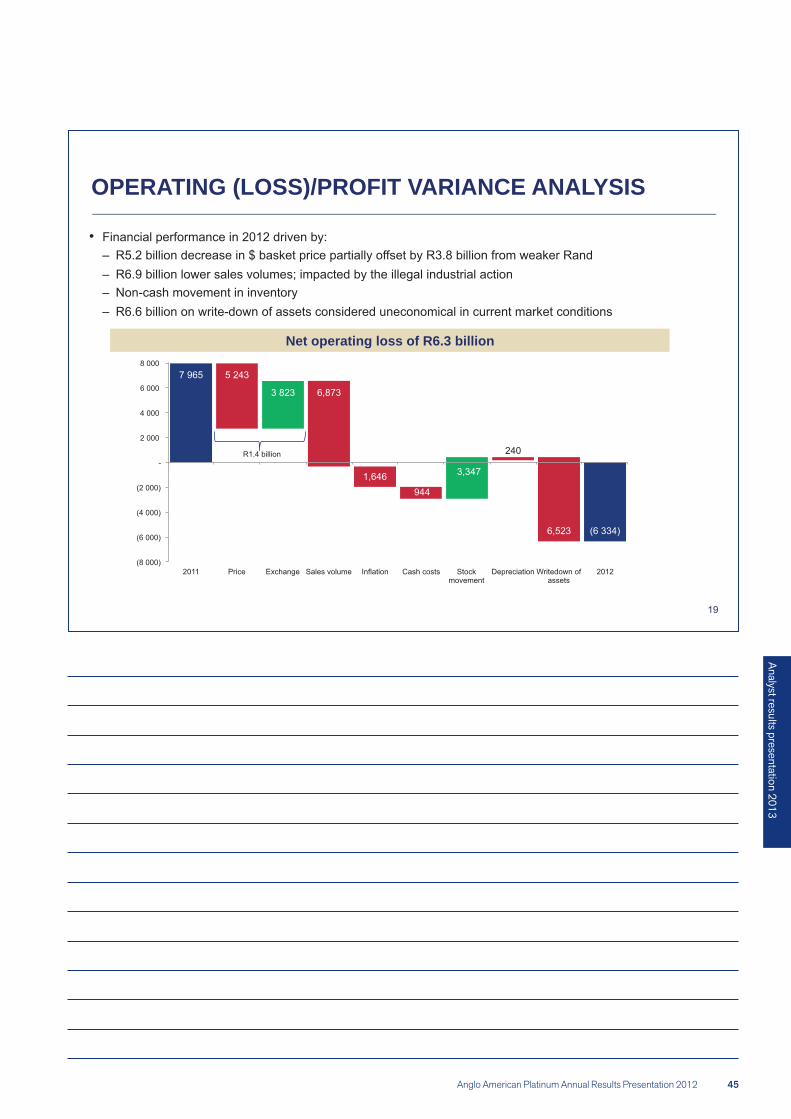
OPERATING (LOSS)/PROFIT VARIANCE ANALYSIS
Net operating loss of R6.3 billion
ANNUAL RESULTS PRESENTATION 2012 ANALYSTS RESULTS PRESENTATION 2012
Anglo American Platinum Annual Results Presentation 2012
2012 RESULTS PRESENTATIONfor the year ended 31 December 2012
20
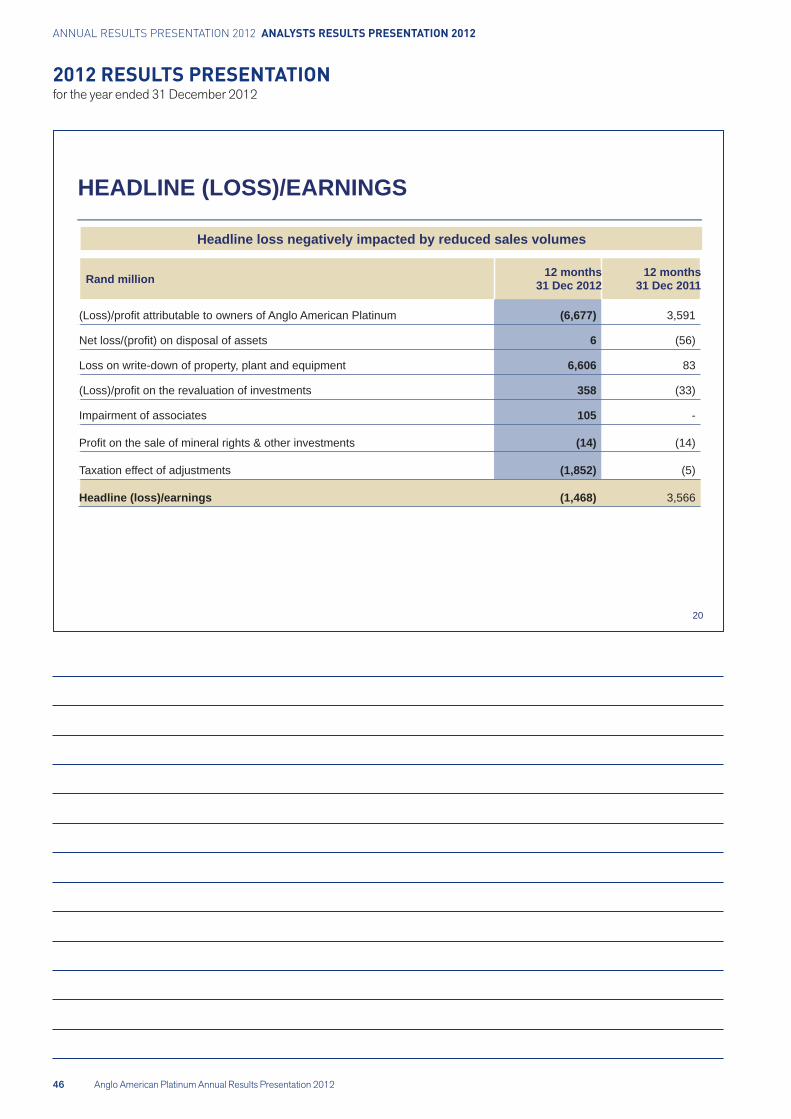
HEADLINE (LOSS)/EARNINGS
Rand million 12 months 31 Dec 2012
12 months 31 Dec 2011
(Loss)/profit attributable to owners of Anglo American Platinum (6,677) 3,591
Net loss/(profit) on disposal of assets 6 (56)
Loss on write-down of property, plant and equipment 6,606 83
(Loss)/profit on the revaluation of investments 358 (33)
Impairment of associates 105 -
Profit on the sale of mineral rights & other investments (14) (14)
Taxation effect of adjustments (1,852) (5)
Headline (loss)/earnings (1,468) 3,566
Headline loss negatively impacted by reduced sales volumes
Anglo American Platinum Annual Results Presentation 2012
Analyst results presentation 2013
21
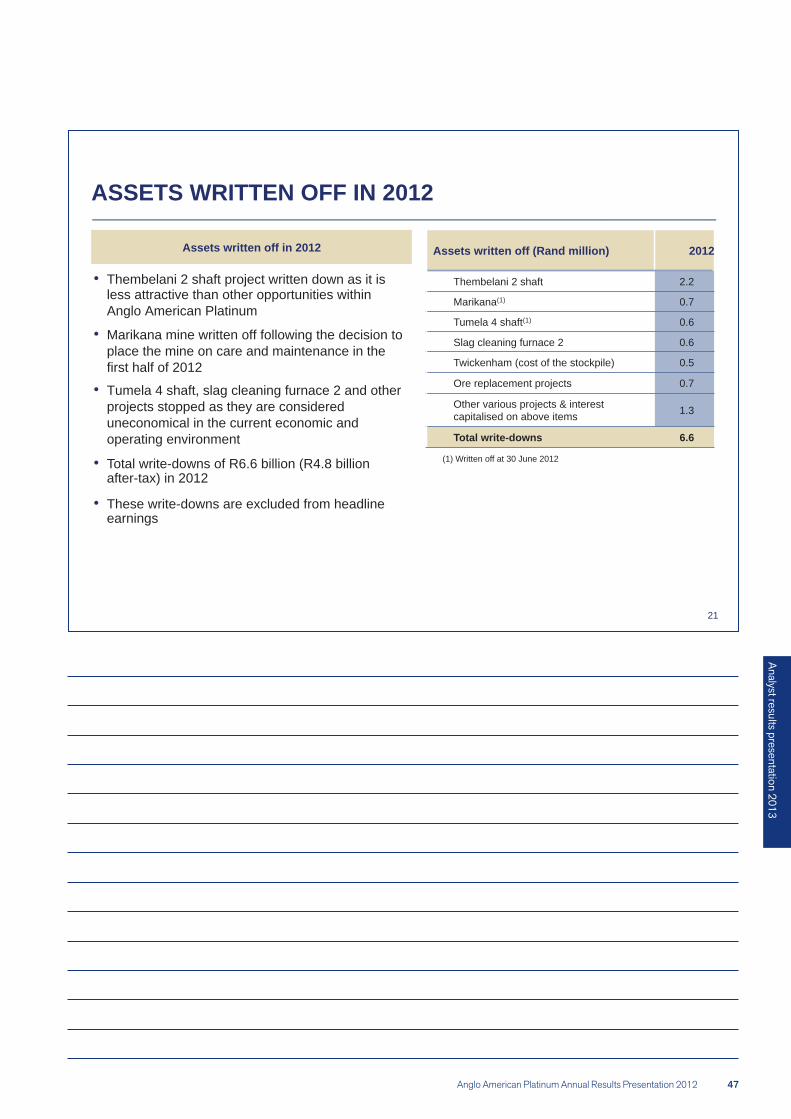
ASSETS WRITTEN OFF IN 2012
Assets written off in 2012
Thembelani 2 shaft project written down as it is less attractive than other opportunities within Anglo American Platinum
Marikana mine written off following the decision to place the mine on care and maintenance in the first half of 2012
Tumela 4 shaft, slag cleaning furnace 2 and other projects stopped as they are considered uneconomical in the current economic and operating environment
Total write-downs of R6.6 billion (R4.8 billion after-tax) in 2012
These write-downs are excluded from headline earnings
(1) Written off at 30 June 2012
Assets written off (Rand million) 2012
Thembelani 2 shaft 2.2
Marikana(1) 0.7
Tumela 4 shaft(1) 0.6
Slag cleaning furnace 2 0.6
Twickenham (cost of the stockpile) 0.5
Ore replacement projects 0.7
Other various projects & interest capitalised on above items 1.3
Total write-downs 6.6
ANNUAL RESULTS PRESENTATION 2012 ANALYSTS RESULTS PRESENTATION 2012
48 Anglo American Platinum Annual Results Presentation 2012
2012 RESULTS PRESENTATIONfor the year ended 31 December 2012
12 months 31 Dec
2012
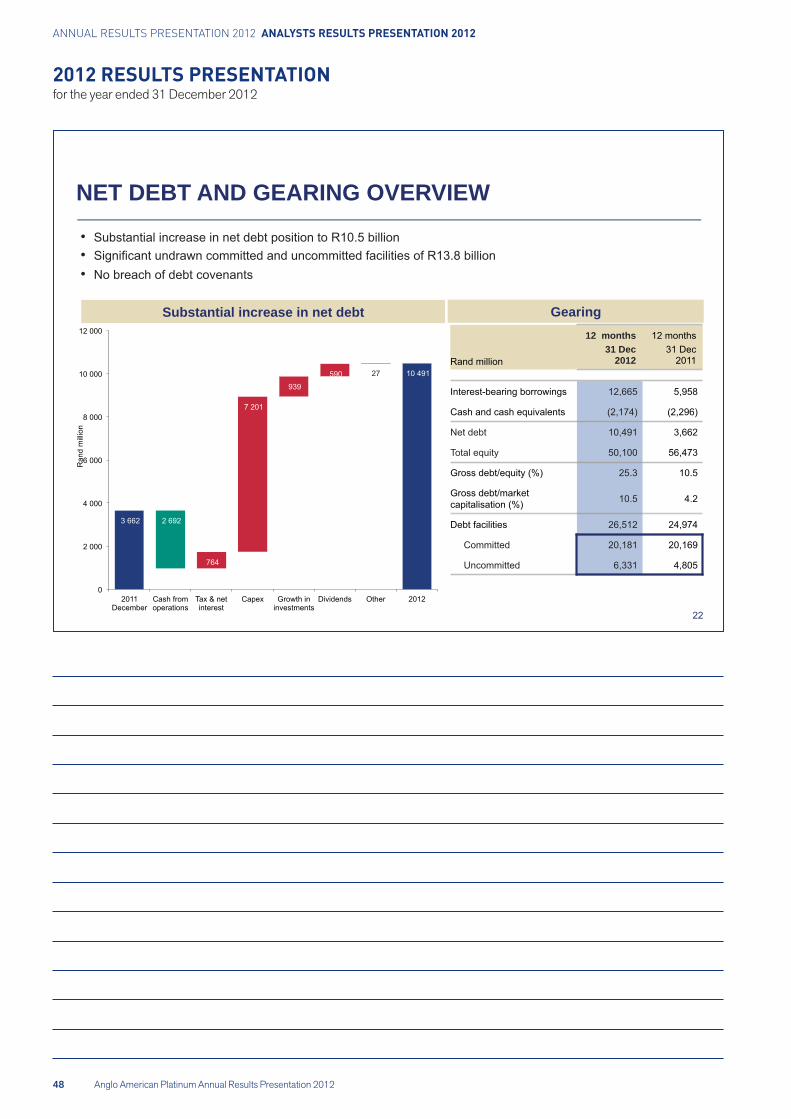
NET DEBT AND GEARING OVERVIEW
Substantial increase in net debt Gearing
Anglo American Platinum Annual Results Presentation 2012
Analyst results presentation 2013
REVIEW OF MARKETS
ANNUAL RESULTS PRESENTATION 2012 ANALYSTS RESULTS PRESENTATION 2012
Anglo American Platinum Annual Results Presentation 2012
2012 RESULTS PRESENTATIONfor the year ended 31 December 2012
24
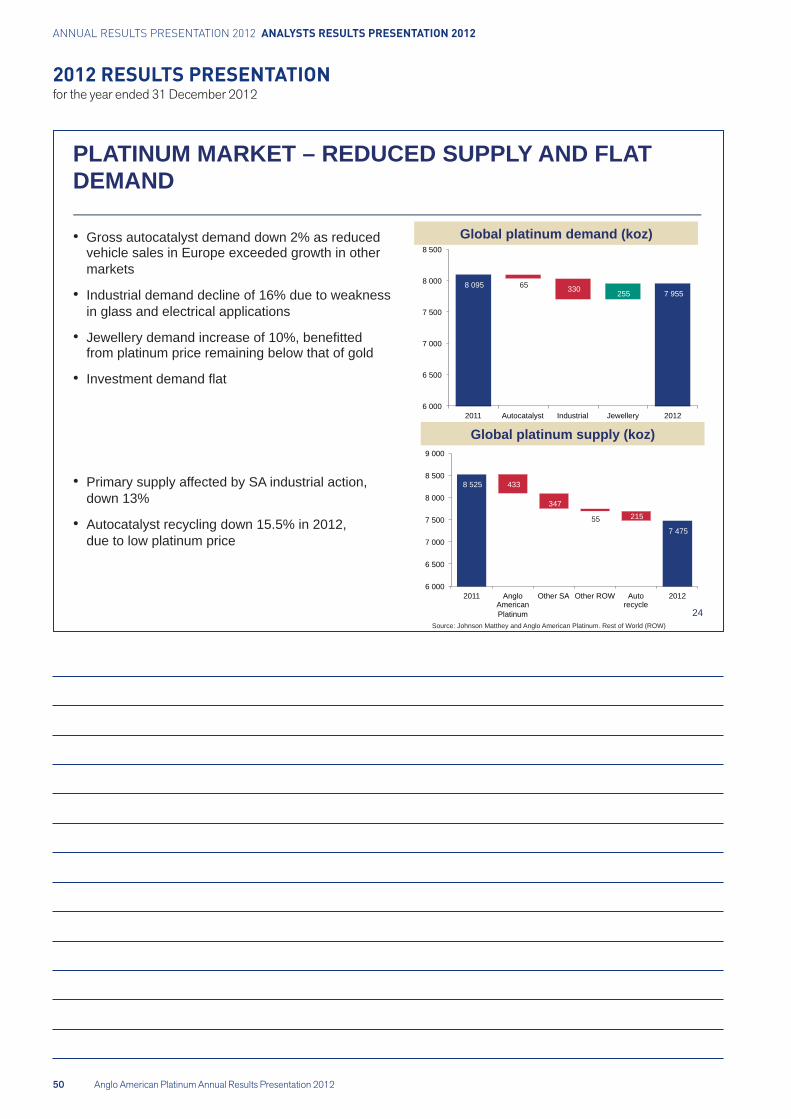
PLATINUM MARKET – REDUCED SUPPLY AND FLAT DEMAND
Gross autocatalyst demand down 2% as reduced vehicle sales in Europe exceeded growth in other markets
Industrial demand decline of 16% due to weakness in glass and electrical applications
Jewellery demand increase of 10%, benefitted from platinum price remaining below that of gold
Investment demand flat
Primary supply affected by SA industrial action, down 13%
Autocatalyst recycling down 15.5% in 2012, due to low platinum price
Global platinum demand (koz)
Global platinum supply (koz)
8 525 433
347
55 215
7 475
6 000
6 500
7 000
7 500
8 000
8 500
9 000
2011 Anglo American Platinum
Other SA Other ROW Auto recycle
2012
Source: Johnson Matthey and Anglo American Platinum. Rest of World (ROW)
8 095 65 330 255 7 955
6 000
6 500
7 000
7 500
8 000
8 500
2011 Autocatalyst Industrial Jewellery 2012
Anglo American Platinum Annual Results Presentation 2012
Analyst results presentation 2013
25
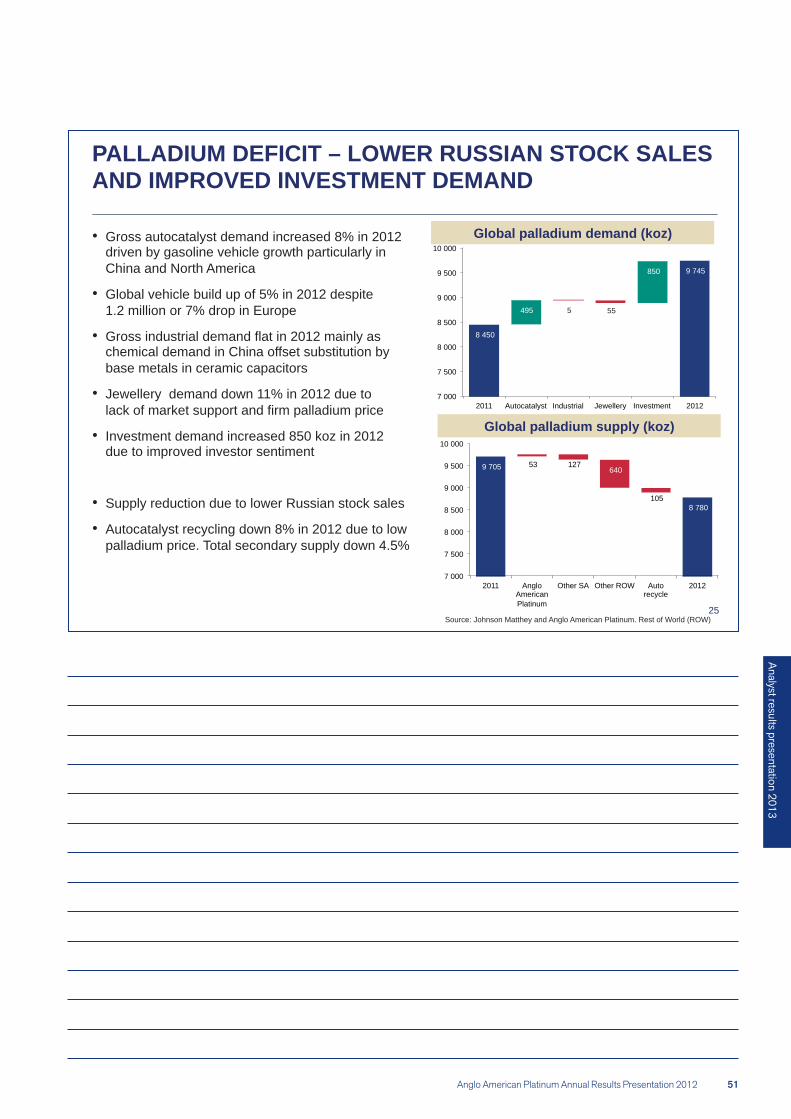
PALLADIUM DEFICIT – LOWER RUSSIAN STOCK SALES AND IMPROVED INVESTMENT DEMAND
Gross autocatalyst demand increased 8% in 2012 driven by gasoline vehicle growth particularly in China and North America
Global vehicle build up of 5% in 2012 despite 1.2 million or 7% drop in Europe
Gross industrial demand flat in 2012 mainly as chemical demand in China offset substitution by base metals in ceramic capacitors
Jewellery demand down 11% in 2012 due to lack of market support and firm palladium price
Investment demand increased 850 koz in 2012 due to improved investor sentiment
Supply reduction due to lower Russian stock sales
Autocatalyst recycling down 8% in 2012 due to low palladium price. Total secondary supply down 4.5%
Global palladium demand (koz)
Global palladium supply (koz)
8 450
495 5 55
850 9 745
7 000
7 500
8 000
8 500
9 000
9 500
10 000
2011 Autocatalyst Industrial Jewellery Investment 2012
Source: Johnson Matthey and Anglo American Platinum. Rest of World (ROW)
9 705 53 127 640
105 8 780
7 000
7 500
8 000
8 500
9 000
9 500
10 000
2011 Anglo American Platinum
Other SA Other ROW Auto recycle
2012
ANNUAL RESULTS PRESENTATION 2012 ANALYSTS RESULTS PRESENTATION 2012
Anglo American Platinum Annual Results Presentation 2012
2012 RESULTS PRESENTATIONfor the year ended 31 December 2012
26
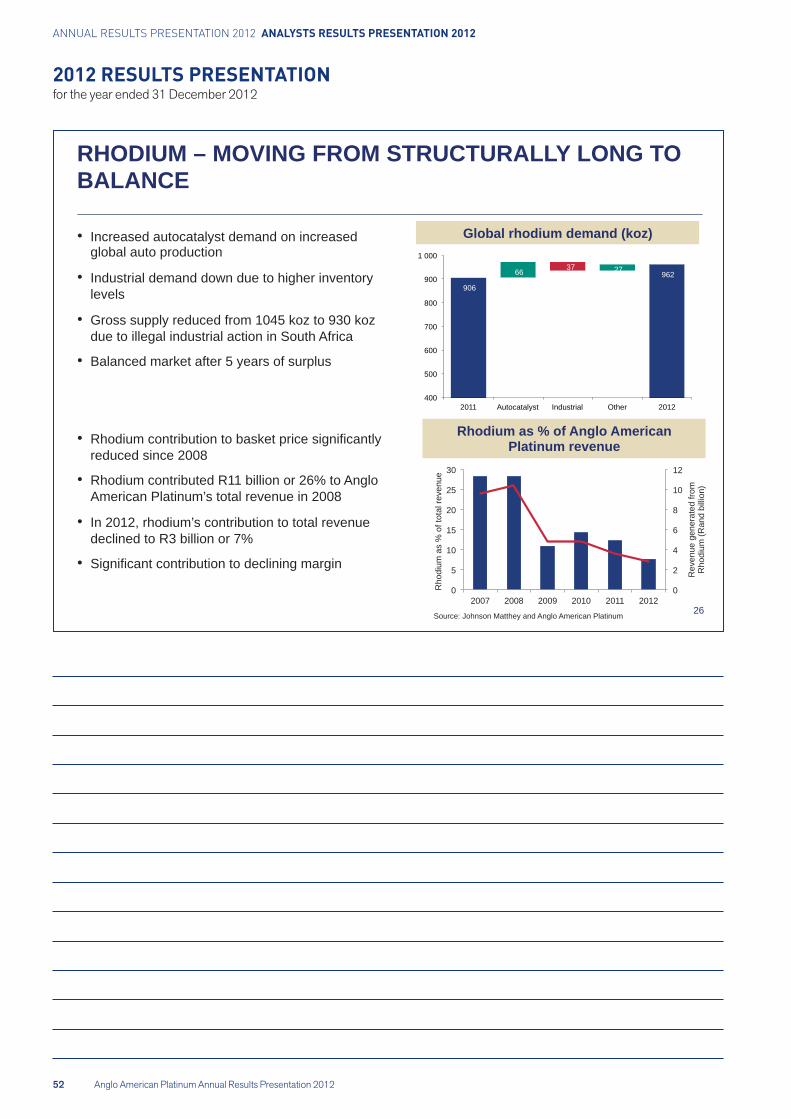
RHODIUM – MOVING FROM STRUCTURALLY LONG TO BALANCE
Increased autocatalyst demand on increased global auto production
Industrial demand down due to higher inventory levels
Gross supply reduced from 1045 koz to 930 koz due to illegal industrial action in South Africa
Balanced market after 5 years of surplus
Rhodium contribution to basket price significantly reduced since 2008
Rhodium contributed R11 billion or 26% to Anglo American Platinum’s total revenue in 2008
In 2012, rhodium’s contribution to total revenue declined to R3 billion or 7%
Significant contribution to declining margin
Global rhodium demand (koz)
Rhodium as % of Anglo American Platinum revenue
0
2
4
6
8
10
12
0
5
10
15
20
25
30
2007 2008 2009 2010 2011 2012
Rev
enue
gen
erat
ed fr
om
Rho
dium
(Ran
d bi
llion
)
Rho
dium
as
% o
f tot
al re
venu
e
906
66 37 27
962
400
500
600
700
800
900
1 000
2011 Autocatalyst Industrial Other 2012
Source: Johnson Matthey and Anglo American Platinum
Anglo American Platinum Annual Results Presentation 2012
Analyst results presentation 2013
27
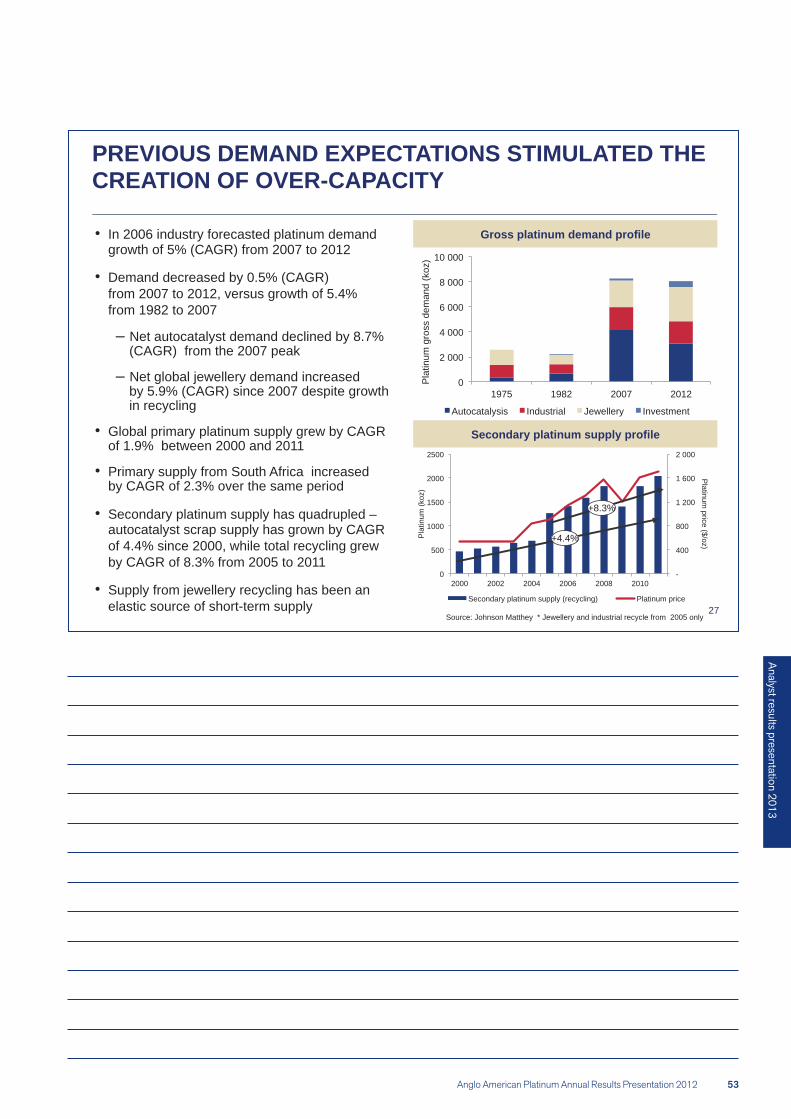
In 2006 industry forecasted platinum demand growth of 5% (CAGR) from 2007 to 2012
Demand decreased by 0.5% (CAGR) from 2007 to 2012, versus growth of 5.4% from 1982 to 2007
Net autocatalyst demand declined by 8.7% (CAGR) from the 2007 peak
Net global jewellery demand increased by 5.9% (CAGR) since 2007 despite growth in recycling
Global primary platinum supply grew by CAGR of 1.9% between 2000 and 2011
Primary supply from South Africa increased by CAGR of 2.3% over the same period
Secondary platinum supply has quadrupled – autocatalyst scrap supply has grown by CAGR of 4.4% since 2000, while total recycling grew by CAGR of 8.3% from 2005 to 2011
Supply from jewellery recycling has been an elastic source of short-term supply
Gross platinum demand profile
Secondary platinum supply profile
Source: Johnson Matthey * Jewellery and industrial recycle from 2005 only
0
2 000
4 000
6 000
8 000
10 000
1975 1982 2007 2012
Pla
tinum
gro
ss d
eman
d (k
oz)
Autocatalysis Industrial Jewellery Investment
PREVIOUS DEMAND EXPECTATIONS STIMULATED THE CREATION OF OVER-CAPACITY
-
400
800
1 200
1 600
2 000
0
500
1000
1500
2000
2500
2000 2002 2004 2006 2008 2010
Platinum
price ($/oz)
Pla
tinum
(koz
)
Secondary platinum supply (recycling) Platinum price
+8.3%
+4.4%

ANNUAL RESULTS PRESENTATION 2012 ANALYSTS RESULTS PRESENTATION 2012
Anglo American Platinum Annual Results Presentation 2012
2012 RESULTS PRESENTATIONfor the year ended 31 December 2012
Anglo American Platinum Annual Results Presentation 2012
Analyst results presentation 2013
29
Full review of the business across the entire value chain to address the structural challenges that have eroded profitability over time
Taking action to create a sustainable, competitive and profitable platinum business for the long-term benefit of all our stakeholders
Improving the profitability of our business
Aligning our business with expectations of long-term market demand
A sustainable, competitive and profitable Anglo American Platinum will be on a sure footing to continue substantial investment for the long term
Anglo American Platinum continues to take its social responsibilities seriously, particularly to its employees and surrounding communities
A comprehensive ‘Social Plan’ has been developed to offset the impacts of restructuring
KEY MESSAGES
ANNUAL RESULTS PRESENTATION 2012 ANALYSTS RESULTS PRESENTATION 2012
Anglo American Platinum Annual Results Presentation 2012
2012 RESULTS PRESENTATIONfor the year ended 31 December 2012
30
-1
0
1
2
3
4
5
0.8
0.9
1
1.1
1.2
1.3
1.4
2007 2008 2009 2010 2011 2012
GD
P gr
owth
(%)
Com
mod
ity d
eman
d (in
dexe
d)
BACKGROUND
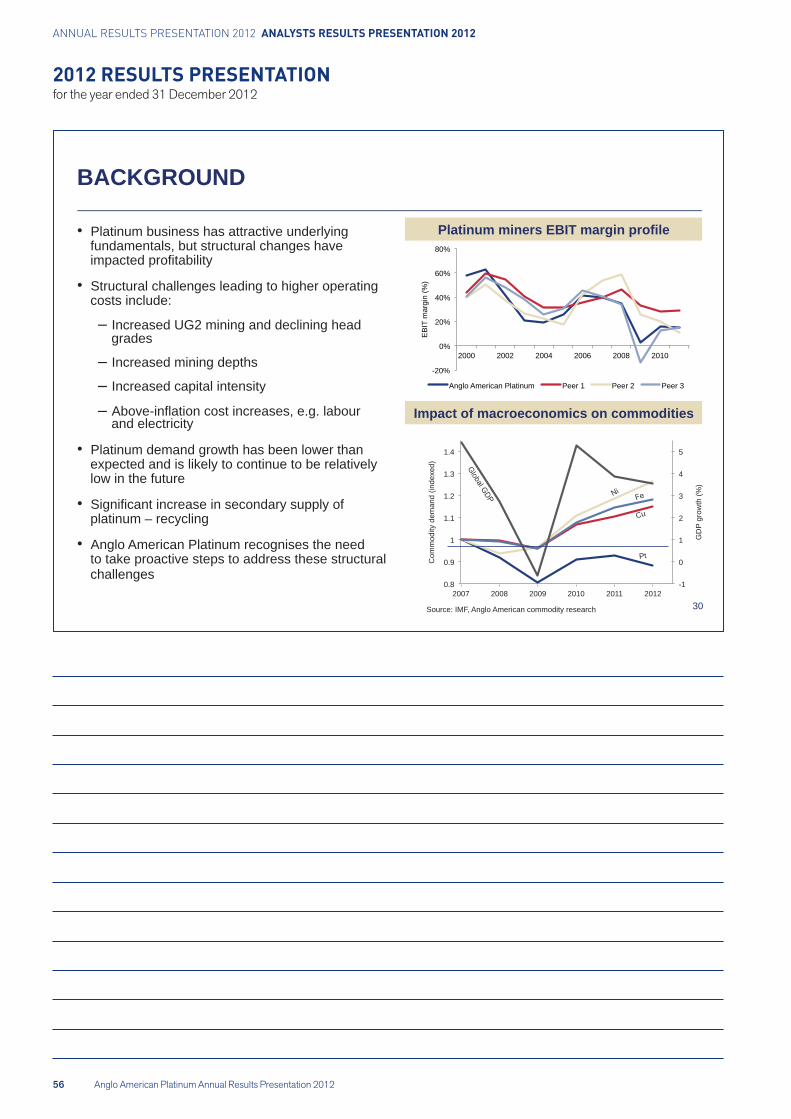
Platinum business has attractive underlying fundamentals, but structural changes have impacted profitability
Structural challenges leading to higher operating costs include:
Increased UG2 mining and declining head grades
Increased mining depths
Increased capital intensity
Above-inflation cost increases, e.g. labour and electricity
Platinum demand growth has been lower than expected and is likely to continue to be relatively low in the future
Significant increase in secondary supply of platinum – recycling
Anglo American Platinum recognises the need to take proactive steps to address these structural challenges
Platinum miners EBIT margin profile
Impact of macroeconomics on commodities
-20%
0%
20%
40%
60%
80%
2000 2002 2004 2006 2008 2010
EB
IT m
argi
n (%
)
Anglo American Platinum Peer 1 Peer 2 Peer 3
Source: IMF, Anglo American commodity research
Cu
Pt
Anglo American Platinum Annual Results Presentation 2012
Analyst results presentation 2013
PORTFOLIO REVIEW: KEY PROPOSALS
ANNUAL RESULTS PRESENTATION 2012 ANALYSTS RESULTS PRESENTATION 2012
Anglo American Platinum Annual Results Presentation 2012
2012 RESULTS PRESENTATIONfor the year ended 31 December 2012
Anglo American Platinum Annual Results Presentation 2012
Analyst results presentation 2013
33
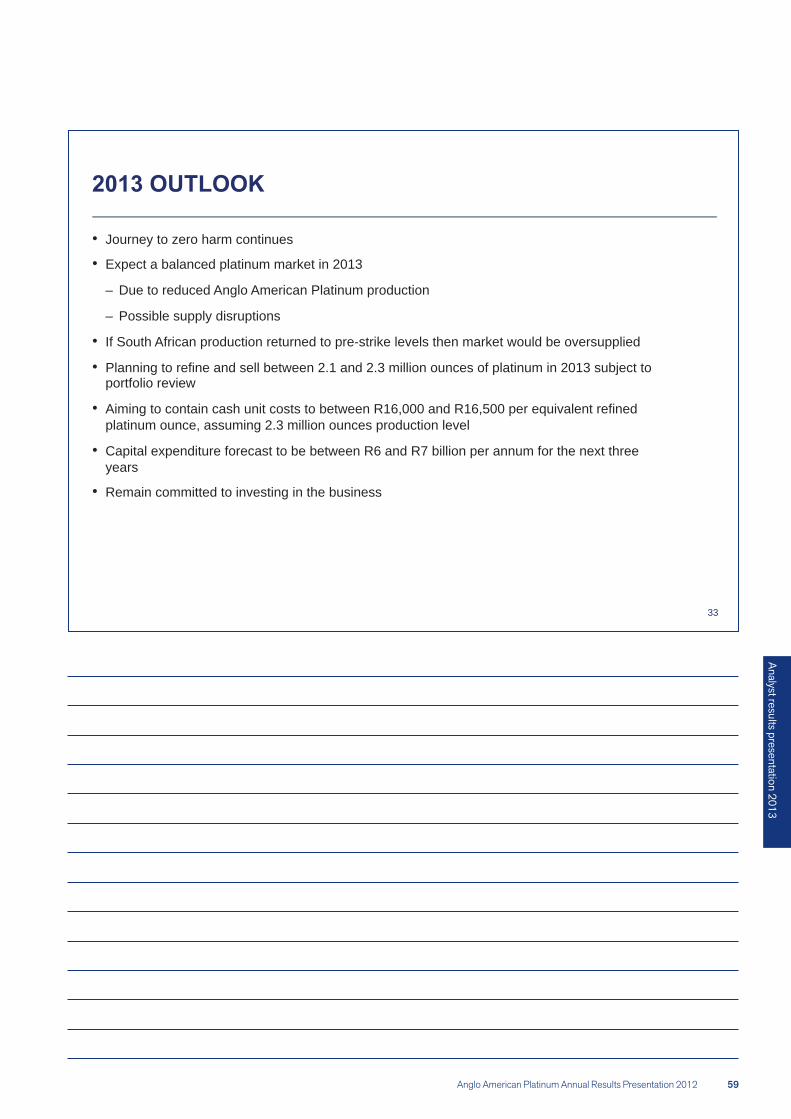
Journey to zero harm continues
Expect a balanced platinum market in 2013
– Due to reduced Anglo American Platinum production
– Possible supply disruptions
If South African production returned to pre-strike levels then market would be oversupplied
Planning to refine and sell between 2.1 and 2.3 million ounces of platinum in 2013 subject to portfolio review
Aiming to contain cash unit costs to between R16,000 and R16,500 per equivalent refined platinum ounce, assuming 2.3 million ounces production level
Capital expenditure forecast to be between R6 and R7 billion per annum for the next three years
Remain committed to investing in the business
ANNUAL RESULTS PRESENTATION 2012 ANALYSTS RESULTS PRESENTATION 2012
Anglo American Platinum Annual Results Presentation 2012
2012 RESULTS PRESENTATIONfor the year ended 31 December 2012
Q&A
Anglo American Platinum Annual Results Presentation 2012
Analyst results presentation 2013
THANK YOU

ANNUAL RESULTS PRESENTATION 2012 ANALYSTS RESULTS PRESENTATION 2012
Anglo American Platinum Annual Results Presentation 2012
NOTES

Anglo American Platinum Annual Results Presentation 2012
Analyst results presentation 2013

ANNUAL RESULTS PRESENTATION 2012 ANALYSTS RESULTS PRESENTATION 2012
Anglo American Platinum Annual Results Presentation 2012
NOTES
ADMINISTRATION
EXECUTIVE DIRECTORS
INDEPENDENT NON-EXECUTIVE DIRECTORS
Prof BA KhumaloWE Lucas-BullJM Vice
NON-EXECUTIVE DIRECTORS
BR BeamishKT Kweyama
ALTERNATE DIRECTORS
PG Whitcutt
COMPANY SECRETARY (ACTING)
13th Floor, 55 Marshall StreetJohannesburg 2001
REGISTERED OFFICE
55 Marshall Street, Johannesburg 2001
SPONSOR
Rand Merchant Bank
REGISTRARS
Johannesburg 2001
AUDITORS
Deloitte & ToucheDeloitte & Touche PlaceThe WoodlandsWoodmeadSandton 2196
INVESTOR RELATIONS
Kgapu Mphahlele

Anglo American Platinum LimitedIncorporated in the Republic of South AfricaDate of incorporation: 13 July 1946Registration number: 1946/022452/06JSE code: AMS ISIN: ZAE000013181
www.angloamericanplatinum.com
A member of the Anglo American plc Group www.angloamerican.com
Find us on Facebook Follow us on Twitter