Embed Size (px)
Citation preview

Please cite this article as:
Teller, Christoph, Reutterer, Thomas. 2008. The Evolving Concept of Retail
Attractiveness: what makes retail agglomerations attractive when customers shop at them?
Journal of Retailing and Consumer Services, 15 (3), pp. 127-143.

THE EVOLVING CONCEPT OF RETAIL ATTRACTIVENESS: WHAT MAKES RETAIL
AGGLOMERATIONS ATTRACTIVE WHEN CUSTOMERS SHOP AT THEM?
Christoph Teller* ● Thomas Reutterer
Department of Retailing and Marketing, Vienna University of Economics and Business
Administration, Augasse 2-6, A-1090 Vienna, Austria
Email: {[email protected], [email protected]}
FAX: ++43-1-31336-717
TEL: ++43-1-31336-4621
Wednesday, November 7, 2006
*…corresponding author

-1-
THE EVOLVING CONCEPT OF RETAIL ATTRACTIVENESS: WHAT MAKES RETAIL
AGGLOMERATIONS ATTRACTIVE WHEN CUSTOMERS SHOP AT THEM?
ABSTRACT
This paper attempts to contribute to a more thorough understanding of the on-site (‘in
vivo’) evaluation of retail agglomerations once shoppers have already made their destination
choices. To address this issue, a modification of more conventional concepts of retail
attractiveness that considers situational contexts is proposed and empirically tested. The
survey comprised more than 2,000 on-site interviews of customers of an inner city shopping
street and a competing peripheral shopping mall. The results show that the tenant mix and the
atmosphere, unlike parking and accessibility, exert a major impact on distinct dimensions of
perceived attractiveness. Furthermore, the empirical findings provide evidence that factors
characterizing aspects of the individual shopping situation significantly affect on-site
evaluation. Some methodological limitations and future research directions are also discussed.
Key words: retail agglomerations; retail attractiveness; patronage, situational effects

-2-
INTRODUCTION
Sets of retail outlets located in a nearby geographical area are referred to as retail
agglomerations or retail clusters (Berman and Evans, 2001; Ingene, 1984). Whether or not
such sites are established consciously, i.e. planned agglomerations such as shopping centers,
or unconsciously, i.e. unplanned agglomerations such as shopping streets, both consumers and
retailers can gain benefits and/or realize synergetic effects from this phenomenon (Gosh,
1986). From a consumers’ point of view such “bundling or agglomeration effects” deliver
additional utilitarian and hedonic shopping values to customers (Oppewal and Holyoaka,
2004; Babin et al., 1994). Such an enrichment of shopping experiences compared to those in
single stores is caused by the provision of easy accessibility, parking facilities, orientation
systems, a broad variety of shops, atmospheric stimuli or entertainment facilities (Kim, 2002).
From a retail manager’s view, such agglomerations have built up so-called “co-
opetition” between retailers (Brandenburger and Nalebuff, 1996): On the one hand, they
cooperate by using the same infrastructure or environment (e.g., parking facilities or
architecture), participate in site-related marketing concepts or simply benefit from the streams
of consumers attracted by the whole agglomeration. On the other hand, they compete with
each other for the share of wallets and/or time which is dedicated to the agglomeration by its
visitors (Gosh, 1986; Miller et al., 1999; Alzubaidi et al., 1997; Mägi, 2003).
The continuing fall of unplanned or evolved agglomerations such as shopping streets or
town/city centers caused by the rising number of planned agglomerations and increasing
competition among the latter can be regarded as major trends in retailing (Baker, 2006; ICSC,
2005; Wrigley and Lowe, 2002; ICSC, 2002; Wakefield and Baker, 1998; Alzubaidi et al.,
1997; Marjanen, 1995). As a consequence, investigations into the nature and antecedents of
retail agglomeration attractiveness from a shopper’s perspective are (re-)gaining the attention
of both retail marketing academics and practitioners (Dennis, 2005; Burns and Warren, 1995).
-3-
Insights into the interplay of determinants and moderating factors that affect an
agglomeration’s attractiveness can support managerial decision-making in several respects.
On the one hand, the store location decisions of retail managers are facilitated. On the other
hand, managers of malls, streets or cities can be helped in adjusting their marketing strategies
to increase the attractiveness or “gravity” of their agglomerations (Reilly, 1931).
Nonetheless, the amount of empirical research focusing on shopping behavior in retail
agglomerations, and more specifically in shopping streets or town/city centers, can be
considered as rather limited. With a few exceptions like the contributions by Dennis (2005)
and Baker (2006), most researchers have undertaken a single store perspective and
concentrated on the grocery industry (Ruiz et al., 2003). This article identifies and addresses
the following shortcomings in the extant literature: (1) The lack of a more general view of
multi-faceted influencing factors of retail agglomeration attractiveness, (2) the negligence of
situational effects that are postulated to gain considerable relevance during a specific
shopping-trip and (3) the explicit consideration of planned and unplanned agglomerations.
The objective of this paper, therefore, is to investigate the impact of crucial factors most
frequently mentioned in literature including situational ones on the distinct dimensions of a
retail agglomeration’s attractiveness.
The remainder of the paper is organized as follows: After a brief review of the existing
literature on measuring retail attractiveness we will develop the conceptual framework of the
proposed approach, provide an analytical model and derive hypotheses that are empirically
tested in a structural equation modeling framework. Following some background information
on the particular research approach adopted in our study, we report the empirical findings and
discuss implications for retail marketing research. Finally, we address limitations to our
approach and some issues that might stimulate future research directions.

-4-
LITERATURE REVIEW
In the realm of retail marketing, the vast majority of contributions studying the
attractiveness of retail locations can, based on their conceptual background, be classified into
the following research streams: (1) Approaches based on spatial interaction theory, (2) models
of retail attraction based on random utility theory and (3) multiplicative competitive
interaction (MCI) models.
Models of the first type are well known within the marketing community under the
pseudonym ‘gravity models’ (for a review cf. Baker, 2006; Craig et al. 1984; Haynes and
Fotheringham, 1984). Most of them have been inspired by the seminal works of Reilly
(1931), modifications to Reilly’s ‘Law of Retail Gravitation’ contributed by Converse (1949)
and the stochastic model specification introduced by Huff (1963 and 1964). The latter reduces
the multitude of variables with potential influence on the attraction of competing retail
locations to two factors only, namely store size and distance between stores and consumers’
homes. Huff’s model has seen numerous extensions, including price and service levels,
assortment sizes, opening hours or image features as additional attraction factors of retail
outlets (Cadwallader, 1975; Stanley and Sewall, 1976; Jennings, 1978; Nevin and Houston,
1980). In principle, Huff-type approaches are flexible for modifications towards gravity
models based on less ‘objective’ criteria of store attraction measured in terms of consumer
perceptions as is frequently called for in the relevant literature (see e.g., Cliquet, 1995). In this
respect they exhibit some overlap with the other two types of retail attraction models.
Based on a wide range of literature on brand choice modeling in the tradition of random
utility theory, retail attraction models of the second type focus on the impact of a predefined
set of attraction variables (which also embed the objective store-specific attributes known
from gravity models) on measures of consumers’ store choice behavior. This stream of
research has led to a multitude of retail applications including the following fields:

-5-
• Store choice prediction and choice set formation (Gensch and Recker, 1979;
Timmermans, 1982; Arnold et al., 1983; Fotheringham, 1988, Spiggle and Sewall, 1987,
Bell and Lattin, 1998)
• Consumer choice of shopping centers (Oppewal et al., 1997; Finn and Louviere, 1996;
Arentze et al., 2005)
• Multipurpose shopping trip behavior (Arentze and Timmermans, 2001; Dellaert et al.,
1998; Arentze et al., 2005; Baker, 1996)
• Dynamics of shopping destination choice (Arnold et al., 1983; Galata et al., 1999;
Severin et al., 2001)
In contrast to the axiomatic framework of individual decision-making underlying choice
models, the focus of MCI models is on a more aggregate perspective of market conduct
(Cooper and Nakanishi 1988). In particular, MCI models using trade-area specific market
share for measuring retail attraction and allowing for nonlinear interactions of potentially
influencing parameters, such as customers’ perceptions of store characteristics, have been
extensively applied to the issues of store location and store assessment analysis (e.g., Ghosh
and McLafferty, 1987; Cliquet, 1995; Gonzáles-Benito et al., 2000; Gonzáles-Benito, 2005).
In spite of severe measurement problems and practical limitations against efforts to
include all possible factors that might affect retail attractiveness and choice behavior, the
above-mentioned research streams have yielded considerable advances in recent years (Rust
and Donthu, 1995; Prendergast et al., 1998). However, most of the previous empirical
research has exposed respondents to retail or shopping site evaluation tasks in a rather non-
biotic or less life-like way (similar to in-home interviews or telephone surveys), which
requires strong imaginary skills (particularly with regard to unfamiliar retail sites) and/or the
high shopping involvement of respondents. Hence, a considerable amount of previous retail
attraction research can be denoted as in vitro approaches. In contrast, in vivo retail attraction

-6-
models entail the evaluation of shopping destinations in a more life-like ambience and thus
require the analyst to confront respondents with more realistic shopping tasks or even real
shopping situations. The latter would provide deeper insights into the shopper’s post-
destination-choice or on-site evaluation of an actually visited agglomeration. Although it has
been argued in the relevant literature that it significantly affects store choice behavior,
surprisingly few contributions have investigated the relative impact of situational variables
(Spiggle and Sewall, 1987; Kahn and Schmittlein, 1989; Ridgway et al., 1990; Laaksonen,
1993; Van Kenhove et al., 1999). In the context of shoppers’ evaluations of complex retail
environments such as shopping centers, shopping occasion or shopping trip involvement are
posited to be of particular relevance (cf. Bloch et al., 1994; Van Kenhove et al., 1999).
Consequently, in order to account for such situational and shopping context-specific
factors, a more in vivo interpretation of the concept of retail attractiveness and a more detailed
investigation of the underlying evaluation processes are called for. We therefore follow the
notions of Miller and Ginter (1979) “…that explicit consideration of situational contexts may
contribute to the understanding of consumer behavior”.
CONCEPTUAL FRAMEWORK
Perception and evaluation of retail agglomerations
Analogous to retail formats or individual stores, retail agglomerations can be
characterized by their marketing mix components, which are determined by managerially
controllable decision-parameters such as site location, selling style, pricing and merchandise
strategy, available parking or entertainment facilities, etc. (Berman and Evans, 2001). This
marketing mix is physically manifested in ‘objective’ retail agglomeration characteristics,
which, in turn, are perceived by potential shoppers and are converted into an overall
evaluation of the relative attractiveness as depicted in Figure 1 (Finn and Louviere, 1996).

-7-
Ultimately, this evaluation process affects the consumers’ behavior in terms of site choice,
buying and patronage intentions, retention proneness, etc. As a consequence, the economic
success of a retail agglomeration on the one hand and a specific store located within this
agglomeration on the other hand is determined by this chain of value creation (Dunne and
Lusche, 1999; Levy and Weitz, 2004).
Figure 1: Evaluation process of a retail agglomeration’s attractiveness
Our attempt to study the relative importance of these mix-factors on a ‘supra-store’
level starts with the outline of a model for attractiveness formation, which hypothesizes a
relationship between perceived marketing mix characteristics and differentiated in vivo
notions of agglomeration evaluations. Therefore, the concept of retail attractiveness is
broadened by taking into consideration any possible moderating effects that arise from the
shopping experience and the consumer’s involvement in the current shopping trip. This
differential view leads to the distinction of situational-driven and sustainable (non-situational)
aspects of agglomeration attractiveness with a direct or indirect impact on the consumer’s
behaviors (see Figure 1).
Based on an extensive literature review, eight multi-item-scaled factors related to
marketing-mix variables were extracted. They are posited to influence the retail attraction
formation process. Because of the multi-item character of the various exogenous and
endogenous factors included in our modeling framework, each construct is measured with at

-8-
least two or more indicator variables (see Table 6 in the Appendix for a more detailed
description of respective indicator variables). Since the focus of this paper is on retail
agglomerations, these factors will be interpreted on a supra-store level only. In contrast to
previous studies, the simultaneous consideration of such a broad set of factors, including any
situational ones, will enable us to identify their relative importance.
Marketing mix factors and attractiveness dimensions
According to the proposed interrelations within the shopper’s system of perceptions and
evaluations the associated constructs can be organized as follows:
Site related factors: Consumers who buy their goods at agglomerations have to
overcome spatial and temporal distances between their point of origin, e.g. household or
working place, and the retailer’s premises (Huff, 1963/1964; Ingene, 1984). ‘Accessibility’
(ξ1) of a retail site indicates the degree of (in-) convenience regarding this shopping endeavor
and therefore represents a major characteristic of a retail agglomeration from a consumer’s
point of view (Alzubaidi et al., 1997; Bearden, 1977). Due to the rising mobility of western
populations the car can be seen as the most important (individual) means of transportation for
consumers (Baker, 2002). Thus ‘parking’ (ξ2) nearby stores or agglomerations can also be
regarded as a major factor enhancing shopping convenience (Alzubaidi et al., 1997; Arentze
and Timmermans, 2001; Bearden, 1977; Van der Waerden et al., 1998).
Tenant-related factors: The degree to which consumers are able to satisfy their needs
and wants within an agglomeration is represented by the ‘mix of retail-tenants’ (ξ3), i.e.
stores, and the supplementary ‘mix of non-retail tenants’ (ξ5), e.g. gastronomy and
entertainment facilities (Bearden, 1977; Wakefield and Baker, 1998; Finn and Louviere,
1996). These two aspects are presumed to be among the major driving factors to visit an
agglomeration. In addition, the perceived price-quality ratio of merchandise, i.e. the
-9-
‘merchandise value’ (ξ4), offered by the stores within an agglomeration is considered
(Alzubaidi et al., 1997; Arentze and Timmermans, 2001; Bearden, 1977).
Environment-related factors: Since shopping can be regarded as being more than just
an exchange of money for goods/services, several other ‘environmental’ factors can be
identified to ease or enrich the process of procuring goods in stores and/or agglomerations
(Babin et al., 1994; Ruiz et al., 2003). These represent ‘orientation’ (ξ6) within the
agglomeration, ‘ambience’ (ξ7) such as sensual stimuli and ‘atmosphere’ (ξ8) (Wakefield and
Baker, 1998; Arentze and Timmermans, 2001; Bearden, 1977; Bloch et al., 1994; Hoffman
and Turley, 2002; Ruiz et al., 2003).
Buying situation-related factors: As already argued, factors related to the context of a
specific shopping experience are understood to be possible interventions in vivo of the
proposed model of retail agglomeration attractiveness. Based on the notions of Van Kenhove
et al. (1999) two factors are distinguished here: The perceived ‘distance’ (ξ9) between a
specific trip’s starting point and the agglomeration of choice (Arentze and Timmermans,
2001; Bacon, 1995). Notice that while the spatial distance may remain the same when the
point of origin does not differ from trip to trip, the temporal distance may change due to the
traffic situation or other obstacles on the way to the agglomeration. Furthermore, the
perceived importance of a shopping trip is measured in terms of an individual’s ‘involvement’
(ξ10), i.e. the subjective commitment in the fulfillment of the shopping task (Alzubaidi et al.,
1997).
Dimensions of attractiveness: In order to be successful, both retailers and
agglomerations need to be attractive, i.e. preferable or favorable, for their customers on every
single stage of the buying process. Managers have to persuade consumers to come to their
premises, make them stay and spend money as well as convince them to come again.
Consequently, attractiveness can be seen as a “… multi-faceted construct representing a

-10-
variety of measures…” (Reinartz and Kumar, 1999). In our extended view of the concept of
retail attractiveness, the perceived attractiveness of a retail agglomeration varies along the
following three dimensions: The satisfaction with an agglomeration is considered to be an
operationalized version of ‘overall attractiveness’ (η1), patronage intention measures the
tendency towards revisiting the retail site and thus can be interpreted as ‘sustainable
attractiveness’ (η3). Finally, retention proneness measures the propensity to stay and to spend
time on site and thus covers the notion of ‘situational attractiveness’ (η2). Whereas the
distinction between what we call overall and sustainable attractiveness (η1 and η3) can be
found with several authors the in vivo notion of ‘situational attractiveness’ has widely been
neglected, particularly in the context of retail agglomerations (e. g. Bearden, 1977; Bellenger
et al., 1977; Baker, 2002; Wakefield and Baker, 1998; Severin et al., 2001; Ruiz et al., 2003;
Mägi, 2003; Baker et al., 2002; Tang et al., 2001). In fact, this dimension has been shown to
be highly correlated with the probability that consumers spend money in stores (Donavan et
al., 1994). Lastly, it has to be mentioned that the re-labeling of the well-known factors
‘patronage’, ‘satisfaction’ and ‘retention proneness’ was thoroughly done to emphasize their
strong relation and dependency within the multi-faceted and complex construct of
‘attractiveness’.
Hypotheses
To investigate the effects of marketing-mix perceptions on the evaluation of
agglomeration attractiveness, a set of hypotheses as summarized in Table 1 can be specified1.
1 Notice that the numeration of hypotheses follows the common nomenclature for referencing
relationships as known from path diagrams, which starts with the respective index of the endogenous factor and
is followed by the index of the exogenous variable.

-11-
Consistent with the indications from our literature survey, positive relationships between the
perceptions of marketing-mix factors (ξ1 - ξ8) and the attractiveness dimensions (η1 - η3) can
be expected.
Table 1: Synopsis of hypotheses
Hypothesis Exogenous Factor [Dependency]
coefficient
Endogenous Factor
H11 Accessibility (ξ1)
[+] γ11 Overall attractiveness (η1) H21 [+] γ21 Situational attractiveness (η2) H31 [+] γ31 Sustainable attractiveness (η3) H12
Parking (ξ2) [+] γ12 Overall attractiveness (η1)
H22 [+] γ22 Situational attractiveness (η2) H32 [+] γ32 Sustainable attractiveness (η3) H13
Retail tenant mix (ξ3) [+] γ13 Overall attractiveness (η1)
H23 [+] γ23 Situational attractiveness (η2) H33 [+] γ33 Sustainable attractiveness (η3) H14
Merchandise value (ξ4) [+] γ14 Overall attractiveness (η1)
H24 [+] γ24 Situational attractiveness (η2) H34 [+] γ34 Sustainable attractiveness (η3) H15
Non-retail tenant mix (ξ5) [+] γ15 Overall attractiveness (η1)
H25 [+] γ25 Situational attractiveness (η2) H35 [+] γ35 Sustainable attractiveness (η3) H16
Orientation (ξ6) [+] γ16 Overall attractiveness (η1)
H26 [+] γ26 Situational attractiveness (η2) H36 [+] γ36 Sustainable attractiveness (η3) H17
Ambience (ξ7) [+] γ17 Overall attractiveness (η1)
H27 [+] γ27 Situational attractiveness (η2) H37 [+] γ37 Sustainable attractiveness (η3) H18
Atmosphere (ξ8) [+] γ18 Overall attractiveness (η1)
H28 [+] γ28 Situational attractiveness (η2) H38 [+] γ38 Sustainable attractiveness (η3) H19 Distance (ξ9)
[+] γ19 Overall attractiveness (η1) H29 [+] γ19 Situational attractiveness (η2) H110 Involvement (ξ10)
[+] γ110 Overall attractiveness (η1) H210 [+] γ210 Situational attractiveness (η2) H42 Overall attractiveness (η1)
[+] β21 Situational attractiveness (η2) H43 [+] β31 Sustainable attractiveness (η3)
Naturally, as a consequence of the in vivo conceptualization of agglomeration
attractiveness underlying the subsequent study, the relative strength and significance of the
effects can be expected to be moderated for each of the three dimensions of retail
attractiveness through differential aspects: Both the effects on the ‘overall attractiveness’ with
the visited agglomeration (η1) and, in particular, ‘situational attractiveness’ (η2) are assumed
to be co-affected by the situation-specific factors ‘distance’ (ξ9) and ‘involvement’ (ξ10); for a
justification of this presumption and corresponding hypotheses H19 to H210 see the notion of

-12-
Wakefield and Baker (1998). In contrast, the sustainable evaluation of a retail agglomeration
(η3) is assumed to be affected only indirectly by the respondent’s in vivo experiences, namely
via intermediation of η1 according to hypothesis H43. Furthermore, η1 is hypothesized to
positively affect η2 as it is already depicted in the above Figure 1 and postulated by hypothesis
H42 in Table 1.
The overall objective when testing our hypotheses is to get a clearer understanding on
which of the various marketing-mix and/or situational factors have major significant impacts
(as indicated by respective γ-parameters) on the previously discussed attractiveness
dimensions of a retail agglomeration. To allow for simultaneous testing and comparison of the
set of hypotheses in two competing retail settings, namely a planned and an unplanned
agglomeration, a structural equation model (SEM) with latent variables was developed. For
comparability reasons the resulting ‘baseline model’ was required to be general enough and,
at the same time, still adequate for application in both settings.
RESEARCH DESIGN AND DATA COLLECTION
Basic considerations
The attempt to make the above-explained system of hypotheses empirically accessible
requires a research design that differs from most of the empirical approaches presented up to
now in the literature. We have therefore enlarged on the basic thoughts underlying the
approach towards an inclusion of in vivo elements in order to study the concept of retail
attractiveness and explain the whole research setting in more detail (see Table 2 for a
summary overview).

-13-
Table 2: Research design
Research objective Comparative evaluation of factors determining the attractiveness of two retail agglomerations
Research method Face-to-face interviews
Interview locations Two comparable and competing retail agglomerations – Shopping Street (SST) and Shopping Mall (MAL)
Research period Three weeks Population All shoppers and visitors of the two retail agglomerations within the research period Sampling procedure Synchronized time sampling (random sampling based on time) Sampling points Representative entrances or street locations Sample nSST=1,066; nMAL=1,073;
In the present context, the common practice of drawing simple random or stratified
samples might lead to biased results due to ‘role allocations’ within households which are
dissent with the alleged ‘shoppers’ participating as respondents of the study (Shet et al., 1999;
Granzin et al., 1997). For example, respondents whose major role within a household is that
of ‘payer’ or ‘user’ might be overrepresented and household members actually responsible for
shopping underrepresented. Consequently, an alternative approach both with respect to the
respondents’ task of retail agglomeration evaluation and sample selection had to be adopted.
Similar to the attempt by Bloch et al. (1994), the basic idea was to confront respondents with
questions in the context of a real shopping situation within the retail agglomeration they had
actually chosen. Thus, our respondents were exposed to a more biotic or in vivo interview
environment and it was warranted that only those informants were selected, which exhibited a
certain minimum degree of knowledge about the visited retail site (Campbell, 1955).
Selected retail sites, scale development and sampling procedure
To empirically illustrate the proposed modeling framework, two different types of retail
agglomerations were selected, namely a peripheral shopping center (‘Shopping City Süd’) and
an inner-city shopping street (‘Mariahilferstraße’) in Vienna, the Capital city of
Austria/Europe. Both agglomerations represent the largest retail agglomerations in that retail
area and are among the largest in Europe in terms of reported sales figures. They compete for

-14-
a comparable supra-regional clientele with a similar tenant mix that comprise the same set of
pan-European anchor stores such as Hennes & Mauritz, Mediamarkt/Saturn, Mango, Zara,
Peek & Cloppenburg. Thus, store heterogeneity can be regarded as being fairly limited with
the consequence that the two selected retail agglomerations can be regarded as comparable
with respect to their competitive standing in the relevant market. Such competition between
dominating planned and evolved agglomerations within urban areas can be considered as
typical in many other geographical retail areas. A selection of characterizing facts is provided
in Table 3.
Table 3: Characteristics of retail agglomerations under investigation
Agglomeration
Facts
Shopping Street (SST)
(inner district)
Shopping Mall (MAL)
(main building)
Sales per year EUR 700 mill. EUR 580 mill. Sales floor space 140,000 m2 160,000 m2 Retail stores (total # of outlets) 261 (846) 230 (300) Length 1.7 km 1.6 km
To make the results comparable, survey instruments were synchronized in the two retail
agglomerations being studied. Respondents were recruited independently as random samples
based on a time sampling procedure. To prevent respondent selection bias, following the
arguments of Sudman (1980) three sampling points (entrances to the shopping mall,
underground exits and parking lots in the shopping street) were selected in each
agglomeration. At each of these points, customers were invited for interviews every quarter of
an hour. The number of respondents selected at these defined points of time varied in
proportion to the changing number of customers over the course of the day (Sudman, 1980).
This procedure resulted in two representative samples of agglomeration customers over a
period of three weeks.
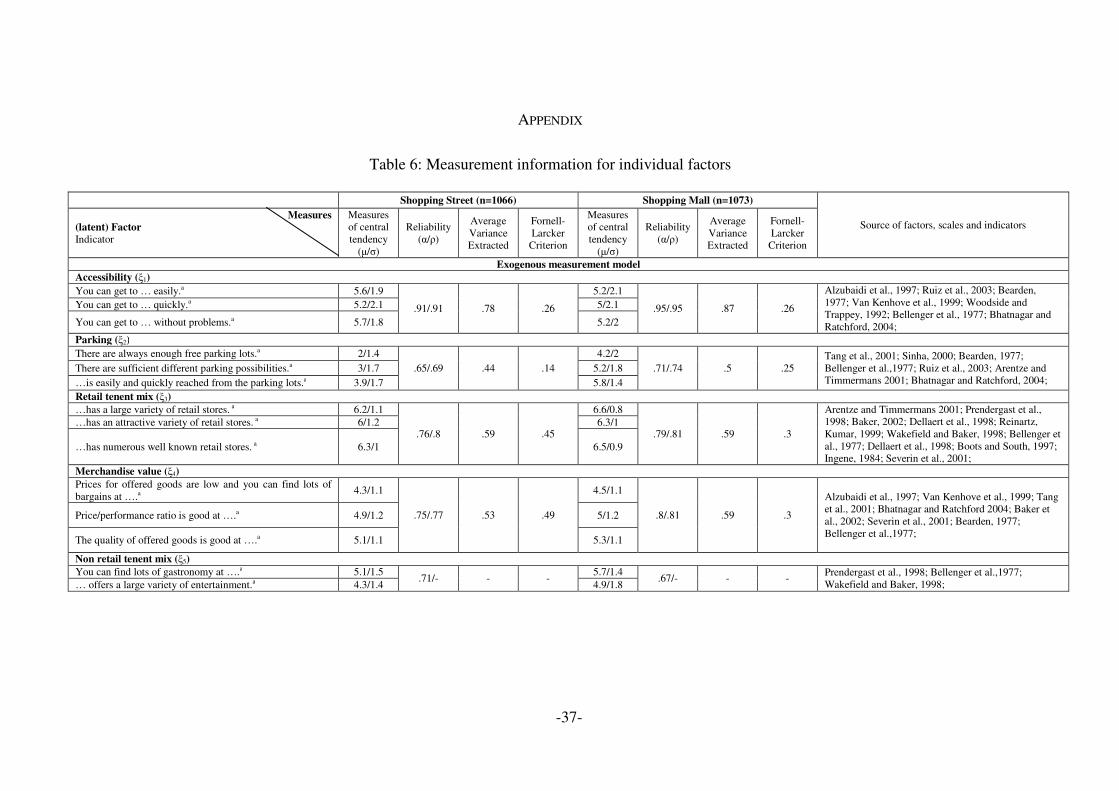
Measurement scales for the above-described latent constructs were first derived from
the relevant literature (see Table 6 in the Appendix) and modified according to findings from
three focus group interviews. According to the notions of Churchill (1979) and Bagozzi et al.

-15-
(1991), the measurement validity of the exogenous and endogenous measurement models was
tested by calculating Cronbach Alpha coefficients and by conducting confirmatory analyses
(CFA) for all constructs containing more than two indicators within each measurement model.
Table 6 provides an overview of these validity measures. For almost all constructs shown, a
good internal consistency (Cronbach Alpha > 0.7) can be reported. The shared variance
among the sets of indicators measuring the different constructs, i.e. composite reliability, also
met the requirement to be above 0.6 (Fornell and Larcker, 1981). The average variances
extracted (AVE) are also beyond the recommended value of 0.5 (Baggozzi and Yi, 1988).
With regard to the constructs’ discriminant validity it can be said that the AVE is larger than
the highest squared intercorrelation with every other factor in the measurement model
(Fornell and Larcker, 1981). Based on these results it can be concluded that the local fit of the
measurement models is satisfactory.
Respondent’s profiles
Notice that due to the employed sampling procedure the collected samples are
representative of the agglomerations’ clientele but do not necessarily reflect the demographic
structure of the respective trading areas, which in both cases cover the city of Vienna and
surrounding areas (Statistik Austria, 2005). Table 4 shows some key characteristics for the
two samples. The respondents can be considered as rather young; almost all of them are
between 15 and 40 years old. As expected, female shoppers dominate each sample. The
educational level is above average for the Vienna region. With regard to professional status, a
large share of students and self-employed visitors was observed. Overall, apart from gender,
both samples significantly differ with respect to demographic variables. The shopping street
(with a considerable share of younger people), quite obviously, appeals to inhabitants living
nearby, whereas the mall’s clientele originates from the whole city area and surrounding

-16-
regions (Statistik Austria, 2005). This observation corresponds with the results of a question
regarding the perceived spatial distance between the shopping trip’s starting point and the
place where they were interviewed. Respondents recruited in the shopping street estimated
that the average spatial distance is 16 kilometers, whereas the respondents in the shopping
mall stated that they travel, on average, up to 31.01 kilometers to get to their shopping
destination.
Table 4: Respondent’s profiles
Characterization Shopping Street (SST) Shopping Mall (MAL)
Demographic Characteristics
µ σ n µ σ n ∆
Age (years) 27.31 12.87 1,061 30.66 13.64 1,081 yes2
Income Indiv (EUR) 905.06 886.31 1,009 1151.59 1102.34 1,042 yes2
Income hh (EUR) 2,489.84 1,995.89 970 2789.92 1896.33 1,042 yes2
# of persons in hh 2.64 1.62 1,066 2.82 1.6 1,066 yes2
Gender ♀=62.7% ♂=37.3% 1,066 ♀=61% ♂=39% 1,073 no1
Education Top 3
A-level=45.1% Sec. school=23.6% University=17.1%
1,065 A-level=37.2% Sec. school=29.5% University=11.6%
1,073 yes3
Profession Top 3
Student=52.8% White collar worker=24.4%
Self employed=7.1%
1,064 White collar worker=41.2% Student=29.5%
Self employed=6.7%
1,069 yes3
Shopping behavior on sites
µ σ n µ σ n ∆ Shopping (visiting)
frequency per month 5.05 7.02 1,066 2.68 4.47 1,073 yes2
Spending (EUR) per visit
65.09 77.82 1,066 112.45 155.93 1,073 yes2
Retention time (min) per visit
140.45 81.35 1,066 164.89 88.61 1,073 yes2
Shops visited per trip on average
3.71 3.15 1,066 4.57 3.86 1,073 yes2
Caption: µ…mean value; σ…standard deviation; n…sample size; ∆…significant difference; 1…χ2-Test, p=0,449; 2…Mann-Whitney-U-Test; p<0.01; 3… χ2-Test, p<0.001; hh…household; indiv…individual; EUR…Euro; min…minutes; ♀…female; ♂…male
It was noted that there are significant differences in terms of shopping/visiting
frequencies, average spending, the number of shops visited per trip, and retention times per
visit. It can be concluded that the respondents in the shopping mall shop less frequently but
spend more time there, visiting more shops and spending more money. As a result of this

-17-
“clientele effect”, we are obviously confronted with two quite different and heterogeneous
groups of respondents (Reinartz and Kumar, 1999; Dickson and Sawyer, 1990). A certain
number of respondents certainly patronize both agglomerations over time. With respect to the
objective of the current study, however, this circumstance entails no severe limitation of the
results.
RESULTS
Model fit and parameter estimates
The empirical values of some statistical fit indices are compiled in Table 5. Overall, a
comparison with critical values as recommended in the relevant SEM literature point out that
the empirical data fit the proposed baseline model to a satisfactory degree.
Table 5: Global Fit Measures
Figures 2 and 3 provide graphical representations of the resulting path structure and
corresponding parameter estimates for the shopping street (SST) and shopping mal (MAL)
models respectively. In both illustrations, the left side depicts the eight (exogenous) factors
comprising ‘marketing mix factors’ (ξ1-ξ8) and the bottom shows ‘situational factors’ (ξ9, ξ10).
Index Empirical value Recommended Values*
Absolute fit measures
χ2 (df, p) 2636.54 (950; <0.001) p>.05**
GFI (Goodness of Fit) .931 >.9 RMSEA (Root mean square error of approximation)
.029 <.05
Incremental fit measures
NFI (Normed Fit Index) .927 >.9 TLI (Tucker-Lewis-Index) .943 >.9 CFI (Comparative Fit Index) .952 >.9
Parsimony fit measures
Normed χ2 (CMIN/df) 2.775 1.0 =perfect
up to 1.5 very good up to 2 good up to 3 it depends
AGFI (Adjusted Goodness of Fit) .914 >.9 *… see Anderson and Gerbing (1988); Arbuckle and Wothke (1999/2003); Diamantopoulos (1994); Loehlin (1998); Steenkamp and van Trijp (1991); Kline (2005); Hair et al. (1995); Baumgartner and Homburg (1996); Byrne, 2001; **… not relevant since χ2-statistics are sensitive against large sample sizes (Bentler, 1990)

-18-
For the sake of clarity the correlations among the single factors have been omitted. The
intercorrelation (φ) values can be seen from the captions. The right side includes the three
(endogenous) factors operationalizing the three dimensions of attractiveness (η1-η3). Arrows
connecting exogenous with endogenous factors symbolize the proposed effects directions.
Effects or (standardized) coefficients with significant t-values (p<.05) are highlighted by
black thick lines, which also indicates whether the proposed hypotheses are being accepted.
The effect size or impact represented by the absolute value of the standardized path
coefficients (γ/β) is interpreted according to the recommendation by Cohen (1988). Therefore,
the impacts of factors are compared with each other. Values of less than .10 indicate low or
marginal effects; values around .3 can be regarded as typical or medium effects and values
above .5 are considered to be high or substantial.
Tests of hypotheses
Following the path structure depicted in Figures 2 and 3, the results of tests for the
hypotheses collected in Table 1 can now be reported. Interestingly, with some notable
exceptions, most of the hypotheses are rejected or accepted concurrently in both the shopping
street and the shopping mall model.

-19-
Figure 2: Effects (standardized regression weights) within the shopping street model

-20-
Figure 3: Effects (standardized regression weights) within the shopping mall model
Site-related factors � dimensions of attractiveness (H_1/H_2): ‘Accessibility’ (ξ1),
which can also be understood as a measure of perceived distance and convenience to
overcome this distance, only influences the ‘patronage intention’ (η3) regarding the two

-21-
agglomerations (SST: γ31=.166***; MAL: γ31=.069**). However, these effects turn out to be
rather low. ‘Parking’ (ξ2) exerts no significant effect on either dimension of attractiveness.
This finding implies the rather unconventional view that – during shopping – customers do
not seem to evaluate the attractiveness of the visited agglomeration as a function of parking
convenience. Hence, site-related factors (ξ1; ξ2) prove to be of no significance or no
substantial importance for either dimension of perceived attractiveness (η1 - η3).
Tenant-related factors � dimensions of attractiveness (H_3/H_4/H_5): The testing of the
next three sets of hypotheses provides results that are more consistent with the prevalent
literature. In particular, the ‘retail tenant mix’ (ξ3) is the most influencing variable on the
‘overall attractiveness’ (η1) of both agglomerations, i.e. the effects are significant and of
medium value (SST: γ13=.368***; MAL: γ13=.227***). In addition, the ‘merchandise value’
(ξ4) or price/value-perception can be seen as of significance, though only of minor importance
(SST: γ14=.114***; MAL: γ14=.086***). More interestingly, a low effect of the ‘retail tenant
mix’ on ‘sustainable attractiveness’ (η3) can be identified in the shopping street (SST:
γ14=.141**), whereas this factor does not play any role in the mall. Furthermore, the
enrichment of the two agglomerations with gastronomy or entertainment facilities, i.e. ‘non
retail tenant mix’ (ξ5), does not impact on the evaluation of any dimension of attractiveness in
either setting. Furthermore, it turned out that none of the tenant-related factors (ξ3 - ξ5) are of
significant importance regarding ‘situational attractiveness’ (η2). Obviously, the perceived
‘overall attractiveness’ of retail agglomerations proves to be driven to a large extent by
retailing issues. Customers seem to associate agglomerations more with the shopping or
browsing task than with food consumption or entertainment.
Environment-related factors � dimensions of attractiveness (H_6/H_7/H_8):
Environment-related factors (ξ6 - ξ8) can also be regarded as influential to attractiveness (η1-
η3). The most considerable impact on the ‘overall attractiveness’ (η1) and the ‘situational
attractiveness’ (η2) stems from the factor ‘atmosphere’ (ξ8). In both retail settings these effects

-22-
are significant and medium (SST: γ18=.192***, γ28=.219***; MAL: γ18=.142***, γ18=.254***).
It is worth mentioning that out of the eight marketing-mix factors (ξ1 - ξ8) ‘atmosphere’ is the
only one that is relevant to ‘situational attractiveness’. The perception of sensory stimuli
measured by the factor ‘ambience’ (ξ7) affects the ‘overall attractiveness’ to a small degree
only (SST: γ17=.109**; MAL: γ17=.139***) and is of no importance for the ‘situational’ (η2)
and ‘sustainable attractiveness’ (η3). Interestingly, ‘orientation’ only plays a significant role in
the mall setting (MAL: γ16=.097**; γ36=.114*). In total these results indicate a comparably low
importance of environmental as well as site-related factors. Thus, ‘atmosphere’ impacts on at
least two attractiveness dimensions. The difference in results between the two agglomerations
may be due to the nature of planned/artificial and unplanned/evolved retail locations.
Summarizing the importance of marketing mix factors (ξ1-ξ8) it can be concluded that only a
small number of them have a considerable effect on any or more than one dimension of
attractiveness (η1 - η3).
Buying situation-related factors � dimensions of attractiveness (H_9/H_10): As one of
the major distinguishing features of this research work the effect of situational factors (ξ9 -
ξ10) on ‘overall’ (η1) and ‘situational attractiveness’ (η2) is tested. Most obvious, the
‘involvement’ (ξ10) with the visiting or buying task at hand impacts on the ‘situational
attractiveness’ to a significant and substantial degree (SST: γ210=.546***; MAL: γ210=.507***)
in both agglomerations. The effect on ‘overall attractiveness’ is not that considerable but still
significant (SST: γ110=.222***; MAL: γ110=.182***). Even the perceived ‘distance’ (ξ9) has a
positive impact on the ‘situational attractiveness’ (SST: γ29=.061*; MAL: γ29=.136***) but
none on the ‘overall attractiveness’. It can be resumed that the moderating effect of the buying
situation is considerable.
Overall attractiveness � situational and substantial attractiveness (H42/H43): Finally,
the relationship between the three endogenous factors was tested (η1 - η3). Just as with the
other marketing mix factors (ξ1-ξ8) ‘overall attractiveness’ (η1) does not substantially affect

-23-
the ‘situational attractiveness’ (η2) in both settings (SST: β21=.067; MAL: β21=.092**).
Contrarily, ‘sustainable attractiveness’ (η3) is influenced by that factor (η1) considerably, i.e.
with a significant and medium-sized effect (SST: β31=.361***; MAL: β31=.312***).
Furthermore, it needs to be mentioned that although ‘sustainable attractiveness’ is only
directly affected by a few factors, the influences on ‘overall attractiveness’ are of indirect
relevance too. Lastly, it seems to be necessary to focus on the squared multiple correlation
values (r2) which indicate the extent to which the variances of the endogenous factors are
explained by the proposed effects. In both agglomeration settings the ‘situational
attractiveness’ (η2) proves to be explained by the included factors to the highest degree. More
than 50% (SST: r2=.516; MAL: r2=.571) of variance is accounted for by the influencing
factors. However, for the other two dimensions of attractiveness this share is somewhat lower
(‘overall attractiveness’ (η2): SST: r2 = 0.471; MAL: r2= 0.313; ‘sustainable attractiveness’
(η3): SST: r2= 0.241; MAL: r2= 0.192).
DISCUSSION
Consistent with preliminary findings discussed in the relevant literature, our results
show that retail-related factors, i.e. ‘tenant mix’ and ‘merchandise value’, exert the most
substantial (direct) impact on the ‘overall attractiveness’ and indirect impact on the
‘sustainable attractiveness’ of agglomerations compared to other marketing mix factors. The
observation of no direct importance of the ‘non-retail tenant mix’ suggests that marketing
activities of retail agglomerations should be refocused towards its ultimate core function:
Providing a broad and deep assortment of shops and goods which enrich and ease the
shopping endeavors of consumers. Furthermore, the results emphasize the particular relevance
of anchor stores within the tenant mix. Environmental factors are also of significant
importance. In particular, ‘atmosphere’ affects the situational dimension of attractiveness,

-24-
which is again in accordance with the findings from former studies (see, e.g., Arentze and
Timmermans, 2001; Bearden, 1977; Bloch et al., 1994; Hoffman and Turley, 2002; Ruiz et
al., 2003). Even though several other marketing mix factors are of no or only minor relevance
for the evaluation of attractiveness, considerable (inter-)correlations can be identified among
them. This suggests that they might be relevant or influential in an indirect way.
As expected, situational aspects have proven to exert a major impact on the evaluation
of attractiveness; both the ‘situational’ and ‘overall attractiveness’ are affected substantially.
Since the situational factors used in our model, namely ‘involvement’ with a specific
shopping task and perceived distance to the agglomeration, had emerged before or during the
actual trip, they can hardly be influenced by the current on-site conditions at the
agglomeration directly. Insofar, the results clearly reveal the limited opportunities of affecting
consumers’ perception and evaluation processes exclusively with marketing mix measures. In
fact, the ‘normative power of situational influences’ on the buying process can be ascertained
(cf. Van Kenhove et al. 1999).
To a certain degree the empirical findings might also reflect aspects of the limited
rationality of individual decision-making. The respondents were confronted with the
evaluation task on site. To reduce or resolve the dissonance that might occur after the
agglomeration choice decision, an individual typically attempts to engage in post-decision
processing that reinforces the decision that has been made. This phenomenon is well known to
the consumer behavior literature under the premises of dissonance theory (Festinger, 1957,
1964). In particular, perceptions of ‘accessibility’ and ‘parking’, i.e. factors relevant before
entering the agglomerations, are likely to be affected by this desire to obtain cognitive
consistency.
This contribution tried to broaden the well-established term ‘gravity’ of retail
agglomerations by allowing for perceived evaluations of ‘objective’ retail site characteristics
along the buying process, which are finally integrated into a multi-dimensional construct of

-25-
retail attractiveness. The fact that the various exogenous factors exert different effects on each
of the proposed dimensions encourages a differentiated view of the construct ‘attractiveness’.
Finally, it should be noted that an agglomeration needs to be attractive on each of the stages
of a shopping trip, including the situational one.
Limitations
There are several limitations of the proposed approach. First, our results suffer from
external validity. Similar to most other empirical studies in the present research area, the
results can only be regarded of being representative for the clientele of the two retail
agglomerations under study. In the present case this is particularly true for the shopping street.
Fostered by the limited accessibility by car, the latter attracts younger and urban consumers
who life, work and/or study nearby. However, the findings may be different for other
agglomeration types and locations. A representative sample of respondents from respective
trading areas would also include people who refuse to shop at one or both agglomerations,
which would affect the results as well. In other words, our results are biased towards people
who really shop and/or patronize those two specific agglomerations.
A second limitation is related to the employed survey approach, which confronted the
respondents with a concrete shopping situation. This in vivo notion might be regarded as the
main source of deviations of our findings from those reported in the existing literature. In this
respect, the authors can refer to a survey (n=461) conducted parallel to the present study. The
respondents representing the demographic structure of the trade area of the two
agglomerations were interviewed at home – hence, in vitro – using a slightly adapted
questionnaire. As expected, the results turned out to be significantly different concerning the
importance of the site-related factors. In particular, parking and accessibility affected all
dimensions of attractiveness to a considerably higher degree. Quite obviously, different
interview situations lead to different results. In other words, both in vitro and in vivo

-26-
approaches suffer from some kind of ‘situational bias’ that affects the way customers evaluate
the same agglomeration. The potential advantages and shortcomings of the applied in vivo
approach for measuring retail attractiveness are summarized in Table 6.
Table 6: Critical review of the applied in vivo approach
Advantages Disadvantages Possibility to evaluate the impact of specific shopping
situations on consumers perceptions, attitudes and behavior
Limited external validity regarding other shopping situations. The findings account only for a specific situation and shopping environment.
Possibility to investigate what attracts customers
during the shopping process. This enables managers to develop strategies to influence consumer behavior on site.
The findings are limited to a certain stage of the
buying process, i.e. might not be relevant for a pre-trip or post-trip view.
Respondents are in a more biotic interview
environment, i.e. they are confronted with things they do on a certain stage of the shopping process.
More difficult to motivate respondents or the shopping situation may cause time pressure. In general the approach is time and cost extensive compared to others. Furthermore, answers can be biased by the attempt to reduce dissonances, e.g. regarding decisions taken prior to the interview.
Respondents can be regarded as experts and therefore have expertise in what is investigated, i.e. the sample concentrates on shoppers and neglect those who stay away from the Point of Sales.
Myopia regarding other persons living in a household
who mainly undertake other roles than ‘shoppers’ but also exert influence on the shopping behavior of the respondent.
Finally, the constructs ‘involvement’ and ‘distance’ capture situational aspects of a
shopping trip in a very reduced and simplified fashion. Of course, a variety of other factors
may provide a different and/or more in-depth characterization of the situational context. These
may include emotions, physical and social surroundings, concrete task definitions, etc. (Van
Kenhove et al., 1999). An inclusion of more detailed factors could contribute to more refined
empirical findings. It is worth mentioning, however, that this would not harm the measured
effects of the other exogenous marketing-mix factors on the attractiveness dimensions.
Directions for further research
Although we included planned and unplanned agglomerations in our empirical study,
differences in results were not thoroughly investigated. The employed SEM approach would
allow a comparative multi-group analysis including tests of the measurement and structural
models for significant differences. Similar to the approach introduced by Mägi (2003), the

-27-
addition of other endogenous variables such as share of wallet, share of time, or share of visits
would also be a natural extension. This would enable a more detailed study of possible
discrepancies between perceptions, evaluations and behavioral consequences.
In the empirical application presented here, two dominating agglomerations with unique
and characteristics were included in the study. Smaller agglomerations, such as neighborhood
centers or town centers, can be regarded as being of similar competitive interest for both
practitioners and researchers, since their number is relatively high. The proposed model can
be applied in such contexts as well and could be used to benchmark different types of
agglomerations against each other. Furthermore, the approach can also be applied to compare
more homogenous agglomeration formats to each other.
Although the two respondent groups were significantly different, moderating variables
were not considered in this paper. Consideration of customer heterogeneity with respect to
demographic or psychographic variables as well as to shopping behavior could contribute to
answering the question of whether different consumer segments choose, perceive and evaluate
agglomerations distinctively.
The idea underlying the empirical approach demonstrated in this paper is to focus only
on agglomerations that are actually visited by the respondents. In doing so, the comparative
view towards competing agglomerations was neglected. In practice, one agglomeration
typically shares a customer’s patronage with another to a substantial degree. By comparing
the performance of two or more agglomerations with the same survey instrument over a
longitude of time, variety seeking or out shopping behavior could be detected.
Referring to the notions of Van Kenhove (1999) the importance of the buying or visiting
situations in evaluation processes of retail sites was confirmed in our study. Further research
endeavors could focus on the impact of such situational factors on single stages of the whole
buying process from initial task definition to post-purchase evaluations. Finally, the
differences between pre-trip and post-trip evaluations are also worth focusing on.

-28-
REFERENCES
Alzubaidi, H., Vignali, C., Davies, B. J., Schmidt, R. A., 1997. Town centre versus out-of-
town shopping: a consumer perspective. International Journal of Retail and Distribution
Management 25 (2), 78-89.
Anderson, J.C., Gerbing, D.W., 1988. Structural Equation Modeling in Practice: A Review
and Recommended Two-Step Approach. Psychological Bulletin 103 (3), 411-423.
Arbuckle, J. L., Wothke, W., 1999. AMOS 4.0. User's Guide. SmallWaters Corporation,
Chicago.
Arbuckle, J. L., Wothke, W., 2003. AMOS 5.0. Update to the Amos User's Guide.
SmallWaters Corporation, Chicago.
Arentze, T. A., Timmermans, H. J. P., 2001. Deriving performance indicators from models of
multipurpose shopping behaviour. Journal of Retailing and Consumer Services 8 (6),
325-334.
Arentze, T.A., Oppewal H., Timmermans, H.J.P., 2005. A Multipurpose Shopping Trip
Model to Assess Retail Agglomeration Effects. Journal of Marketing Research 42 (2),
109-115.
Arnold. S.J., Oum T.H., Tigert D.J., 1983. Determinant attributes in retail patronage:
Seasonal. temporal and international comparisons. Journal of Marketing Research 20
(2), 149-157.
Babin, B. J., Darden, W. R., Griffin, M., 1994. Work and/or fun: Measuring hedonic and
utilitarian shopping. Journal of Consumer Research 20 (4), 644-656.
Bacon, R. W., 1995. Combined trips and the frequency of shopping. Journal of Retailing and
Consumer Services 2 (3), 175-183.
Bagozzi, R. P., Yi, Y., 1988. On the Evaluation of Structural Equation Models. Journal of the
Academy of Marketing Science 16 (1), 74 -94.

-29-
Bagozzi, R. P., Yi, Y., Phillips, L. W., 1991. Assessing Construct Validity in Organizational
Research. Administrative Science Quarterly 36 (3), 421-458.
Baker, J., Parasuraman, A., Grewal, D., Voss, G. B., 2002. The Influence of Multiple Store
Environment Cues on Perceived Merchandise Value and Patronage Intentions. Journal
of Marketing Research 66 (2), 120-141.
Baker, R.G.V., 1996. Multi-purpose shopping behaviour at planned suburban shopping
centres: a space-time analysis. Environment and Planning A., 28 (4), 611-630.
Baker, R. G.V., 2002. The impact of the deregulation of retail hours on shopping trip patterns
in a mall hierarchy: an application of the RASTT model to the Sydney Project (1980-
1998) and the global vacant shop problem. Journal of Retailing and Consumer Services
9 (3), 155-171.
Baker, R. G.V., 2006. Dynamic Trip Modelling. From Shopping Centres to the Internet.
Springer, Dordrecht.
Baumgartner, H., Homburg, C., 1996. Applications of structural equation modeling in
marketing and consumer research: A review. International Journal of Research in
Marketing 13 (2), 139-161.
Bearden, W. O., 1977. Determinant attributes of store patronage - Downtown versus outlying
shopping centers. Journal of Retailing 53 (2), 15-22.
Bell, D. R., Ho, T.-H., Tang, C. S., 1998. Determining where to shop: Fixed and variable
costs of shopping. Journal of Marketing Research 35 (3), 352-369.
Bell, D. R., Lattin, J. M., 1998. Shopping Behavior and Consumer Preference for Store Price
Format: Why ‘Large Basket’ Shoppers Prefer EDLP. Marketing Science 17 (1), 66-88.
Bellenger, D. N., Robertson, D. H., Greenberg, B. A., 1977. Shopping Center Patronage
Motives. Journal of Retailing 53 (2), 29-38.
Bentler, P. M., 1990. Comparative Fit Indexes in Structural Models. Psychological Bulletin
107 (2), 238-246.

-30-
Berman, B., Evans, J. R., 2001. Retail Management. A Strategic Approach. Prentice Hall:
Upper Saddle River, NJ.
Bhatnagar, A., Ratchford, B. T., 2004. A model of retail format competition for non-durable
goods. International Journal of Research in Marketing 21 (1), 39-59.
Bloch, P. H., Ridgway, N. M., Dawson, S. A., 1994. The shopping mall as consumer habitat.
Journal of Retailing 70 (1), 23-42.
Boots, B., South, R., 1997. Modeling retail trade areas using higher-order, multiplicatively
weighted Voronoi diagrams. Journal of Retailing 73 (4), 519-536.
Brandenburger. A., Nalebuff, B.,1996. Co-opetition. Doubleday, New York.
Burns, D. J., Warren, H. B., 1995. Need for uniqueness: Shopping mall preference and choice
activity. International Journal of Retail and Distribution Management 23 (12), 4-12.
Byrne, B. M., 2001. Structural equation modeling with AMOS. Basic concepts, applications,
and programming. Lawrence Erlbaum Associates, Mahwah, London.
Cadwallader, M., 1975. A Behavioral Model of Consumer Spatial Decision Making.
Economic Geography 51 (4), 339-349.
Campell, D. T., 1955. The Informant in Quantitative Research. American Journal of
Sociology 60 (4), 339-342.
Churchill, G. A., 1979. A paradigm for developing better measures of marketing constructs.
Journal of Marketing Research 16 (1), 64-73.
Cliquet, G., 1995. Implementing a subjective MCI model: An application to the furniture
market. European Journal of Operational Research 84 (2), 279-291.
Cohen, J., 1988. Statistical power analysis for the behavioral sciences. New York: Academic
Press.
Converse, P. D., 1949. New Laws of Retail Gravitation. Journal of Marketing 14 (3), 379-
390.

-31-
Cooper, L.G., Nakanishi, M., 1988. Market-Share Analysis. International Series in
Quantitative Marketing. Kluwer Academic Publishers, Dordrecht.
Craig, S., Ghosh, A., McLafferty, S.L., 1984. Models of Retail Location Process: A review.
Journal of Retailing 60 (1), 5-36.
Dellaert, B. G. C., Arentze, T. A., Bierlaire, M., Borgers, A. W.J., Timmermans, H. J. P.,
1998. Investigating consumers' tendency to combine multiple shopping purposes and
destinations. Journal of Marketing Research 35 (2), 177-188.
Dennis, C., 2005. Objects of Desire. Consumer behaviour in Shopping Centre Choices.
Palgrave Macmillan, Hampshire/New York.
Diamantopoulos, A., 1994. Modelling with LISREL: A Guide for the Uninitiated, Journal of
Marketing Management. 10, 105-136.
Dickson, P. R., Sawyer, A. G., 1990. The Price Knowledge and Search of Supermarket
Shoppers. Journal of Marketing, 54 (3), 42-53.
Donovan, R. J., Rossiter, J. R., Marcoolyn, G., Nesdale, A., 1994. Store Atmosphere and
Purchasing Behavior. Journal of Retailing 70 (3), 283-294.
Dunne, P., Lusch, R. F., 1999. Retailing. The Dryden Press, Fort Worth.
Festinger, L., 1957. A Theory of Cognitive Dissonance. Peterson, Evanston, IL.
Festinger, L., 1964. Conflict, Decision, and Dissonance. Stanford University Press, Stanford,
CA.
Finn, A., Louviere, J. J., 1996. Shopping Center Image, Consideration, and Choice: Anchor
Store Contribution. Journal of Business Research 35, 241-251.
Fornell, C., Larcker, D. F., 1981. Evaluating structural equation models with unobservable
variables and measurement error. Journal of Marketing Research 18 (1), 39-40.
Fotheringham, A., 1988. Consumer store choice and choice set definition. Marketing Science
7 (3), 299-310.

-32-
Galata, G., Bucklin R.E., Hanssens, D.M., 1999. On the Stability of Store Format Choice,
Working paper. University of California.
Gensch, D. H., Recker, W. W., 1979: The Multinomial Multiattribute Logit Choice Model.
Journal of Marketing Research 16, 124-132.
Ghosh, A., 1986. The Value of a Mall and Other Insights from a Revised Central Place
Model. Journal of Retailing 62 (1), 79-97.
Ghosh, A., McLafferty, S.L., 1987. Location Strategies for Retail and Service Firms.
Lexington Books, Massachusetts.
Gonzáles-Benito, O., 2005. Spatial competitive interaction of retail store formats: modelin
gporopsal and empirical results. Journal of Business Research 58, 457-466.
Gonzáles-Benito, O., Greatorex, M., Munoz-Gallego, P.A., 2000. Assessment of potential
retail segmentation variables. An approach based on a subjective MCO resource
allocation model. Journal of Retailing and Consumer Services 7, 171-179.
González-Benito, O., 2002. Overcoming data limitations for store choice modeling.
Exploiting retail chain choice data by means of aggregate logit models. Journal of
Retailing and Consumer Services 9 (5), 259-268.
Granzin, K. L., Painter, J. J., Valentin, E. K., 1997. Consumer logistics as a basis for
segmenting retail markets. An exploratory inquiry. Journal of Retailing and Consumer
Services 4 (2), 99-107.
Hair, J.F., Anderson, R.E., Tatham R.L., Black, W.C., 1995. Multivariate Data Analysis.
Englewood Cliffs, NJ: Prentice-Hall.
Haynes, K.E., Fotheringham, A.S., 1984. Gravity and spatial interaction models. Sage
Publications, Beverly Hills (CA).
Hoffman, D. K., Turley, L. W., 2002. Atmospherics, service encounters and consumer
decision making: An integrative perspective. Journal of Marketing Theory and Practice
10 (3), 33-48.

-33-
Huff, D.L., 1963. A probabilistic analysis of shopping centre trade areas. Land Economics 39,
81-90.
Huff, D.L., 1964. Defining and Estimating a Trade Area. Journal of Marketing 28 (3), 34-38.
ICSC (International Counsil of Shopping Centers), 2002. The development of shopping
centres in Europe 2002, www.icsc.org/international/EuropeReviewFINAL.pdf.
ICSC (International Counsil of Shopping Centers), 2005. The development of shopping
centres – Scope US 2005, http://www.icsc.org/srch/rsrch/scope/current/index.php.
Ingene, C. A., 1984. Productivity and Functional Shifting in Spatial Retailing: Private and
Social Perspectives. Journal of Retailing and Consumer Services 60 (3), 15-26.
Jennings, D., 1978. Shopping Behavior and Income: Comparisons in an Urban Environment.
Economic Geography 54, 157-167.
Kahn. B.E., Schmittlein. D.C., 1989. Shopping Trip Behavior: An Empirical Investigation.
Marketing Letters, 1 (4), 55-70.
Kim, Y.-K., 2002. Consumer value: An application to mall and Internet shopping.
International Journal of Retail & Distribution Management, 30(11/12), 595-602.
Kline, R. B., 2005. Principles and practice of structural equation modeling. The Guilford
Press, New York, London.
Laaksonen. M., 1993. Retail patronage dynamics. Learning about daily shopping behaviour in
contexts of changing retail structures. Journal of Business Research 28 (1/2), 3-168.
Levy, M., Weitz, B. A., 2004. Retailing Management. Irwin, New York.
Loehlin, J.C., 1998. Latent Variable Models: an introduction to factor, path, and structural
analysis. Lawrence Erlbaum Associates, Malwah, NJ.
Mägi, A. W., 2003. Share of wallet in retailing: the effects of customer satisfaction, loyalty
cards and shopper characteristics. Journal of Retailing 79 (2), 97-106.

-34-
Marjanen, H., 1995. Longitudinal study on consumer spatial shopping behaviour with special
reference to out-of-town shopping. Experiences from Turku, Finland. Journal of
Retailing and Consumer Services 2 (3), 163-174.
Miller, C. E., Reardon, J., McCorkle, D. E., 1999. The effects of competition on retail
structure: An examination of intratype, intertype, and intercategory competition. Journal
of Marketing 63 (4), 107-120.
Miller, K. E., Ginter, J. L., 1979. An investigation of situational variation in brand choice
behavior and attitude. Journal of Marketing Research 16 (2), 111-123.
Nevin, J.R., Houston, M.J., 1980. Image as a Component of Intra-Urban Shopping Areas.
Journal of Retailing 56 (1), 77-93.
Oppewal, H., Holyoake, B., 2004. Bundling and retail agglomeration effects on shopping
behaviour. Journal of Retailing and Consumer Services 11 (2), 61-74.
Oppewal, H., Louviere J., Timmermans, H., 1997. Modelling the Effects of Shopping Centre
Size and Store Variety on Consumer Choice Behaviour. Environment and Planning 29
(6), 1073-1090.
Prendergast, G., Marr, N., Jarratt, B., 1998. Retailers' views of shopping centres: a
comparison of tenants and non-tenants. International Journal of Retail and Distribution
Management 26 (4), 162-171.
Reilly, W. J., 1931. The Law of Retail Gravitation. New York.
Reinartz, W. J., Kumar, V., 1999. Store-, Market-, and Consumer-Characteristics: The Drivers
of Store Performance. Marketing Letters 10 (1), 5-23.
Rhee, H., Bell, D. R., 2002. The inter-store mobility of supermarket shoppers. Journal of
Retailing 78 (4), 225-237.
Ridgway. N.M., Dawson. S.A., Bloch, P.H., 1990. Pleasure and arousal in the marketplace:
Interpersonal differences in approach-avoidance responses. Marketing Letters 2 (3).
139-147.

-35-
Ruiz, J. P., Chebat, J.-C., Hansen, P., 2003. Another trip to the mall: a segmentation study of
customers based on their activities. Journal of Retailing and Consumer Services 11 (1),
1-18.
Rust, R., Donthu, N., 1995. Capturing geographically localized misspecification error in retail
store choice models. Journal of Marketing Research 32 (1), 103-110.
Severin, V., Louviere, J. J., Finn, A., 2001. The stability of retail shopping choices over time
and across countries. Journal of Retailing 77 (2), 185-202.
Sheth, J. N., Mittal, B., Newman, B. I., 1999. Customer Behavior. Consumer Behavior and
Beyond. Dryden Press, Fort Worth et al.
Sinha, A., 2000. Understanding Supermarket Competition Using Choice Maps. Marketing
Letters 11 (1), 21-35.
Spiggle. S., Sewall. M.A., 1987. A choice sets model of retail selection. Journal of Marketing
51 (2), 97-111.
Stanley, T.J., Sewall, M.A., 1976. Image Inputs to a Probabilistic Model: Predicting Retail
Potential. Journal of Marketing 40, 48-53.
Statistik Austria (2005), Statistisches Jahrbuch Österreichs 2005. Vienna, Verlag Österreich.
Steenkamp, J-B.E.M., van Trijp, H.C.M., 1991. The use of LISREL in validating marketing
constructs. International Journal of Research in Marketing, 8, 283-299.
Suárez, A., Del Bosque, I. R., Rodríguez-Poo, J. M., Moral, I., 2004. Accounting for
heterogeneity in shopping centre choice models. Journal of Retailing and Consumer
Services 11 (2), 119-129.
Sudman, S., 1980. Improving the Quality of Shopping Center Sampling. Journal of Marketing
Research 17 (4), 423-431.
Swinyard, W. R., 1998. Shopping mall customer values: the national mall shopper and the list
of values. Journal of Retailing and Consumer Services 5 (3), 167-172.

-36-
Tang, C. S., Bell D. R., Teck-Hua, H., 2001. Store Choice and Shopping Behavior: How Price
Format Works. California Management Review 43 (2), 56-74.
Timmermans, H.J.P., 1982. Consumer Choice of Shopping Centre: An Information
Integration Approach. Regional Studies 16, 171 - 182.
Van der Waerden, P., Borgers, A., Timmermans, H.J.P., 1998. The impact of the parking
situation in shopping centres on store choice behaviour. GeoJournal 45 (4), 309-315.
Van Kenhove, P., De Wulf, K., Van Waterschoot, W., 1999. The Impact of Task Definition
on Store-Attribute Saliences and Store Choice. Journal of Retailing 75 (1), 125-137.
Wakefield, K. L., Baker, J., 1998. Excitement at the mall: Determinants and effects on
shopping response. Journal of Retailing 74 (4), 515-539.
Woodside, A. G., Trappey, R. J., 1992. Finding out why customers shop your store and buy
your brand: Automatic cognitive processing models of primary choice. Journal of
Advertising Research 32 (6), 59-78.
Wrigley, N., Lowe, M., 2002. Reading Retail. A geographical perspective on retailing and
consumption spaces. Arnold, London.
-37-
APPENDIX
Table 6: Measurement information for individual factors
Shopping Street (n=1066) Shopping Mall (n=1073)
Source of factors, scales and indicators Measures
(latent) Factor
Indicator
Measures of central tendency
(µ/σ)
Reliability (α/ρ)
Average Variance Extracted
Fornell-Larcker
Criterion
Measures of central tendency
(µ/σ)
Reliability (α/ρ)
Average Variance Extracted
Fornell-Larcker
Criterion
Exogenous measurement model
Accessibility (ξ1) You can get to … easily.a 5.6/1.9
.91/.91 .78 .26
5.2/2.1
.95/.95 .87 .26
Alzubaidi et al., 1997; Ruiz et al., 2003; Bearden, 1977; Van Kenhove et al., 1999; Woodside and Trappey, 1992; Bellenger et al., 1977; Bhatnagar and Ratchford, 2004;
You can get to … quickly.a 5.2/2.1 5/2.1
You can get to … without problems.a 5.7/1.8 5.2/2
Parking (ξ2) There are always enough free parking lots.a 2/1.4
.65/.69 .44 .14
4.2/2
.71/.74 .5 .25 Tang et al., 2001; Sinha, 2000; Bearden, 1977; Bellenger et al.,1977; Ruiz et al., 2003; Arentze and Timmermans 2001; Bhatnagar and Ratchford, 2004;
There are sufficient different parking possibilities.a 3/1.7 5.2/1.8
…is easily and quickly reached from the parking lots.a 3.9/1.7 5.8/1.4 Retail tenent mix (ξ3) …has a large variety of retail stores. a 6.2/1.1
.76/.8 .59 .45
6.6/0.8
.79/.81 .59 .3
Arentze and Timmermans 2001; Prendergast et al., 1998; Baker, 2002; Dellaert et al., 1998; Reinartz, Kumar, 1999; Wakefield and Baker, 1998; Bellenger et al., 1977; Dellaert et al., 1998; Boots and South, 1997; Ingene, 1984; Severin et al., 2001;
…has an attractive variety of retail stores. a 6/1.2 6.3/1
…has numerous well known retail stores. a 6.3/1 6.5/0.9
Merchandise value (ξ4) Prices for offered goods are low and you can find lots of bargains at ….a
4.3/1.1
.75/.77 .53 .49
4.5/1.1
.8/.81 .59 .3
Alzubaidi et al., 1997; Van Kenhove et al., 1999; Tang et al., 2001; Bhatnagar and Ratchford 2004; Baker et al., 2002; Severin et al., 2001; Bearden, 1977; Bellenger et al.,1977;
Price/performance ratio is good at ….a 4.9/1.2 5/1.2
The quality of offered goods is good at ….a 5.1/1.1 5.3/1.1
Non retail tenent mix (ξ5) You can find lots of gastronomy at ….a 5.1/1.5
.71/- - - 5.7/1.4
.67/- - - Prendergast et al., 1998; Bellenger et al.,1977; Wakefield and Baker, 1998; … offers a large variety of entertainment.a 4.3/1.4 4.9/1.8

-38-
Orientation (ξ6) You can easily orientate yourselt at ….a 5.5/1.6
.74/- - - 5.3/1.6
.83/- - - Baker et al., 2002; Van Kenhove et al., 1999; The shops are clearly arranged at ….a 4.9/1.6 5.3/1.6 Ambience (ξ7) You do not feel that the smell at … is desturbing. a 5.2/1.7
.73/.75 .51 .44 5.7/1.7
.82/.83 .63 .41 Ruiz et al., 2003; Wakefield and Baker, 1998; Bloch et al., 1994;
The air at … is pleasant.a 4.3/1.7 4.8/1.9 The temperature at … is pleasant.a 4.2/1.7 5/1.8 Atmosphere (ξ8)
There is a good mood at ….a 4.5/1.6
.94/- - -
4.8/1.5
.95/- - -
Baker et al., 2002; Bearden, 1977; Bellenger et al., 1977; Hoffman and Turley 2002; Severin et al., 2001; Tang et al., 2001; Arentze and Timmermans, 2001; Bloch et al., 1994 The atmosphere at … is pleasant.a 4.6/1.5 4.9/1.5
Distance (ξ9)
What is the distance in terms of … from your point of arrival to ….
time (minutes)b 13.5/29.1
.89/- - -
28.3/38.5
.88/- - -
Arentze and Timmermans, 2001; Babin et al., 1994; Bacon, 1995, Baker, 2002; Dellaert et al., 1998; González-Benito, 2002; Marjanen, 1995; Rhee and Bell, 2002; Suárez et al., 2004; Ruiz et al., 2003; Swinyard, 1998; Tang et al., 2001; Van Kenhove, et al. 1999; Sinha, 2000; Bell et al., 1998; Ingene, 1984;
space (kilometer)b 23/23.4 29.6/26.4
Involvement (This shopping trip is … for you.) (ξ10) Not attractive/attractivec 5.3/1.5
.8/.8 .5 .49
5.3/1.5
.82/.82 .54 .53 Wakefield and Baker, 1998; Boring/interestingc 5.4/1.5 5.3/1.5 Not exciting/excitingc 4.7/1.5 4.7/1.6 Not pleasant/pleasantc 5.2/1.5 5.3/1.5
Endogenous measurement model
Overall attractiveness (satisfaction) (η1) How satisfied are you with … (very dis-/-satisfied)c 5.8/1.1
.8/.8 .58 .45-
5.9/1.1
.81/.81 .58 .3 Severin et al., 2001; Ruiz et al., 2003; Mägi, 2003; How does … meet your expectations (not at all/totally)c 5.8/1.1 6/1 Think of an ideal SST/SM. Tho what extent does … comes close to that? (not close/very close)c
5.2/1.4 5.6/1.4
Situational attractiveness (retention proneness) (η2) You are willing to stay here … as long as possible.d 4/2.7
.78/- - - 4.6/3
.8/- - - Baker, 2002; Wakefield and Baker, 1998; You enjoy spending your time here at ….d 5.6/2.8 5.8/2.9 Sustainable attractiveness (Intended Patronage) (η3) How likley are you to come here again in the future (very unlikely/very likely)d
9.4/1.4 .75/- - -
9.6/1.2 .76/- - -
Baker et al., 2002; Tang, et al., 2001; Wakefield and Baker, 1998; Burns and Warren, 1995; How likely are you to come here again and buy somenthing
(very unlikely/very likely)d 8.8/1.8 9.2/1.5
Caption: µ…mean value; σ…standard deviation; α…Cronbach’s Alpha; ρ…composite reliability (reported if more than two items); -…no value reported since no confirmatory analysis could be calculated; a…seven point rating Scale (anchors 0-6; totally disagree – totally agree; recoded to 1-7); b…metric scale; c…seven point rating scale (anchor -3 to+3; recoded to 1-7); d…ten point rating scale (anchor 0 and 9; recoded to 1-10