Embed Size (px)
Citation preview
Please read this insert completely prior to using the product. For research use only. Not for use in diagnostic procedures.
www.ArborAssays.com
DetectX®
Sample Types Validated:
NCal™ International Standard Kit
UREA NITROGEN (BUN)Colorimetric Detection Kit
2 Plate Kit Catalog Number K024-H1
10 Plate Kit Catalog Number K024-H5
Species Independent
Serum, Plasma, Urine, Saliva and TCM
Calibrated to NIST Standard Reference Material Lot No. 912a
WEB INSERT 180301
EXPECT ASSAY ARTISTRY
®
2
TABLE OF CONTENTS
Background 3
Assay Principle 4
Related Products 4
Supplied Components 4
Storage Instructions 4
Other Materials Required 5 Precautions 5
Sample Types 5
Sample Preparation 5
Standard Preparation 6
Assay Protocol 6 Calculation of Results 7
Typical Data 7-8
Validation Data Sensitivity, Linearity, etc. 8-10
Sample Values 10
Warranty & Contact Information 11 Plate Layout Sheet 12
WEB INSERT 180301
www.ArborAssays.com
®
3
BACKGROUNDUrea is a by-product of protein metabolism by the liver, and is therefore removed from the blood by the kidneys. Urea freely filters through the glomerulous, but is reabsorbed by the renal tubules in a flow-dependent fashion. The higher the flow rate, the greater amount of urea nitrogen is cleared from circulation and eliminated through the kidneys. As a result, the level of circulating urea nitrogen, along with serum creatinine, serves as a primary measure of kidney function. Normal adult Blood Urea Nitrogen (BUN) levels should be between 7 and 21 mg urea nitrogen per 100 mL blood (mg/dL)1. Azotemia, poor kidney function, will cause elevated BUN levels (≥ 50 mg/dL) and is associated with acute kidney failure or injury, severe acute pancreatitis, congestive heart failure or gastrointestinal bleeding2-5. Azotemia also can occur with dehydration, as a result of alcohol abuse, or high protein diets. Lower than expected BUN levels are usually not clinically predictive, but are primarily associated with liver disease or malnutrition, including malabsorption and low protein diets6. Urine and saliva are considered to be acceptable non-invasive samples for measurement of urea nitrogen7.
Serum creatinine is another metabolic waste product freely filtered by the glumerulous, but does not undergo tubular reabsorption. Its steady rate of elimination is frequently used to generate an index or ratio with BUN values for normalized evaluations. Easy to use Serum Creatinine and Urinary Creatinine Detection kits are also available from Arbor Assays (see Related Products).
1. Laboratory reference values. Urea nitrogen (BUN). Rochester, Minn.: Mayo Foundation for Medical Education and Research; Nov. 2010.
2. Waiker, SS and JV Bonventre. “Biomarkers for the diagnosis of acute kidney injury.” Nephron Clin. Pract. 2008. 109:c192-c197.
3. Al Mofleh, IA. World J. Gastroent. “Severe acute pancreatitis: pathogenetic aspects and prognostic factors.” 2008. Congestive heart failure. 14(5):675-684.
4. Iglesiase, J. et al. “Predictors of worsening renal function in adult patients with heart failure receiv-ing recombinant human B-type brain natruiretic peptide (nesiritide).” Nephrol. Dial. Transplant. 2006. 21:3458-3465.
5. Mayo Clinic. “Blood urea nitrogen (BUN) tests.” www.mayoclinic.com/health/blood-urea-nitrogen/MY00373/DSECTION=results
6. Lum, G and S Leal-Khouri. “Significance of low serum urea nitrogen concentrations”. Clin. Chem. 1989. 35(4):639-640.
7. Akai, T, et al. “Salivary urea nitrogen as an index to renal function: a test strip method”. Clin. Chem. 1983. 29(10):1825-1827.
WEB INSERT 180301
EXPECT ASSAY ARTISTRY
®
4
ASSAY PRINCIPLE The DetectX® Urea Nitrogen (also called BUN) Detection Kit is designed to quantitatively measure urea nitrogen in a variety of samples. Please read the complete kit insert before performing this assay. A urea nitrogen standard calibrated to NIST reference materials is provided to generate a standard curve for the assay and all samples should be read off the standard curve. Samples are mixed with Color Reagents A and B and incubated at room temperature for 30 minutes. The colored product is read at 450 nm. The concentration of urea nitrogen in the sample is calculated, after making a suitable correction for any dilution, using software available with most plate readers. The results are expressed in terms of mg/dL urea nitrogen. If samples are to be expressed in terms of mg/dL urea, the data can be converted using the multiplier 2.14.
RELATED PRODUCTS
Kits Catalog No.
Serum Creatinine Detection Kits KB02-H1 /H2
Retinol Binding Protein Urinary EIA Kit KU04-H1
Cystatin C EIA Kit K012-H1
Hemoglobin Dual Range Detection Kit K013-H1
SUPPLIED COMPONENTSClear 96 well Plates – Bags containing 96 well plates 2 plates (K024-H1 Kit) Catalog Number X003-2EA 2 by 5 plates (K024-H5 Kit) Catalog Number X003-5EA
Urea Nitrogen Standard – Urea Nitrogen at 100 mg/dL in a special stabilizing solution. 250 µL (K024-H1 Kit) Catalog Number C089-250UL 1 mL (K024-H5 Kit) Catalog Number C089-1ML
Calibrated to NIST Standard Reference Material Lot Number 912a
Color Reagent A – An acidic solution of Color Reagent A. CAUTION: CAUSTIC 15 mL (K024-H1 Kit) Catalog Number X094-15ML 2 by 38 mL (K024-H5 Kit) Catalog Number X094-38ML
Color Reagent B – An acidic solution of Color Reagent B. CAUTION: CAUSTIC 15 mL (K024-H1 Kit) Catalog Number X095-15ML 2 by 38 mL (K024-H5 Kit) Catalog Number X095-38ML
STORAGE INSTRUCTIONSAll components of this kit should be stored at room temperature until the expiration date of the kit.
WEB INSERT 180301
www.ArborAssays.com
®
5
OTHER MATERIALS REQUIREDDistilled or deionized water free of urea.
96 well plate reader capable of reading optical absorption at 450 nm.
Software for converting optical density (OD) readings from the plate reader and carrying out four parameter logistic curve (4PLC) fitting. Contact your plate reader manufacturer for details.
PRECAUTIONSAs with all such products, this kit should only be used by qualified personnel who have had laboratory safety instruction. The complete insert should be read and understood before attempting to use the product.
The Color Reagents A and B are both strong acid solutions and should be handled like any laboratory acid.
SAMPLE TYPESUrea nitrogen is identical across all species and this kit will measure urea nitrogen from sources other than human. The end user should evaluate recoveries of urea nitrogen in samples from other species being tested. The kit will measure urea nitrogen in low concentration samples such as RPMI cell culture media, however the media should not contain Phenol Red.
If samples need to be stored after collection, we recommend storing them at -70°C or lower, preferably after being frozen in liquid nitrogen. This assay has been validated for serum, plasma and urine. Samples containing visible particulate should be centrifuged prior to using.
SAMPLE PREPARATIONDilute sample with distilled or deionized water prior to running in the assay. For serum or plasma, the recommended dilution is ≥ 1:10 and ≥ 1:20 respectively. Saliva should be clarified by freeze/thawing, followed by centrifugation at 14,000 rpm at 4°C for 10 minutes. The saliva supernatant should be diluted at least 1:2 before measuring in the assay. For urine, where concentrations of urea are higher, the recommended final dilution is ≥ 1:100. For highly colored samples, dilution greater than 1:10 or 1:100 may be necessary.
WEB INSERT 180301
EXPECT ASSAY ARTISTRY
®
6
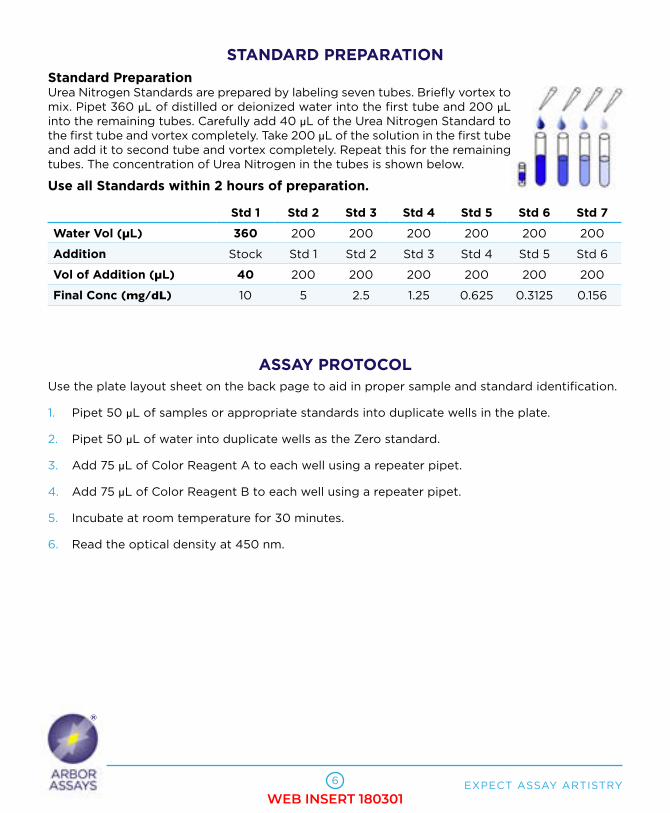
STANDARD PREPARATIONStandard Preparation Urea Nitrogen Standards are prepared by labeling seven tubes. Briefly vortex to mix. Pipet 360 µL of distilled or deionized water into the first tube and 200 µL into the remaining tubes. Carefully add 40 µL of the Urea Nitrogen Standard to the first tube and vortex completely. Take 200 µL of the solution in the first tube and add it to second tube and vortex completely. Repeat this for the remaining tubes. The concentration of Urea Nitrogen in the tubes is shown below.
Use all Standards within 2 hours of preparation.
Std 1 Std 2 Std 3 Std 4 Std 5 Std 6 Std 7
Water Vol (µL) 360 200 200 200 200 200 200
Addition Stock Std 1 Std 2 Std 3 Std 4 Std 5 Std 6
Vol of Addition (µL) 40 200 200 200 200 200 200
Final Conc (mg/dL) 10 5 2.5 1.25 0.625 0.3125 0.156
ASSAY PROTOCOLUse the plate layout sheet on the back page to aid in proper sample and standard identification.
1. Pipet 50 µL of samples or appropriate standards into duplicate wells in the plate.
2. Pipet 50 µL of water into duplicate wells as the Zero standard.
3. Add 75 µL of Color Reagent A to each well using a repeater pipet.
4. Add 75 µL of Color Reagent B to each well using a repeater pipet.
5. Incubate at room temperature for 30 minutes.
6. Read the optical density at 450 nm.
WEB INSERT 180301
www.ArborAssays.com
®
7
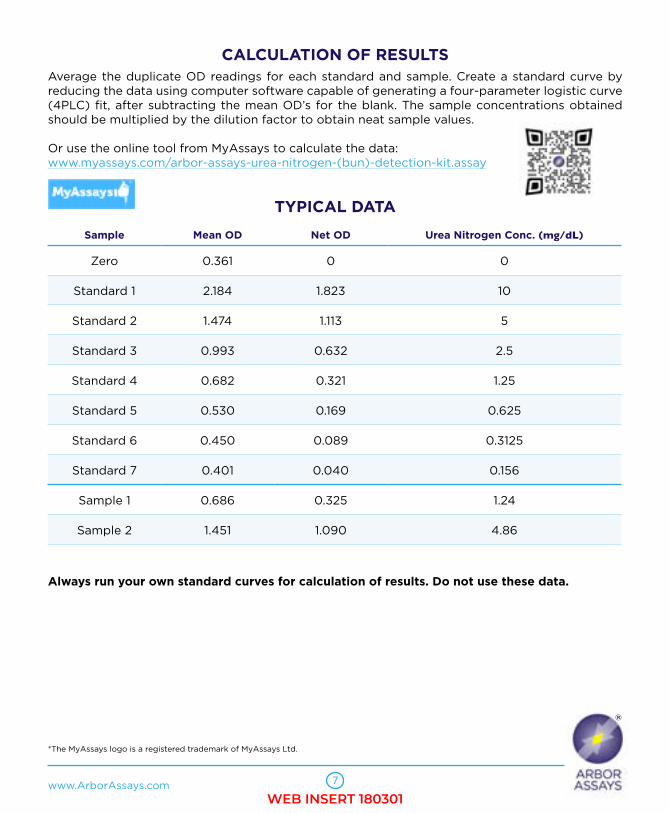
CALCULATION OF RESULTS Average the duplicate OD readings for each standard and sample. Create a standard curve by reducing the data using computer software capable of generating a four-parameter logistic curve (4PLC) fit, after subtracting the mean OD’s for the blank. The sample concentrations obtained should be multiplied by the dilution factor to obtain neat sample values.
Or use the online tool from MyAssays to calculate the data: www.myassays.com/arbor-assays-urea-nitrogen-(bun)-detection-kit.assay
TYPICAL DATA
Sample Mean OD Net OD Urea Nitrogen Conc. (mg/dL)
Zero 0.361 0 0
Standard 1 2.184 1.823 10
Standard 2 1.474 1.113 5
Standard 3 0.993 0.632 2.5
Standard 4 0.682 0.321 1.25
Standard 5 0.530 0.169 0.625
Standard 6 0.450 0.089 0.3125
Standard 7 0.401 0.040 0.156
Sample 1 0.686 0.325 1.24
Sample 2 1.451 1.090 4.86
Always run your own standard curves for calculation of results. Do not use these data.
*The MyAssays logo is a registered trademark of MyAssays Ltd.
WEB INSERT 180301
EXPECT ASSAY ARTISTRY
®
8
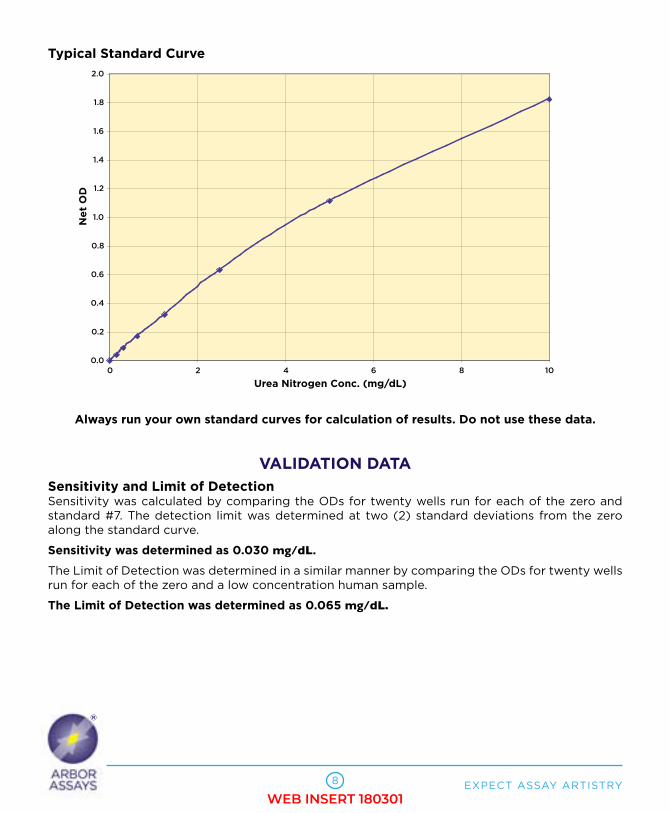
Typical Standard Curve
Always run your own standard curves for calculation of results. Do not use these data.
VALIDATION DATASensitivity and Limit of DetectionSensitivity was calculated by comparing the ODs for twenty wells run for each of the zero and standard #7. The detection limit was determined at two (2) standard deviations from the zero along the standard curve.
Sensitivity was determined as 0.030 mg/dL.
The Limit of Detection was determined in a similar manner by comparing the ODs for twenty wells run for each of the zero and a low concentration human sample.
The Limit of Detection was determined as 0.065 mg/dL.
0.0
0.2
0.4
0.6
0.8
1.0
1.2
1.4
1.6
1.8
2.0
0 2 4 6 8 10
Urea Nitrogen Conc. (mg/dL)
Net OD
Ne
t O
D
WEB INSERT 180301
www.ArborAssays.com
®
9
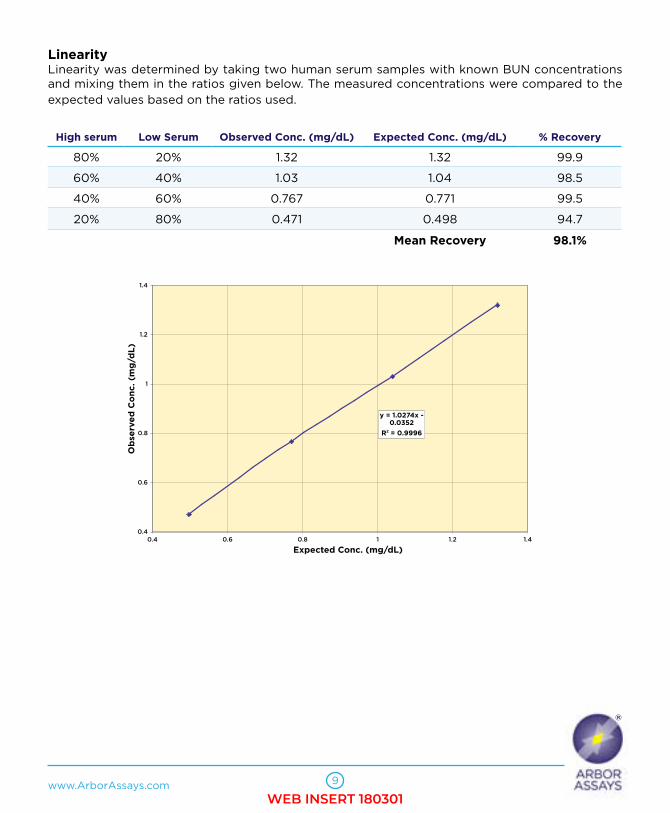
LinearityLinearity was determined by taking two human serum samples with known BUN concentrations and mixing them in the ratios given below. The measured concentrations were compared to the expected values based on the ratios used.
High serum Low Serum Observed Conc. (mg/dL) Expected Conc. (mg/dL) % Recovery
80% 20% 1.32 1.32 99.9
60% 40% 1.03 1.04 98.5
40% 60% 0.767 0.771 99.5
20% 80% 0.471 0.498 94.7
Mean Recovery 98.1%
y = 1.0274x - 0.0352
R2 = 0.9996
0.4
0.6
0.8
1
1.2
1.4
0.4 0.6 0.8 1 1.2 1.4
Expected Conc. (mg/dL)
Observed Conc. (mg/dL)Ob
serv
ed
Co
nc. (m
g/d
L)
WEB INSERT 180301
EXPECT ASSAY ARTISTRY
®
10
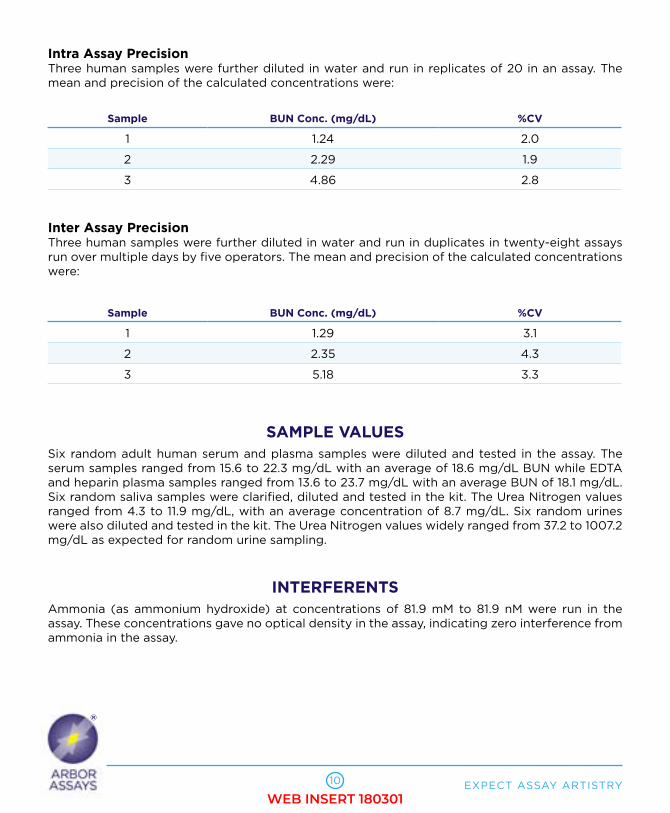
Intra Assay PrecisionThree human samples were further diluted in water and run in replicates of 20 in an assay. The mean and precision of the calculated concentrations were:
Sample BUN Conc. (mg/dL) %CV
1 1.24 2.0
2 2.29 1.9
3 4.86 2.8
Inter Assay PrecisionThree human samples were further diluted in water and run in duplicates in twenty-eight assays run over multiple days by five operators. The mean and precision of the calculated concentrations were:
Sample BUN Conc. (mg/dL) %CV
1 1.29 3.1
2 2.35 4.3
3 5.18 3.3
SAMPLE VALUESSix random adult human serum and plasma samples were diluted and tested in the assay. The serum samples ranged from 15.6 to 22.3 mg/dL with an average of 18.6 mg/dL BUN while EDTA and heparin plasma samples ranged from 13.6 to 23.7 mg/dL with an average BUN of 18.1 mg/dL. Six random saliva samples were clarified, diluted and tested in the kit. The Urea Nitrogen values ranged from 4.3 to 11.9 mg/dL, with an average concentration of 8.7 mg/dL. Six random urines were also diluted and tested in the kit. The Urea Nitrogen values widely ranged from 37.2 to 1007.2 mg/dL as expected for random urine sampling.
INTERFERENTSAmmonia (as ammonium hydroxide) at concentrations of 81.9 mM to 81.9 nM were run in the assay. These concentrations gave no optical density in the assay, indicating zero interference from ammonia in the assay.
WEB INSERT 180301

www.ArborAssays.com
®
11
LIMITED WARRANTY
Arbor Assays warrants that at the time of shipment this product is free from defects in materials and workmanship. This warranty is in lieu of any other warranty expressed or implied, including but not limited to, any implied warranty of merchantability or fitness for a particular purpose.
We must be notified of any breach of this warranty within 48 hours of receipt of the product. No claim shall be honored if we are not notified within this time period, or if the product has been stored in any way other than outlined in this publication. The sole and exclusive remedy of the customer for any liability based upon this warranty is limited to the replacement of the product, or refund of the invoice price of the goods.
CONTACT INFORMATIONFor details concerning this kit or to order any of our products please contact us: Arbor Assays
1514 Eisenhower Place Ann Arbor, Michigan 48108 USA
Phone: 734-677-1774
Fax: 734-677-6860
Web: www.ArborAssays.com
E Mail Addresses:
DetectX®, ThioStar® and the Arbor Assays logo are all registered trademarks.
OFFICIAL SUPPLIER TO ISWEArbor Assays and the International Society of Wildlife Endocrinology (ISWE) signed an exclusive agreement for Arbor Assays to supply ISWE members with EIA kits for wildlife conservation research.
WEB INSERT 180301

Printed on Forest Stewardship Council certified paper
1 2
3 4
5 6
7
8 9
10 11 12
A B C D E F G H
12
©2011
K024-H1/H5 180301
WEB INSERT 180301