Embed Size (px)
Citation preview

PLMLCLeadership Series
London RegionDay 1
Ellen Walters, YCDSB
Shelley Yearley, TLDSB
Monday February 28, 2011

Interactive Session Activity
• Make connections between the 5 Core Capacities of Effective Leadership and Board Improvement Planning

Connecting to the Core CapacitiesIdentify conditions, processes and/or structures that enable increased student
achievement in mathematics. idea per sticky note.• Share with your group.• Pile them and look for themes and trends based on
Core Capacities• Using the 5 Core Capacities of Effective Leadership
organizer, place piles in the appropriate capacity.• Record one theme per pile on an 8.5x11” paper. Post
on wall Core Capacity organizer.

5 Core Capacities of Effective Leadership
Identify conditions, processes and/or structures that enable increased student achievement in
mathematics.
Group Share

Using Data
• Plan: – needs assessment– validation of goals
• Act: – communication of
motivation and rationale– sharing of context– indicators of success
• Observe: – qualitative data and
quantitative data– formal and informal
collection processes
• Reflect:– impact of influence– next steps – gaps in data considered,
goals established, actions

Conversation Starters - Data
Ontario Leadership Strategy http://www.opsba.org/index.php?q=system/files/conversationStartersJan2010.pdf

Data DumpMetathink Document (Page 1)

Data DumpMetathink Document (Page 2)

What other data might we include?For elementary contexts:• Learning Skills and Work Habits• Report card marks
– compared by student to EQAO results– comparison of student achievement over time– mark distribution trends over grades/divisions
• Attendance data– who is absent, when, why
• Assessment data– board assessment tools
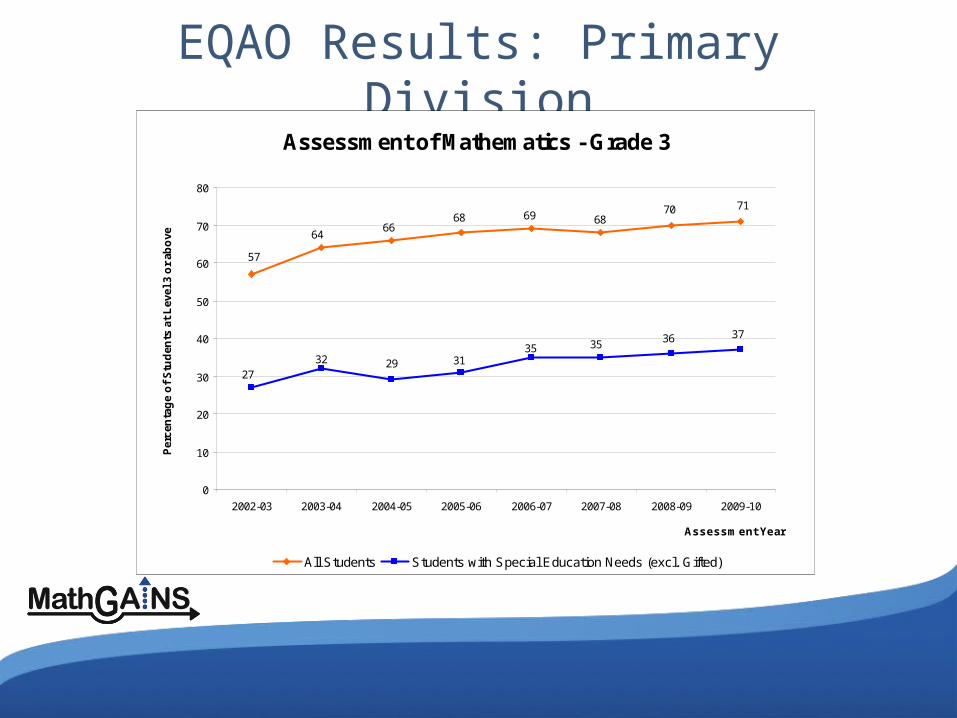
EQAO Results: Primary DivisionAssessment of Mathematics - Grade 3
57
6466
68 69 6870 71
2732 29 31
35 35 36 37
0
10
20
30
40
50
60
70
80
2002-03 2003-04 2004-05 2005-06 2006-07 2007-08 2008-09 2009-10
Assessment Year
Per
cen
tag
e o
f S
tud
ents
at
Lev
el 3
or
abo
ve
All Students Students with Special Education Needs (excl. Gifted)

EQAO Results: Primary DivisionAssessment Results for Students
with Special Education NeedsGrade 3
16
19 1821
2225 27 27
14 15 1619
20
37
40
45
27
3229
31
3535 36
37
0
5
10
15
20
25
30
35
40
45
50
2002-03 2003-04 2004-05 2005-06 2006-07 2007-08 2008-09 2009-10
Assessment Year
Per
cen
tag
e o
f S
tud
ents
at
Lev
el 3
or
abo
ve
Reading Writing Mathematics

EQAO Results: Junior DivisionAssessment of Mathematics - Grade 6
5357
60 6159
6163
61
18 2021 21 21
23 24 24
0
10
20
30
40
50
60
70
2002-03 2003-04 2004-05 2005-06 2006-07 2007-08 2008-09 2009-10
Assessment Year
Per
cen
tag
e o
f S
tud
ents
at
Lev
el 3
or
abo
ve
All Students Students with Special Education Needs (excl. Gifted)

EQAO Results: Junior DivisionAssessment Results for Students
with Special Education NeedsGrade 6
1617
19
2224 27
29
34
1211
14
17 17
28
28
31
18
2021
21 21
2324 24
0
5
10
15
20
25
30
35
2002-03 2003-04 2004-05 2005-06 2006-07 2007-08 2008-09 2009-10
Assessment Year
Per
cen
tag
e o
f S
tud
ents
at
Lev
el 3
or
abo
ve
Reading Writing Mathematics

Data Template

Visit #1 - Sept/Oct 2010Planning: What will we do?
1. Considering the Needs Assessment section of the Improvement Planning Assessment Tool, describe the process used for your board’s needs assessment?
2. How did the evidence used inform this plan? How was it used to 2. How did the evidence used inform this plan? How was it used to make the commitments / investments you have identified?make the commitments / investments you have identified?
3. How do your SMART goals represent the areas of greatest need for 3. How do your SMART goals represent the areas of greatest need for students? students?
4. How do the strategies leverage achievement of the SMART goals?5. What lessons did you learn from the monitoring process you had in
place last year? 6. Do you have questions, feedback or ideas related to the Board
Improvement Plan for Student Achievement?

Visit #2 – January, 2011Monitoring: How are we doing?
• Referring to Visit #2 questions, identify which of the 5 Core Capacities for Effective Leadership connect to the Monitoring questions provided?
• Group Share

Exploring the 5 Core Capacities of Effective Leadership
• Consider the following leadership challenge:How do I support schools in monitoring the
improvement of mathematics teaching and learning?

The Instructional Core
City, Elmore, Fiarman, Lee (2010)
Adapted by Ministry of Education, Student Achievement Division

The Seven Principles of the Instructional Core
Instructional Rounds in Education: A Network Approach to Improving Teaching and Learning
by City, Elmore, Fiarman, Lee (2010)

Seven Principles of the Instructional Core
1. Increases in student learning occur only as a consequence of improvements in the level of content, teachers’ knowledge and skill, and student engagement.
2. If you change any single element of the instructional core, you have to change the other two.
3. If you can’t see it in the core, it’s not there.
4. Task predicts performance.

Seven Principles of the Instructional Core
5. The real accountability system is the tasks that students are asked to do.
6. We learn to do the work by doing the work, not by telling other people to do the work, by having done the work sometime in the past, and not by hiring experts who can act as proxies for our knowledge about how to do the work.
7. Description before analysis, analysis before prediction, prediction before evaluation.

Key Math Messages
• Brainstorm with your partner your board’s key messages in mathematics.
• Whole group share

Mathematical Literacy Criteria
1. Focus on Important Mathematics
2. Teaching for Conceptual Understanding
3. Establishing Math Talk Learning Communities
4. Consistency and Alignment of Assessments
5. Assessment for Learning
6. Differentiating Instruction
7. Use of Manipulatives and Technologies
8. Mathematical Processes

Sharpening the Focus: 3 Instructional Nudges
1. Fearless Speaking and Listening
2. Questioning to Evoke and Expose Thinking
3. Responding to Provide Appropriate Scaffolding and Challenge

• Ensuring coherence between system planning and school improvement planning for mathematics begins with a needs assessment that takes into account school, administrator and teacher readiness and allows for differentiated entry into the cycle of planning and implementation.
PlanPlanAct Act
Observe Observe Reflect Reflect
Supporting the Instructional Core

Using the data/evidence:• examine student data and work to
identify areas of need• determine/access professional
learning in order to address areas of need and to differentiate to reach all
• co-plan, co-teach, co-assess• examine student data and work to
determine impact, lessons learned, next steps for student and educator learning
STUDENT LEARNING
TEACHER LEARNING
28
Professional Learning CycleMathematics Leadership Learning Cycle
SYSTEM LEARNING

Planning Time Consider the mathematics challenge in your
district where you wish to invest some energy and exert some influence.
What do you and your district partner need to know and/or consider in order to initiate the Mathematics Leadership Planning Cycle to address this challenge?
Capture your ideas in the ‘plan’ area of the Mathematics Leadership Learning Cycle

Reflect on your Learning• Using your 5 Core Capacities of Effective
Leadership placemat, record new insights gained from this afternoon’s session. Consider:– How has my new learning shifted my thinking? – How will I implement this new learning back in my
board / school(s)?

Final Thoughts• Questions?• Comments?

Pre-Reading for Day 2
• Research Jigsaw form groups of 5 and assign one reading to each individual–CIIM (lengthy)–PRISM (multiple reports, each short)–Gap Closing (short)–LNS CIL-M (short)–CLIPS (lengthy)
• Like-Role Leadership find a like-role partner and select one article to read– LNS Monograph re:
Collaborative Teacher Inquiry
– Evaluating Networked Communities (Katz and Earl)
– Networked Learning Communities (Katz)
– LNS Monograph re: PLC
Those who would like to read the materials for tomorrow in advance are welcome to do so.