Embed Size (px)
Citation preview

Plot with R
Source: http://www.r-graph-gallery.com/

Why should you make plot in R?
You make plots by clicking!
But you DON'T like to click again!
Definitely you DON'T like to click again and again.! You want to reproduce it
Want more flexibilities with plot options
Easy integration with data analysis component
Components of a plot
Plot region
Y ax
is la
bel
sY
axis
tic
ks
X axis labelsX axis ticks
Margins
Outer Margin Areas
Plot title

1. High-level plotting functions: create a new plot on the graphics device, possibly with axes, labels, titles
plot(x,y, main = ‘My first plot’)
2. Low-level plotting functions: add more information to an existing plot: points, lines and labels
points(z, col=“dark red”)
3. Interactive graphics functions: interactively add information to, or extract information from, an existing plot
Additional: list of graphical parameters which can be manipulated to customizeyour plots
Basic group of plotting functions available in base graphics

plot(x,y, xlab = "Speed of car (miles/hr)", ylab = "Stopping distance (feet)",main = "My test plot using Car data")
Adding title, x axis label, y axis label
lab title (label) for axes
main overall title for the plot

Change font sizeTo increase the symbol size and font size and use character expansion (cex) argument
plot(x,y, xlab = "Speed of car (miles/hr)", ylab = "Stopping distance (feet)",main = "My test plot using Car data"),cex = 2, #change symbol sizecex.lab = 1.5, #you can use fractions!cex.main = 2)

Change symbolsUse pch argument to change symbols and use col to change the colors
plot(x,y, xlab = "Speed of car (miles/hr)", ylab = "Stopping distance (feet)",main = "My test plot using Car data"),cex = 2,cex.lab = 1.5,cex.main = 2,pch = 8, # change symbolcol = ‘blue’) # change color

Available pch Incomplete list of colors

Colors
colors() returns available color names in R
Continuous color ramp:rainbow(),heat.colors(),terrain.colors(),topo.colors(), cm.colors()
plot(x,y, xlab = "Speed of car (miles/hr)", ylab = "Stopping distance (feet)",main = "My test plot using Car data"),cex = 2,cex.lab = 1.5,cex.main = 2,pch = 16, # change symbolcol = rainbow(50) # change color

Add line
lty options for type = ‘l’
plot(x,y, xlab = “Test X", ylab = “Random Y",main = “My test plot"),cex = 2,cex.lab = 1.5,cex.main = 2,pch = 8,col = ‘red’)
lines(y, lty = 2, # line typelwd = 2) # line width

Xlabxlim
cex.labcol.lab
axes=FALSE
main
plot
legend
text
x-limits of the plot
x-axis label
Sam
e as
x-a
xis
Overview
color of axis labels
size of labels
do not plot axesGen
era
l axe
s se
ttin
gs
More control over axes; Create custom axis usingaxis(side, at=, labels=, pos=, lty=, col=, las=, tck=, ...)
mtext
legend(location, title, legend, ...)
text(location, "text in plot", pos, ...)
mtext(“text in margin", side, line=n, ...)

R-plots -> Graphical elements + Graphical parameters
Components of a plot
points, lines, text, polygons (filled regions)
control drawing ofgraphical elements
set using par()

Use of par() function
par() access and modify list of graphics parameters for current graphics device
examplepar(cex=‘2’, pch = ‘+’) default for all plots in current device
To save the par() settingoldpar <- par(font=2,font.axis=4)par(oldpar)
To reset par() close the current devicedev.off()
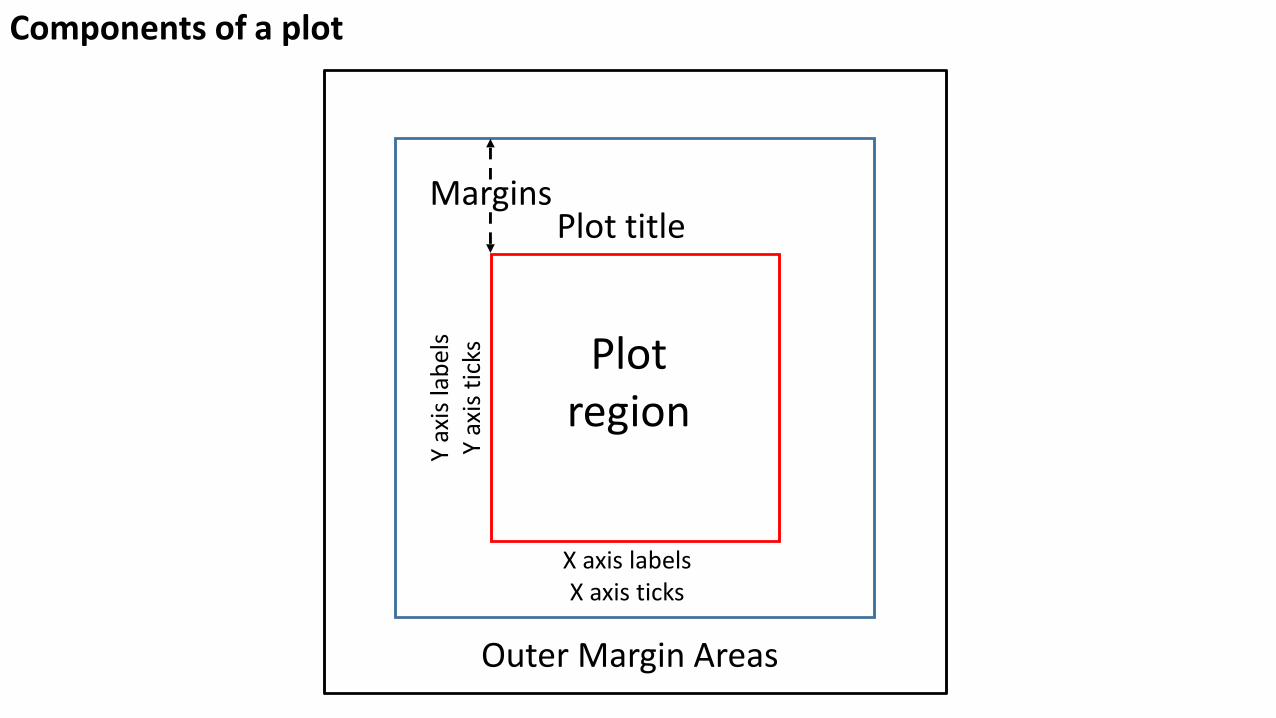
Multiple figures in same plot
Usingpar with number of rows (nr) and number of columns (nc)
> par(mfrow(nr,nc))
> par(mfrow=c(3,2))> par(mfcol=c(3,2))

Multiple figures in same plot
Using layout function
layout(matrix(c(1,2,3,4),2,2,byrow = TRUE), c(3,1), c(1,3), TRUE)
1 2
3 4

Save plots
Using following graphics driver
bmp()jpeg()tiff()png()pdf()…
Controls/arguments
filename: name of the output filewidth: width of deviceheight: height of deviceunit: unit of height and widthcompression: type of compression to be used bg: initial background colorres: resolution in ppi…

• plot.data.frame* • plot.density* • plot.factor* • plot.formula* • plot.function• plot.hclust* • plot.histogram* • plot.lm* • plot.prcomp* • plot.raster* • plot.ts
Available plot methods for R objects
For complete list use methods(plot)

Other packages for plotting in R


I’m stuck!!!Ask my friend?ask Google? You are not alone…Ask it ‘nicely and properly’!
“Help will always be given at ‘R-world’ to those who ask for it.”
http://stackoverflow.com/questions/7160565/how-to-create-a-time-scatterplot-with-r?rq=1