Embed Size (px)
Citation preview

In This Chapter
545
16
Plotting Your Drawings
After you’ve created your drawing with AutoCAD®, you
can print your designs on a sheet of paper or create an
electronic plot that is accessible from the World Wide
Web. A plotted drawing can contain a single view of
your drawing or a more complex arrangement of views.
Depending on your needs, you can plot one or more
viewports or set options that determine what is plotted
and how the image fits on the paper.
■ Understanding plotting
■ Using plot styles
■ Migrating your pen settings from previous versions of AutoCAD
■ Electronic plotting (ePlot)
■ Batch plotting
■ Using script files to plot drawings

546 | Chapter 16 Plotting Your Drawings
Understanding Plotting
In AutoCAD 2000, plotting has been significantly modernized. The follow-ing illustration shows AutoCAD Release 14 plotting components and how they translate into AutoCAD 2000 plotting components.
NOTE You can view a list of all plotting procedures online. From the Help menu, choose AutoCAD Help. Choose the Contents tab and then choose How To. Procedures for configuring plotters, working with layouts, and plotting drawings are listed under Plot Your Drawings.
The following components are new in AutoCAD 2000:
■ Layout tab: Stores an arrangement of viewports and their views, a page setup for plotting, a plot style table, and a plotter configuration. See chapter 15, “Creating a Layout to Plot.”
■ Plot style property: Controls how objects are plotted. For example, a plot style might specify that a solid-filled object is plotted with a crosshatch fill pattern. All objects and layers have a plot style. The default plot style,
PC2, PCP or ACADR14.CFG files
CTB or STB
Plot style table
DWG
Paper space layouts
PC3
Plotterconfiguration
Add-a-Plot-Style- Table wizard
Plot / Page Setup dialog boxes
Add-a-Plotter wizard / Plotter Configuration Editor
AutoCAD 2000 plottingcomponents
Creating the plotting components in AutoCAD 2000
AutoCAD Release 14 plotting components
Pen assignments
What to Plot Settings
Device configuration

Understanding Plotting | 547
NORMAL, plots objects the way they appear in the drawing. The plot style property is only available when you are working in the optional Named plot style mode. See “Using Plot Styles” on page 553.
■ Plot style table: Contains definitions for a collection of plot styles. These plot styles can be assigned to objects and layers in the associated layout. The plot style table is a file with the extension .ctb or .stb that you attach to a layout. See “Attaching Plot Style Tables to Layouts” on page 559.
■ Add-a-Plotter wizard: Adds and configures plotters. See “Setting Up Plotters and Printers” in chapter 6, of the Installation Guide.
To make the most of plotting, it is recommended that you use the following process when plotting a drawing:
■ Design your drawing in model space using the Model tab.■ Switch to a layout tab and arrange viewports and views for plotting.■ Complete the Page Setup dialog box, specifying the plot device and
settings such as paper size and orientation.■ (Optional) Using the Plot Style Table editor, create any number of new plot
styles to assign to objects to create special effects in the plotted drawing. You can create new plot style tables and add plot styles to them by choos-ing New under Plot Style Table in the Plot or Pagesetup dialog boxes.
■ (Optional) Attach a plot style table to the layout that contains a definition for each plot style you want to use. If you have pen setting information from an earlier version of AutoCAD, import those settings into AutoCAD 2000 by creating a named plot style table or a color-dependent plot style table.
■ Plot your drawing.
Understanding Layouts
Layouts simulate working on a sheet of paper with views of your drawing within the printable area of the paper. A layout tab displays what will actually be printed, reducing the need for time-consuming check plots.
Working with layouts is fully described in chapter 15, “Creating a Layout to Plot.”
The layout also stores settings for the page setup, including plot device, plot style table, print area, rotation, plot offset, paper size, and scale. You specify these settings in the Page Setup dialog box when you create the layout.

548 | Chapter 16 Plotting Your Drawings
You can save plot device, plot styles table, and page setup settings as named page setups. When you are ready to plot, you can select a named page setup to replace the current settings in the Page Setup dialog box. See “Saving and Naming a Page Setup” on page 521.
You can apply different named page setups to the same layout to achieve specific results when plotting. For example, you might create the named page setups in the following table to control scaling and paper size.
You specify a page setup for the layout only once, when you create the layout and the page setup is saved in the drawing. You don’t need to specify these settings again each time you plot. If you want to plot the same layout more than one way or if you want to specify the same output options for several layouts, use named page setups. You can plot all your layouts with a single command.
Understanding Plot Styles
If you use plot styles, you can change the way objects in your drawing look when you plot. For example, you can plot the same drawing different ways, emphasizing different elements or phases of construction in each plot. A plot style is a set of overrides for color, dithering, gray scale, pen assignments, screening, linetype, lineweight, end styles, join styles, and fill styles. You can assign a plot style to any object or layer.
To use a plot style you must do the following tasks:
■ Define the plot style in a plot style table.■ Attach the plot style table to the layout.■ Assign the plot style to an object or layer.
Sample named page setups
Page setup name Description
NoScaling - Esheet Plot at scale 1:1, E-size sheet
Scale1to2 - Csheet Plot at scale 1:2, C-size sheet
Draft - Dsheet Plot to the draft-quality plotter
Final - Dsheet Plot to the high-quality plotter
Scale-to-Fit - Asheet Scale to fit, A-size sheet
Understanding Plotting | 549
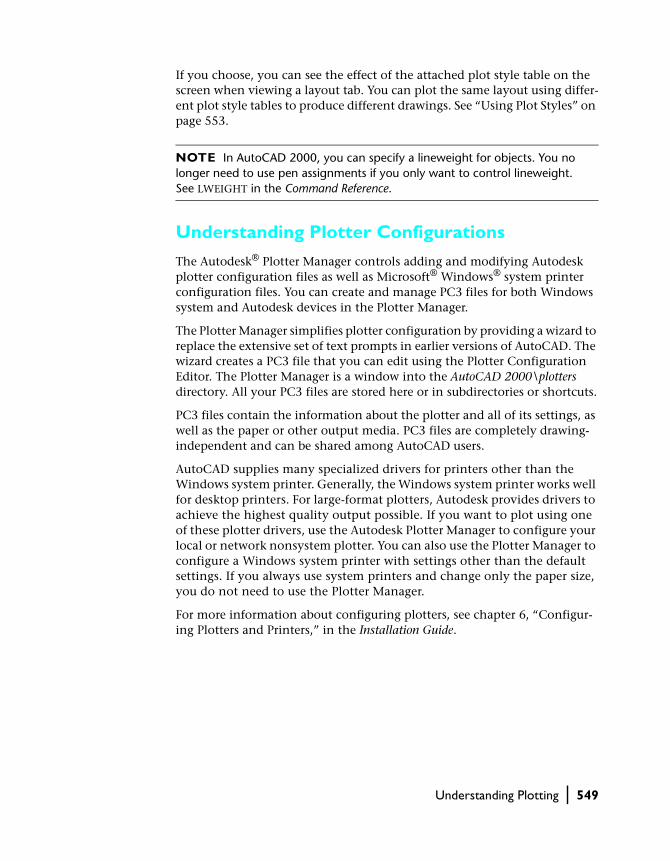
If you choose, you can see the effect of the attached plot style table on the screen when viewing a layout tab. You can plot the same layout using differ-ent plot style tables to produce different drawings. See “Using Plot Styles” on page 553.
NOTE In AutoCAD 2000, you can specify a lineweight for objects. You no longer need to use pen assignments if you only want to control lineweight. See LWEIGHT in the Command Reference.
Understanding Plotter Configurations
The Autodesk® Plotter Manager controls adding and modifying Autodesk plotter configuration files as well as Microsoft® Windows® system printer configuration files. You can create and manage PC3 files for both Windows system and Autodesk devices in the Plotter Manager.
The Plotter Manager simplifies plotter configuration by providing a wizard to replace the extensive set of text prompts in earlier versions of AutoCAD. The wizard creates a PC3 file that you can edit using the Plotter Configuration Editor. The Plotter Manager is a window into the AutoCAD 2000\plotters directory. All your PC3 files are stored here or in subdirectories or shortcuts.
PC3 files contain the information about the plotter and all of its settings, as well as the paper or other output media. PC3 files are completely drawing- independent and can be shared among AutoCAD users.
AutoCAD supplies many specialized drivers for printers other than the Windows system printer. Generally, the Windows system printer works well for desktop printers. For large-format plotters, Autodesk provides drivers to achieve the highest quality output possible. If you want to plot using one of these plotter drivers, use the Autodesk Plotter Manager to configure your local or network nonsystem plotter. You can also use the Plotter Manager to configure a Windows system printer with settings other than the default settings. If you always use system printers and change only the paper size, you do not need to use the Plotter Manager.
For more information about configuring plotters, see chapter 6, “Configur-ing Plotters and Printers,” in the Installation Guide.

550 | Chapter 16 Plotting Your Drawings
Plotting in AutoCAD 2000
You can reproduce your drawing on a variety of plotters and Windows system printers. AutoCAD uses the plotter specified on the Layout tab if you are plot-ting from a layout tab. If you are plotting from the Model tab, AutoCAD uses the plotter specified in OPTIONS to determine the default plotter. The default plotter is specified on the Plotting tab in OPTIONS. To add a new plotter, see “Setting Up Plotters and Printers” in chapter 6, “Configuring Plotters and Printers,” in the Installation Guide.
You can change the way your drawing looks when plotted by using plot styles to override object properties such as color and lineweight at plot time. See “Using Plot Styles” on page 553.
If you used pen assignments in previous versions of AutoCAD to map colors to pens for the purpose of plotting lineweights and linetypes, you can reuse those pen assignments in AutoCAD 2000. When you install AutoCAD 2000, the program searches for an acadr14.cfg file. If an acadr14.cfg file is located and it contains pen setting information, AutoCAD creates a separate plot style table file that contains the pen settings for each device. See “Migrating Your Pen Settings from Previous Versions of AutoCAD” on page 576.
Plotting a Drawing
When you create a layout, you can specify all your plot settings and save the drawing. When you are ready to plot, you can fill in the Plot dialog box in one step by selecting the saved settings from the Page Setup Name list. See “Working with Layouts” on page 517. For a detailed explanation of the options in the Plot dialog box, see PLOT.

Plotting in AutoCAD 2000 | 551
To plot a drawing
1 From the File menu, choose Plot.
In the Plot dialog box, the name of the current layout is displayed under Layout Name.
2 In the Plot dialog box, if you have created named page setups, select one in the Page Setup Name list.
The settings in the Plot dialog box are replaced by the named page setup. See “Working with Layouts” on page 517.
3 On the Plot Device tab, under Plot Style Table (Pen Assignments) verify that the correct plot style table is attached.
If you are plotting a drawing created in a previous version of AutoCAD and you want to use the pen assignments from the last time you plotted in AutoCAD Release 14, make sure that Default R14 pen assignments.ctb is spec-ified as the plot style table file. If you don’t have that plot style table in your list, AutoCAD was not able to locate an acadr14.cfg file with unique pen settings.
552 | Chapter 16 Plotting Your Drawings
You can create a plot style table that contains your pen mappings if you have an acadr14.cfg file or a PCP or PC2 file. See “Migrating Your Pen Settings from Previous Versions of AutoCAD” on page 576.
4 Choose OK.
Command line PLOT
Shortcut menu Right-click the Model tab or a layout tab and choose Plot.
To plot on the command line instead of in a dialog box use -PLOT.
If you want to change plot settings for a single plot but don’t want to change the layout, clear the Save Changes to Layout check box. Make changes in the Plot dialog box and choose OK. See PLOT in the Command Reference.
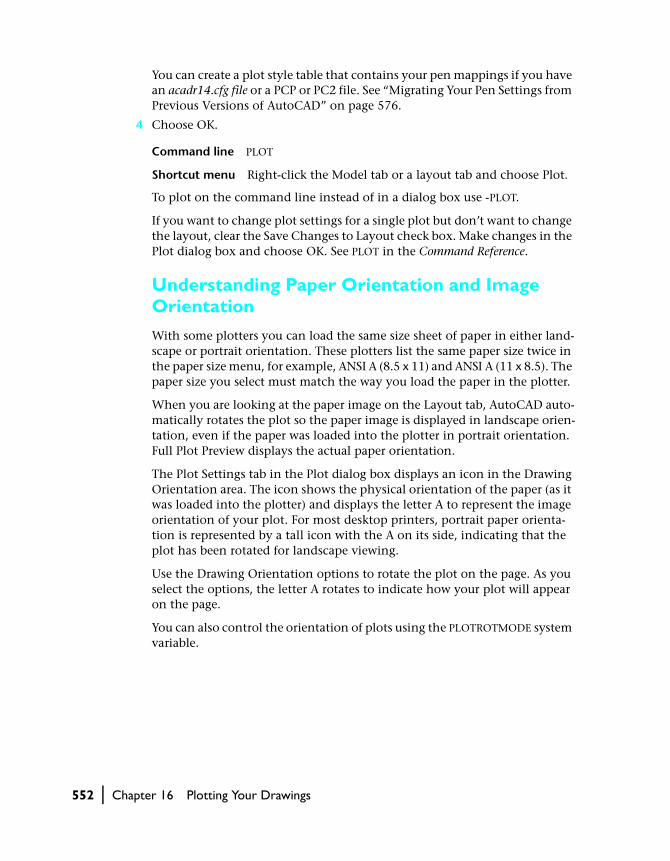
Understanding Paper Orientation and Image Orientation
With some plotters you can load the same size sheet of paper in either land-scape or portrait orientation. These plotters list the same paper size twice in the paper size menu, for example, ANSI A (8.5 x 11) and ANSI A (11 x 8.5). The paper size you select must match the way you load the paper in the plotter.
When you are looking at the paper image on the Layout tab, AutoCAD auto-matically rotates the plot so the paper image is displayed in landscape orien-tation, even if the paper was loaded into the plotter in portrait orientation. Full Plot Preview displays the actual paper orientation.
The Plot Settings tab in the Plot dialog box displays an icon in the Drawing Orientation area. The icon shows the physical orientation of the paper (as it was loaded into the plotter) and displays the letter A to represent the image orientation of your plot. For most desktop printers, portrait paper orienta-tion is represented by a tall icon with the A on its side, indicating that the plot has been rotated for landscape viewing.
Use the Drawing Orientation options to rotate the plot on the page. As you select the options, the letter A rotates to indicate how your plot will appear on the page.
You can also control the orientation of plots using the PLOTROTMODE system variable.

Using Plot Styles | 553
Using Plot StylesAutoCAD 2000 provides a new object property called plot style that can change the way a plotted drawing looks. By modifying an object’s plot style, you can override that object’s color, linetype, and lineweight. You can also specify end, join, and fill styles as well as output effects such as dithering, gray scale, pen assignment, and screening. You can use plot styles if you need to plot the same drawing in different ways.
Every object and layer has a plot style property. The actual characteristics of plot styles are defined in plot style tables that you can attach to the Model tab, and layouts within layouts. If you assign a plot style to an object, and then detach or delete the plot style table that defines that plot style, the plot style will have no effect on the object. By attaching different plot style tables to layouts, you can create different looks for your plots.
Understanding Plot Style ModesThere are two plot style modes: Color-Dependent and Named. Each draw-ing you open in AutoCAD 2000 is in either one mode or the other. You can change the mode for new drawings and for drawings created in earlier versions of AutoCAD that haven’t been saved in AutoCAD 2000 yet. The plot style mode setting is available on the Plotting tab in OPTIONS.
To change the plot style mode
1 From the Tools menu, choose Options.

554 | Chapter 16 Plotting Your Drawings
2 Under Default Plot Style Behavior for New Drawings, specify the plot style mode you want to use by choosing one of the following options:
■ Use Color Dependent Plot Styles■ Use Named Plot Styles
3 Choose OK.
To see the effect of this change, you must start a new drawing or open a draw-ing that has not yet been saved in AutoCAD 2000. This change does not affect the current drawing.
Understanding Color-dependent Plot Style ModeColor-dependent plot styles are based on object color. There are 255 color-dependent plot styles. In a color-dependent plot style table, you cannot add, delete, or rename color-dependent plot styles. You can control the way all objects of the same color plot in color-dependent mode by adjusting the plot style that corresponds to that object color. In color-dependent model, you can change the plot style that is used for an object by changing the ob-ject’s color. See “Editing Plot Styles” on page 562. Color-dependent plot style tables are stored in files with the extension .ctb.
If you used pen assignments in earlier releases of AutoCAD, you were using object color to control pen number, linetype, and lineweight.
Using object color in this way limited your use of color in drawings. By asso-ciating color with a specific pen, you lost the flexibility to work with color independent of lineweight and linetypes. By default, AutoCAD 2000 contin-ues to use object color to control output effects by creating color-dependent plot style tables. A wizard for importing pen settings is available in the Plot and Pagesetup dialog boxes.
lineweight controlled by object color
Using Plot Styles | 555
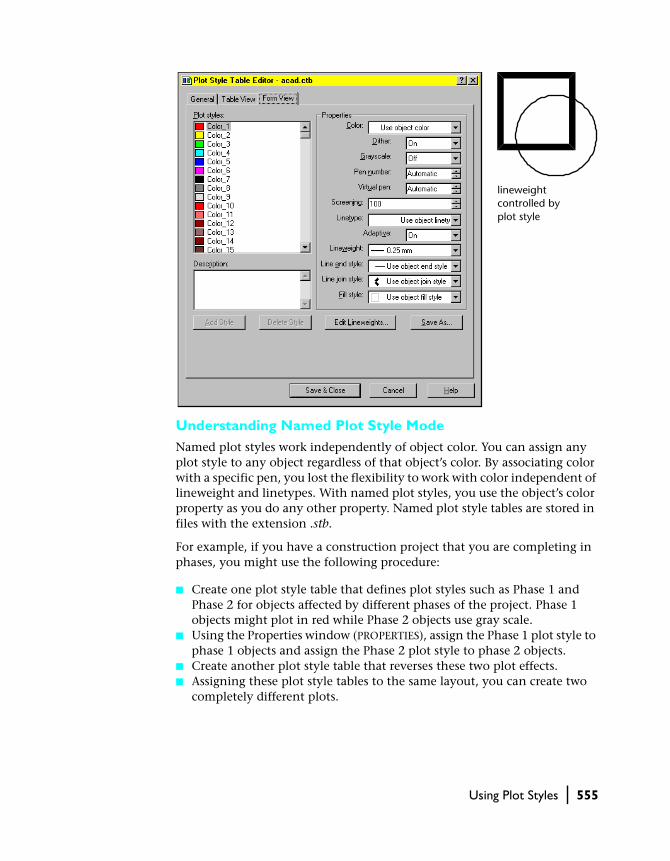
Understanding Named Plot Style ModeNamed plot styles work independently of object color. You can assign any plot style to any object regardless of that object’s color. By associating color with a specific pen, you lost the flexibility to work with color independent of lineweight and linetypes. With named plot styles, you use the object’s color property as you do any other property. Named plot style tables are stored in files with the extension .stb.
For example, if you have a construction project that you are completing in phases, you might use the following procedure:
■ Create one plot style table that defines plot styles such as Phase 1 and Phase 2 for objects affected by different phases of the project. Phase 1 objects might plot in red while Phase 2 objects use gray scale.
■ Using the Properties window (PROPERTIES), assign the Phase 1 plot style to phase 1 objects and assign the Phase 2 plot style to phase 2 objects.
■ Create another plot style table that reverses these two plot effects. ■ Assigning these plot style tables to the same layout, you can create two
completely different plots.
lineweight controlled by plot style

556 | Chapter 16 Plotting Your Drawings
Displaying Plot Styles in a DrawingWhen you use plot styles, you have the option to display the changes to object properties in the layout when you regenerate the drawing. You don’t have to plot the drawing to see the results. Displaying plot styles can slow performance. If you choose not to display plot styles in the drawing, you can view them using the Full Preview option in the Plot dialog box.
To display plot styles in a drawing
1 Choose the layout tab where you want to view plot styles.
2 From the File menu, choose Page Setup.
3 On the Plot Device tab, under Plot Style Table (Pen Assignments), select Display Plot Styles.
4 Choose OK.
NOTE In some cases, you may have to use REGENALL to display plot styles in a layout.
Using Plot Styles | 557
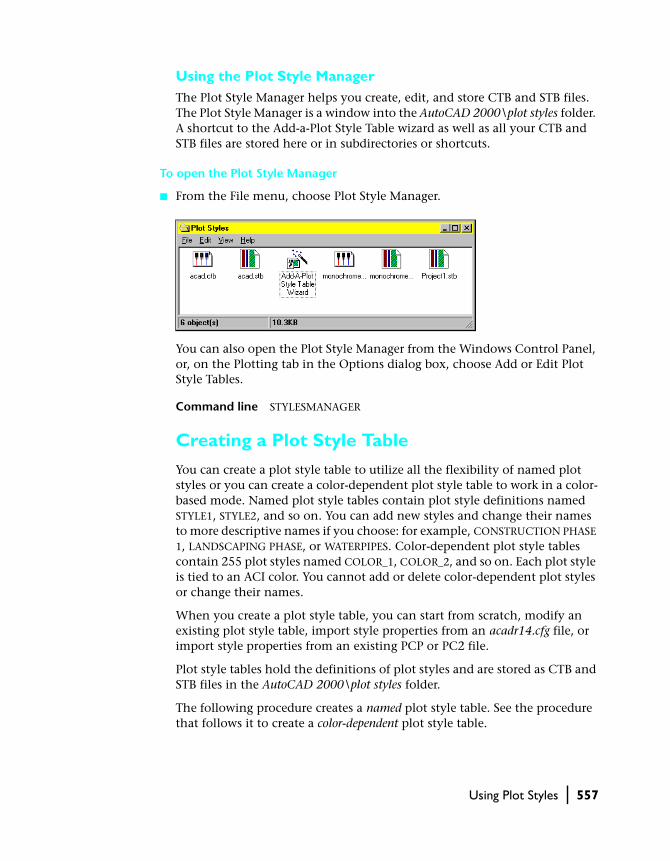
Using the Plot Style ManagerThe Plot Style Manager helps you create, edit, and store CTB and STB files. The Plot Style Manager is a window into the AutoCAD 2000\plot styles folder. A shortcut to the Add-a-Plot Style Table wizard as well as all your CTB and STB files are stored here or in subdirectories or shortcuts.
To open the Plot Style Manager
■ From the File menu, choose Plot Style Manager.
You can also open the Plot Style Manager from the Windows Control Panel, or, on the Plotting tab in the Options dialog box, choose Add or Edit Plot Style Tables.
Command line STYLESMANAGER
Creating a Plot Style Table
You can create a plot style table to utilize all the flexibility of named plot styles or you can create a color-dependent plot style table to work in a color-based mode. Named plot style tables contain plot style definitions named STYLE1, STYLE2, and so on. You can add new styles and change their names to more descriptive names if you choose: for example, CONSTRUCTION PHASE 1, LANDSCAPING PHASE, or WATERPIPES. Color-dependent plot style tables contain 255 plot styles named COLOR_1, COLOR_2, and so on. Each plot style is tied to an ACI color. You cannot add or delete color-dependent plot styles or change their names.
When you create a plot style table, you can start from scratch, modify an existing plot style table, import style properties from an acadr14.cfg file, or import style properties from an existing PCP or PC2 file.
Plot style tables hold the definitions of plot styles and are stored as CTB and STB files in the AutoCAD 2000\plot styles folder.
The following procedure creates a named plot style table. See the procedure that follows it to create a color-dependent plot style table.
558 | Chapter 16 Plotting Your Drawings
To create a named plot style table
1 From the Tools menu, choose Wizards ➤ Add Plot Style Table.
2 In the Add Plot Style Table wizard, read the introductory text. Choose Next.
3 On the Begin page, choose one of the following options, and then choose Next.
■ Start from Scratch: Creates a new plot style table.■ Use an Existing Plot Style Table: Creates a new named plot style table using
an existing named plot style table as a starting point. The new plot style table includes the styles from the original plot style table.
■ Use My AutoCAD Release 14 Plotter Configuration: Creates a new plot style table using the pen assignments stored in the acadr14.cfg file. Choose this option if you want to import settings but don’t have a PCP or PC2 file.
■ Use a PCP or PC2 File: Creates a new plot style table using pen assignments stored in a PCP or PC2 file.
4 On the Pick Plot Style Table page, select Named Plot Style Table. Choose Next.
5 If you are importing information from a CFG, PCP, or PC2 file, on the Browse File Name page, specify the full path for the file you want to use or choose Browse to locate the file.
If you are importing information from a CFG file, you must also specify the plotter whose settings you want to use. The CFG file may contain informa-tion for more than one plotter.
6 On the File Name page, enter a name for the plot style table, and then choose Next.
7 On the Finish page, if you want to attach this plot style table by default to all new drawings and pre-AutoCAD 2000 drawings, select Use This Plot Style Table for Layouts in New Drawings.
Clear this option if you don’t want to attach this plot style table to new drawings and pre-AutoCAD 2000 drawings by default.
8 Choose Finish to create a named plot style table and exit the wizard.
The resulting STB file is listed in the Plot Style Manager. Depending on the option you specified in step 3, the plot style table either contains the default style, NORMAL, or a number of styles from an existing plot style table or acadr14.cfg, PCP, or PC2 file.
To create a color-dependent plot style table
1 From the Tools menu, choose Wizards ➤ Add Plot Style Table.
2 In the Add Plot Style Table wizard, read the introductory text. Choose Next.

Using Plot Styles | 559
3 On the Begin page, choose one of the following options, and then choose Next.
■ Start from Scratch: Creates a new plot style table.■ Use My AutoCAD Release 14 Plotter Configuration: Creates a new plot style
table using the pen assignments stored in the acadr14.cfg file. Choose this option if you want to import settings but don’t have a PCP or PC2 file.
■ Use a PCP or PC2 File: Creates a new plot style table using pen assignments stored in a PCP or PC2 file.
4 On the Pick Plot Style Table page, select Color-Dependent Plot Style Table. Then choose Next.
5 If you are importing information from a CFG, PCP, or PC2 file, on the Browse File Name page, specify the full path for the file you want to use or choose Browse to locate the file.
If you are importing information from a CFG file, you must also specify the plotter whose settings you want to use. The CFG file may contain informa-tion for more than one plotter.
6 On the File Name page, specify a name for the plot style table. Choose Next.
7 On the Finish page, if you want to attach this plot style table by default to all new drawings and pre-AutoCAD 2000 drawings, select Use This Plot Style Table for Layouts in New Drawings.
Clear this option if you don’t want to attach this plot style table to new draw-ings and pre-AutoCAD 2000 drawings by default.
8 Choose Finish to create a color-dependent plot style table and exit the wizard.
The resulting CTB file is listed in the Plot Style Manager. The plot style table contains 255 styles, one for each AutoCAD color. You cannot add, delete, or rename styles in a color-dependent plot style table.
Attaching Plot Style Tables to Layouts
Plot styles are defined in plot style tables attached to the Model tab or to lay-outs. You attach a plot style table to a layout using the Page Setup dialog box.
If you insert an xref into your current drawing, all defined plot style tables are also inserted. You can modify the appearance of your objects by editing the attached plot style tables with the Plot Style Table Editor.

560 | Chapter 16 Plotting Your Drawings
To attach a plot style table to the Model tab or a layout
1 Choose the Model tab or the layout tab to which you want to attach the plot style table.
2 From the File menu, choose Page Setup.
3 In the Page Setup dialog box, choose Plot Device to display the Plot Device tab if it is not already displayed.
4 Under Plot Styles, select a plot style table from the list.
5 Choose OK.
Adding and Deleting Plot Styles in a Named Plot Style Table
If you want to create your own plot styles to apply to objects at plot time, you must add them to a plot style table using the Plot Style Table Editor. Because a color-dependent plot style table contains 255 plot styles that are mapped to 255 colors, you cannot add new plot styles to a color-dependent plot style table. Similarly, you can delete plot styles from a named plot style table, but you cannot delete them from a color-dependent plot style table.
To add a plot style to a named plot style table
1 From the File menu, choose Plot Style Manager.
2 To display the Plot Style Table Editor, use one of the following methods:
■ Right-click an STB file and choose Open.■ Double-click an STB file.■ In the Plot or Pagesetup dialog boxes, under Plot Style Table, select a plot
style table and choose Edit.■ In the Current Plot Style Table or Select Plot Style Table dialog boxes,
under Active Plot Style Table, select a plot style table and choose Editor.
3 In the Plot Style Table Editor, choose Table View or Form View to view style settings.

Using Plot Styles | 561
4 Choose Add Style.
5 To name the style, add a description, and change settings, see “Editing Plot Styles” on page 562.
To delete a plot style in a named plot style table
1 From the File menu, choose Plot Style Manager.
2 Double-click the STB file you want to edit.
3 Select the plot style you want to delete.
In the Table View, click the gray area above the plot style name. In the Form View, select the style name.
4 Choose Delete Style.
562 | Chapter 16 Plotting Your Drawings
Editing Plot Styles
You can modify the plot styles in the plot style table attached to the Model tab or layout. Changes you make to a plot style affect the objects to which that plot style is assigned.
You can add, delete, copy, paste, and modify plot styles in a plot style table by using the Plot Style Table Editor. You can open more than one instance of the Plot Style Table Editor at a time. In the Table View you can copy and paste plot styles between plot style tables. Open the Plot Style Table Editor using any of the following methods:
■ Right-click a CTB or STB file in the Plot Style Manager and then choose Open from the shortcut menu.
■ Choose Plot Style Table Editor from the Finish screen in the Add Plot Style Table wizard.
■ In the Page Setup dialog box, select the Plot Device tab. Under Plot Styles, select the plot style table you want to edit from the Plot Style Table list. Choose Editor.
■ In the Select Plot Style dialog box or Current Plot Style dialog box, choose Editor.
■ On the Plot Device tab of the Plot dialog box or Page Setup dialog box, choose Edit.
■ In the Options dialog box, choose Add or Edit Plot Style Tables.
The Plot Style Table Editor displays the plot styles contained in the specified plot style table. The editor has three tabs: General, Table View, and Form View. The General tab lists the plot style table, description, version number, and location (path name). You can modify the description, and you can apply scaling to non-ISO lines and to fill patterns.
The Table View and Form View tabs provide two ways to modify plot style settings. Both tabs list all of the plot styles in the plot style table and their settings. In general, the Table View tab is convenient if you have a small number of plot styles. If you have a large number of plot styles, the Form View tab might be more convenient. You can modify plot style color, screen-ing, linetype, lineweight, and other settings. On the Table View tab, Plot styles are displayed in columns from left to right. The setting names for each row appear at the left of the tab. On the Form View tab, plot style names are listed under Plot Styles and the settings for the selected plot style are dis-played at the right side of the dialog box. The first plot style in a named plot style table is NORMAL and represents an object’s default properties (no plot style applied). You cannot modify or delete the NORMAL style.

Using Plot Styles | 563
Copying a Plot Style or Plot Style Setting to Another Plot Style TableIf you are using the Table View tab, you can copy one or more settings from a plot style into a plot style that in another plot style table.
To copy plot style settings from one plot style table to another
1 From the File menu, choose Plot Style Manager.
2 Open the plot style table you want to copy from by double-clicking the CTB or STB file.
3 Open the plot style table you want to copy to by double-clicking the CTB or STB file.
4 In the plot style table you want to copy from, choose the Table View tab.
5 Select the plot style setting you want to copy or select all the settings in a plot style by clicking the gray area above the plot style name.

564 | Chapter 16 Plotting Your Drawings
6 Right-click and choose Copy.
7 Switch to the other plot style table and select the plot style setting you want to replace or click the gray area above the plot style name to replace all the settings.
8 Right-click and choose Paste, or choose Paste to All Styles to replace a single setting in every plot style in the table.
To copy a plot style from one table to another
■ Drag the selected plot style to the other plot style table and drop it.
Changing a Plot Style Table DescriptionYou can create a description for the plot style table.
To modify a plot style table description
1 From the File menu, choose Plot Style Manager.
2 Right-click a CTB or STB file and choose Open from the shortcut menu.

Using Plot Styles | 565
3 In the Plot Style Table Editor, choose the General tab and change the description.
4 Choose Save and Close.
Globally Scaling Non-ISO Linetypes and Fill PatternsYou can apply a global scale factor to non-ISO linetypes and fill patterns in plot styles.
To apply scaling to non-ISO linetypes and fill patterns
1 From the File menu, choose Plot Style Manager.
2 Right-click a CTB or STB file and choose Open from the shortcut menu.
3 To scale all the non-ISO linetypes and fill patterns in the plot styles defined by this plot style table, select Apply Global Scale Factor to Non-ISO Linetypes and Fill Patterns.
4 In the Scale Factor box, enter a scale factor to apply.
5 Choose Save & Close.
Deleting the AutoCAD Release 14 Color Mapping TableNamed plot style tables that you create using acadr14.cfg, PCP, or PC2 files contain plot styles that are created from your AutoCAD Release 14 pen mappings. Color-dependent plot style tables also have color mapping tables. AutoCAD uses color mapping tables to map plot styles to colors and thus to objects of each color when opening pre-AutoCAD 2000 drawings. While the color mapping table exists, you cannot add, delete, or rename plot styles in that plot style table.
WARNING! If you delete a color mapping table, AutoCAD cannot automati-cally assign plot styles to objects when pre-AutoCAD 2000 drawings are opened for the first time.
If you delete the mapping table, the plot style table becomes an ordinary plot style table and is no longer useful for applying plot styles to old drawings. It continues to be useful for new drawings.
Changing a Plot Style Name and DescriptionYou can change the names of plot styles in named plot style tables. Plot style names in color-dependent plot style tables are tied to object color and can-not be changed. AutoCAD accepts up to 255 characters for style names. You cannot duplicate names within the same plot style table. You can provide a description for each plot style.

566 | Chapter 16 Plotting Your Drawings
To change the plot style name or description
1 From the File menu, choose Plot Style Manager.
2 Right-click a CTB or STB file and choose Open from the shortcut menu.
3 Select the plot style name or description you want to change.
4 Enter a new name or description.
Assigning Plot Style ColorThe default setting for plot style color is Use Object Color. If you assign a plot style color, the color overrides the object’s color at plot time.
To assign the plot style color
1 From the File menu, choose Plot Style Manager.
2 Right-click a CTB or STB file and choose Open from the shortcut menu.
3 Select Color for the plot style you want to change.
The list of standard colors is displayed. You can choose Other to display the Select Color dialog box.
4 Select a color and choose OK.
Enabling DitheringA plotter uses dithering to approximate colors with dot patterns, giving the impression of plotting with more colors than the ink available in the plotter. If the plotter does not support dithering, the dithering setting is ignored. The most common reason for turning off dithering is to avoid false line typing from dithering of thin vectors and to make dim colors more visible. When you turn off dithering, AutoCAD maps colors to the nearest color, which limits the range of colors used for plotting. Dithering is available whether you use the object’s color or assign a plot style color.
To enable dithering
1 From the File menu, choose Plot Style Manager.
2 Right-click a CTB or STB file and choose Open from the shortcut menu.
3 Select Enable Dithering for the plot style you want to change.
To turn off dithering, clear Enable Dithering.
Converting to Gray ScaleWhen you select Convert to Grayscale, AutoCAD converts the object’s colors to gray scale if the plotter supports gray scale. If you clear Convert to Gray-scale, AutoCAD uses the RGB values for object’s colors. Dithering is available whether you use the object’s color or assign a plot style color.

Using Plot Styles | 567
To convert to gray scale
1 From the File menu, choose Plot Style Manager.
2 Right-click a CTB or STB file and choose Open from the shortcut menu.
3 Select Convert to Grayscale for the plot style you want to change.
To plot the object’s color, clear Convert to Grayscale.
Assigning Pen NumbersPC3 files describe the set of pens physically in the plotter, but they don’t assign pens to plot styles. The Use Assigned Pen Number setting in the Plot Style Table Editor specifies which pen to use for each plot style. For example, when you specify pen information in the Plotter Configuration Editor, you might specify that pen #1 is black and .010 inches and pen #2 is red and .020 inches. In the Plot Style Table Editor you can assign Pen #1 to the plot style called WATER PIPES and Pen #2 to the plot style called SEWER PIPES.
You can specify a pen to use in the plot style by selecting from a range of pen numbers from 1 to 32 in the Use Assigned Pen Number field. The default value is 1. If plot style color is set to Use Object Color, or you are editing a plot style in a color-dependent plot style table, you cannot change the assigned pen number.
If you specify 0, the field updates to read Automatic. AutoCAD uses the information you provided under Physical Pen Characteristics in the Plotter Configuration Editor to select the pen closest in color to the object you are plotting.
NOTE If you are using a pen plotter, you must provide information about the color, speed, and width of each pen in the Physical Pen Configuration section of the Plotter Configuration Editor. For more information about using the Plotter Configuration Editor, see “Editing Your Plotter Configuration Files” in chapter 6, “Plotting Your Drawings,” in the Installation Guide.
To specify a pen number
1 From the File menu, choose Plot Style Manager.
2 Right-click a CTB or STB file and choose Open from the shortcut menu.
3 In the Use Assigned Pen Number field for the plot style you want to change, enter a pen number between 1 and 32. To specify that AutoCAD should select the pen closest in color to the color of the object you are plotting, enter 0 or Automatic.

568 | Chapter 16 Plotting Your Drawings
Using Virtual PensMany plotters that do not use pens are capable of simulating the performance of a pen plotter by using virtual pens. For many devices you can program the pen’s width, fill pattern, end style, join style, and color/screening by using the front panel on the plotter.
You can specify a virtual pen number between 1 and 255. Enter 0 or Auto-matic to specify that AutoCAD should make the virtual pen assignment from the AutoCAD Color Index.
The virtual pen number setting in a plot style is used only by plotters without pens and only if they are configured for virtual pens. If this is the case, all the other style settings are ignored and only the virtual pen is used. If a plotter without pens is not configured for virtual pens, then both the virtual and the physical pen information in the plot style are ignored and all the other settings are used.
You can configure your plotter for virtual pens under Vector Graphics on the Device and Document Settings tab in the PC3 Editor. Under Color Depth, select 255 Virtual Pens.
To specify a virtual pen number
1 From the File menu, choose Plot Style Manager.
2 Right-click a CTB or STB file and choose Open from the shortcut menu.
3 In the Virtual Pen Number field, enter a number between 1 and 255 or enter 0 or Automatic to have AutoCAD specify the ACI color closest to the color of the object you are plotting.
Using ScreeningYou can select a color intensity setting that determines the amount of ink AutoCAD places on paper while plotting. The valid range is 0 through 100. Selecting 0 reduces the color to white. Selecting 100 displays the color at its full intensity.
To use screening
1 From the File menu, choose Plot Style Manager.
2 Right-click a CTB or STB file and choose Open from the shortcut menu.
3 In the Screening field for the plot style you want to change, enter an intensity value between 1 and 100.
Assigning Plot Style LinetypeWhen you select the Linetype field, AutoCAD displays a list with a sample and a description of each linetype. The default setting for plot style linetype is Use Object Linetype. If you assign a plot style linetype, the plot style line-type overrides the object’s linetype at plot time.

Using Plot Styles | 569
To assign a plot style linetype
1 From the File menu, choose Plot Style Manager.
2 Right-click a CTB or STB file and choose Open from the shortcut menu.
3 Click the Linetype field for the plot style you want to change.
The list of available linetypes is displayed.
4 Select a linetype.
Completing Linetype PatternsThe Adaptive Adjustment setting adjusts the scale of the linetype to complete the linetype pattern. If you don’t select Adaptive Adjustment, the line might end in the middle of a pattern. Turn off Adaptive Adjustment if linetype scale is important. Turn on Adaptive Adjustment if it is more important to have complete linetype patterns than correct linetype scaling.
To use adaptive adjustment
1 From the File menu, choose Plot Style Manager.
2 Right-click a CTB or STB file and choose Open from the shortcut menu.
3 Select Adaptive Adjustment for the plot style you want to change.
To turn off the adjustment of the linetype’s scale, clear Adaptive Adjustment.
Assigning Plot Style LineweightWhen you select the Lineweight field, AutoCAD displays a sample of the lineweight as well as its numeric value. The default setting for plot style line-weight is Use Object Lineweight. If you assign a plot style lineweight, the plot style lineweight overrides the object’s lineweight at plot time. You can mod-ify an existing lineweight if the one you need is not available. For more infor-mation see “Editing Lineweights” on page 571.
To assign plot style lineweight
1 From the File menu, choose Plot Style Manager.
2 Right-click a CTB or STB file and choose Open from the shortcut menu.
3 Click the Lineweight field for the plot style you want to change.
The list of available lineweights is displayed.
4 Select a lineweight.
NOTE To view plot style lineweights, choose Lwt on the status bar.

570 | Chapter 16 Plotting Your Drawings
Assigning a Line End StyleAutoCAD provides the following line end style options: Butt, Square, Round, and Diamond. The default setting for Line End Style is Use Object End Style. If you assign a line end style, the line end style in the plot style overrides the object’s line end style at plot time.
To assign a line end style
1 From the File menu, choose Plot Style Manager.
2 Right-click a CTB or STB file and choose Open from the shortcut menu.
3 Click the Line End Style field for the plot style you want to change.
The list of available line end styles is displayed.
4 Select a line end style.
Assigning a Line Join StyleAutoCAD provides the following line join style options: Miter, Bevel, Round, and Diamond. The default setting for Line Join Style is Use Object Join Style. If you assign a line join style, the line join style in the plot style overrides the object’s line join style at plot time.
To assign a line join style
1 From the File menu, choose Plot Style Manager.
2 Right-click a CTB or STB file and choose Open from the shortcut menu.
3 Click the Line Join Style field for the plot style you want to change.
The list of available line join styles is displayed.
4 Select a line join style.
Assigning Fill StyleAutoCAD provides the following fill style options: Solid, Checkerboard, Crosshatch, Diamonds, Horizontal Bars, Slant Left, Slant Right, Square Dots, and Vertical Bar. The fill style applies to solids, plines, donuts, and 3D faces. The default setting for Fill Style is Use Object Fill Style. If you assign a fill style, the fill style in the plot style overrides the object’s fill style at plot time.
To assign a fill style
1 From the File menu, choose Plot Style Manager.
2 Right-click a CTB or STB file and choose Open from the shortcut menu.
3 Click the Fill Style field for the plot style you want to change.
The list of available fill styles is displayed.
4 Select a fill style.

Using Plot Styles | 571
Editing LineweightsThere are 28 lineweights available to apply to plot styles in plot style tables. If the lineweight you need doesn’t exist in the list of lineweights stored in the plot style table, you can edit an existing lineweight. You can’t add or delete lineweights from the list in the plot style table.
To edit a lineweight
1 Double-click the plot style table file you want to edit to open it in the Plot Style Table Editor.
2 Choose either the Table View tab or the Form View tab.
3 Choose Edit Lineweights.
4 In the Edit Lineweights dialog box, select the lineweight you want to edit in the list. A check mark in the In Use column indicates which lineweights have been assigned to plot styles in the plot style table file.
5 Edit the lineweight value using any of the following methods:
■ Press ENTER, edit the value, and then press ENTER again.■ Press F2, edit the value, and then press ENTER.■ Choose Edit Lineweight, edit the value, and then press ENTER.■ Right-click and choose Edit. Edit the value, and then press ENTER.■ Click to insert a cursor, edit the value, and then press ENTER.
NOTE If you change a lineweight value, other plot styles that use the line-weight also change.
6 Under Units for Listing, you can specify whether to display lineweights in millimeters or inches.
7 Choose Sort Lineweights to sort the list of lineweights by value.
When you edit a lineweight value, it is rounded and displayed with a preci-sion of four places past the decimal point. The precision is the same for both millimeters and inches. Lineweight values must be zero or a positive number. If you create a lineweight with a zero width, the line is plotted as thin as the plotter can create it. The maximum possible lineweight value is 100 milli-meters (approximately four inches).

572 | Chapter 16 Plotting Your Drawings
Changing the Plot Style Property for an Object or Layer
Every AutoCAD object has a plot style, which is a property like, for example, the color property. Just as every layer has a color value, every layer has a plot style property. You set the current plot style for new objects and layers using the OPTIONS command. The plot style for objects can be any of the following:
■ Normal: Uses the object’s default properties.■ BYLAYER: Uses the properties of the layer that contains the object.■ BYBLOCK: Uses the properties of the block that contains the object.■ Named_plot_style: Uses the properties you specify when you define the
plot style in a plot style table.
The default plot style setting for an object is BYLAYER. The initial plot style setting for a layer is NORMAL. When the object is plotted it retains its original properties.
As you create objects and layers, AutoCAD assigns the current plot style to them. If you insert a block, the objects come with their assigned plot styles.
If the plot style is defined in a plot style table that is assigned to a layout, or the Model tab, the plot style is applied to the object at plot time. If the plot style does not exist in the plot style table, or if there is no plot style table assigned to the layout, or Model tab, the object is plotted without change.
If you are working in Named plot style mode, you can change the plot style for an object or layer at any time. If you are working in color-dependent mode you cannot change the plot style because it is determined by the object or layer color.

Using Plot Styles | 573
To change the plot style for an object
1 From the Modify menu, choose Properties.
2 Select the object you want to change.
3 In the Properties window, select Plot Style.
4 From the list of plot styles in the plot style table, select the plot style you want to use.
Command line PROPERTIES
Shortcut menu Select the object, right-click in the drawing area, and choose Object Properties.

574 | Chapter 16 Plotting Your Drawings
To change the plot style for a layer
1 From the Object Properties toolbar, choose Layers.
2 In the Layer Properties Manager, select the layer you want to change.
3 Under Plot Style, select a plot style for the layer.
4 Choose OK.

Using Plot Styles | 575
Renaming Named Plot Styles
When you are working in Named plot style mode, you can rename a plot style by using the RENAME command. The new plot style must exist in the plot style table associated with the layout and cannot be currently assigned to any object or layer. You cannot rename color-dependent plot styles.
To rename a plot style
1 From the Format menu, choose Rename.
2 In the Named Objects list, select Plot Style.
3 In the Items list, select the name of the plot style you want to rename.
The plot style name appears in the Old Name box.
4 In the Rename To box, select a new plot style name.
The plot styles available in the Rename To box are the plot styles that exist in the plot style table but are not currently assigned to an object or layer.
5 Choose OK.
Command line RENAME

576 | Chapter 16 Plotting Your Drawings
Migrating Your Pen Settings from Previous Versions of AutoCAD
If you used the Pen Assignments dialog box in previous versions of AutoCAD to map colors to pens for the purpose of plotting lineweights and linetypes, you can reuse those pen assignments in AutoCAD 2000. If you did not use the Pen Assignments dialog box to create special plotting effects, you can plot drawings from previous versions of AutoCAD the same way you plot new drawings.
In previous versions of AutoCAD, you could choose to store pen assignment information in PCP or PC2 files. If you do not have a PCP or PC2 file with pen settings, you can obtain the settings from the AutoCAD Release 14 configuration file (acadr14.cfg). To move these settings to AutoCAD 2000, choose New under Plot Style Tables (Pen Assignments) to run a wizard that will migrate your pen settings. If you are using color-dependent plot styles, AutoCAD creates a color-dependent plot style table and attaches it to each layout in the drawing. The plot style table is saved in a file with a .ctb ex-tension. If you are using named plot styles, the wizard creates a named plot style table in a file with an .stb extension.
NOTE If you used the CCONFIG, HPCONFIG, or OCECONFIG commands to configure CalComp, Hewlett-Packard, and Océ devices, respectively, you can use the wizard to extract linetype and lineweight information from PCP, PC2, or acadr14.cfg files. The wizard cannot extract vendor-specific custom settings, such as end style, join style, fill style, and screening. To plot using these addi-tional custom settings, you must apply them using AutoCAD 2000 plot styles.
The following procedures describe two ways of moving pen assignment in-formation into AutoCAD 2000. The first method creates a color-dependent plot style table. The second method converts your pen assignment informa-tion from previous versions of AutoCAD into a named plot style table. For more information about color-dependent and named plot style tables, see “Using Plot Styles” on page 553.

Migrating Your Pen Settings from Previous Versions of AutoCAD | 577
To create a color-dependent plot style table using AutoCAD Release 14 pen settings
1 Verify that you are using color-dependent plot styles by looking at the Plotting tab in OPTIONS.
If you change this option, you need to start a new drawing for the change to take effect.
2 From the File menu, choose Plot.
3 On the Plot Device tab, in the Plot Style Table (Pen Assignments) area, choose New.
4 On the Begin page, specify whether you want to use pen settings from an acadr14.cfg file or from a PCP or PC2 file. Then choose Next.
If you don’t have a PCP or PC2 file, you can retrieve the settings from your AutoCAD Release 14 configuration file.
5 On the Browse File Name page, select the file you want to use. Then choose Open.
If you are using an AutoCAD Release 14 configuration file that contains information for more than one plotter, you must select the name of the relevant plotter from the list.
6 On the File Name page, enter a name for the plot style table (CTB file) to contain the pen setting information. Then choose Next.
7 On the Finish page, select either or both of the following options to specify how you want to apply the resulting plot style table.
■ Use This Plot Style Table for the Current Drawing: Attaches the plot style table to all the layouts in the current drawing only.
■ Use This Plot Style Table for New and Pre-AutoCAD 2000 Drawings: Attaches the plot style table to any new drawing you create as well as any pre-AutoCAD 2000 drawing you open that has not already been saved in AutoCAD 2000. You can change this setting on the Plotting tab in OPTIONS.
8 Choose Finish.
The wizard creates a plot style table containing 255 plot styles with color-based names. Color-dependent plot styles are assigned to objects automati-cally based on object color. You can modify any of the styles by opening the Plot Style Table Editor. The plot style table is stored in a CTB file that is listed in the Plot Style Manager. The file is saved in the AutoCAD 2000\plot styles directory. This table is device independent, so you can plot your drawing on any plotter.

578 | Chapter 16 Plotting Your Drawings
To import AutoCAD Release 14 pen settings into a named plot style table
1 Verify that you are using named plot styles by looking at the Plotting tab in OPTIONS.
If you change this option, you need to start a new drawing for the change to take effect.
2 From the File menu, choose Plot.
3 On the Plot Device tab, in the Plot Style Table (Pen Assignments) area, choose New.
4 On the Begin page, specify whether you want to use pen settings from an acadr14.cfg file or from a PCP or PC2 file. Then choose Next.
If you don’t have a PCP or PC2 file, you can retrieve the settings from your AutoCAD Release 14 configuration file.
5 On the Browse File Name page, specify the name and location of the CFG, PCP, or PC2 file that contains the pen settings you want to use. Then choose Next.
If you are importing information from an AutoCAD Release 14 configuration file, you must also specify the plotter that corresponds to the pen settings you want to import.
6 On the File Name page, enter a name for the plot style table (STB file) to contain the pen setting information. Then choose Next.
7 On the Finish page, select either or both of the following options:
■ Use This Plot Style Table for the Current Drawing: Attaches this plot style table to all the layouts in the current drawing only.
■ Use This Plot Style Table for New and Pre-AutoCAD 2000 Drawings: Attaches this plot style table by default to all new drawings and pre-AutoCAD 2000 drawings that have not been saved in AutoCAD 2000.
8 Choose Finish to create an STB file and close the Add Plot Style Table wizard.
The wizard creates a plot style table with up to 255 styles. You can modify any of the styles by opening the Plot Style Table Editor. The plot style table is stored in an STB file that is listed in the Plot Style Manager. The file is saved in the AutoCAD 2000\plot styles directory. This table is device independent, so you can plot your drawing on any plotter.
A named plot style table created using color mapping information from CFG, PCP, or PC2 files has an associated color mapping table that AutoCAD uses to assign named plot styles to objects when you open pre-AutoCAD 2000 drawings.
WARNING! If you delete a color mapping table, AutoCAD cannot associate the plot styles with the objects in the drawing.
Electronic Plotting (ePlot) | 579
Electronic Plotting (ePlot)
With the AutoCAD ePlot feature, you can publish electronic drawing files to the Internet. The files you create are stored in Drawing Web Format (DWF). DWF files can be opened, viewed, and plotted by anyone with an Internet browser and Autodesk’s WHIP!® 4.0 plug-in. DWF files support real-time panning and zooming as well as control over the display of layers, named views, and embedded hyperlinks.
When you configure an electronic plot (ePlot) driver, the driver’s custom dialog box is automatically displayed. You can access the Plotter Configura-tion Editor from within the ePlot driver’s custom dialog box by choosing Advanced.
For more information about electronic plotting, see “Using ePlot to Publish DWF Files” on page 822.
Batch Plotting
AutoCAD supplies a Visual Basic batch plotting utility you can use to con-struct a list of AutoCAD drawings to be plotted. You can plot the drawings immediately or save them in a batch plot (BP3) file to use later. The Batch Plot utility runs independently of AutoCAD and is available in the AutoCAD program group.
Before you use the Batch Plot utility to plot a batch of drawings, you should verify that all necessary fonts, external references, linetypes, layer properties, and layouts are available so that the drawings can be successfully loaded and viewed.
Once you’ve created a list of drawings using the Batch Plot utility, you can attach a PC3 file to each drawing. If you want to plot to more than one plot-ter, or if you want to use more than one plot configuration, you should save a PC3 file for each plot configuration you plan to use. Any drawing not attached to a PC3 file plots to the device that was the default before you started the Batch Plot utility.
For more information about the Batch Plot utility, see “Using the Batch Plot Utility” in chapter 6, “Configuring Plotters and Printers,” in the Installation Guide.

580 | Chapter 16 Plotting Your Drawings
Using Script Files
You can create script files to plot your drawings. The script files can specify a named page setup, and plot different views in a drawing. AutoCAD reads scripts from a text file that you create outside AutoCAD using a text editor or word processor. You must save the text file in ASCII format with the file extension .scr. For more information about creating script files, see chapter 6, “Programming Interfaces,” in the Customization Guide.
If you have scripts that plot your drawings from the command line, you can use the -PLOT command to continue to run these scripts. For more informa-tion about the -PLOT command line options, see “PLOT Command Line” under the PLOT command. When creating new scripts in AutoCAD 2000, you must use the new PLOT command line. You can specify any of the following variables: layout name, page setup name, output device name, and file name (if plotting to a file).