Embed Size (px)
Citation preview
Nat. Hazards Earth Syst. Sci., 12, 231–240, 2012www.nat-hazards-earth-syst-sci.net/12/231/2012/doi:10.5194/nhess-12-231-2012© Author(s) 2012. CC Attribution 3.0 License.
Natural Hazardsand Earth
System Sciences
PM-GCD – a combined IR–MW satellite technique for frequentretrieval of heavy precipitation
D. Casella1, S. Dietrich1, F. Di Paola1, M. Formenton1, A. Mugnai1, F. Porcu2, and P. Sano1
1Istituto di Scienze dell’Atmosfera e del Clima, CNR, Roma, Italy2Dipartimento di Fisica, Universita di Ferrara, Ferrara, Italy
Correspondence to:D. Casella ([email protected])
Received: 15 April 2011 – Revised: 20 October 2011 – Accepted: 31 October 2011 – Published: 31 January 2012
Abstract. Precipitation retrievals based on measurementsfrom microwave (MW) radiometers onboard low-Earth-orbit(LEO) satellites can reach high level of accuracy – espe-cially regarding convective precipitation. At the present stagethough, these observations cannot provide satisfactory cov-erage of the evolution of intense and rapid precipitating sys-tems. As a result, the obtained precipitation retrievals areoften of limited use for many important applications – espe-cially in supporting authorities for flood alerts and weatherwarnings. To tackle this problem, over the past two decadesseveral techniques have been developed combining accurateMW estimates with frequent infrared (IR) observations fromgeosynchronous (GEO) satellites, such as the European Me-teosat Second Generation (MSG). In this framework, wehave developed a new fast and simple precipitation retrievaltechnique which we call Passive Microwave – Global Con-vective Diagnostic, (PM-GCD). This method uses MW re-trievals in conjunction with the Global Convective Diagnos-tic (GCD) technique which discriminates deep convectiveclouds based on the difference between the MSG water vapor(6.2 µm) and thermal-IR (10.8 µm) channels. Specifically,MSG observations and the GCD technique are used to iden-tify deep convective areas. These areas are then calibrated us-ing MW precipitation estimates based on observations fromthe Advanced Microwave Sounding Unit (AMSU) radiome-ters onboard operational NOAA and Eumetsat satellites, andthen finally propagated in time with a simple tracking algo-rithm. In this paper, we describe the PM-GCD technique,analyzing its results for a case study that refers to a floodevent that struck the island of Sicily in southern Italy on 1–2 October 2009.
1 Introduction
It is well known that precipitation retrievals based on mea-surements from space-borne microwave (MW) radiometerscan reach a high level of accuracy for convective precipi-tation (Ebert et al., 1996; Smith et al., 1998; Kummerowet al., 2001). However, these observations are taken fromlow-Earth-orbit (LEO) satellites and therefore do not pro-vide satisfactory coverage of rapidly evolving precipitationsystems. To solve this problem, over the past two decadesseveral techniques have been developed that combine accu-rate MW-based rain rate estimates with frequent infrared (IR)observations from geosynchronous (GEO) satellites (Adler etal., 1993; Xu et al., 1999; Bellerby et al., 2000; Sorooshianet al., 2000; Turk et al., 2000; Huffman et al., 2001; Miller etal., 2001; Kuligowski, 2002; Kidd et al., 2003; Joyce et al.,2004; Turk and Miller, 2005).
In spite of the considerable number of existing MW-IR combined techniques, it is very important to developsimple, operator-oriented satellite monitoring tools in or-der to provide guidance and support to the authorities inraising flood alerts. Evidently, this becomes vital when-ever there is a lack of an adequate radar network or inthe presence of a complex orography, as in the Mediter-ranean area – see, for instance, the European Commis-sion RISKMED (http://www.riskmed.net/results.asp) andFLASH (http://flash-eu.tau.ac.il/) projects.
In this framework, we have developed a new fast and sim-ple technique that combines MW rain rate estimates and IRobservations to provide precipitation estimates from heavyconvective storms at the GEO time and space resolution.The technique can be considered as an evolution of theHigh Precipitation NAW Areas (HPNA) method (Porcu etal., 1999; Kotroni et al., 2005), which is based on the Negri-Adler-Wetzel (NAW) technique (Negri et al., 1984) to de-fine low and high precipitation areas from thermal-IR GEO
Published by Copernicus Publications on behalf of the European Geosciences Union.
232 D. Casella et al.: PM-GCD – a combined IR–MW satellite technique
observations. However, while NAW uses pre-assigned rain-rate values for the high precipitation areas (defined as the10 % coldest portion of the cloud top), HPNA uses aver-age values from corresponding MW precipitation retrievals.Then, it employs a simple tracking algorithm to follow theevolution of the high precipitating areas whose average rainrate values are kept constant until a new MW observationbecomes available.
The basic innovation of the new technique described inthis paper is that it is based on the Global Convective Di-agnostic (GCD) approach (Mosher, 2001, 2002) rather thanon the NAW method. GCD is a bispectral day and nightscheme (based on thermal infrared and water vapor chan-nels) for deep convection operational mapping of geosta-tionary satellite images. Referring to deep-convection ob-servations from the Precipitation Radar (PR) onboard theTropical Rainfall Measurement Mission (TRMM), Martin etal. (2008) noted that GCD produces more accurate resultsthan any monospectral infrared convective scheme.
Another innovation is related to the computation of therain rate within each selected area. Contrary to HPNA, PM-GCD does not assign an average estimate for the whole area,but it assigns a single value for each GEO pixel, which iscomputed by means of dynamical relationships between theMW-derived rain rates and the brightness temperature differ-ence between the water vapor and thermal-infrared channelsthat are updated every time a new MW observation becomesavailable.
PM-GCD is here described with reference to a flood-producing storm that occurred on 1–2 October 2009 in Sicilyin southern Italy – see Dietrich et al. (2011) for a detaileddescription of this case study. The MW-derived rain rates arebased on all available observations from the Advanced Mi-crowave Sounding Unit-A & -B (AMSU-A, AMSU-B) andMicrowave Humidity Sounder (MHS) radiometers onboardNOAA & MetOp operational LEO satellites. Finally, a pre-liminary evaluation of the technique has been performed bycomparing the evolving PM-GCD rain maps with the corre-sponding AMSU-based retrievals.
2 Case study
Between 30 September and 1 October 2009, a depressioncentered over Algeria developed over NW Africa, thus driv-ing a warm advection toward the central Mediterraneanbasin. In this situation, a strong southern flux formed alongthe Sicily channel and collected a large amount of moisturefrom the warm sea surface. The interaction with the EasternAtlas mountains generated gravity waves and low level con-vergence lines that trigged extensive and strong convectionover the sea. This deep convection has been confirmed by theheavy electrical activity present over the central Mediterra-nen. During 1 October, the cyclone strengthened and movedeastward provoking severe convective rainfall over Sicily.
35 people died because of a large landslide that affected thearea around Messina.
The case study considered in this paper covers the timefrom 1 October 2009, 13:01 UTC till 2 October 2009,04:14 UTC in the region 30◦ N–45◦ N latitude 0◦–30◦ E lon-gitude. During this period, the selected area was observed7 times by the AMSU radiometers onboard NOAA andMetOp satellites, and was continuously monitored every15 min by the SEVIRI radiometer on the geostationary MSGsatellite. Specifically, MSG observations were taken at min-utes 12, 27, 42 and 57 of every hour while MW obser-vations refer to the following dates and times: 1 Octo-ber 2009 (13:01, 13:05, 14:17, 15:56, and 19:51 UTC); 2 Oc-tober 2009 (01:24 and 04:12 UTC). Unfortunately, overpass3 (in italics) observed just a small fraction of the selectedarea missing the most important storm cells; thus, it has beenrejected, reducing the number of available MW observationsto 6 in 15 h and 11 min. We note here that contiguous MWand MSG observations have been considered as simultane-ous, the time difference being less than 7.5 min.
3 The PM-GCD technique
The Global Convective Diagnostic (GCD) technique wasdeveloped by Mosher (2001, 2002) in order to delineatedeep-convection areas from GEO observations. To this end,GCD computes for each GEO pixel the brightness temper-ature (TB) difference (1TB) between the water vapor (WV;6.2 µm) and the thermal-infrared (IR; 10.8 µm) channels (i.e.,1TB = T WV
B −T IRB ) and assigns deep convection when that
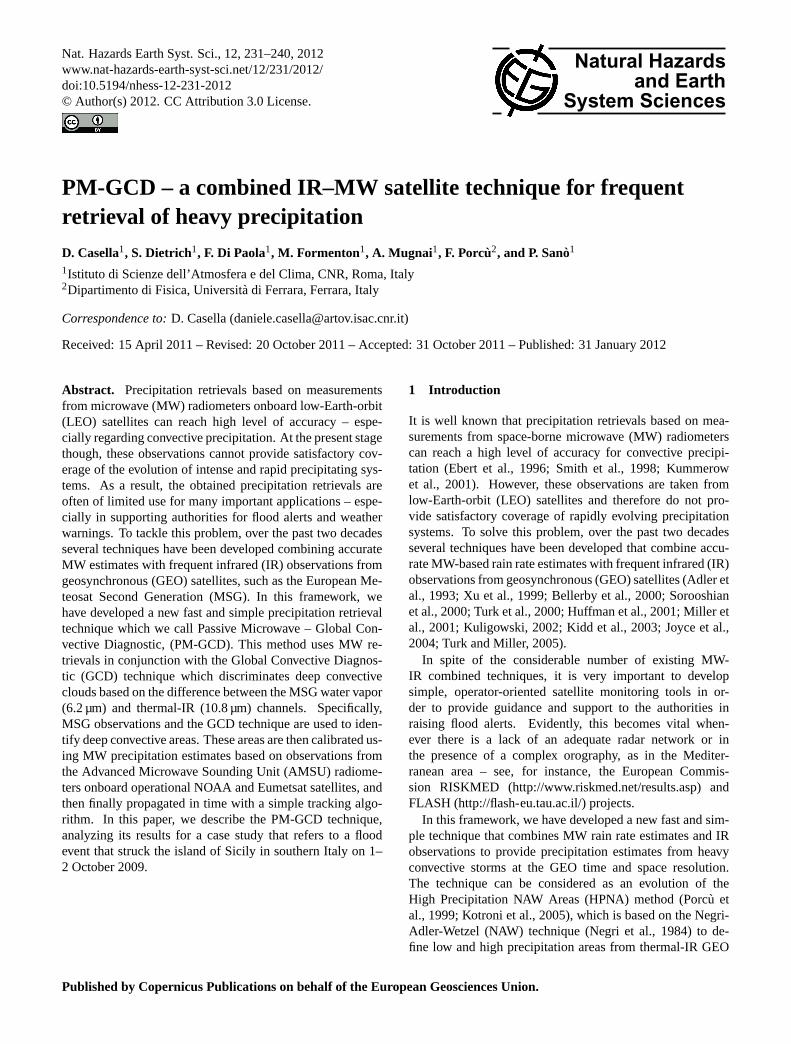
difference is higher than a given threshold (usually,−1 K).Figure 1 shows the1TB values for the adopted case study
on 2 October 2009, 01:27 UTC together with the correspond-ing lightning observations and rainfall rates from AMSU. Inthis paper, the AMSU-based instantaneous rain rates havebeen obtained by means of the neural network algorithm de-veloped by Surussavadee and Staelin (2008a, b). Lightningdata have been provided by the ground-based Lightning De-tection Network (LINET) developed at the University of Mu-nich, Germany, which is serviced and continuously operatedby Nowcast GmbH (see Betz et al., 2009).
Evidently,1TB is highly variable and appears to be some-what related to storm intensity. The regions with higher1TBvalues tend to correspond to regions with the highest flashnumber and the largest rain rates. This latter point is bet-ter visualized considering the two1TB contours (−5.5 Kand 1 K) superimposed on the rain rate map. In particular,the1TB =−5.5 K contour delineates the large precipitationarea on the Mediterranean sea southeast of Italy very well,while the 1TB = 1 K contours inside it tend to correspondwith the most active cloud portions. As noted by Thies etal. (2008), the positive1TB’s are “caused by the presence ofwater vapor in the lower stratosphere above the cloud whichis transported there by deep convection with overshootingtops”.
Nat. Hazards Earth Syst. Sci., 12, 231–240, 2012 www.nat-hazards-earth-syst-sci.net/12/231/2012/
D. Casella et al.: PM-GCD – a combined IR–MW satellite technique 233
Fig. 1. Left panel: MSG SEVIRI water vapor – thermal infrared brightness temperature difference1TB (color scale in K) for the selectedcase study on 2 October 2009, 01:27 UTC. Lightning flashes as observed from the ground-based LINET network over a 10-min periodcentered at the time of the SEVIRI observation are also shown as black crosses (+). Right panel: Instantaneous rainfall rates (color scalein mm h−1) retrieved from AMSU overpass on 2 October 2009, 01:24 UTC. As a reference,−5.5 K (pink line) and 1 K (black line)1TBcontours, as derived from the left panel, are also shown.
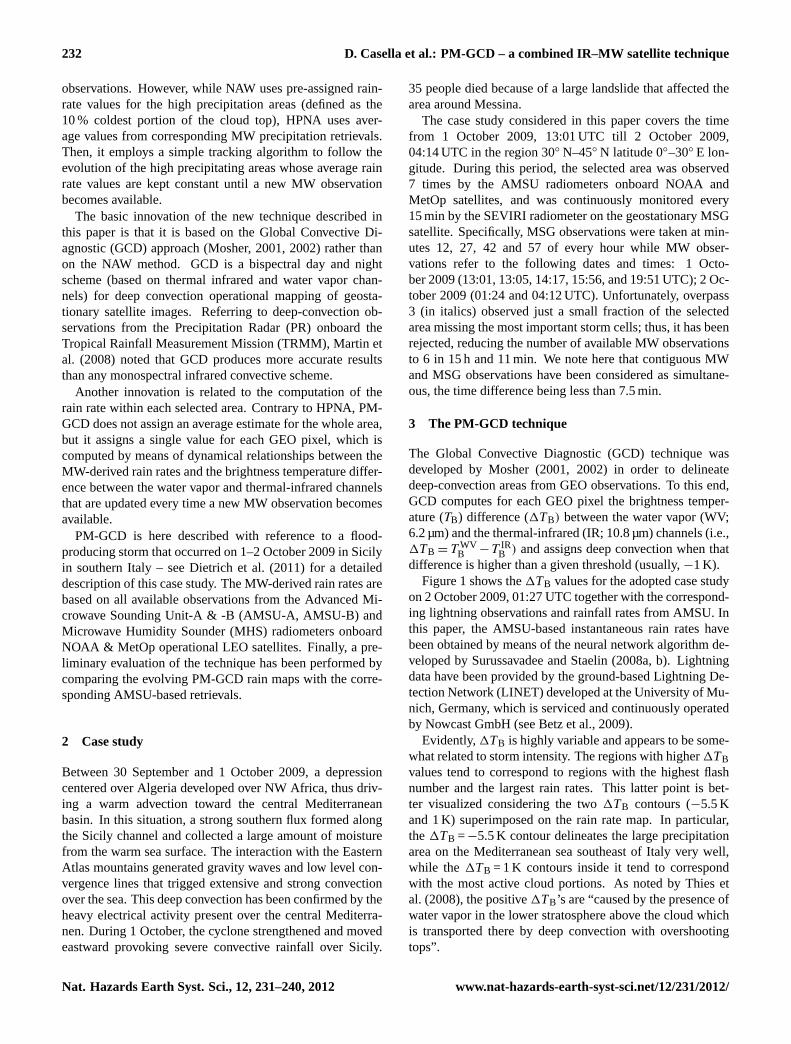
PM-GCD is an improvement of the High PrecipitationNAW Areas (HPNA) method (Porcu et al., 1999; Kotroniet. al., 2005.), which was developed in order to discrimi-nate heavy precipitation areas and assign them mean rainfallvalues. To this end, HPNA first uses thermal-IR GEO obser-vations to delineate high precipitation areas by means of thecoldest 10 % fraction of the cloud-top temperature – as in theNegri Adler Wetzel (NAW) technique (Negri et al., 1984) –and then MW observations from LEO satellites to estimatemean rainfall values within such areas. Figure 2 shows theHPNA high precipitation areas for the same case study inFig. 1. It is evident that HPNA generates several high precip-itation areas even in correspondence of low-precipitation orno-precipitation cloud portions, as detected by the MW re-trieval algorithm. In contrast, the1TB = 1 K contours shownin Fig. 1 do not exhibit any such false alarms of convec-tive cells. Specifically, HPNA high precipitation areas tendto correspond to regions of high MW-retrieved precipitationonly in the presence of cumulonimbus clouds in a maturestage, such as the two cells on the Mediterranean sea south-east of Italy. In contrast, by using the difference betweentwo Meteosat channels, the GCD technique performs betterin discriminating cumulonimbus from other kinds of cloudsand in distinguishing the various parts of a cumulonimbus asconvective cells and anvils.
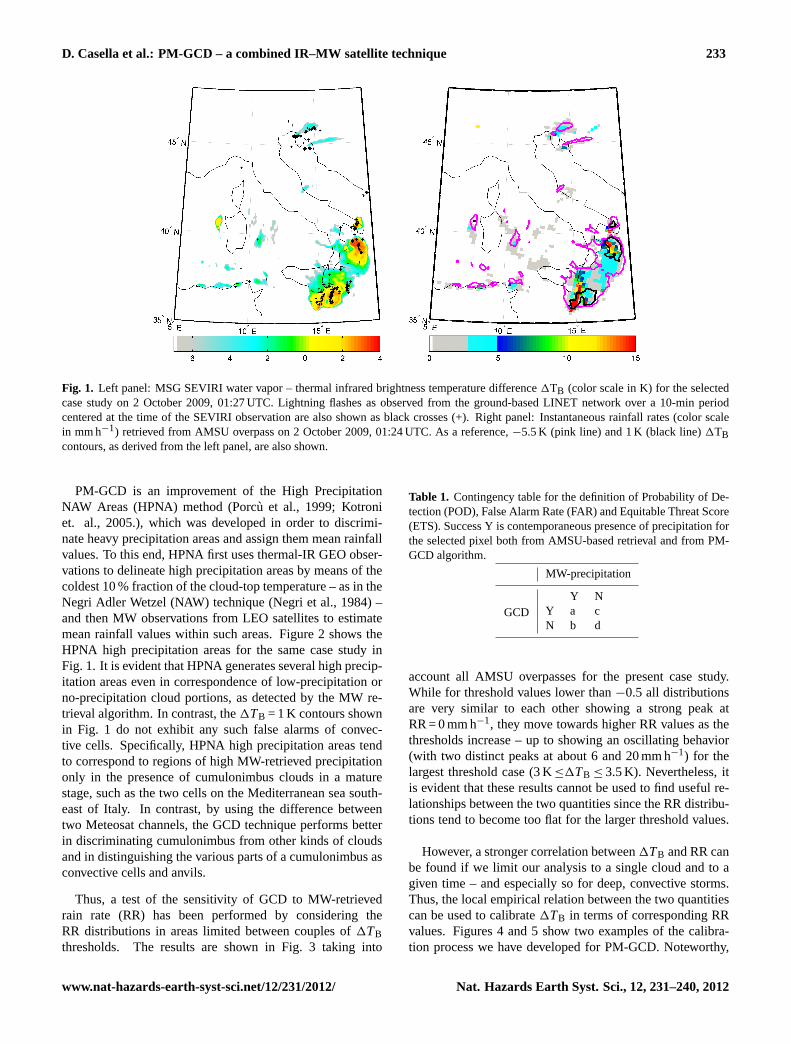
Thus, a test of the sensitivity of GCD to MW-retrievedrain rate (RR) has been performed by considering theRR distributions in areas limited between couples of1TBthresholds. The results are shown in Fig. 3 taking into
Table 1. Contingency table for the definition of Probability of De-tection (POD), False Alarm Rate (FAR) and Equitable Threat Score(ETS). Success Y is contemporaneous presence of precipitation forthe selected pixel both from AMSU-based retrieval and from PM-GCD algorithm.
MW-precipitation
GCDY N
Y a cN b d
account all AMSU overpasses for the present case study.While for threshold values lower than−0.5 all distributionsare very similar to each other showing a strong peak atRR = 0 mm h−1, they move towards higher RR values as thethresholds increase – up to showing an oscillating behavior(with two distinct peaks at about 6 and 20 mm h−1) for thelargest threshold case (3 K≤1TB ≤ 3.5 K). Nevertheless, itis evident that these results cannot be used to find useful re-lationships between the two quantities since the RR distribu-tions tend to become too flat for the larger threshold values.
However, a stronger correlation between1TB and RR canbe found if we limit our analysis to a single cloud and to agiven time – and especially so for deep, convective storms.Thus, the local empirical relation between the two quantitiescan be used to calibrate1TB in terms of corresponding RRvalues. Figures 4 and 5 show two examples of the calibra-tion process we have developed for PM-GCD. Noteworthy,
www.nat-hazards-earth-syst-sci.net/12/231/2012/ Nat. Hazards Earth Syst. Sci., 12, 231–240, 2012
234 D. Casella et al.: PM-GCD – a combined IR–MW satellite technique
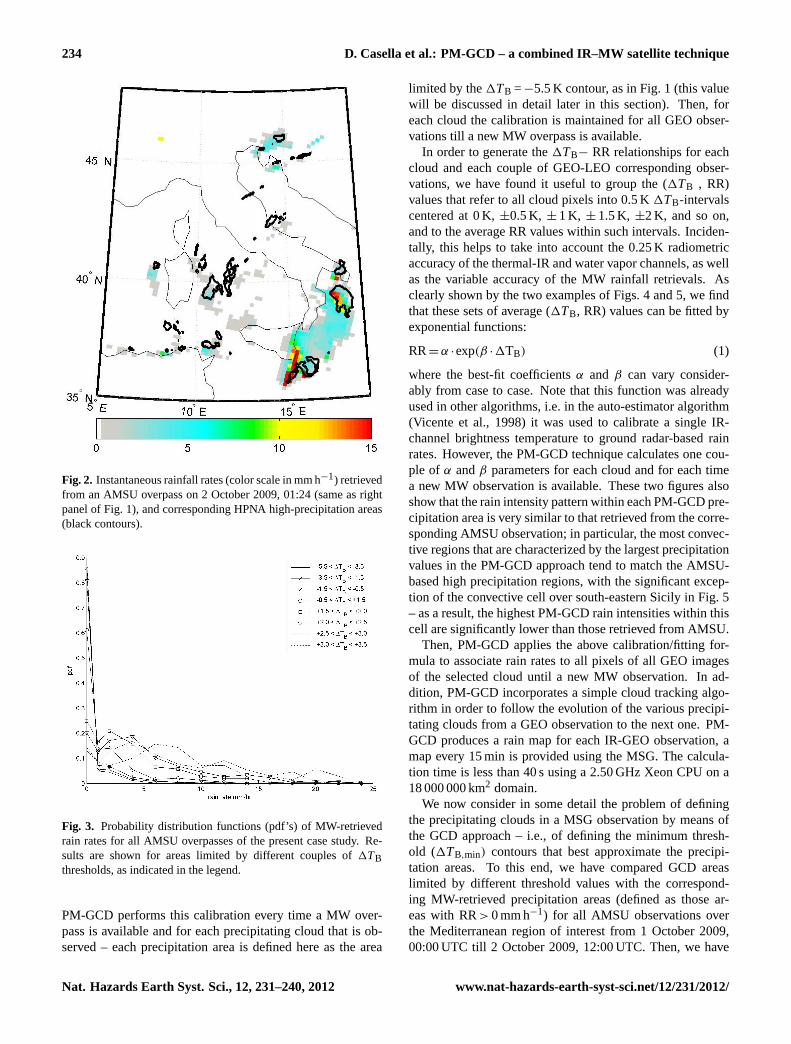
Fig. 2. Instantaneous rainfall rates (color scale in mm h−1) retrievedfrom an AMSU overpass on 2 October 2009, 01:24 (same as rightpanel of Fig. 1), and corresponding HPNA high-precipitation areas(black contours).
Fig. 3. Probability distribution functions (pdf’s) of MW-retrievedrain rates for all AMSU overpasses of the present case study. Re-sults are shown for areas limited by different couples of1TBthresholds, as indicated in the legend.
PM-GCD performs this calibration every time a MW over-pass is available and for each precipitating cloud that is ob-served – each precipitation area is defined here as the area
limited by the1TB =−5.5 K contour, as in Fig. 1 (this valuewill be discussed in detail later in this section). Then, foreach cloud the calibration is maintained for all GEO obser-vations till a new MW overpass is available.
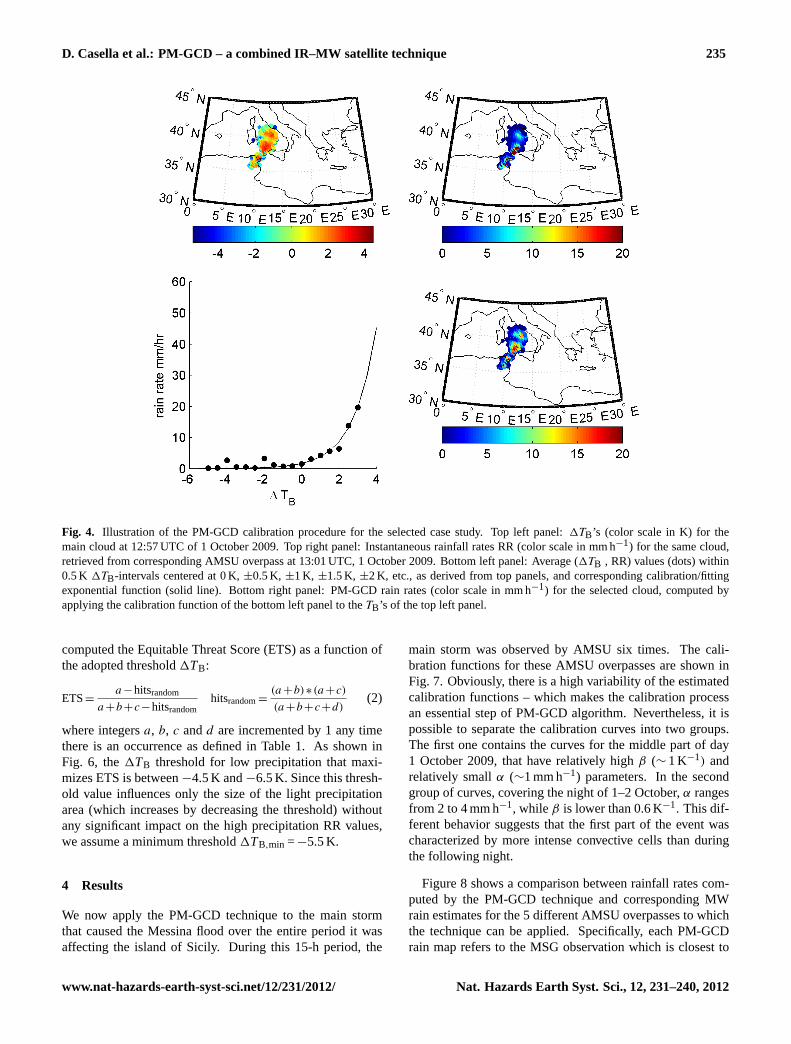
In order to generate the1TB− RR relationships for eachcloud and each couple of GEO-LEO corresponding obser-vations, we have found it useful to group the (1TB , RR)values that refer to all cloud pixels into 0.5 K1TB-intervalscentered at 0 K,±0.5 K, ± 1 K, ± 1.5 K, ±2 K, and so on,and to the average RR values within such intervals. Inciden-tally, this helps to take into account the 0.25 K radiometricaccuracy of the thermal-IR and water vapor channels, as wellas the variable accuracy of the MW rainfall retrievals. Asclearly shown by the two examples of Figs. 4 and 5, we findthat these sets of average (1TB, RR) values can be fitted byexponential functions:
RR= α ·exp(β ·1TB) (1)
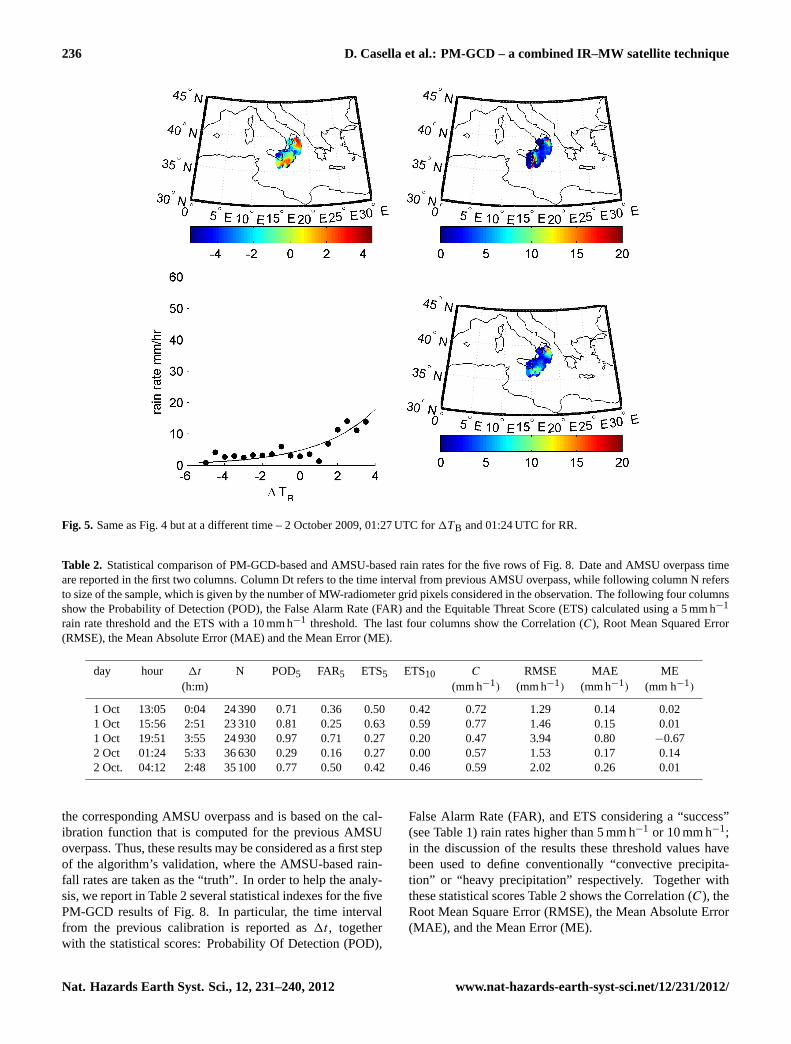
where the best-fit coefficientsα and β can vary consider-ably from case to case. Note that this function was alreadyused in other algorithms, i.e. in the auto-estimator algorithm(Vicente et al., 1998) it was used to calibrate a single IR-channel brightness temperature to ground radar-based rainrates. However, the PM-GCD technique calculates one cou-ple of α andβ parameters for each cloud and for each timea new MW observation is available. These two figures alsoshow that the rain intensity pattern within each PM-GCD pre-cipitation area is very similar to that retrieved from the corre-sponding AMSU observation; in particular, the most convec-tive regions that are characterized by the largest precipitationvalues in the PM-GCD approach tend to match the AMSU-based high precipitation regions, with the significant excep-tion of the convective cell over south-eastern Sicily in Fig. 5– as a result, the highest PM-GCD rain intensities within thiscell are significantly lower than those retrieved from AMSU.
Then, PM-GCD applies the above calibration/fitting for-mula to associate rain rates to all pixels of all GEO imagesof the selected cloud until a new MW observation. In ad-dition, PM-GCD incorporates a simple cloud tracking algo-rithm in order to follow the evolution of the various precipi-tating clouds from a GEO observation to the next one. PM-GCD produces a rain map for each IR-GEO observation, amap every 15 min is provided using the MSG. The calcula-tion time is less than 40 s using a 2.50 GHz Xeon CPU on a18 000 000 km2 domain.
We now consider in some detail the problem of definingthe precipitating clouds in a MSG observation by means ofthe GCD approach – i.e., of defining the minimum thresh-old (1TB,min) contours that best approximate the precipi-tation areas. To this end, we have compared GCD areaslimited by different threshold values with the correspond-ing MW-retrieved precipitation areas (defined as those ar-eas with RR> 0 mm h−1) for all AMSU observations overthe Mediterranean region of interest from 1 October 2009,00:00 UTC till 2 October 2009, 12:00 UTC. Then, we have
Nat. Hazards Earth Syst. Sci., 12, 231–240, 2012 www.nat-hazards-earth-syst-sci.net/12/231/2012/
D. Casella et al.: PM-GCD – a combined IR–MW satellite technique 235
Fig. 4. Illustration of the PM-GCD calibration procedure for the selected case study. Top left panel:1TB’s (color scale in K) for themain cloud at 12:57 UTC of 1 October 2009. Top right panel: Instantaneous rainfall rates RR (color scale in mm h−1) for the same cloud,retrieved from corresponding AMSU overpass at 13:01 UTC, 1 October 2009. Bottom left panel: Average (1TB , RR) values (dots) within0.5 K 1TB-intervals centered at 0 K,±0.5 K, ±1 K, ±1.5 K, ±2 K, etc., as derived from top panels, and corresponding calibration/fittingexponential function (solid line). Bottom right panel: PM-GCD rain rates (color scale in mm h−1) for the selected cloud, computed byapplying the calibration function of the bottom left panel to theTB’s of the top left panel.
computed the Equitable Threat Score (ETS) as a function ofthe adopted threshold1TB:
ETS=a−hitsrandom
a+b+c−hitsrandomhitsrandom=
(a+b)∗(a+c)
(a+b+c+d)(2)
where integersa, b, c andd are incremented by 1 any timethere is an occurrence as defined in Table 1. As shown inFig. 6, the1TB threshold for low precipitation that maxi-mizes ETS is between−4.5 K and−6.5 K. Since this thresh-old value influences only the size of the light precipitationarea (which increases by decreasing the threshold) withoutany significant impact on the high precipitation RR values,we assume a minimum threshold1TB,min =−5.5 K.
4 Results
We now apply the PM-GCD technique to the main stormthat caused the Messina flood over the entire period it wasaffecting the island of Sicily. During this 15-h period, the
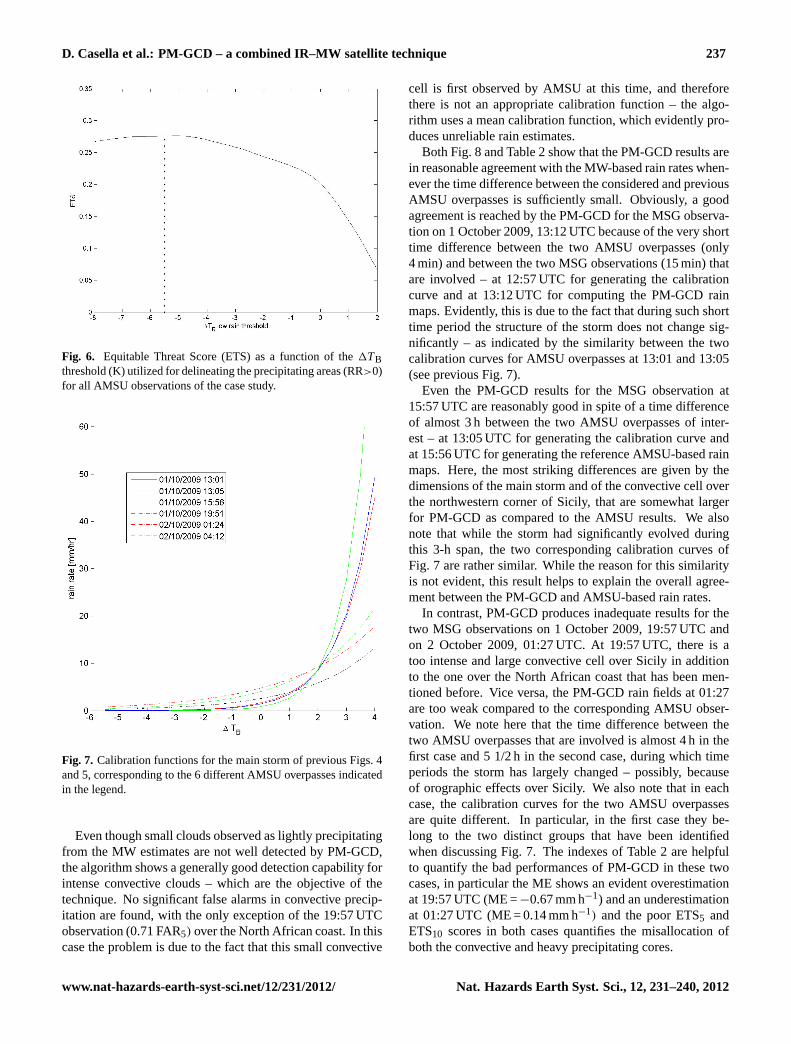
main storm was observed by AMSU six times. The cali-bration functions for these AMSU overpasses are shown inFig. 7. Obviously, there is a high variability of the estimatedcalibration functions – which makes the calibration processan essential step of PM-GCD algorithm. Nevertheless, it ispossible to separate the calibration curves into two groups.The first one contains the curves for the middle part of day1 October 2009, that have relatively highβ (∼ 1 K−1) andrelatively smallα (∼1 mm h−1) parameters. In the secondgroup of curves, covering the night of 1–2 October,α rangesfrom 2 to 4 mm h−1, whileβ is lower than 0.6 K−1. This dif-ferent behavior suggests that the first part of the event wascharacterized by more intense convective cells than duringthe following night.
Figure 8 shows a comparison between rainfall rates com-puted by the PM-GCD technique and corresponding MWrain estimates for the 5 different AMSU overpasses to whichthe technique can be applied. Specifically, each PM-GCDrain map refers to the MSG observation which is closest to
www.nat-hazards-earth-syst-sci.net/12/231/2012/ Nat. Hazards Earth Syst. Sci., 12, 231–240, 2012
236 D. Casella et al.: PM-GCD – a combined IR–MW satellite technique
Fig. 5. Same as Fig. 4 but at a different time – 2 October 2009, 01:27 UTC for1TB and 01:24 UTC for RR.
Table 2. Statistical comparison of PM-GCD-based and AMSU-based rain rates for the five rows of Fig. 8. Date and AMSU overpass timeare reported in the first two columns. Column Dt refers to the time interval from previous AMSU overpass, while following column N refersto size of the sample, which is given by the number of MW-radiometer grid pixels considered in the observation. The following four columnsshow the Probability of Detection (POD), the False Alarm Rate (FAR) and the Equitable Threat Score (ETS) calculated using a 5 mm h−1
rain rate threshold and the ETS with a 10 mm h−1 threshold. The last four columns show the Correlation (C), Root Mean Squared Error(RMSE), the Mean Absolute Error (MAE) and the Mean Error (ME).
day hour 1t N POD5 FAR5 ETS5 ETS10 C RMSE MAE ME(h:m) (mm h−1) (mm h−1) (mm h−1) (mm h−1)
1 Oct 13:05 0:04 24 390 0.71 0.36 0.50 0.42 0.72 1.29 0.14 0.021 Oct 15:56 2:51 23 310 0.81 0.25 0.63 0.59 0.77 1.46 0.15 0.011 Oct 19:51 3:55 24 930 0.97 0.71 0.27 0.20 0.47 3.94 0.80 −0.672 Oct 01:24 5:33 36 630 0.29 0.16 0.27 0.00 0.57 1.53 0.17 0.142 Oct. 04:12 2:48 35 100 0.77 0.50 0.42 0.46 0.59 2.02 0.26 0.01
the corresponding AMSU overpass and is based on the cal-ibration function that is computed for the previous AMSUoverpass. Thus, these results may be considered as a first stepof the algorithm’s validation, where the AMSU-based rain-fall rates are taken as the “truth”. In order to help the analy-sis, we report in Table 2 several statistical indexes for the fivePM-GCD results of Fig. 8. In particular, the time intervalfrom the previous calibration is reported as1t , togetherwith the statistical scores: Probability Of Detection (POD),
False Alarm Rate (FAR), and ETS considering a “success”(see Table 1) rain rates higher than 5 mm h−1 or 10 mm h−1;in the discussion of the results these threshold values havebeen used to define conventionally “convective precipita-tion” or “heavy precipitation” respectively. Together withthese statistical scores Table 2 shows the Correlation (C), theRoot Mean Square Error (RMSE), the Mean Absolute Error(MAE), and the Mean Error (ME).
Nat. Hazards Earth Syst. Sci., 12, 231–240, 2012 www.nat-hazards-earth-syst-sci.net/12/231/2012/
D. Casella et al.: PM-GCD – a combined IR–MW satellite technique 237
Fig. 6. Equitable Threat Score (ETS) as a function of the1TBthreshold (K) utilized for delineating the precipitating areas (RR>0)for all AMSU observations of the case study.
Fig. 7. Calibration functions for the main storm of previous Figs. 4and 5, corresponding to the 6 different AMSU overpasses indicatedin the legend.
Even though small clouds observed as lightly precipitatingfrom the MW estimates are not well detected by PM-GCD,the algorithm shows a generally good detection capability forintense convective clouds – which are the objective of thetechnique. No significant false alarms in convective precip-itation are found, with the only exception of the 19:57 UTCobservation (0.71 FAR5) over the North African coast. In thiscase the problem is due to the fact that this small convective
cell is first observed by AMSU at this time, and thereforethere is not an appropriate calibration function – the algo-rithm uses a mean calibration function, which evidently pro-duces unreliable rain estimates.
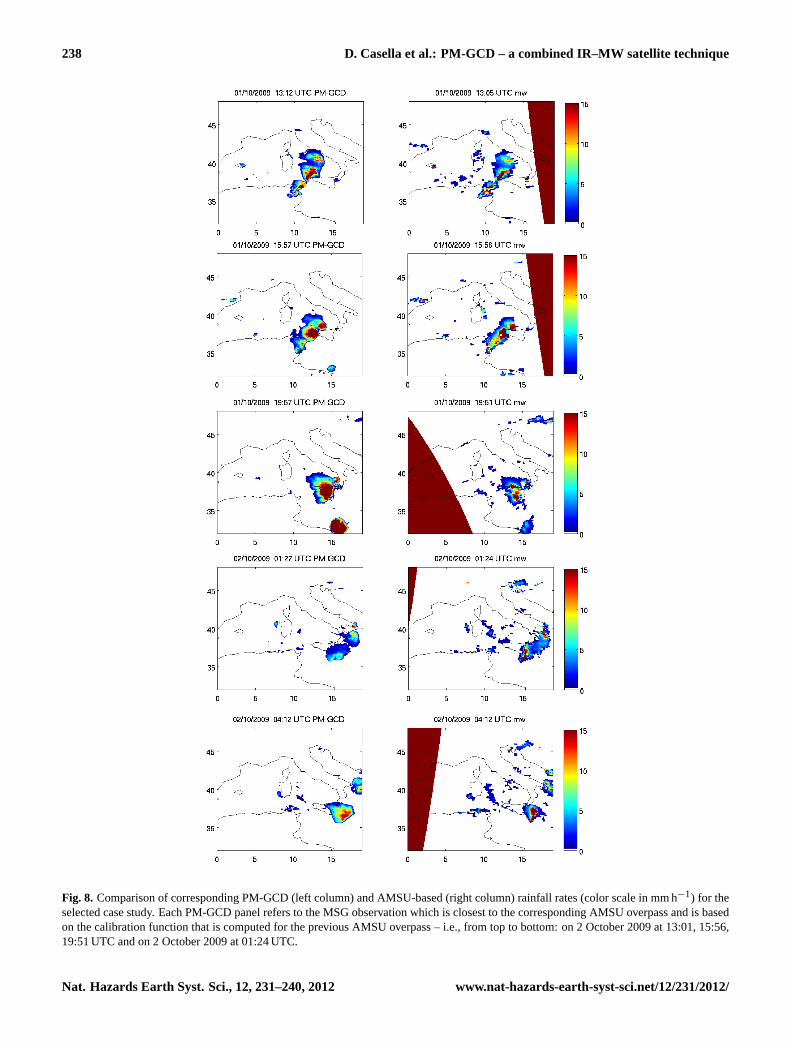
Both Fig. 8 and Table 2 show that the PM-GCD results arein reasonable agreement with the MW-based rain rates when-ever the time difference between the considered and previousAMSU overpasses is sufficiently small. Obviously, a goodagreement is reached by the PM-GCD for the MSG observa-tion on 1 October 2009, 13:12 UTC because of the very shorttime difference between the two AMSU overpasses (only4 min) and between the two MSG observations (15 min) thatare involved – at 12:57 UTC for generating the calibrationcurve and at 13:12 UTC for computing the PM-GCD rainmaps. Evidently, this is due to the fact that during such shorttime period the structure of the storm does not change sig-nificantly – as indicated by the similarity between the twocalibration curves for AMSU overpasses at 13:01 and 13:05(see previous Fig. 7).
Even the PM-GCD results for the MSG observation at15:57 UTC are reasonably good in spite of a time differenceof almost 3 h between the two AMSU overpasses of inter-est – at 13:05 UTC for generating the calibration curve andat 15:56 UTC for generating the reference AMSU-based rainmaps. Here, the most striking differences are given by thedimensions of the main storm and of the convective cell overthe northwestern corner of Sicily, that are somewhat largerfor PM-GCD as compared to the AMSU results. We alsonote that while the storm had significantly evolved duringthis 3-h span, the two corresponding calibration curves ofFig. 7 are rather similar. While the reason for this similarityis not evident, this result helps to explain the overall agree-ment between the PM-GCD and AMSU-based rain rates.
In contrast, PM-GCD produces inadequate results for thetwo MSG observations on 1 October 2009, 19:57 UTC andon 2 October 2009, 01:27 UTC. At 19:57 UTC, there is atoo intense and large convective cell over Sicily in additionto the one over the North African coast that has been men-tioned before. Vice versa, the PM-GCD rain fields at 01:27are too weak compared to the corresponding AMSU obser-vation. We note here that the time difference between thetwo AMSU overpasses that are involved is almost 4 h in thefirst case and 5 1/2 h in the second case, during which timeperiods the storm has largely changed – possibly, becauseof orographic effects over Sicily. We also note that in eachcase, the calibration curves for the two AMSU overpassesare quite different. In particular, in the first case they be-long to the two distinct groups that have been identifiedwhen discussing Fig. 7. The indexes of Table 2 are helpfulto quantify the bad performances of PM-GCD in these twocases, in particular the ME shows an evident overestimationat 19:57 UTC (ME =−0.67 mm h−1) and an underestimationat 01:27 UTC (ME = 0.14 mm h−1) and the poor ETS5 andETS10 scores in both cases quantifies the misallocation ofboth the convective and heavy precipitating cores.
www.nat-hazards-earth-syst-sci.net/12/231/2012/ Nat. Hazards Earth Syst. Sci., 12, 231–240, 2012
238 D. Casella et al.: PM-GCD – a combined IR–MW satellite technique
Fig. 8. Comparison of corresponding PM-GCD (left column) and AMSU-based (right column) rainfall rates (color scale in mm h−1) for theselected case study. Each PM-GCD panel refers to the MSG observation which is closest to the corresponding AMSU overpass and is basedon the calibration function that is computed for the previous AMSU overpass – i.e., from top to bottom: on 2 October 2009 at 13:01, 15:56,19:51 UTC and on 2 October 2009 at 01:24 UTC.
Nat. Hazards Earth Syst. Sci., 12, 231–240, 2012 www.nat-hazards-earth-syst-sci.net/12/231/2012/
D. Casella et al.: PM-GCD – a combined IR–MW satellite technique 239
Finally, the PM-GCD results for MSG observation on2 October 2009, 04:12 UTC look better than the previoustwo cases, but the convective rain cell southeast of Sicilyis clearly misplaced – which produces a large FAR5 (0.50).Apart from FAR5, the remaining indexes are comparable tothe first two of the case study, especially ETS5, ETS10 andME. This result is somehow expected if we consider thatthe time difference between the two AMSU overpasses ofinterest is less than 3 h and that the corresponding calibrationcurves are almost identical.
In summary, the PM-GCD precipitation estimates fromconvective clouds strictly depend on the time distance fromthe last MW calibration, as well as on the nature, speed andstage of evolution of the storm under consideration. Whileits performance may become unsatisfactory after 2–3 h fromsuch calibration and while the detailed rain fields may evenshow significant differences with respect to the “truth”, thetechnique may be very useful for quantitatively monitoringconvective (>5 mm h−1) and heavy (>10 mm h−1) precipi-tating storms within an operational framework. Therefore,we plan to analyze more case studies under different mete-orological and environmental conditions in order to attain adefinite assessment of PM-GCD performance.
5 Conclusions and future work
PM-GCD is a fast and simple IR-based, MW-calibratedscheme focusing on estimation of convective and heavy pre-cipitation. Due to the possibility of using it every 15 minduring day and night, it can become useful for nowcastingexperts and flood alarm managers.
Considering an observation of a typical cumulonimbus,the thermal IR radiance shows very small variations whilethe GCD value tends to decrease from the core convectivecell to the anvil region. Another reason to use GCD insteadof single IR-channel techniques is that GCD highly reducesthe number of false alarms that was one of the main sourcesof error of the HPNA technique (both in low and high pre-cipitating areas). Incidentally, even combined blending IR-MW algorithms could take advantage of the GCD bispectraltechnique since they have shown a worse performance thanglobal forecast models at mid-latitudes (Ebert et al., 2007).Another important innovation of PM-GCD is that it does nottake into account the 10 % coldest portion of the cloud todefine high precipitating areas. It has been noticed that thisrelation is valid just for a mature cumulonimbus (that is notthe most common observed cloud) and results in a false alarmfor any other cloud category.
Many of the limits of the PM-GCD technique can be re-lated to the characteristics of present instruments onboard op-erational satellites. Any satellite-borne IR radiometer sensesa signal that is related to the upper cloud levels and is notstrictly related to precipitation. Thus, MW calibration be-comes essential; however, the number of operational MW
radiometers on polar satellites allows only a sporadic cali-bration process.
In this paper, no radar measurements were available andthus a preliminary validation has been performed by usingthe AMSU-based rain rates as the “truth”. We also note thatthis is a necessary step to separate the effects strictly relatedto the algorithm from those that are due to the limited ac-curacy of the MW retrievals. Nevertheless, we plan to per-form an extensive validation of PM-GCD results by meansof ground-based and space-borne radars, such as the TRMMPR and rain gauge networks. We also plan to analyze severalcase studies under different meteorological and environmen-tal conditions in order to attain a final assessment of the per-formance of our technique. Then, we plan to integrate it intoa nowcasting algorithm in order to make it more useful tothe user community. Finally, a potential upgrade of this tech-nique, which is presently under study, consists in combiningPM-GCD with the lightning-based technique developed byDietrich et al. (2011) so as to take advantage of the strengthsof the two techniques and reduce their weaknesses.
Acknowledgements.The authors want to thank the anonymous re-viewers of this paper for their valuable comments and suggestions.This research has been supported by the European CommissionSixth Framework Programme through the project “Observation,Analysis and Modeling of Lightning Activity in Thunderstorms, foruse in Short Term Forecasting of Flash Floods” (FLASH), by theEuropean Community Initiative INTERREG III-B ARCHIMEDthrough the project “Weather Risk Reduction in the Central andEastern Mediterranean” (RISKMED), by the Italian FISR-MIURprogram “Sustainable Development and Climate Changes” throughthe project “Aerosol Effects on Clouds and Climate” (AERO-CLOUDS), and by the Italian Civil Protection Agency. We expressspecial thanks to Alessandro Mattia for his support and help.
Edited by: K. LagouvardosReviewed by: three anonymous referees
References
Adler, R. F., Keehn, P. R., and Hakkarinen, I. M.: Estimation ofmonthly rainfall over Japan and surrounding waters from a com-bination of low-orbit microwave and geosynchronous IR data, J.Appl. Meteor., 32, 335–356, 1993.
Bellerby, T. M., Todd, T., Kniveton, D., and Kidd, C.: Rainfall es-timation from a combination of TRMM precipitation radar andGOES multispecral satellite imagery through the use of an artifi-cial neural network, J. Appl. Meteor., 39, 2115–2128, 2000.
Betz, H.-D., Schmidt, K., and Oettinger, W. P.: LINET – An in-ternational VLF/LF lightning detection network in Europe, in:Lightning: Principles, Instruments and Applications, edited by:Betz, H.-D., Schumann, U., and Laroche, P., Springer, 115–140,2009.
Dietrich, S., Casella, D., Di Paola, F., Formenton, M., Mug-nai, A., and Sano, P.: Lightning-based propagation of convec-tive rain fields, Nat. Hazards Earth Syst. Sci., 11, 1571–1581,doi:10.5194/nhess-11-1571-2011, 2011.
www.nat-hazards-earth-syst-sci.net/12/231/2012/ Nat. Hazards Earth Syst. Sci., 12, 231–240, 2012
240 D. Casella et al.: PM-GCD – a combined IR–MW satellite technique
Ebert, E. E., Manton, M. J., Arkin, P. A., Allam, R. J., Holpin, G.E., and Gruber, A. J.: results from the GPCP Algorithm Inter-comparison Programme, B. Am. Meteor. Soc., 77, 2875–2887,1996.
Ebert, E. E., Janowiak, J. E., and Kidd, C.: Comparison of near-real-time precipitation estimates from satellite observations andnumerical models, B. Am. Meteor. Soc., 88, 47–64, 2007.
Huffman, G. J., Adler, R. F., Morrisey, M. M., Bolvin, D. T., Curtin,S., Joyce, R., McGavock, B., and Susskind, J.: Global precipi-tation at one-degree daily resolution from multisatellite observa-tions, J. Hydrometeor., 2, 36–50, 2001.
Joyce, R. J., Janowiak, J. E., Arkin, P. A., and Xie, P.: CMORPH:A method that produces global precipitation estimates from pas-sive microwave and infrared data at high spatial and temporalresolution, J. Hydrometeor., 5, 487–503, 2004.
Kidd, C. K., Kniveton, D. R., Todd, M. C., and Bellerby, T. J.:Satellite rainfall estimation using combined passive microwaveand infrared algorithms, J. Hydrometeor., 4, 1088–1104, 2003.
Kotroni, V., Lagouvardos, K., Defer, E., Dietrich, S., Porcu, F.,Medaglia, C. M., Demirtas, M.: The Antalya 5 December 2002Storm: Observations and Model Analysis, J. Appl. Meteor. Cli-matol., 45, 576–590, 2005.
Kuligowski, R. J.: A self-calibrating real-time GOES rainfall algo-rithm for short-term rainfall estimates, J. Hydrometeor., 3, 112–130, 2002.
Kummerov, C., Hong, Y., Holson, W. S., Yang, S., Adler, R. F., Mc-Collum, J., Ferraro, R., Petty, G., Schin, D.-B., and Wilheit, T. T.:The evolution of the Goddard profiling algorithm (GPROF) forrainfall estimation from passive microwave sensors, J. J. Appl.Meteor., 40, 1801–1820, 2001.
Martin, D. W., Kohrs, R. A., Mosher, F. R., Medaglia, C. M., andAdamo, C.: Over-Ocean Validation of the Global Convective Di-agnostic, J. Appl. Meteor. Climatol., 47, 525–543, 2008.
Miller, S. W., Arkin, P. A., and Joyce, R.: A combined mi-crowave/infrared rain rate algorithm, Int. J. Remote. Sens., 22,3285–3307, 2001.
Mosher, F. R.: A satellite diagnostic of global convention, Preprints,11th Conf on Satellite Meteorology, Madison, WI, Am. Meteor.Soc., 416–419, 2001.
Mosher, F. R.: Detection of deep convection around the globe,Preprints, 10th Conf. on Aviation, Range and aerospace Mete-orology, Portland, OR, Amer. Meteor. Soc., 289–292, 2002.
Negri, A. J., Adler, R. F., and Wetzel, P. J.: Rain estimation fromsatellite: An examination of the Griffith–Woodley technique, J.Climate Appl. Meteor., 23, 102–116, 1984.
Porcu, F., Dietrich, S., Mugnai, A., Natali, S., Prodi, F., Conway,P.: Satellite multi-frequency observations of severe convectivesystems in the Mediterranean, Phys. Chem. Earth B, 24, 643–648, 1999.
Smith, E. ALamm., J. E., Adler, R. F., Alishouse, J., and Aonashi,K.: Results of the WetNet PIP-2 project, J. Atmos. Sci., 55,1483–1536, 1998.
Sorooshian, S., Hsu, K.-L., Gao, X., Gupta, H. V., Imam, B.,and Braithwaite, D.: Evaluation of PERSIANN system satellite-based estimates of tropical rainfall, B. Am. Meteor. Soc., 81,2035–2046, 2000.
Surussavadee, C. and Staelin, D. H.: Global millimeter-wave pre-cipitation retrievals trained with a cloud-resolving numericalweather prediction model, Part I: Retrieval design, IEEE T.Geosci. Remote Sens., 46, 99–108, 2008a.
Surussavadee, C. and Staelin, D. H.: Global millimeter-wave pre-cipitation retrievals trained with a cloud-resolving numericalweather prediction model, Part II: Performance evaluation, IEEET. Geosci. Remote Sens., 46, 109–118, 2008b.
Thies, B., Nauss, T., and Bendix, J.: First results on a process-oriented rain area classification technique using Meteosat SecondGeneration SEVIRI night-time data, Adv. Geosci., 16, 63–72,2008,http://www.adv-geosci.net/16/63/2008/.
Turk, F. J. and Miller, S. D.: Toward improving estimates ofremotely-sensed precipitation with MODIS/ AMSR-E blendeddata techniques, IEEE T. Geosci. Remote Sens., 43, 1059–1069,2005.
Turk, F. J., Rohaly, G. D., Hawkins, J., Smith, E. A., Marzano, F. S.,Mugnai, A., and Levizzani, V.: Meteorological applications ofprecipitation estimation from combined SSM/I, in: TRMM andinfrared geostationary satellite data, Microwave Radiometry andRemote Sensing of the Earth’s Surface and Atmosphere, editedby: Pampaloni, P. and Paloscia, S., VSP Press, 353–363, 2000.
Vicente, G., Scofield, R. A., and Mensel, W. P.: The operationalGOES infrared rainfall estimation technique, B. Am. Meteor.Soc., 79, 1883–1898, 1998.
Xu, L., Gao, X., Sorooshian, S., Arkin, P. A., and Imam, B.: Amicrowave infrared threshold technique to improve the GOESprecipitation index, J. Appl. Meteor., 38, 569–579, 1999.
Nat. Hazards Earth Syst. Sci., 12, 231–240, 2012 www.nat-hazards-earth-syst-sci.net/12/231/2012/