Embed Size (px)
Citation preview

SIKKIM MANIPAL UNIVERSITY
DEPARTMENT OF DISTANCE EDUCATION
ASSIGNMENT
SEMESTER 4
NAME : ABHISHEK JAIN
ROLL NUMBER : 511035358
LEARNING CENTER : 02882
SUBJECT NAME :
QUANTITATIVE METHODS IN
PROJECT MANAGEMENT
MODULE NO : SET 1
DATE OF SUBMISSION AT THE
LEARNING CENTRE
: 31-MAY-11
FACULTY SIGNATURE :
MBA 4th Sem Assignment Quantitative Methods in Project Management – PM0015 – Set 1
2011 Abhishek Jain - 511035358 Page 2 of 10
Master of Business Administration-MBA Semester 4
Project Management – PM0015 Assignment Set - 1
Q.1 Describe the process of setting up of a common resource.
Ans: In real life scenario, a project manager has to work on multiple number of the projects at the
same time. Now, in most of the projects, some resources remain common and the project managers
have to use the common resources at the optimum level to finish the project activities in the least
possible time. It is possible to manage multiple projects using the same resources through the MS
Project software.
It is very much essential to use some common resources for multiple number of projects. When
someone has several projects running using a common pool of staff, it is essential that the user is
aware of any conflict arising due to a staff member being assigned to conflicting tasks or
unavailable due to other commitments in some other project.
MS Project allows you to set up your project so that you share resources and can be warned of any
such conflict.
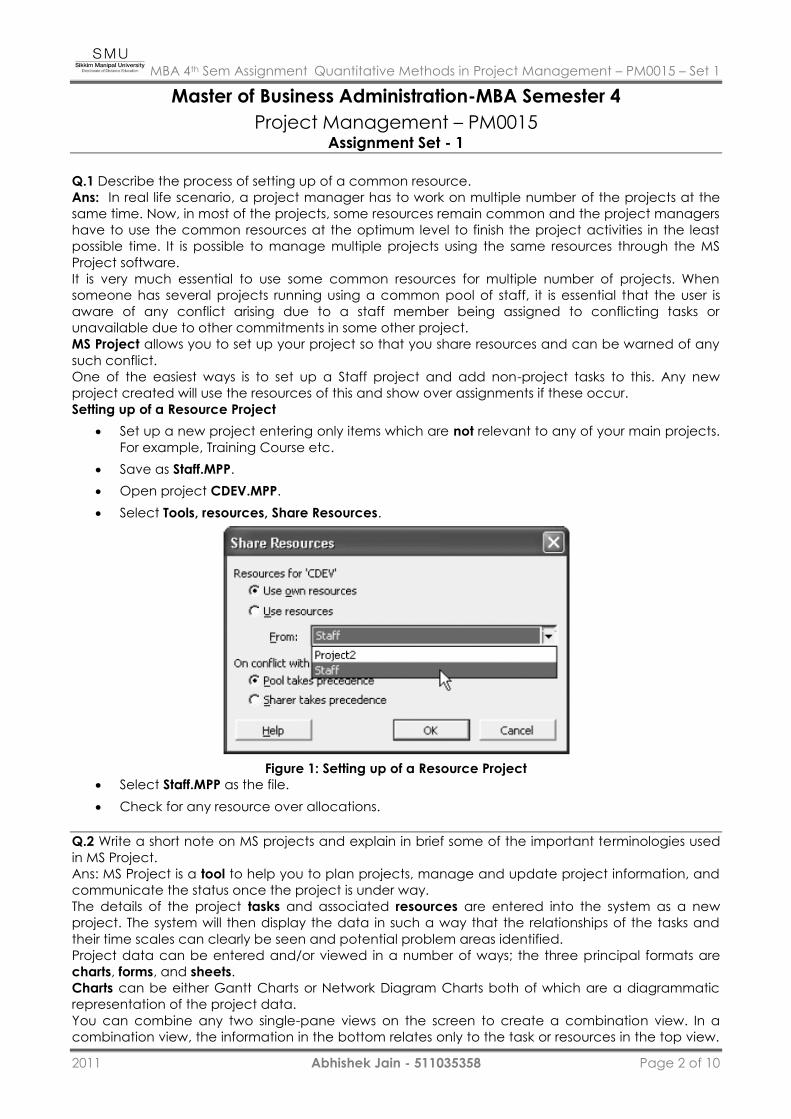
One of the easiest ways is to set up a Staff project and add non-project tasks to this. Any new
project created will use the resources of this and show over assignments if these occur.
Setting up of a Resource Project
Set up a new project entering only items which are not relevant to any of your main projects.
For example, Training Course etc.
Save as Staff.MPP.
Open project CDEV.MPP.
Select Tools, resources, Share Resources.
Figure 1: Setting up of a Resource Project
Select Staff.MPP as the file.
Check for any resource over allocations.
Q.2 Write a short note on MS projects and explain in brief some of the important terminologies used
in MS Project.
Ans: MS Project is a tool to help you to plan projects, manage and update project information, and
communicate the status once the project is under way.
The details of the project tasks and associated resources are entered into the system as a new
project. The system will then display the data in such a way that the relationships of the tasks and
their time scales can clearly be seen and potential problem areas identified.
Project data can be entered and/or viewed in a number of ways; the three principal formats are
charts, forms, and sheets.
Charts can be either Gantt Charts or Network Diagram Charts both of which are a diagrammatic
representation of the project data.
You can combine any two single-pane views on the screen to create a combination view. In a
combination view, the information in the bottom relates only to the task or resources in the top view.
MBA 4th Sem Assignment Quantitative Methods in Project Management – PM0015 – Set 1
2011 Abhishek Jain - 511035358 Page 3 of 10
The reason for having combination views is to make the job of entering and analysing information
easier.
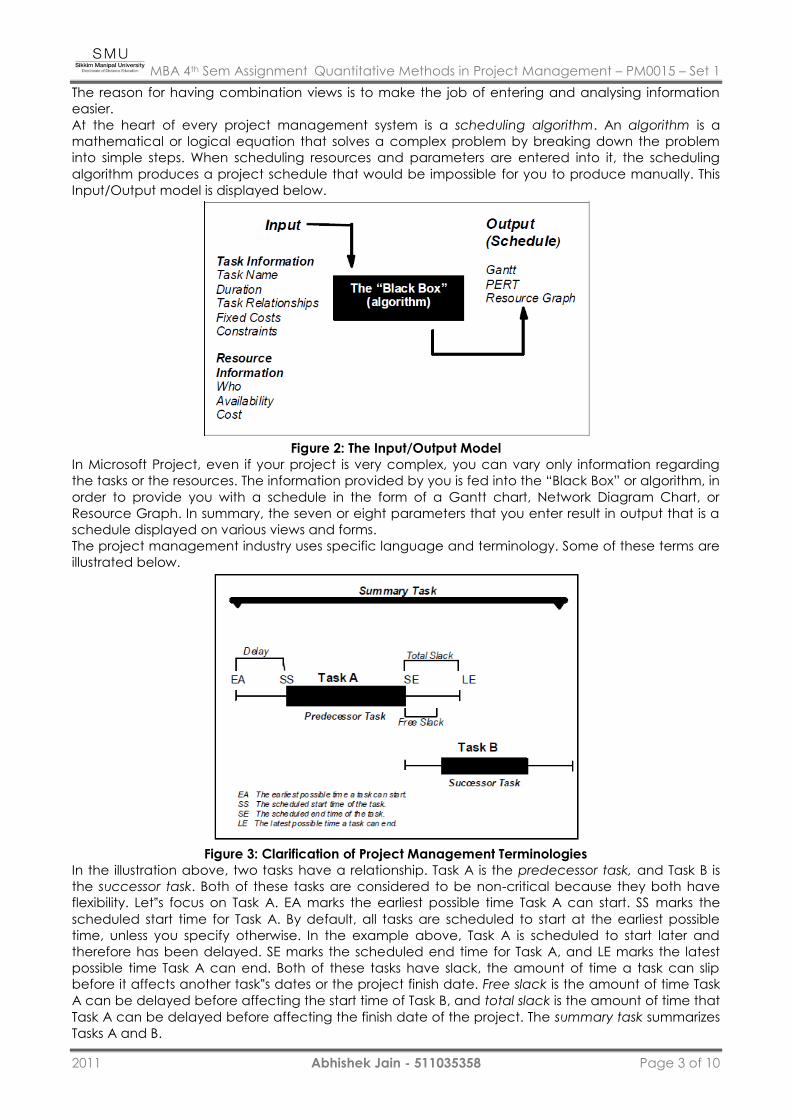
At the heart of every project management system is a scheduling algorithm. An algorithm is a
mathematical or logical equation that solves a complex problem by breaking down the problem
into simple steps. When scheduling resources and parameters are entered into it, the scheduling
algorithm produces a project schedule that would be impossible for you to produce manually. This
Input/Output model is displayed below.
Figure 2: The Input/Output Model
In Microsoft Project, even if your project is very complex, you can vary only information regarding
the tasks or the resources. The information provided by you is fed into the “Black Box” or algorithm, in
order to provide you with a schedule in the form of a Gantt chart, Network Diagram Chart, or
Resource Graph. In summary, the seven or eight parameters that you enter result in output that is a
schedule displayed on various views and forms.
The project management industry uses specific language and terminology. Some of these terms are
illustrated below.
Figure 3: Clarification of Project Management Terminologies
In the illustration above, two tasks have a relationship. Task A is the predecessor task, and Task B is
the successor task. Both of these tasks are considered to be non-critical because they both have
flexibility. Let‟s focus on Task A. EA marks the earliest possible time Task A can start. SS marks the
scheduled start time for Task A. By default, all tasks are scheduled to start at the earliest possible
time, unless you specify otherwise. In the example above, Task A is scheduled to start later and
therefore has been delayed. SE marks the scheduled end time for Task A, and LE marks the latest
possible time Task A can end. Both of these tasks have slack, the amount of time a task can slip
before it affects another task‟s dates or the project finish date. Free slack is the amount of time Task
A can be delayed before affecting the start time of Task B, and total slack is the amount of time that
Task A can be delayed before affecting the finish date of the project. The summary task summarizes
Tasks A and B.
MBA 4th Sem Assignment Quantitative Methods in Project Management – PM0015 – Set 1
2011 Abhishek Jain - 511035358 Page 4 of 10
Critical tasks, not shown above, have no slack; therefore, delaying this type of task would mean
delaying the project. A critical path is a series of critical tasks. All tasks on a critical path must be
completed on time for the project to finish on time. If one task on a critical path is delayed, then the
project is delayed. In Microsoft Project, a critical path is shown on the Gantt chart and the Network
Diagram Chart in red.
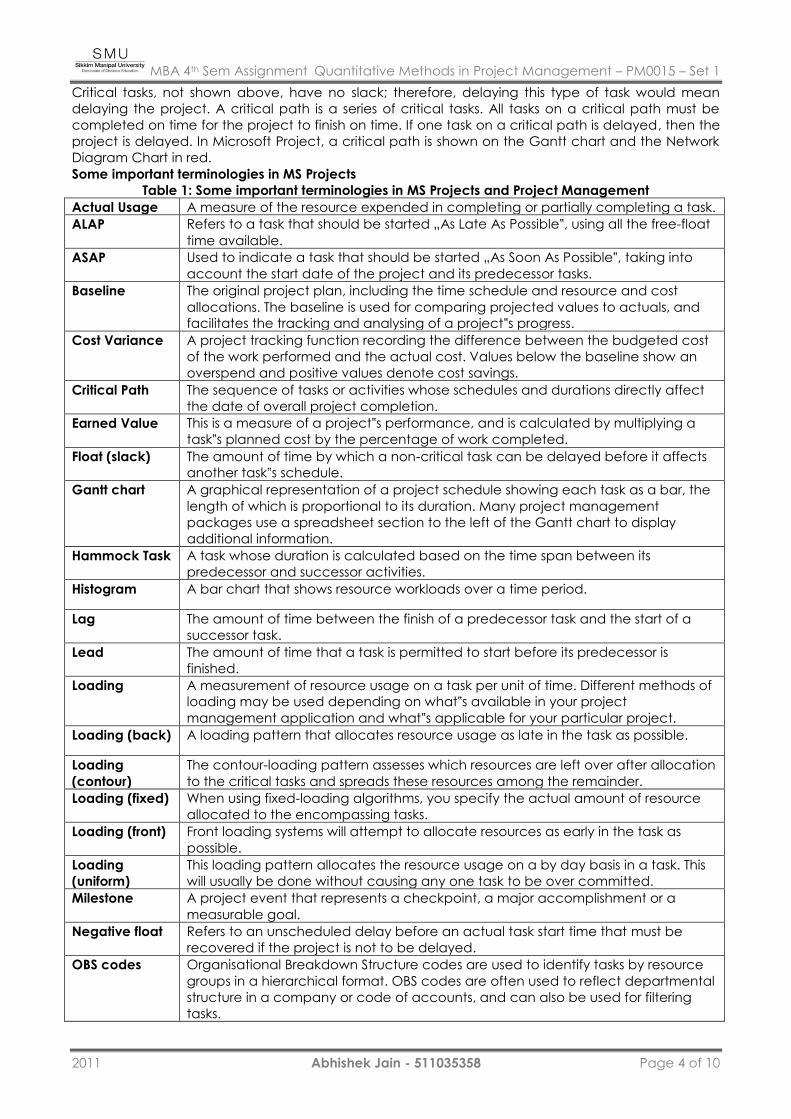
Some important terminologies in MS Projects
Table 1: Some important terminologies in MS Projects and Project Management
Actual Usage A measure of the resource expended in completing or partially completing a task.
ALAP Refers to a task that should be started „As Late As Possible‟, using all the free-float
time available.
ASAP Used to indicate a task that should be started „As Soon As Possible‟, taking into
account the start date of the project and its predecessor tasks.
Baseline The original project plan, including the time schedule and resource and cost
allocations. The baseline is used for comparing projected values to actuals, and
facilitates the tracking and analysing of a project‟s progress.
Cost Variance A project tracking function recording the difference between the budgeted cost
of the work performed and the actual cost. Values below the baseline show an
overspend and positive values denote cost savings.
Critical Path The sequence of tasks or activities whose schedules and durations directly affect
the date of overall project completion.
Earned Value This is a measure of a project‟s performance, and is calculated by multiplying a
task‟s planned cost by the percentage of work completed.
Float (slack) The amount of time by which a non-critical task can be delayed before it affects
another task‟s schedule.
Gantt chart A graphical representation of a project schedule showing each task as a bar, the
length of which is proportional to its duration. Many project management
packages use a spreadsheet section to the left of the Gantt chart to display
additional information.
Hammock Task A task whose duration is calculated based on the time span between its
predecessor and successor activities.
Histogram A bar chart that shows resource workloads over a time period.
Lag The amount of time between the finish of a predecessor task and the start of a
successor task.
Lead The amount of time that a task is permitted to start before its predecessor is
finished.
Loading A measurement of resource usage on a task per unit of time. Different methods of
loading may be used depending on what‟s available in your project
management application and what‟s applicable for your particular project.
Loading (back) A loading pattern that allocates resource usage as late in the task as possible.
Loading
(contour)
The contour-loading pattern assesses which resources are left over after allocation
to the critical tasks and spreads these resources among the remainder.
Loading (fixed) When using fixed-loading algorithms, you specify the actual amount of resource
allocated to the encompassing tasks.
Loading (front) Front loading systems will attempt to allocate resources as early in the task as
possible.
Loading
(uniform)
This loading pattern allocates the resource usage on a by day basis in a task. This
will usually be done without causing any one task to be over committed.
Milestone A project event that represents a checkpoint, a major accomplishment or a
measurable goal.
Negative float Refers to an unscheduled delay before an actual task start time that must be
recovered if the project is not to be delayed.
OBS codes Organisational Breakdown Structure codes are used to identify tasks by resource
groups in a hierarchical format. OBS codes are often used to reflect departmental
structure in a company or code of accounts, and can also be used for filtering
tasks.
MBA 4th Sem Assignment Quantitative Methods in Project Management – PM0015 – Set 1
2011 Abhishek Jain - 511035358 Page 5 of 10
Network
Diagram
Project Evaluation and Resource Tracking charts, also called network diagrams.
Network Diagrams are a graphical depiction of task dependencies, and resemble
flow charts. Dependencies are shown by connecting lines or arrows indicating the
work flow.
Predecessor In dependency relationships, the predecessor is the task that must be started or
completed first.
Project
Manage-ment
Best defined as a body of knowledge, a set of principles, or techniques dealing
with the planning and control of projects.
Resource Any person, group of people, item or equipment, service or material used in
accomplishing a project task.
Resource
Levelling
The process of resolving resource conflicts. Most project management programs
offer an automated resource levelling routine that delays tasks until the resources
assigned to them are available.
Resource
Driven
Task durations determined by the program and based on the number of an
allocation of resources, rather than the time available. Both individual tasks and
entire projects can be resource-driven.
Sub-project A group of activities which are treated as a single task in a master project
schedule. Subprojects are a way of working with multiple projects that keep all
the data in one file rather than in independent files.
Successor In a dependency relationship between two tasks, the successor is the task that
must await the start or completion of the other.
WBS codes Work Breakdown Structure codes are used to identify tasks in a hierarchy. Many
project management applications associate these codes with an outline
structure. WBS codes can be used to filter the project schedule for tracking and
reporting purposes.
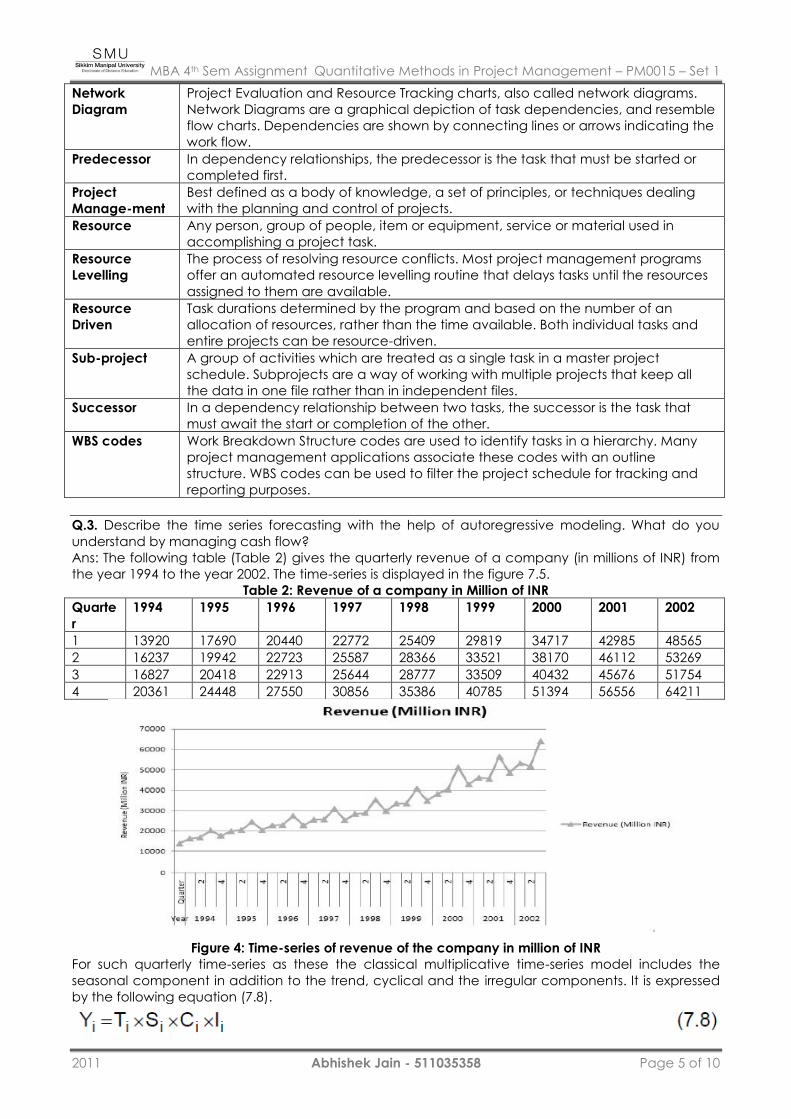
Q.3. Describe the time series forecasting with the help of autoregressive modeling. What do you
understand by managing cash flow?
Ans: The following table (Table 2) gives the quarterly revenue of a company (in millions of INR) from
the year 1994 to the year 2002. The time-series is displayed in the figure 7.5.
Table 2: Revenue of a company in Million of INR
Quarte
r
1994 1995 1996 1997 1998 1999 2000 2001 2002
1 13920 17690 20440 22772 25409 29819 34717 42985 48565
2 16237 19942 22723 25587 28366 33521 38170 46112 53269
3 16827 20418 22913 25644 28777 33509 40432 45676 51754
4 20361 24448 27550 30856 35386 40785 51394 56556 64211
Figure 4: Time-series of revenue of the company in million of INR
For such quarterly time-series as these the classical multiplicative time-series model includes the
seasonal component in addition to the trend, cyclical and the irregular components. It is expressed
by the following equation (7.8).
MBA 4th Sem Assignment Quantitative Methods in Project Management – PM0015 – Set 1
2011 Abhishek Jain - 511035358 Page 6 of 10
Q.4. Describe how you can display data using Gantt chart and Network Diagram Chart
Ans: There are several ways for displaying the data. Gantt Chart as well as Network Diagram Chart
are two important tools by which it is possible to display project data.
Gantt Chart
The Gantt Chart is a horizontal bar chart that represents each task in the time scale of the project.
Each task entered in the project will be shown.
The Gantt Chart can be used to visually keep track of the tasks and also may be used to identify
important points about each task. Those tasks that together control the completion date are known
as the critical Path and are shown differently to highlight that fact.
Gantt Charts can be printed and therefore these form the significant part of a regular report which
shows the current progress, comparison with the original plan, and the new projected completion
data.
Changing the split between chart and table
When the Gantt Chart view or the Task Entry view is selected, the Gantt Chart area has part of a
table on the left and the bars on the right.
It is possible to move the dividing line between these two areas with the mouse pointer. When the
pointer is on the dividing line, it changes to two vertical lines with left and right arrows. If the left
button is held down then the dividing line can be moved to the left or right as required.
Changing Time Scale
It is possible to change the time scale on the right side of the chart directly by using the View, Zoom
command or with the Format, Timescale command.
Where the latter is chosen, the dialog box will provide the ability to change both the major and
minor time scales and within each of these it will be possible to alter the units, the label, the
alignment, and the count of the interval between the unit labels.
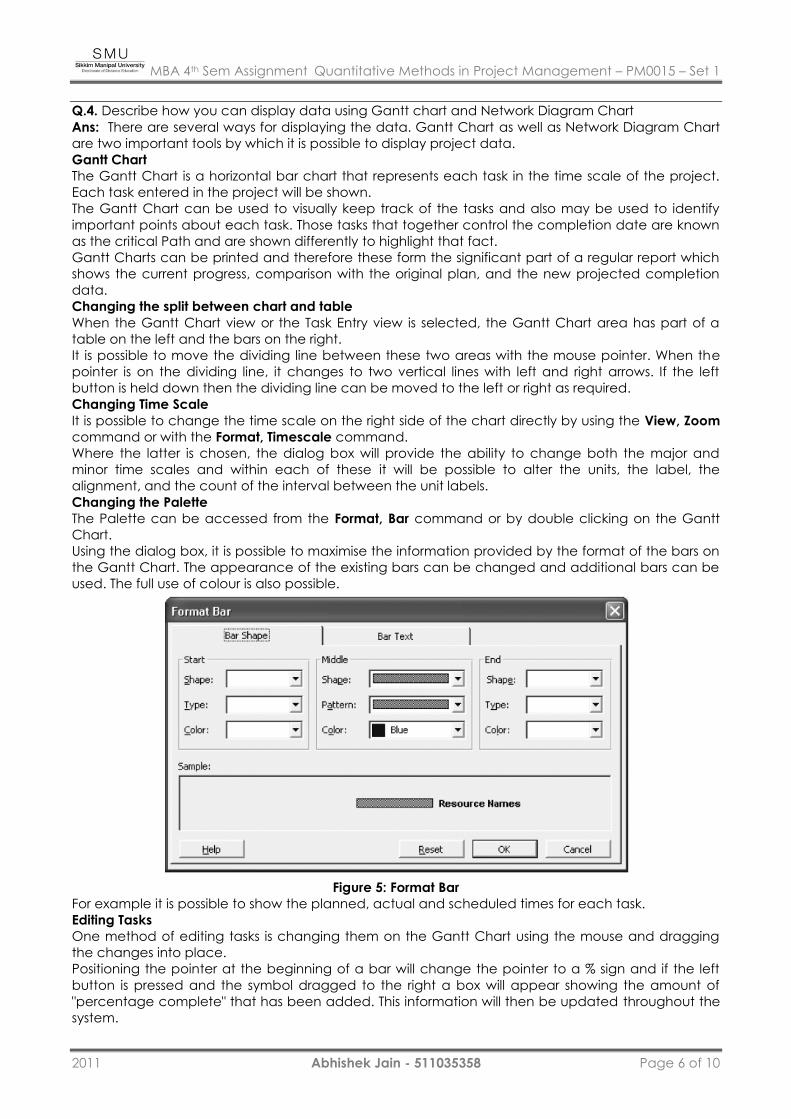
Changing the Palette
The Palette can be accessed from the Format, Bar command or by double clicking on the Gantt
Chart.
Using the dialog box, it is possible to maximise the information provided by the format of the bars on
the Gantt Chart. The appearance of the existing bars can be changed and additional bars can be
used. The full use of colour is also possible.
Figure 5: Format Bar
For example it is possible to show the planned, actual and scheduled times for each task.
Editing Tasks
One method of editing tasks is changing them on the Gantt Chart using the mouse and dragging
the changes into place.
Positioning the pointer at the beginning of a bar will change the pointer to a % sign and if the left
button is pressed and the symbol dragged to the right a box will appear showing the amount of
"percentage complete" that has been added. This information will then be updated throughout the
system.
MBA 4th Sem Assignment Quantitative Methods in Project Management – PM0015 – Set 1
2011 Abhishek Jain - 511035358 Page 7 of 10
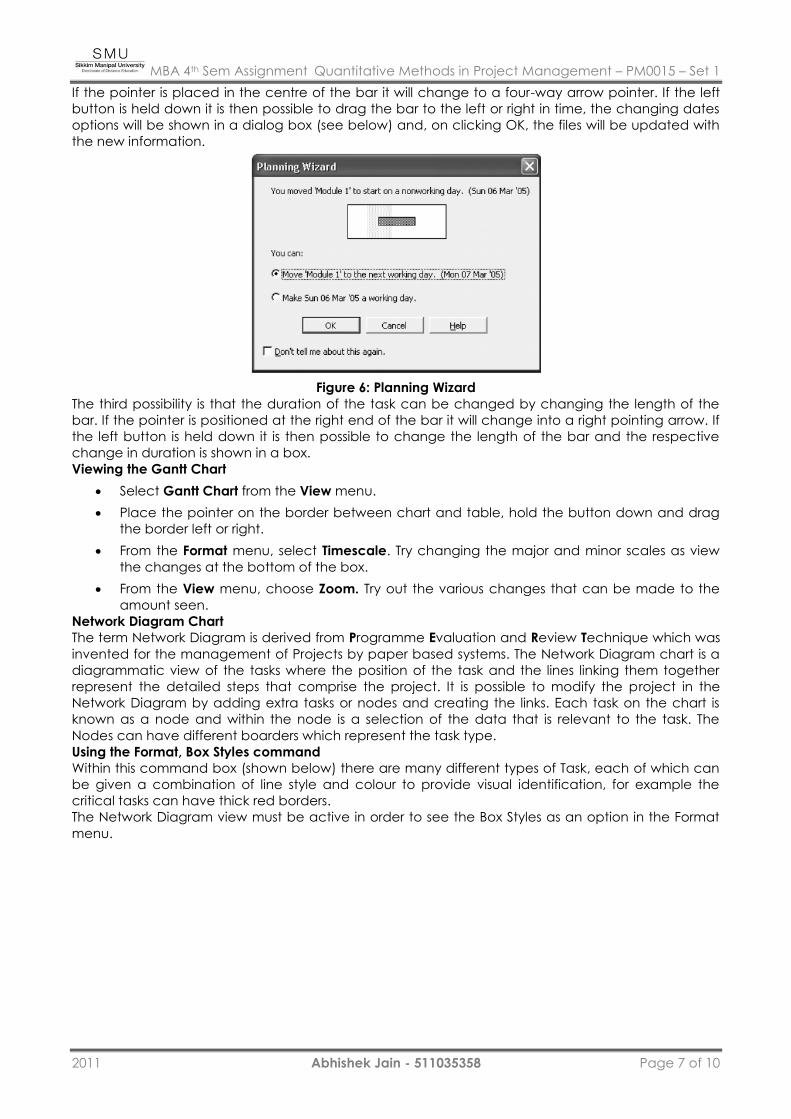
If the pointer is placed in the centre of the bar it will change to a four-way arrow pointer. If the left
button is held down it is then possible to drag the bar to the left or right in time, the changing dates
options will be shown in a dialog box (see below) and, on clicking OK, the files will be updated with
the new information.
Figure 6: Planning Wizard
The third possibility is that the duration of the task can be changed by changing the length of the
bar. If the pointer is positioned at the right end of the bar it will change into a right pointing arrow. If
the left button is held down it is then possible to change the length of the bar and the respective
change in duration is shown in a box.
Viewing the Gantt Chart
Select Gantt Chart from the View menu.
Place the pointer on the border between chart and table, hold the button down and drag
the border left or right.
From the Format menu, select Timescale. Try changing the major and minor scales as view
the changes at the bottom of the box.
From the View menu, choose Zoom. Try out the various changes that can be made to the
amount seen.
Network Diagram Chart
The term Network Diagram is derived from Programme Evaluation and Review Technique which was
invented for the management of Projects by paper based systems. The Network Diagram chart is a
diagrammatic view of the tasks where the position of the task and the lines linking them together
represent the detailed steps that comprise the project. It is possible to modify the project in the
Network Diagram by adding extra tasks or nodes and creating the links. Each task on the chart is
known as a node and within the node is a selection of the data that is relevant to the task. The
Nodes can have different boarders which represent the task type.
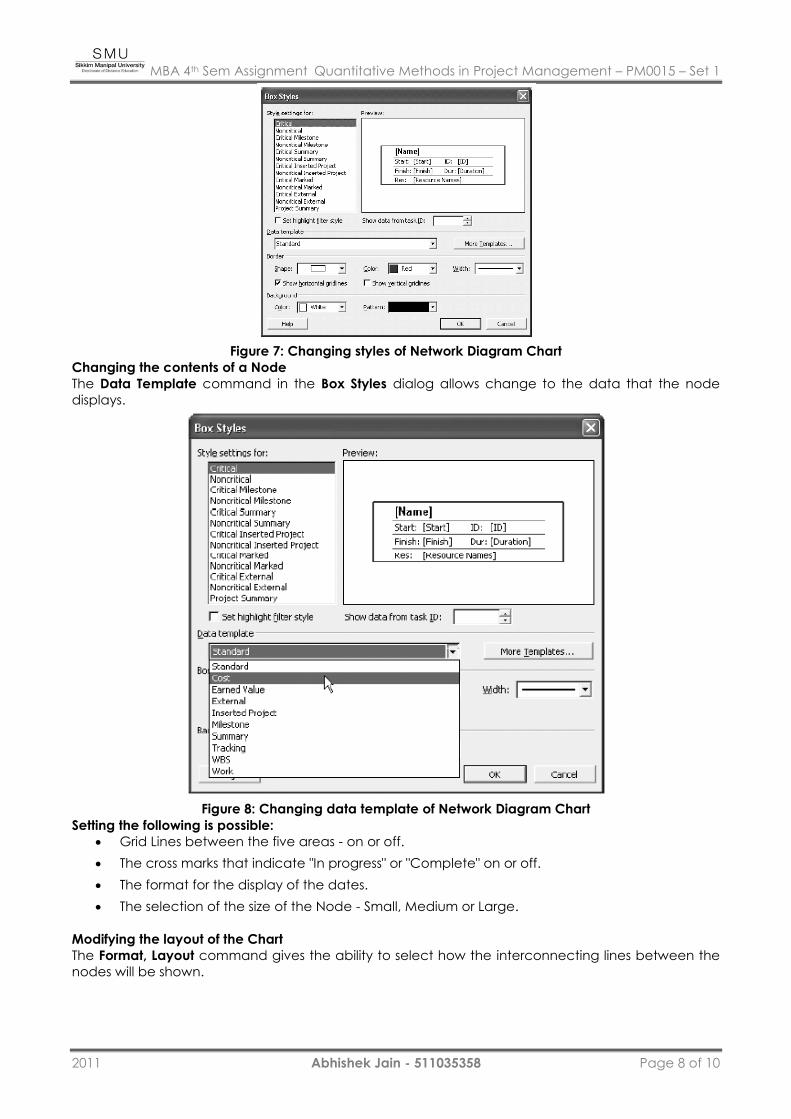
Using the Format, Box Styles command
Within this command box (shown below) there are many different types of Task, each of which can
be given a combination of line style and colour to provide visual identification, for example the
critical tasks can have thick red borders.
The Network Diagram view must be active in order to see the Box Styles as an option in the Format
menu.
MBA 4th Sem Assignment Quantitative Methods in Project Management – PM0015 – Set 1
2011 Abhishek Jain - 511035358 Page 8 of 10
Figure 7: Changing styles of Network Diagram Chart
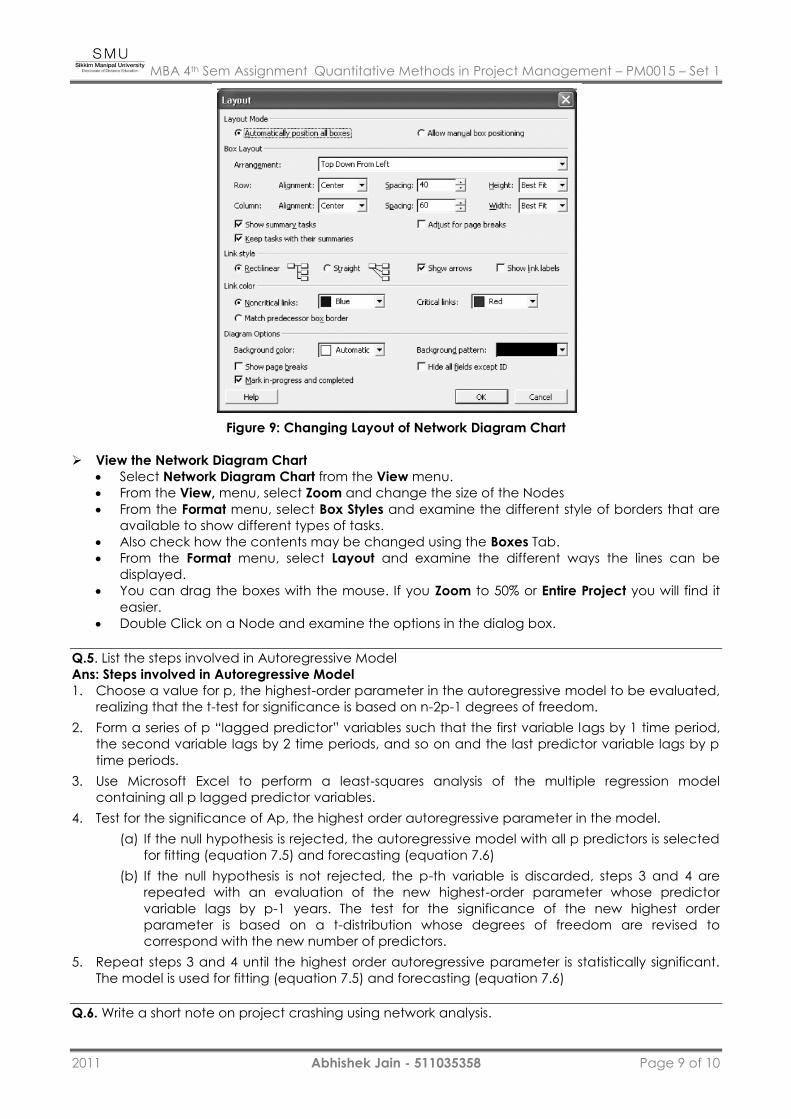
Changing the contents of a Node
The Data Template command in the Box Styles dialog allows change to the data that the node
displays.
Figure 8: Changing data template of Network Diagram Chart
Setting the following is possible:
Grid Lines between the five areas - on or off.
The cross marks that indicate "In progress" or "Complete" on or off.
The format for the display of the dates.
The selection of the size of the Node - Small, Medium or Large.
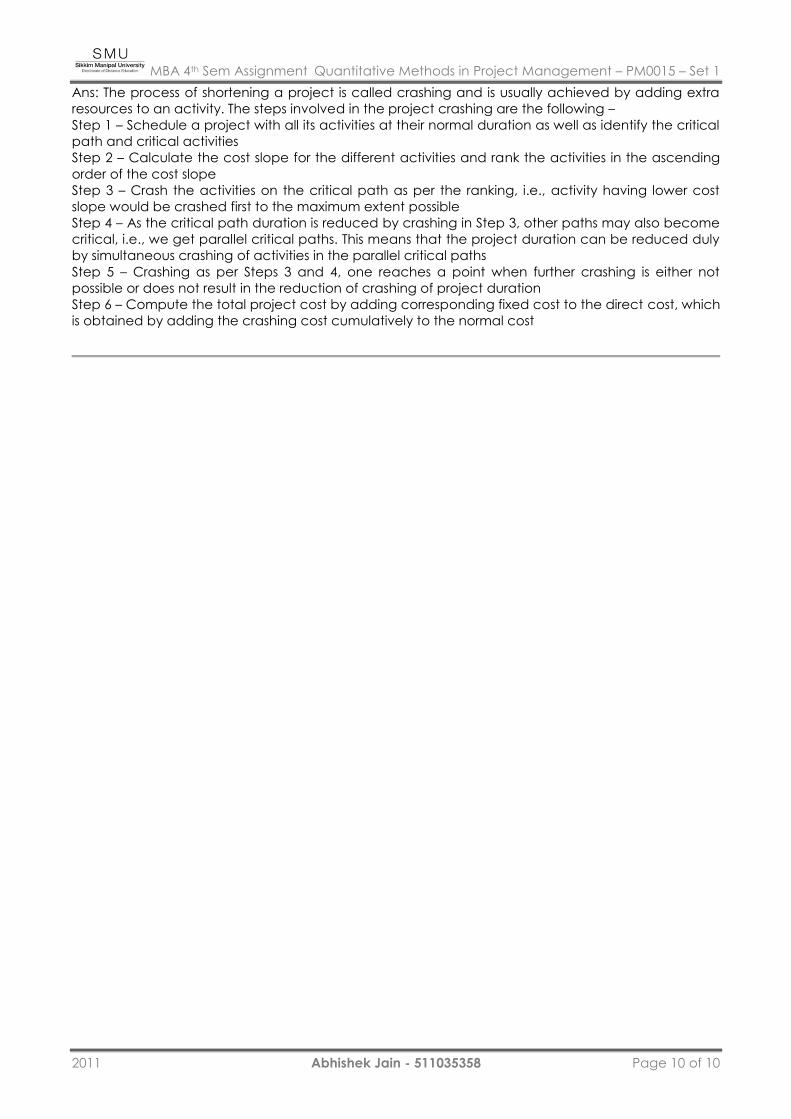
Modifying the layout of the Chart
The Format, Layout command gives the ability to select how the interconnecting lines between the
nodes will be shown.
MBA 4th Sem Assignment Quantitative Methods in Project Management – PM0015 – Set 1
2011 Abhishek Jain - 511035358 Page 9 of 10
Figure 9: Changing Layout of Network Diagram Chart
View the Network Diagram Chart
Select Network Diagram Chart from the View menu.
From the View, menu, select Zoom and change the size of the Nodes
From the Format menu, select Box Styles and examine the different style of borders that are
available to show different types of tasks.
Also check how the contents may be changed using the Boxes Tab.
From the Format menu, select Layout and examine the different ways the lines can be
displayed.
You can drag the boxes with the mouse. If you Zoom to 50% or Entire Project you will find it
easier.
Double Click on a Node and examine the options in the dialog box.
Q.5. List the steps involved in Autoregressive Model
Ans: Steps involved in Autoregressive Model
1. Choose a value for p, the highest-order parameter in the autoregressive model to be evaluated,
realizing that the t-test for significance is based on n-2p-1 degrees of freedom.
2. Form a series of p “lagged predictor” variables such that the first variable lags by 1 time period,
the second variable lags by 2 time periods, and so on and the last predictor variable lags by p
time periods.
3. Use Microsoft Excel to perform a least-squares analysis of the multiple regression model
containing all p lagged predictor variables.
4. Test for the significance of Ap, the highest order autoregressive parameter in the model.
(a) If the null hypothesis is rejected, the autoregressive model with all p predictors is selected
for fitting (equation 7.5) and forecasting (equation 7.6)
(b) If the null hypothesis is not rejected, the p-th variable is discarded, steps 3 and 4 are
repeated with an evaluation of the new highest-order parameter whose predictor
variable lags by p-1 years. The test for the significance of the new highest order
parameter is based on a t-distribution whose degrees of freedom are revised to
correspond with the new number of predictors.
5. Repeat steps 3 and 4 until the highest order autoregressive parameter is statistically significant.
The model is used for fitting (equation 7.5) and forecasting (equation 7.6)
Q.6. Write a short note on project crashing using network analysis.
MBA 4th Sem Assignment Quantitative Methods in Project Management – PM0015 – Set 1
2011 Abhishek Jain - 511035358 Page 10 of 10
Ans: The process of shortening a project is called crashing and is usually achieved by adding extra
resources to an activity. The steps involved in the project crashing are the following –
Step 1 – Schedule a project with all its activities at their normal duration as well as identify the critical
path and critical activities
Step 2 – Calculate the cost slope for the different activities and rank the activities in the ascending
order of the cost slope
Step 3 – Crash the activities on the critical path as per the ranking, i.e., activity having lower cost
slope would be crashed first to the maximum extent possible
Step 4 – As the critical path duration is reduced by crashing in Step 3, other paths may also become
critical, i.e., we get parallel critical paths. This means that the project duration can be reduced duly
by simultaneous crashing of activities in the parallel critical paths
Step 5 – Crashing as per Steps 3 and 4, one reaches a point when further crashing is either not
possible or does not result in the reduction of crashing of project duration
Step 6 – Compute the total project cost by adding corresponding fixed cost to the direct cost, which
is obtained by adding the crashing cost cumulatively to the normal cost