Embed Size (px)
Citation preview

Consumer Analyst Group of New York
(CAGNY) Conference
February 20, 2013
Jacek Olczak
Chief Financial Officer
Philip Morris International
2
Forward-Looking and Cautionary Statements
● This presentation and related discussion contain forward-looking statements. Achievement of projected
results is subject to risks, uncertainties and inaccurate assumptions, and PMI is identifying important
factors that, individually or in the aggregate, could cause actual results to differ materially from those
contained in any forward-looking statements made by PMI
● PMI’s business risks include: significant increases in cigarette-related taxes; the imposition of
discriminatory excise tax structures; fluctuations in customer inventory levels due to increases in product
taxes and prices; increasing marketing and regulatory restrictions, often with the goal of reducing or
preventing the use of tobacco products; health concerns relating to the use of tobacco products and
exposure to environmental tobacco smoke; litigation related to tobacco use; intense competition; the
effects of global and individual country economic, regulatory and political developments; changes in adult
smoker behavior; lost revenues as a result of counterfeiting, contraband and cross-border purchases;
governmental investigations; unfavorable currency exchange rates and currency devaluations; adverse
changes in applicable corporate tax laws; adverse changes in the cost and quality of tobacco and other
agricultural products and raw materials; and the integrity of its information systems. PMI’s future
profitability may also be adversely affected should it be unsuccessful in its attempts to produce products
with the potential to reduce the risk of smoking-related diseases; if it is unable to successfully introduce
new products, promote brand equity, enter new markets or improve its margins through increased prices
and productivity gains; if it is unable to expand its brand portfolio internally or through acquisitions and the
development of strategic business relationships; or if it is unable to attract and retain the best global talent
● PMI is further subject to other risks detailed from time to time in its publicly filed documents, including the
Form 10-Q for the quarter ended September 30, 2012. PMI cautions that the foregoing list of important
factors is not a complete discussion of all potential risks and uncertainties. PMI does not undertake to
update any forward-looking statement that it may make from time to time, except in the normal course of
its public disclosure obligations
● A glossary of terms and reconciliations of non-GAAP measures included in this presentation to the most
comparable GAAP measures are provided at the end of this presentation and are posted on our web site
at www.pmi.com
3
Agenda
● Strong performance in 2012
● Tobacco industry remains attractive
● PMI should continue to outperform
● Incremental growth opportunities
● Strong emphasis on returning cash to our shareholders
4
2012: Another Solid Year for PMI
● Strong organic volume growth
● Key brands performed well
● Pricing power remained strong
● Moderate cost increases largely offset by productivity
gains
● Continued investments in our business
● EPS growth at top end of target range
● $12 billion returned to our shareholders
6
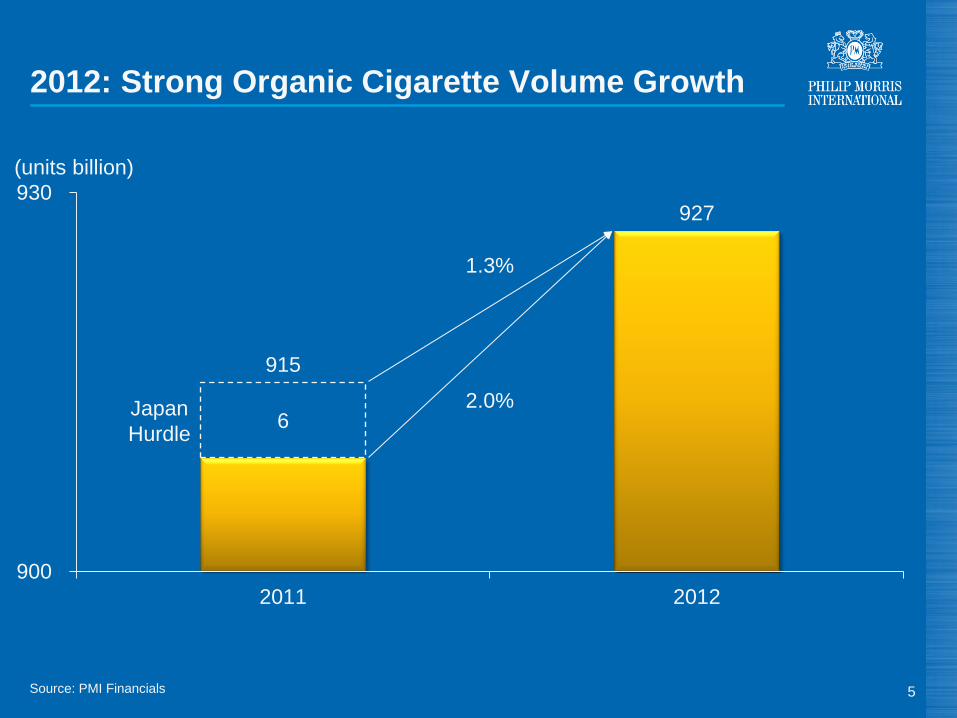
915
927
900
930
2011 2012
2012: Strong Organic Cigarette Volume Growth
5
(units billion)
Japan
Hurdle
1.3%
2.0%
Source: PMI Financials
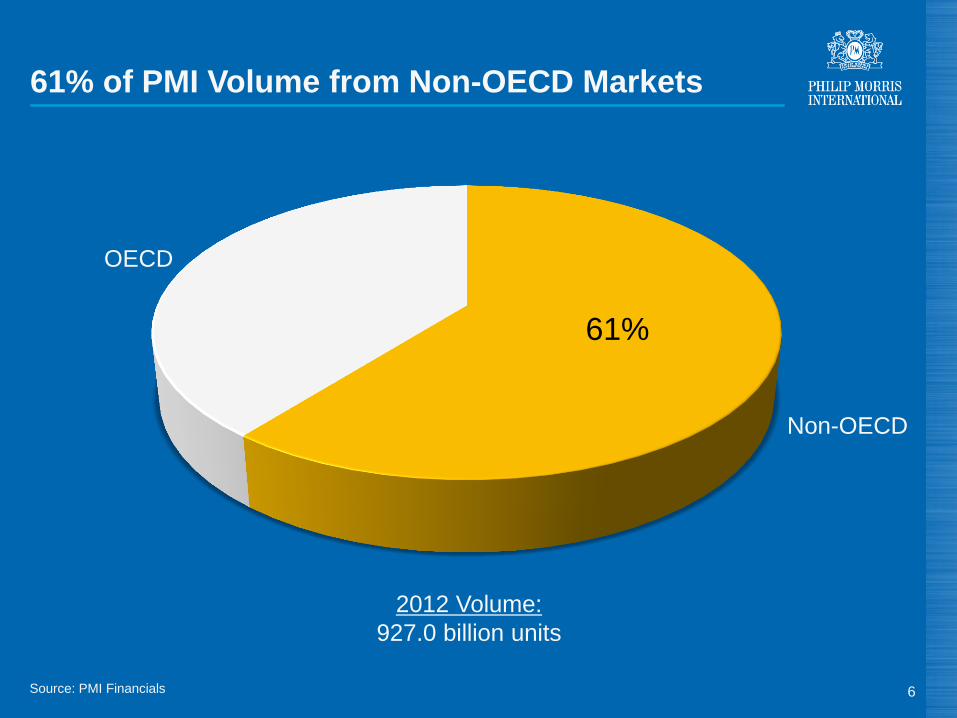
61% of PMI Volume from Non-OECD Markets
6
2012 Volume:
927.0 billion units
Non-OECD
OECD
Source: PMI Financials
61%
7
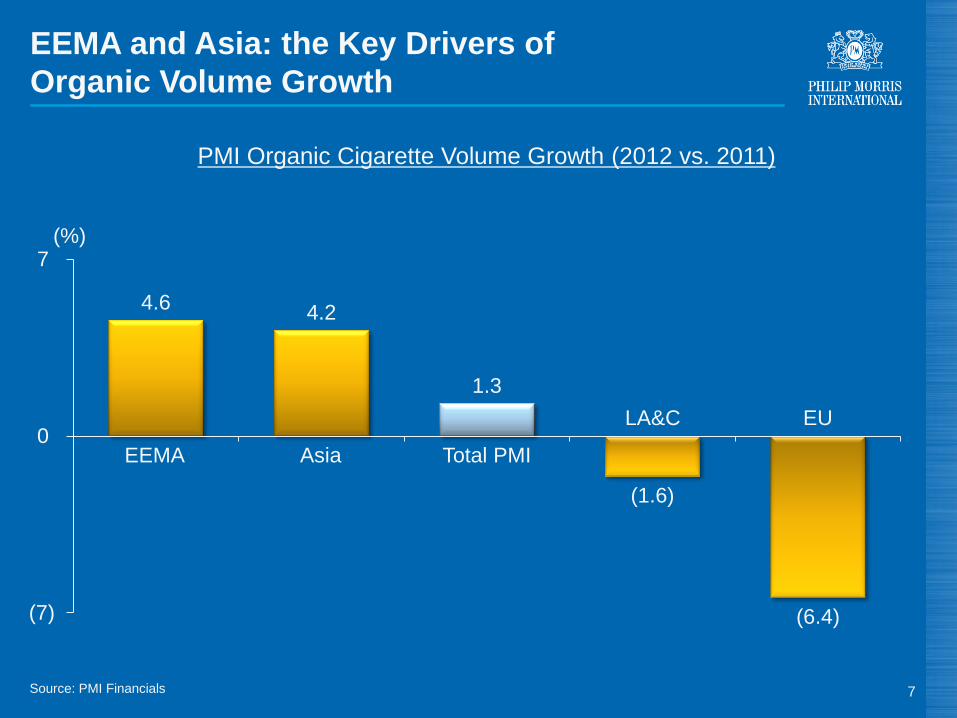
Source: PMI Financials
EEMA and Asia: the Key Drivers of
Organic Volume Growth
4.6 4.2
1.3
(1.6)
(6.4) (7)
0
7
PMI Organic Cigarette Volume Growth (2012 vs. 2011)
EEMA Asia
Total PMI
(%)
LA&C EU
(a) Excluding China
(b) Also excluding the USA
Source: PMI estimates 8
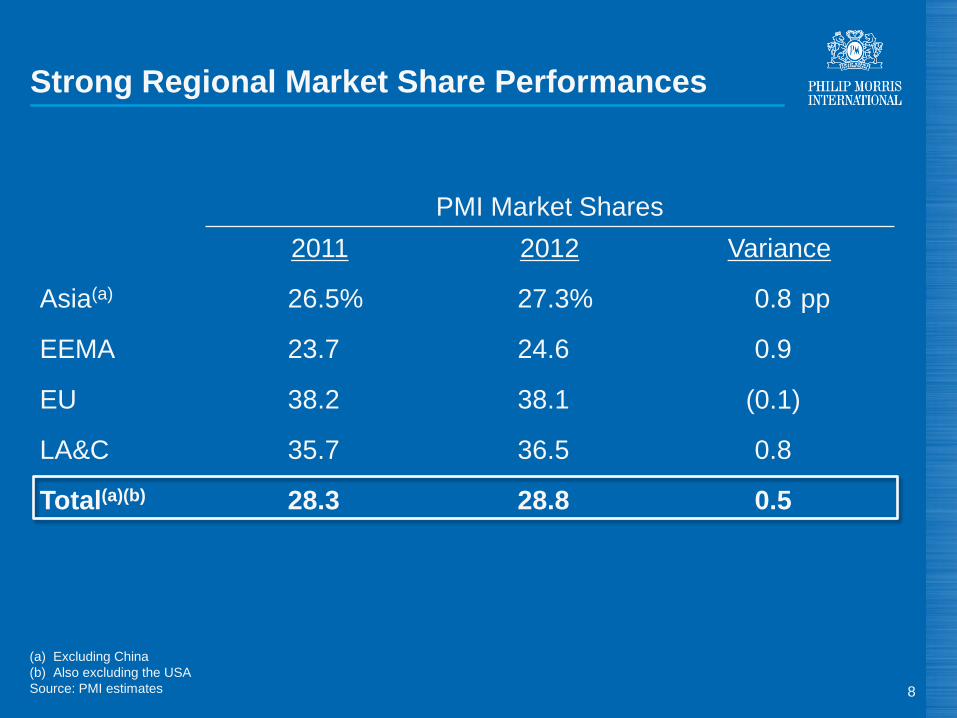
Strong Regional Market Share Performances
PMI Market Shares
2011 2012 Variance
Asia(a) 26.5% 27.3% 0.8)pp
EEMA 23.7 24.6 0.9
EU 38.2 38.1
LA&C 35.7 36.5 0.8
Total(a)(b) 28.3 28.8 0.5
(0.1)
9
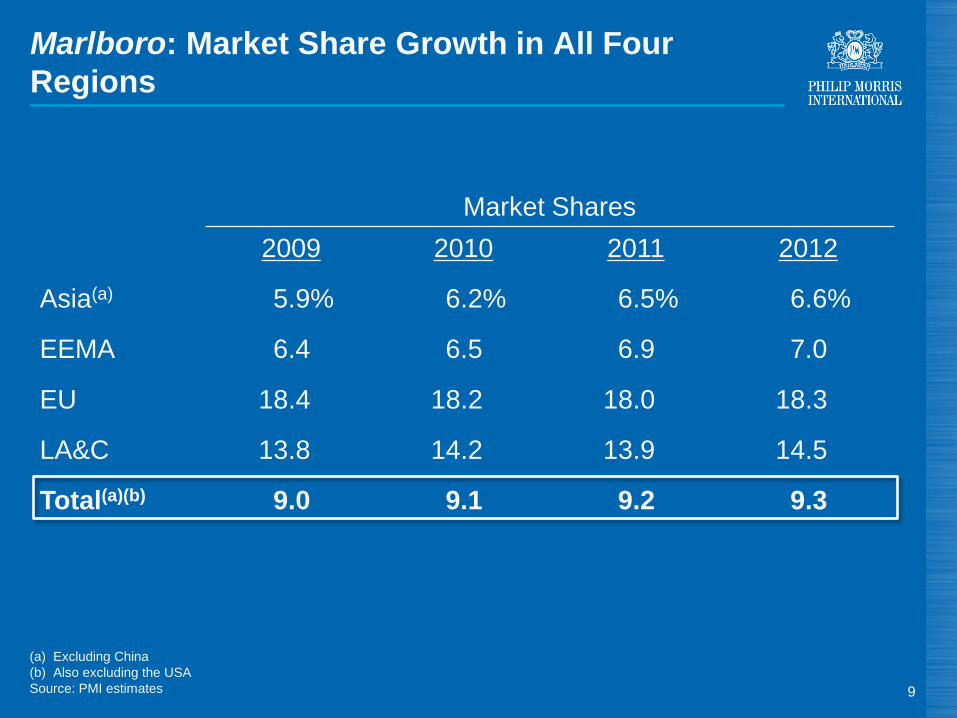
Marlboro: Market Share Growth in All Four
Regions
Market Shares
2009 2010 2011 2012
Asia(a) 5.9% 6.2% 6.5% 6.6%
EEMA 6.4 6.5 6.9 7.0
EU 18.4 18.2 18.0 18.3
LA&C 13.8 14.2 13.9 14.5
Total(a)(b) 9.0 9.1 9.2 9.3
(a) Excluding China
(b) Also excluding the USA
Source: PMI estimates
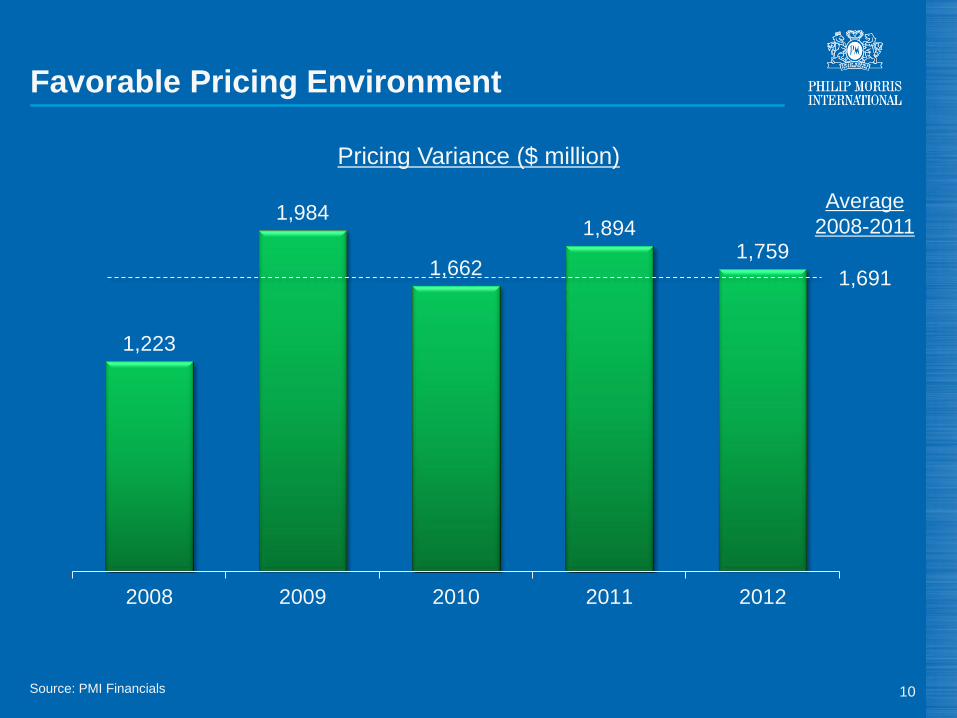
Source: PMI Financials
1,223
1,984
1,662
1,894 1,759
2008 2009 2010 2011 2012
Pricing Variance ($ million)
Favorable Pricing Environment
10
Average
2008-2011
1,691
11
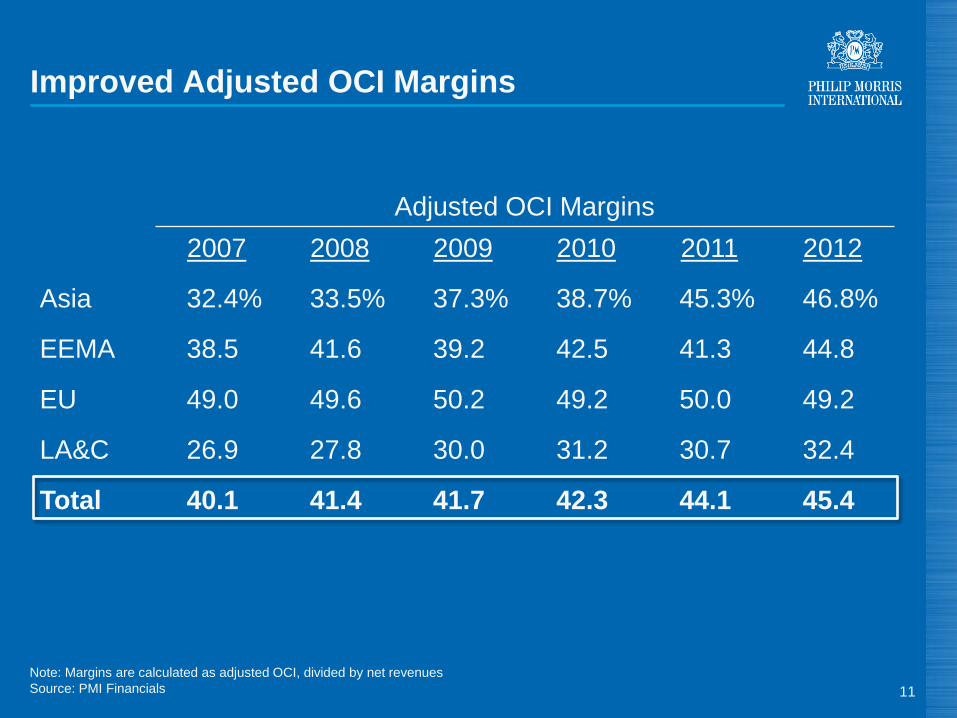
Adjusted OCI Margins
2007 2008 2009 2010 2011 2012
Asia 32.4% 33.5% 37.3% 38.7% 45.3% 46.8%
EEMA 38.5 41.6 39.2 42.5 41.3 44.8
EU 49.0 49.6 50.2 49.2 50.0 49.2
LA&C 26.9 27.8 30.0 31.2 30.7 32.4
Total 40.1 41.4 41.7 42.3 44.1 45.4
Improved Adjusted OCI Margins
Note: Margins are calculated as adjusted OCI, divided by net revenues
Source: PMI Financials
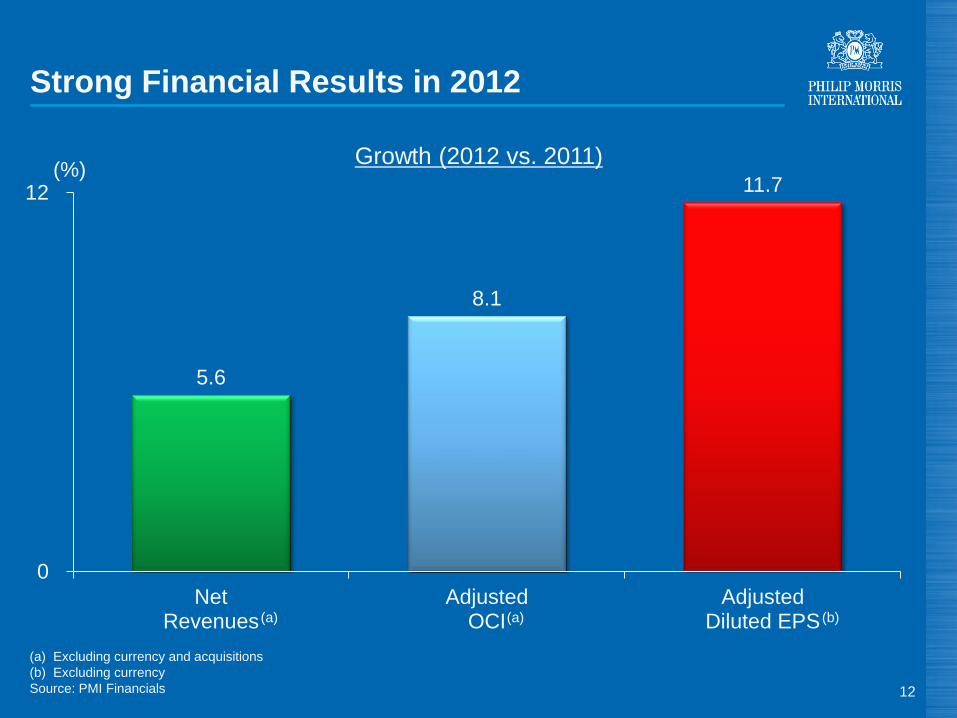
(a) Excluding currency and acquisitions
(b) Excluding currency
Source: PMI Financials
5.6
8.1
11.7
0
12
NetRevenues
AdjustedOCI
AdjustedDiluted EPS
Strong Financial Results in 2012
12
(a)
(%)
(a) (b)
Growth (2012 vs. 2011)
13
Tobacco Industry: An Attractive Sector
● Favorable pricing environment:
- Governments look to increase their revenues and lower tobacco
consumption based on higher cigarette prices
- Elasticity of demand is relatively low
14
Tobacco Industry: An Attractive Sector
● Favorable pricing environment:
- Governments look to increase their revenues and lower tobacco
consumption based on higher cigarette prices
- Elasticity of demand is relatively low
● Rational excise tax environment:
- Governments recognize revenue predictability enhanced by:
• Regular, reasonable increases
• High proportion of specific elements in excise tax structure
• Multi-year programs
• Inflation indexation
• Harmonization of taxation between cigarettes and fine cut
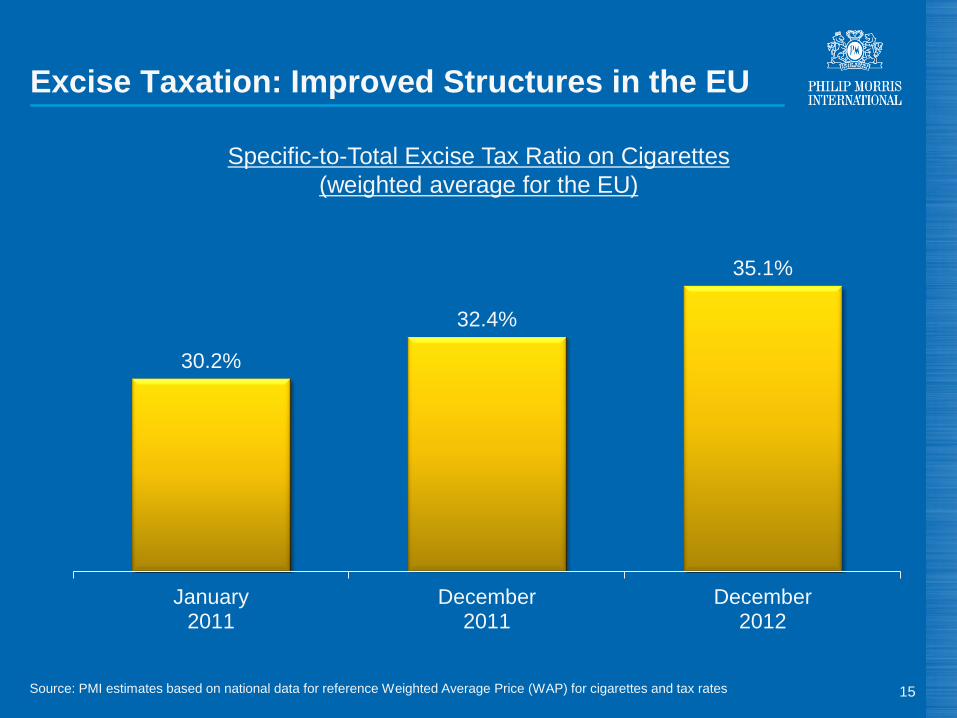
Source: PMI estimates based on national data for reference Weighted Average Price (WAP) for cigarettes and tax rates
30.2%
32.4%
35.1%
January2011
December2011
December2012
Excise Taxation: Improved Structures in the EU
15
Specific-to-Total Excise Tax Ratio on Cigarettes
(weighted average for the EU)
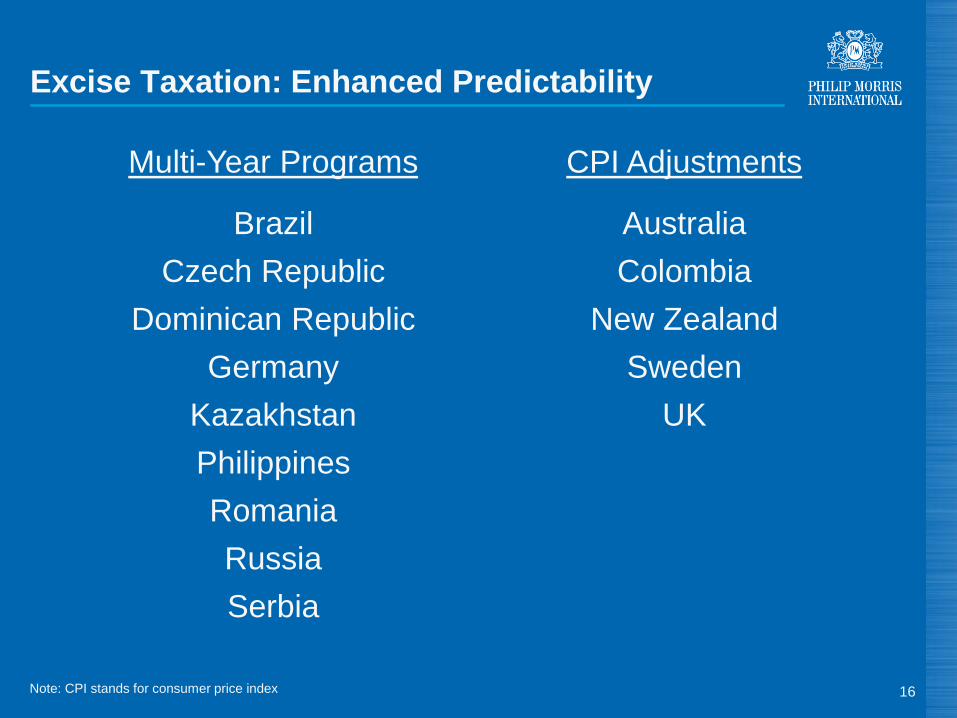
Excise Taxation: Enhanced Predictability
16
Multi-Year Programs CPI Adjustments
Brazil Australia
Czech Republic Colombia
Dominican Republic New Zealand
Germany Sweden
Kazakhstan UK
Philippines
Romania
Russia
Serbia
Note: CPI stands for consumer price index
17
Tobacco Industry: An Attractive Sector
● Favorable pricing environment:
- Governments look to increase their revenues and lower tobacco
consumption based on higher cigarette prices
- Elasticity of demand is relatively low
● Rational excise tax environment:
- Governments recognize revenue predictability enhanced by:
• Regular, reasonable increases
• High proportion of specific elements in excise tax structure
• Multi-year programs
• Inflation indexation
• Harmonization of taxation between cigarettes and fine cut
- Exception in 2013 is the Philippines
18
Tobacco Industry: An Attractive Sector
● Favorable pricing environment:
- Governments look to increase their revenues and lower tobacco
consumption based on higher cigarette prices
- Elasticity of demand is relatively low
● Rational excise tax environment:
- Governments recognize revenue predictability enhanced by:
• Regular, reasonable increases
• High proportion of specific elements in excise tax structure
• Multi-year programs
• Inflation indexation
• Harmonization of taxation between cigarettes and fine cut
- Exception in 2013 is the Philippines
● Challenging but manageable regulatory environment
19
Plain Packaging: Summary
● 6 of 7 High Court judges in Australia recognized that plain
packaging law deprived tobacco companies of valuable
intellectual properties
● Plain packaging is not mandated in the proposed EU
Tobacco Products Directive ("TPD")
20
● Proposal from EU Commission
● Subject to review prior to adoption by the Council of
Ministers and the European Parliament
● Implementation not expected until 2015/2016
● As proposed, contains a number of measures that we
believe have no credible scientific basis:
- Ban on menthol and slimmer diameter cigarettes
- 75% graphic health warnings
● We will seek to ensure flaws in current proposal are
addressed
EU: TPD Proposal
21
PMI Should Continue to Outperform
● Overall market leadership and broad global footprint
● Superior brand portfolio
● Favorable market trends
● Higher conversion of revenues into free cash flow
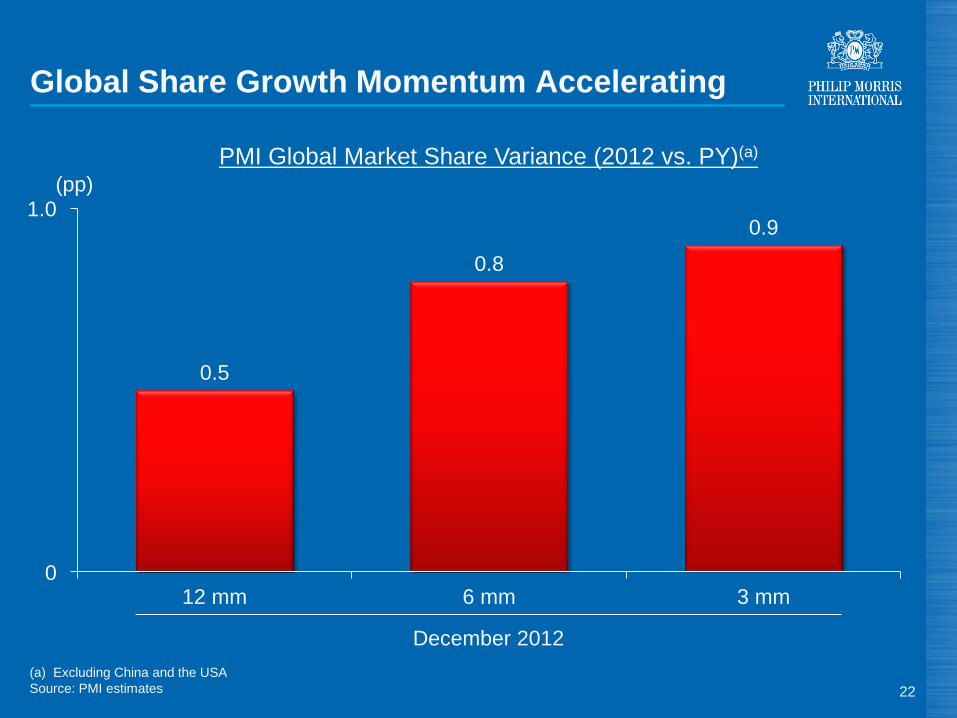
(a) Excluding China and the USA
Source: PMI estimates
0.5
0.8
0.9
0.0
1.0
12 mm 6 mm 3 mm
Global Share Growth Momentum Accelerating
22
PMI Global Market Share Variance (2012 vs. PY)(a)
0
1.0 (pp)
December 2012
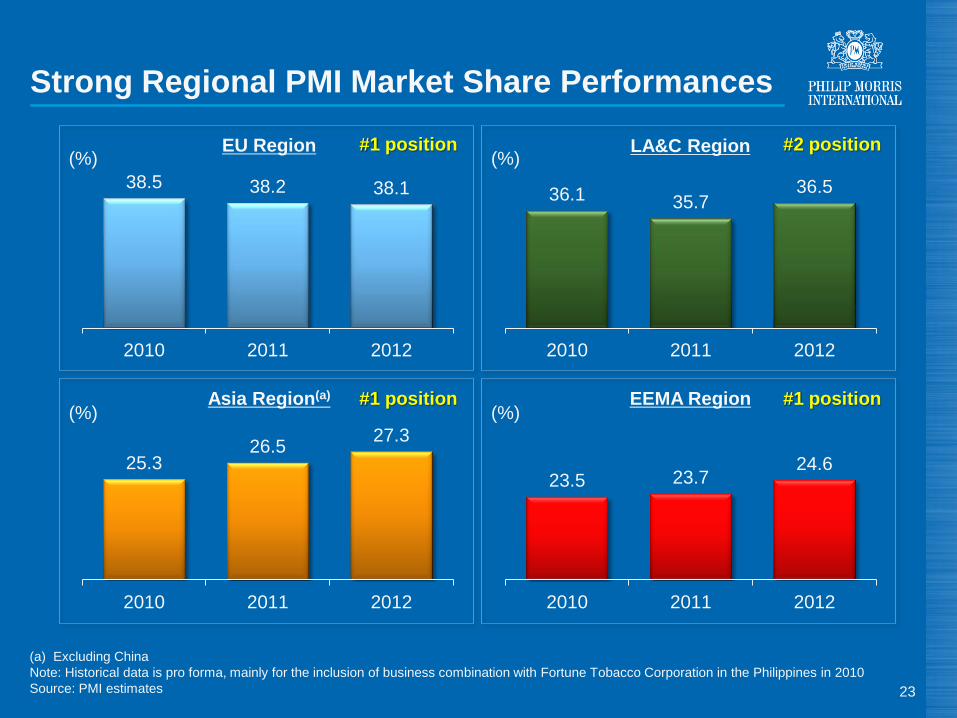
Strong Regional PMI Market Share Performances
23
38.5 38.2 38.1
2010 2011 2012
36.1 35.7 36.5
2010 2011 2012
25.3 26.5
27.3
2010 2011 2012
23.5 23.7 24.6
2010 2011 2012
LA&C Region
EEMA Region Asia Region(a)
EU Region #1 position (%) (%)
(%) (%)
#2 position
#1 position #1 position
(a) Excluding China
Note: Historical data is pro forma, mainly for the inclusion of business combination with Fortune Tobacco Corporation in the Philippines in 2010
Source: PMI estimates
Source: PMI estimates
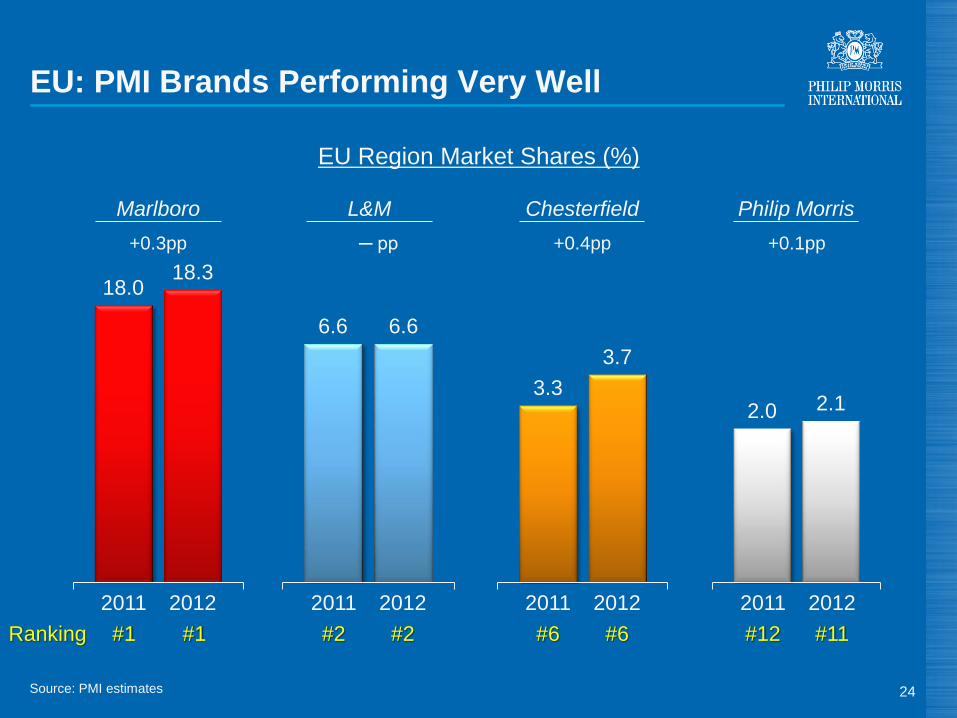
18.0 18.3
EU: PMI Brands Performing Very Well
24
EU Region Market Shares (%)
6.6 6.6
3.3
3.7
2.0 2.1
2011 2012
+0.3pp ─ pp +0.4pp +0.1pp
Marlboro L&M Chesterfield Philip Morris
2011 2012 2011 2012 2011 2012
#1 #1 #2 #2 #6 #6 #12 #11 Ranking

EU: Unemployment Key Driver of Cigarette
Industry Volume Decline
25
Note: Ger. is Germany
Source: Eurostat and PMI estimates
Unemployment Rates (%) Cigarette Industry Volume Decline (%)
(2012 vs. 2011)
Germany
Poland
France
Spain
5.6
9.9 9.9 10.0 9.5
23.2
5.3
10.6 10.6 10.7 11.2
26.1
Ger. France Poland EU Italy Spain
(11.7)
(7.9)
(6.3)
(6.1)
(4.9)
(1.2)
Italy
EU
Region
December 2011 December 2012
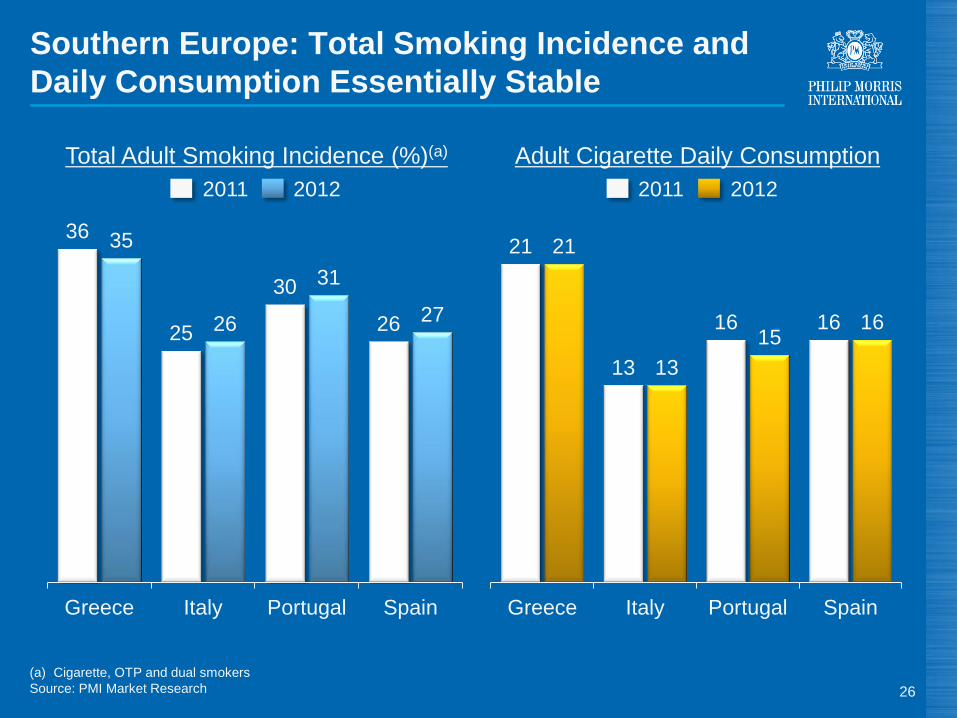
(a) Cigarette, OTP and dual smokers
Source: PMI Market Research
21
13
16 16
21
13
15 16
Greece Italy Portugal Spain
Southern Europe: Total Smoking Incidence and
Daily Consumption Essentially Stable
26
36
25
30
26
35
26
31
27
Greece Italy Portugal Spain
Total Adult Smoking Incidence (%)(a) Adult Cigarette Daily Consumption
2011 2012 2011 2012
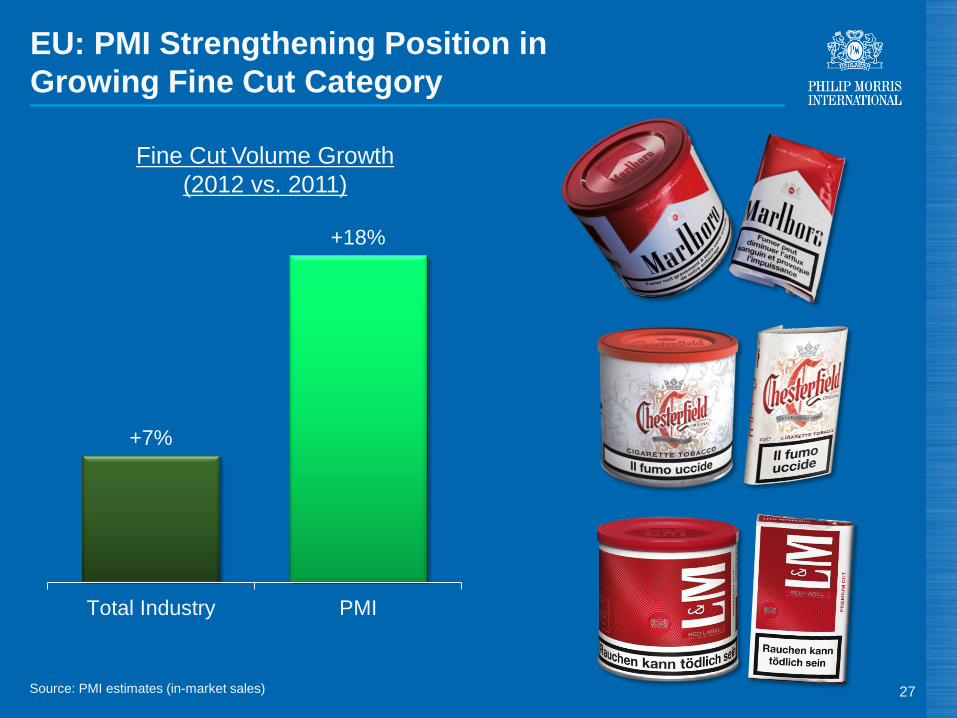
Source: PMI estimates (in-market sales)
EU: PMI Strengthening Position in
Growing Fine Cut Category
27
+7%
+18%
Total Industry PMI
Fine Cut Volume Growth
(2012 vs. 2011)
EU: Preconditions for Improvement in Cigarette
Industry Volume Trends
● Lower unemployment levels
● Reduction in tax differential between cigarettes and fine cut
● Stronger efforts to curtail illicit trade
28
Source: PMI estimates
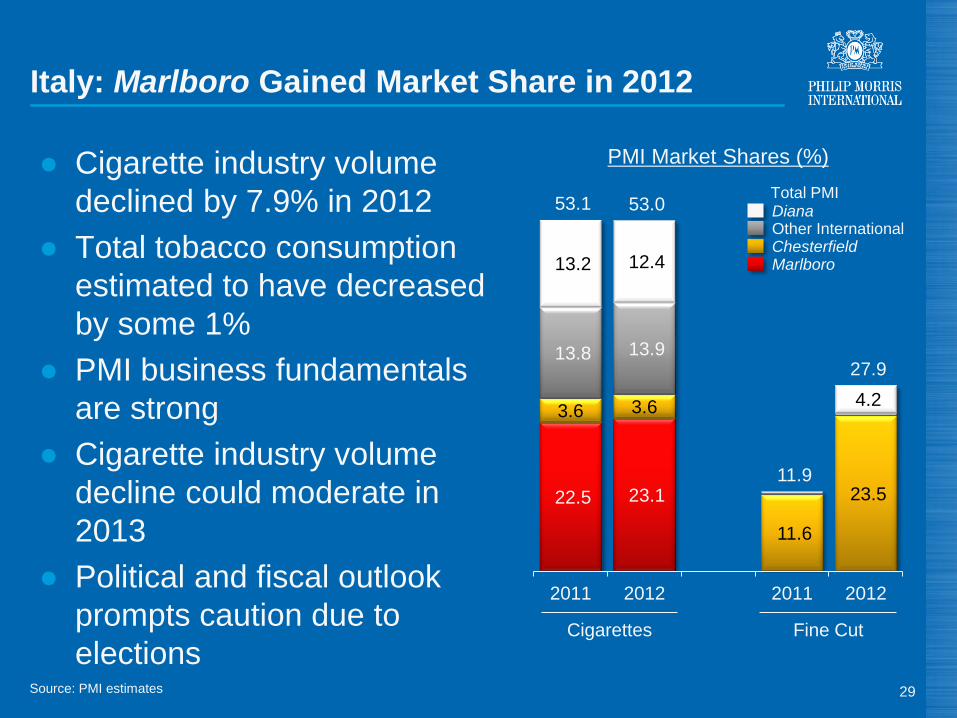
Italy: Marlboro Gained Market Share in 2012
29
22.5 23.1
11.6
23.5
3.6 3.6 4.2
13.8 13.9
13.2 12.4
53.1 53.0
11.9
27.9
2011 2012 2011 2012
● Cigarette industry volume
declined by 7.9% in 2012
● Total tobacco consumption
estimated to have decreased
by some 1%
● PMI business fundamentals
are strong
● Cigarette industry volume
decline could moderate in
2013
● Political and fiscal outlook
prompts caution due to
elections
PMI Market Shares (%)
Cigarettes Fine Cut
Chesterfield
Total PMI Diana
Marlboro
Other International
Source: PMI estimates
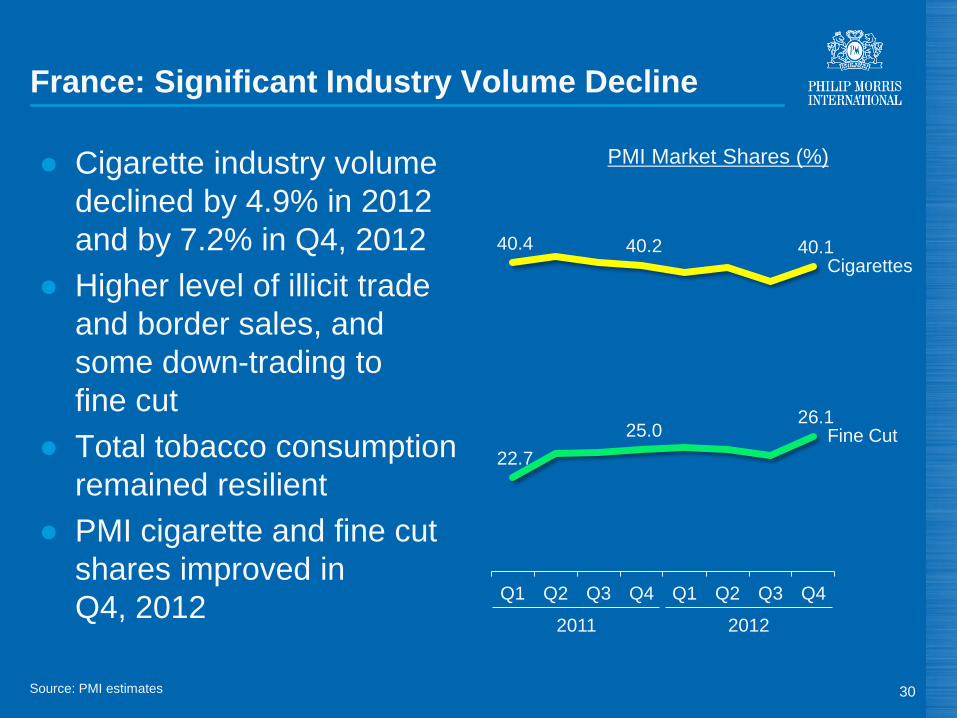
France: Significant Industry Volume Decline
30
● Cigarette industry volume
declined by 4.9% in 2012
and by 7.2% in Q4, 2012
● Higher level of illicit trade
and border sales, and
some down-trading to
fine cut
● Total tobacco consumption
remained resilient
● PMI cigarette and fine cut
shares improved in
Q4, 2012
40.4 40.2 40.1
22.7
25.0 26.1
Q1 Q2 Q3 Q4 Q1 Q2 Q3 Q4
Cigarettes
Fine Cut
2012 2011
PMI Market Shares (%)
Source: PMI estimates
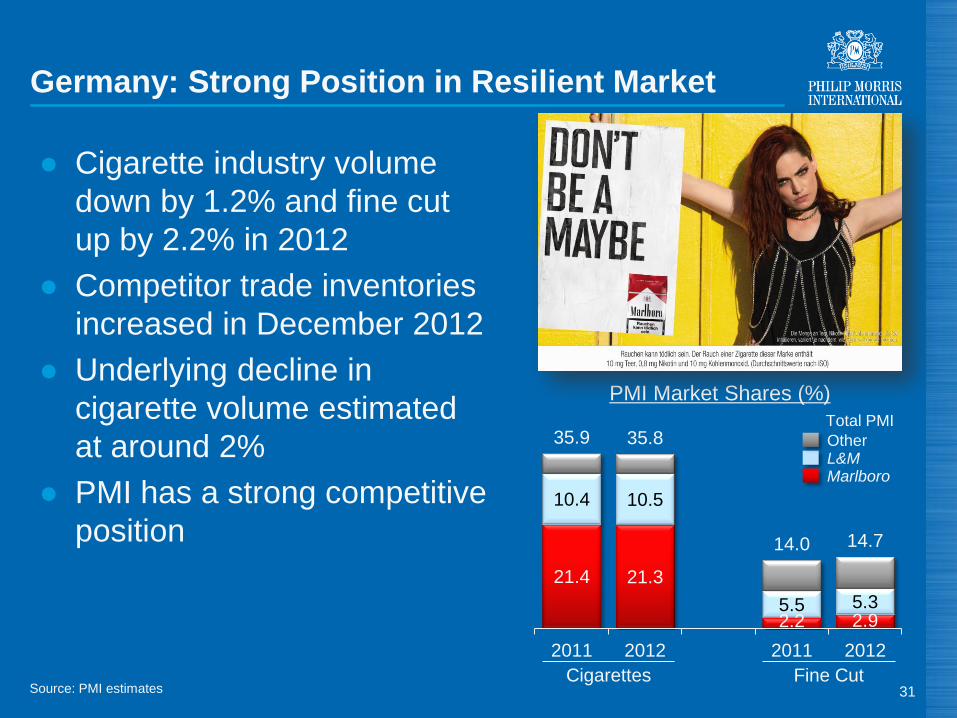
Germany: Strong Position in Resilient Market
31
● Cigarette industry volume
down by 1.2% and fine cut
up by 2.2% in 2012
● Competitor trade inventories
increased in December 2012
● Underlying decline in
cigarette volume estimated
at around 2%
● PMI has a strong competitive
position
21.4 21.3
2.2 2.9
10.4 10.5
5.5 5.3
35.9 35.8
14.0 14.7
2011 2012 2011 2012
PMI Market Shares (%)
L&M
Total PMI
Marlboro
Other
Cigarettes Fine Cut
Source: PMI Financials
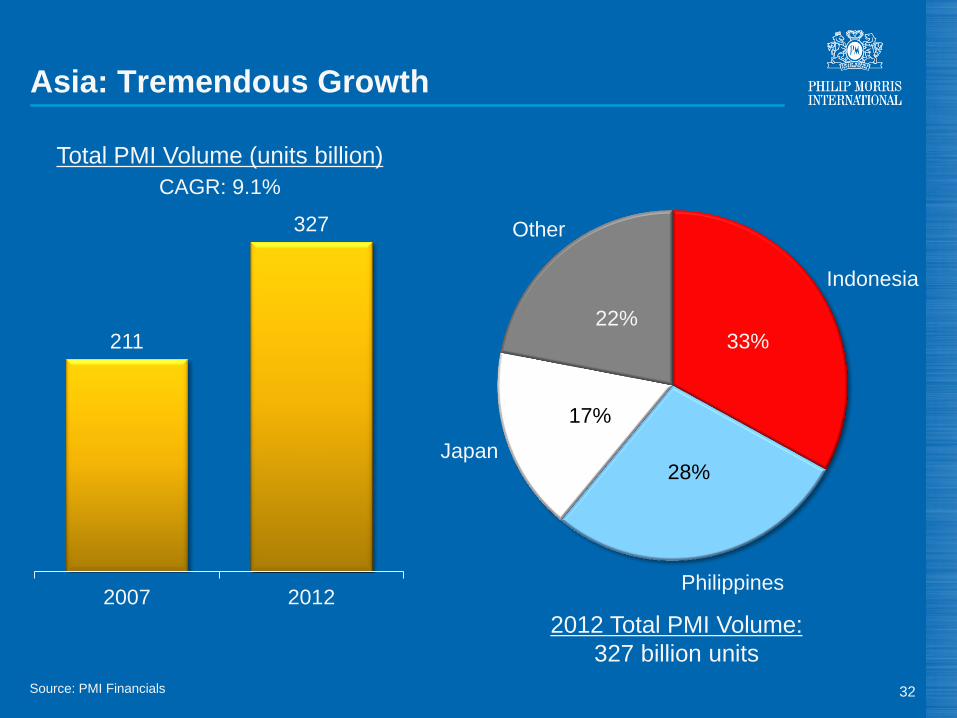
Asia: Tremendous Growth
32
33%
28%
17%
22%
2012 Total PMI Volume:
327 billion units
Indonesia
Philippines
Japan
Other
211
327
2007 2012
Total PMI Volume (units billion)
CAGR: 9.1%
Source: PMI estimates (based on expanded Nielsen coverage) and PMI Financials
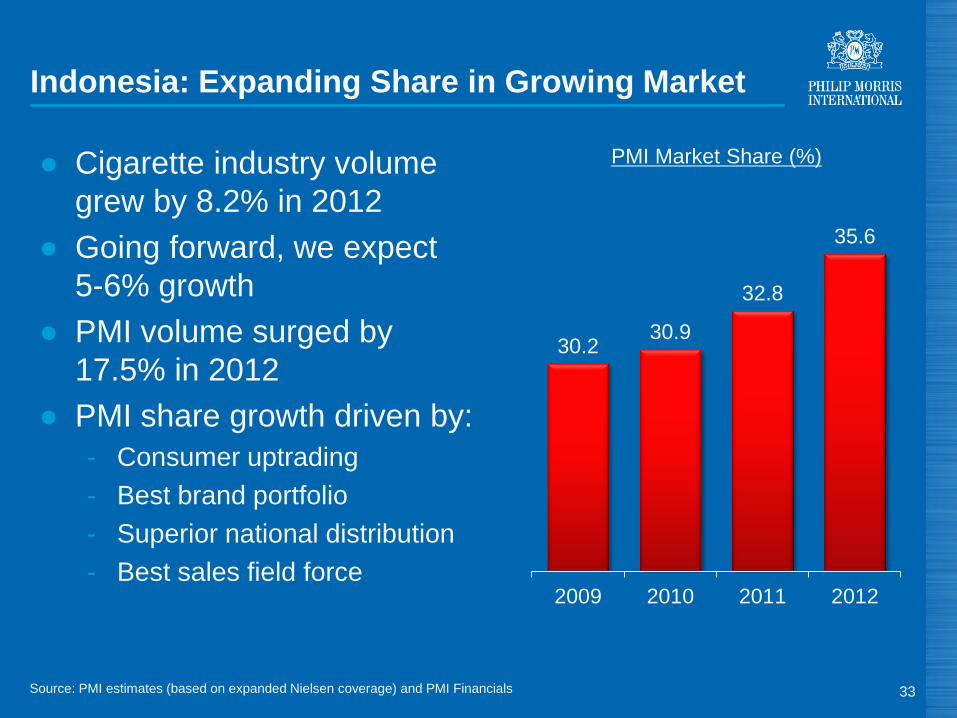
● Cigarette industry volume
grew by 8.2% in 2012
● Going forward, we expect
5-6% growth
● PMI volume surged by
17.5% in 2012
● PMI share growth driven by:
- Consumer uptrading
- Best brand portfolio
- Superior national distribution
- Best sales field force
Indonesia: Expanding Share in Growing Market
33
30.2 30.9
32.8
35.6
2009 2010 2011 2012
PMI Market Share (%)
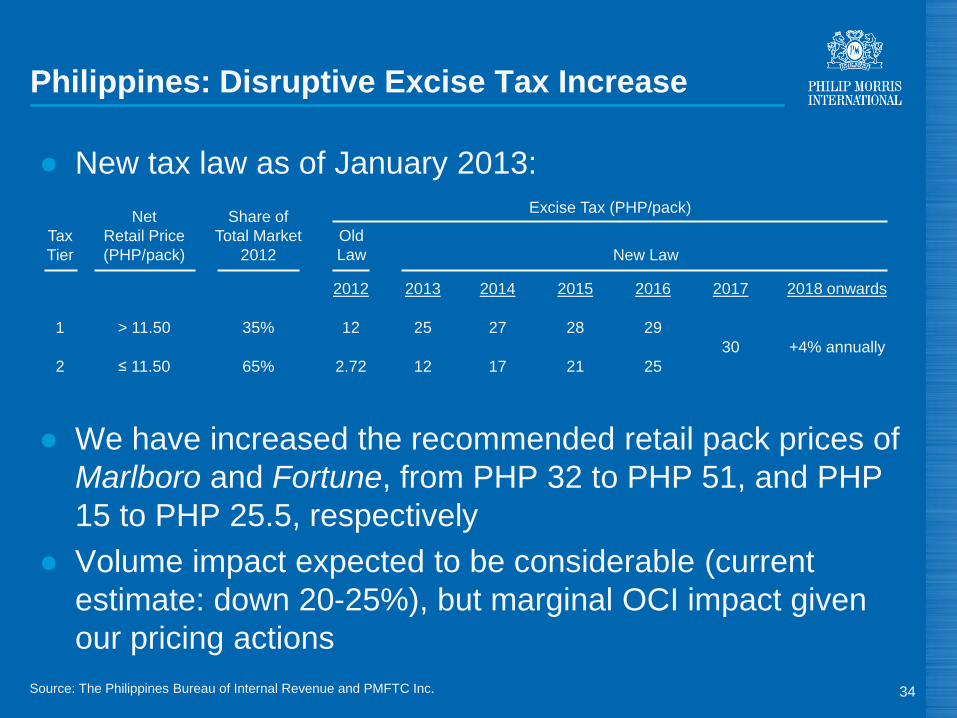
● New tax law as of January 2013:
● We have increased the recommended retail pack prices of
Marlboro and Fortune, from PHP 32 to PHP 51, and PHP
15 to PHP 25.5, respectively
● Volume impact expected to be considerable (current
estimate: down 20-25%), but marginal OCI impact given
our pricing actions
Source: The Philippines Bureau of Internal Revenue and PMFTC Inc.
Philippines: Disruptive Excise Tax Increase
34
Tax
Tier
Net
Retail Price
(PHP/pack)
Share of
Total Market
2012
New Law
2012 2013 2014 2015 2016 2017 2018 onwards
1 > 11.50 35% 12 25 27 28 29
30 +4% annually
2 ≤ 11.50 65% 2.72 12 17 21 25
Excise Tax (PHP/pack)
Old
Law
Source: PMI estimates and Tobacco Institute of Japan
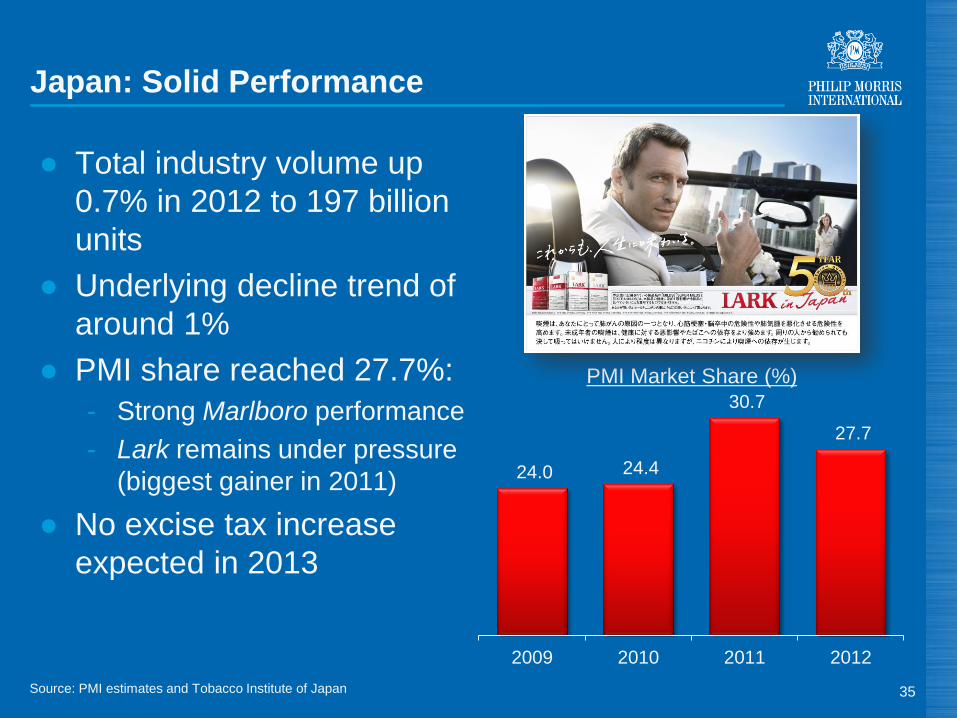
Japan: Solid Performance
35
24.0 24.4
30.7
27.7
2009 2010 2011 2012
● Total industry volume up
0.7% in 2012 to 197 billion
units
● Underlying decline trend of
around 1%
● PMI share reached 27.7%:
- Strong Marlboro performance
- Lark remains under pressure
(biggest gainer in 2011)
● No excise tax increase
expected in 2013
PMI Market Share (%)
(a) Including “Levant” area
Source: PMI Financials
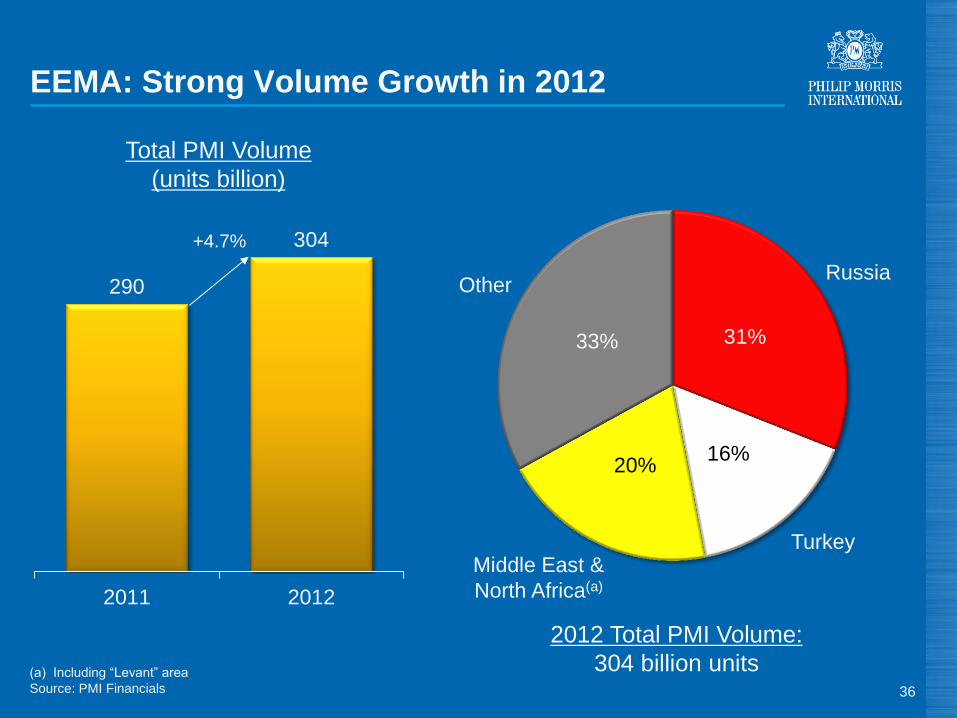
EEMA: Strong Volume Growth in 2012
36
31%
16% 20%
33%
2012 Total PMI Volume:
304 billion units
Russia
Turkey
Other 290
304
2011 2012
Total PMI Volume
(units billion)
+4.7%
Middle East &
North Africa(a)
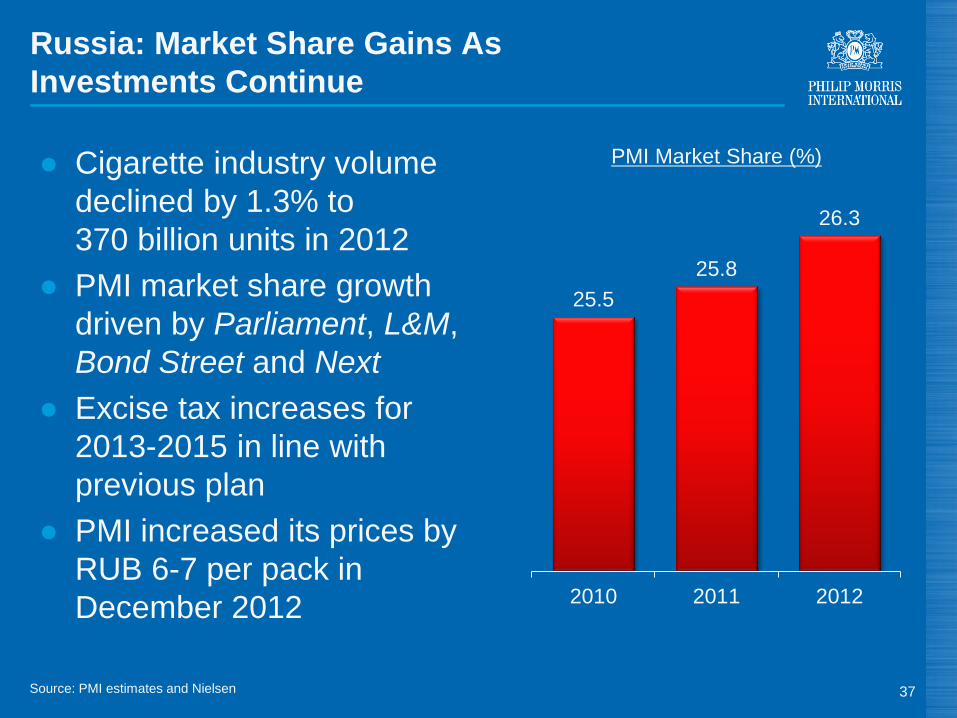
Russia: Market Share Gains As
Investments Continue
37
25.5
25.8
26.3
2010 2011 2012
PMI Market Share (%)
Source: PMI estimates and Nielsen
● Cigarette industry volume
declined by 1.3% to
370 billion units in 2012
● PMI market share growth
driven by Parliament, L&M,
Bond Street and Next
● Excise tax increases for
2013-2015 in line with
previous plan
● PMI increased its prices by
RUB 6-7 per pack in
December 2012
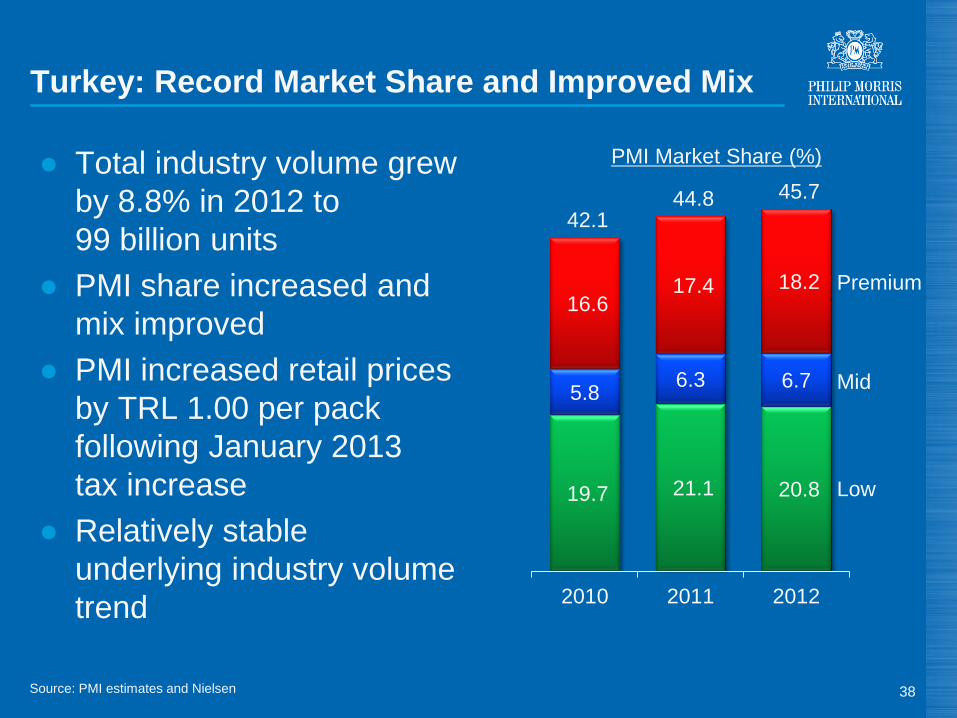
Turkey: Record Market Share and Improved Mix
38
19.7 21.1 20.8
5.8 6.3 6.7
16.6 17.4 18.2
42.1 44.8 45.7
2010 2011 2012
PMI Market Share (%)
Source: PMI estimates and Nielsen
● Total industry volume grew
by 8.8% in 2012 to
99 billion units
● PMI share increased and
mix improved
● PMI increased retail prices
by TRL 1.00 per pack
following January 2013
tax increase
● Relatively stable
underlying industry volume
trend
Premium
Mid
Low
Source: PMI estimates and PMI Financials
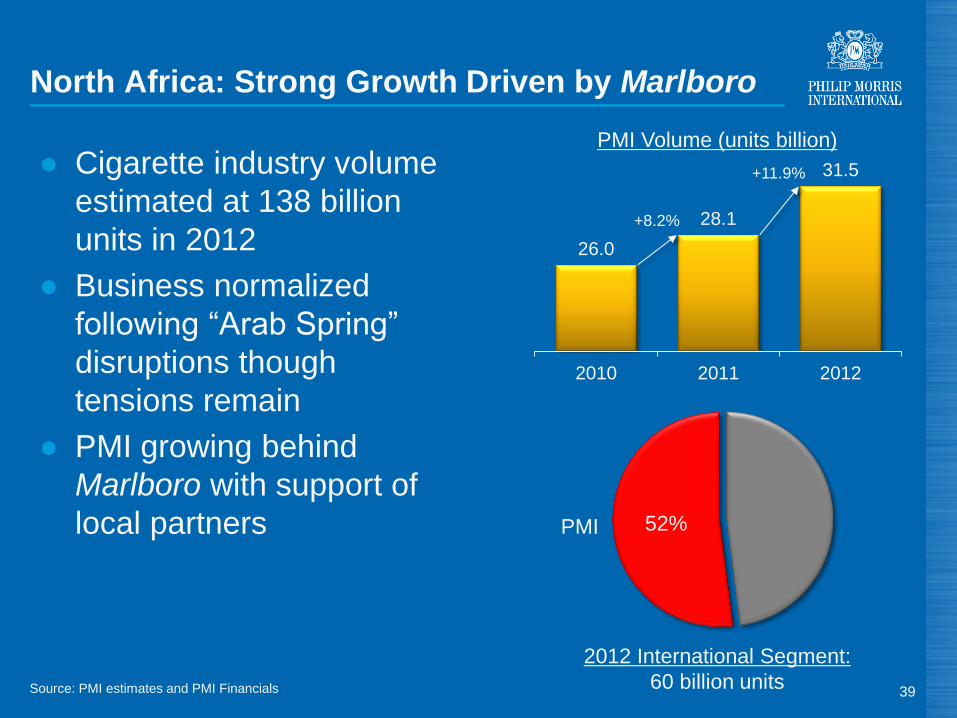
52%
26.0
28.1
31.5
2010 2011 2012
North Africa: Strong Growth Driven by Marlboro
39
● Cigarette industry volume
estimated at 138 billion
units in 2012
● Business normalized
following “Arab Spring”
disruptions though
tensions remain
● PMI growing behind
Marlboro with support of
local partners
PMI Volume (units billion)
2012 International Segment:
60 billion units
+8.2%
+11.9%
PMI
Note: Arg. is Argentina and Col. is Colombia
Source: PMI Financials and PMI estimates
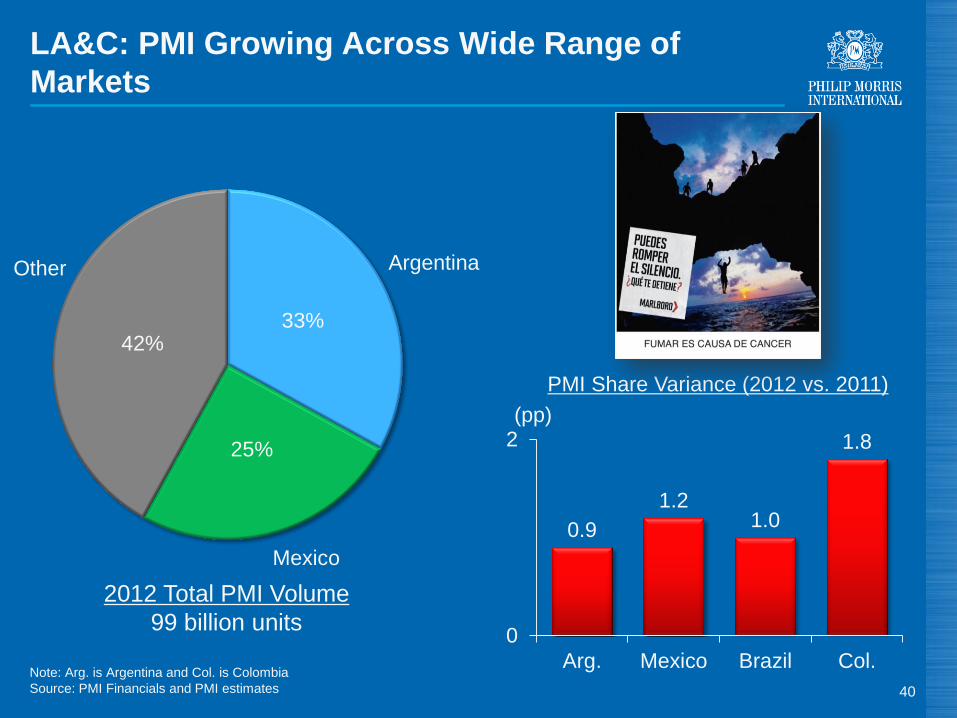
LA&C: PMI Growing Across Wide Range of
Markets
40
0.9
1.2 1.0
1.8
0
2
Arg. Mexico Brazil Col.
PMI Share Variance (2012 vs. 2011)
Argentina
(pp)
33%
25%
42%
2012 Total PMI Volume
99 billion units
Mexico
Other
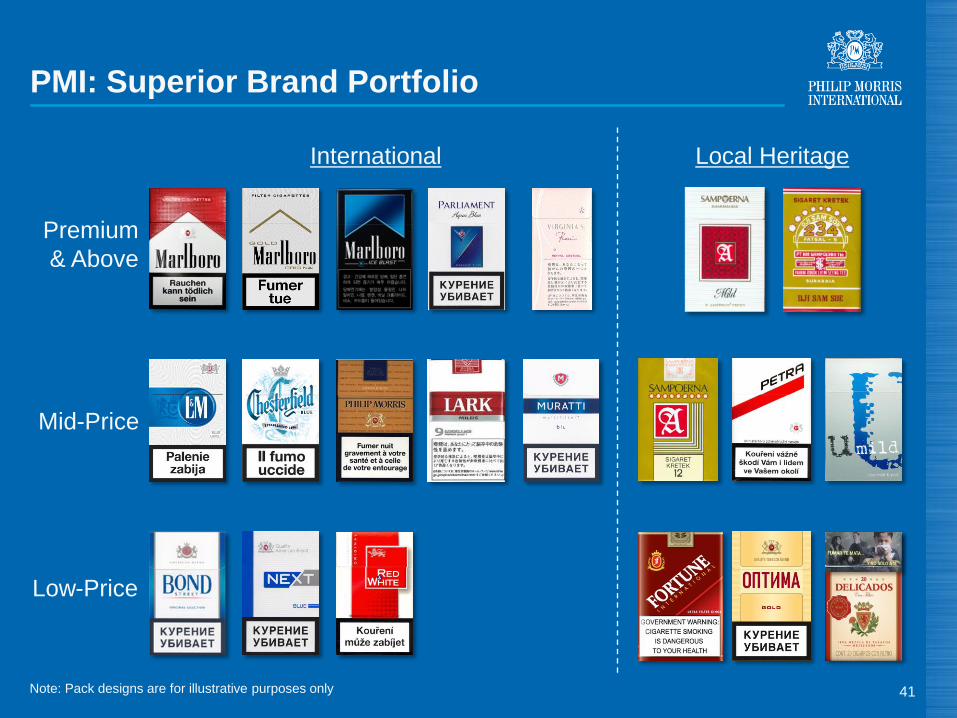
PMI: Superior Brand Portfolio
Mid-Price
Premium
& Above
Local Heritage International
Low-Price
Note: Pack designs are for illustrative purposes only 41

42
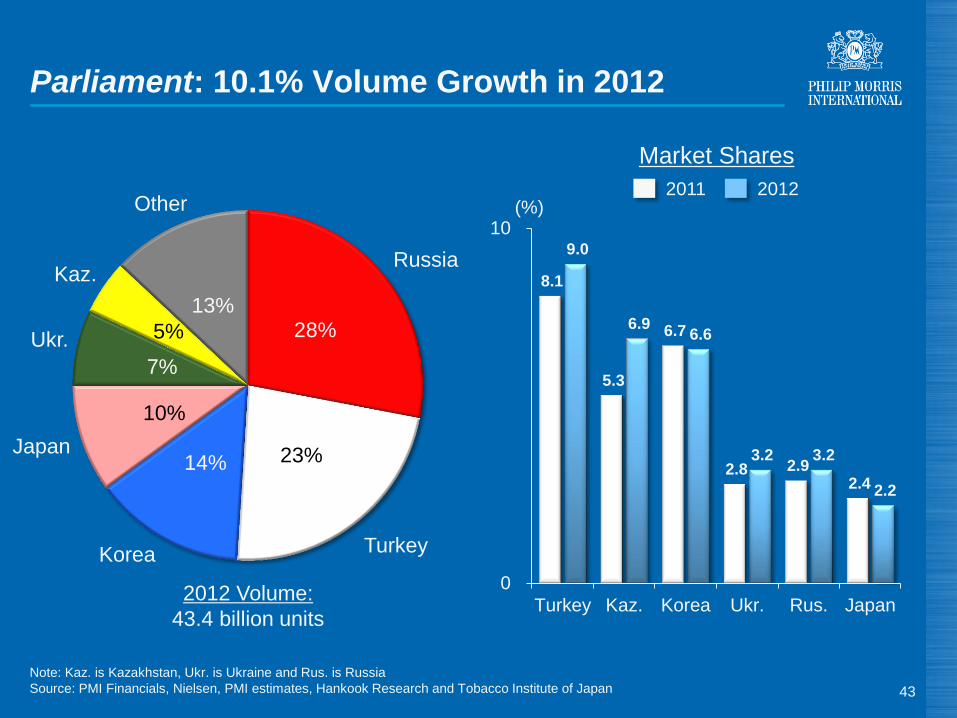
Note: Kaz. is Kazakhstan, Ukr. is Ukraine and Rus. is Russia
Source: PMI Financials, Nielsen, PMI estimates, Hankook Research and Tobacco Institute of Japan
Parliament: 10.1% Volume Growth in 2012
43
28%
23% 14%
10%
7%
5%
13%
Ukr.
Japan
Russia
Turkey
Kaz.
Korea
Other
8.1
5.3
6.7
2.8 2.9 2.4
9.0
6.9 6.6
3.2 3.2
2.2
0
10
Turkey Kaz. Korea Ukr. Rus. Japan
Market Shares
(%)
2012 Volume:
43.4 billion units
2011 2012

44
(a) Includes above premium
(b) Data currently under review following expansion of Nielsen coverage
(c) Excluding China and duty free
Note: SoM stands for share of market
Source: PMI estimates and Nielsen
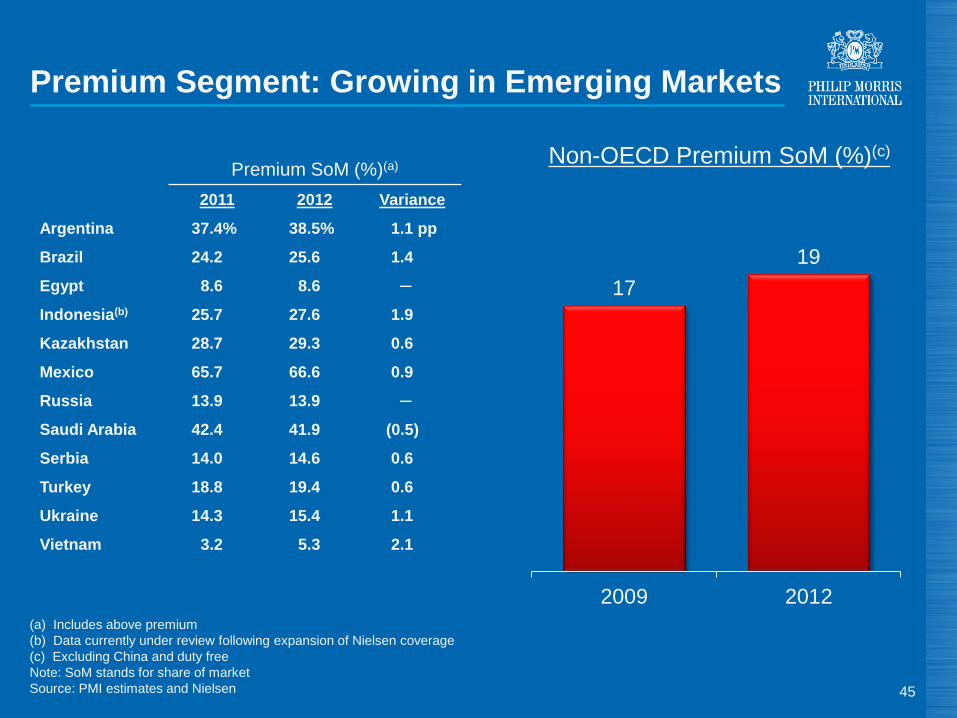
Premium Segment: Growing in Emerging Markets
45
17
19
2009 2012
Non-OECD Premium SoM (%)(c)
Premium SoM (%)(a)
2011 2012 Variance
Argentina 37.4% 38.5% 1.1 pp
Brazil 24.2 25.6 1.4
Egypt 8.6 8.6 ─
Indonesia(b) 25.7 27.6 1.9
Kazakhstan 28.7 29.3 0.6
Mexico 65.7 66.6 0.9
Russia 13.9 13.9 ─
Saudi Arabia 42.4 41.9
Serbia 14.0 14.6 0.6
Turkey 18.8 19.4 0.6
Ukraine 14.3 15.4 1.1
Vietnam 3.2 5.3 2.1
(0.5)
(a) Includes above premium
(b) Data currently under review following expansion of Nielsen coverage
Note: Arg. is Argentina, Indon. is Indonesia, Kaz. is Kazakhstan, Mex. is Mexico, Rus. is Russia, Saudi is Saudi Arabia and Ukr. is Ukraine
Source: PMI estimates and Nielsen
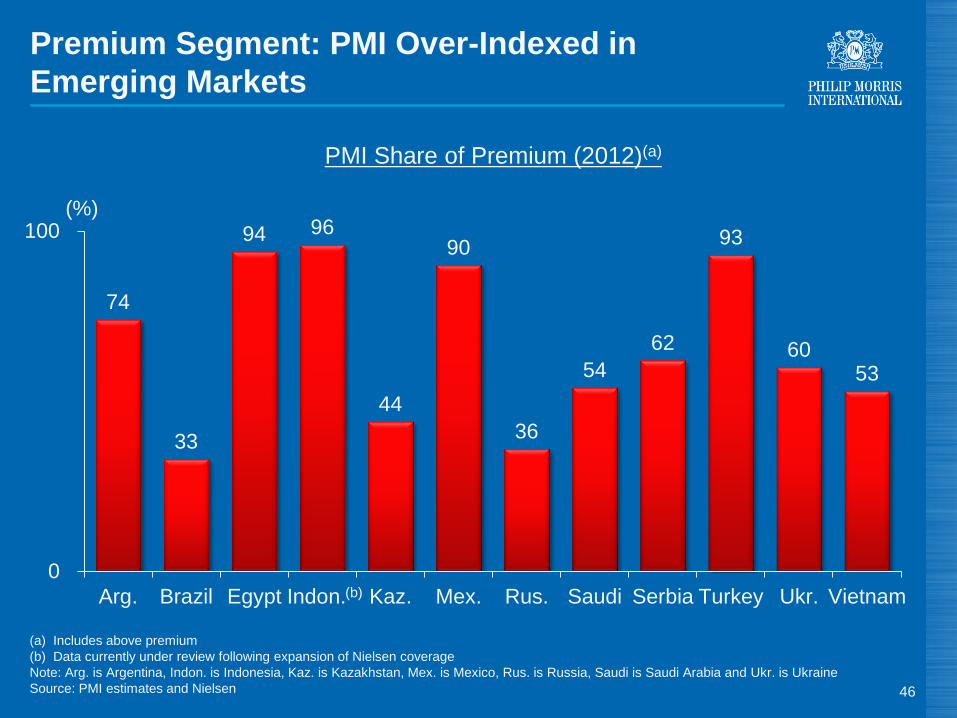
Premium Segment: PMI Over-Indexed in
Emerging Markets
46
74
33
94 96
44
90
36
54
62
93
60 53
0
100
Arg. Brazil Egypt Indon. Kaz. Mex. Rus. Saudi Serbia Turkey Ukr. Vietnam
PMI Share of Premium (2012)(a)
(%)
(b)
(a) Includes above premium
Source: PMI estimates
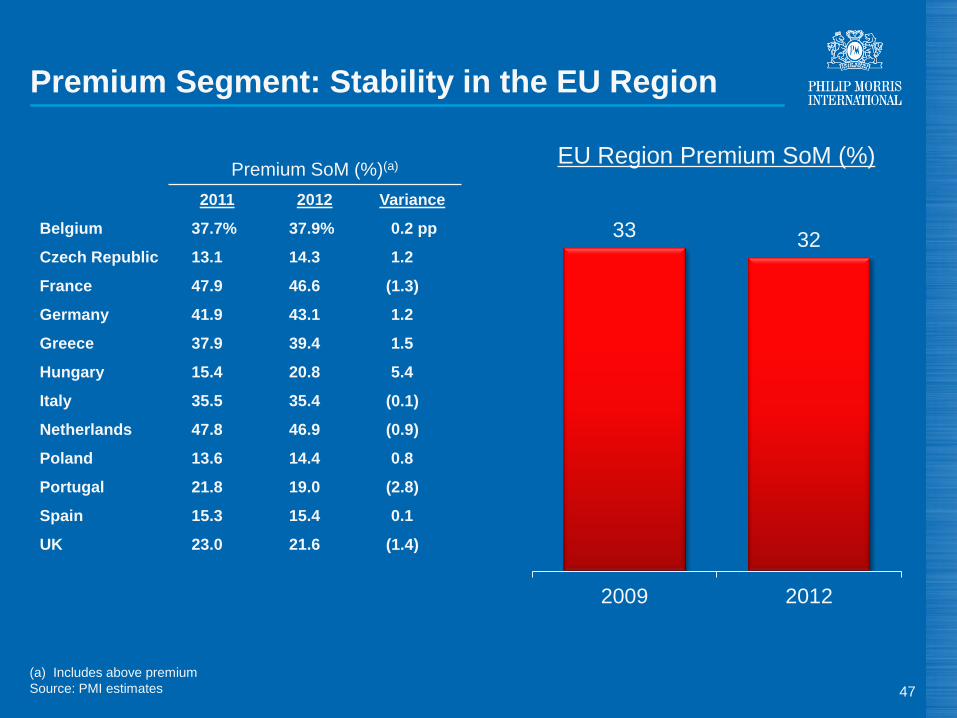
Premium Segment: Stability in the EU Region
Premium SoM (%)(a)
2011 2012 Variance
Belgium 37.7% 37.9% 0.2 pp
Czech Republic 13.1 14.3 1.2
France 47.9 46.6
Germany 41.9 43.1 1.2
Greece 37.9 39.4 1.5
Hungary 15.4 20.8 5.4
Italy 35.5 35.4
Netherlands 47.8 46.9
Poland 13.6 14.4 0.8
Portugal 21.8 19.0
Spain 15.3 15.4 0.1
UK 23.0 21.6
47
33 32
2009 2012
EU Region Premium SoM (%)
(1.3)
(0.1)
(0.9)
(2.8)
(1.4)

48
Source: PMI Financials
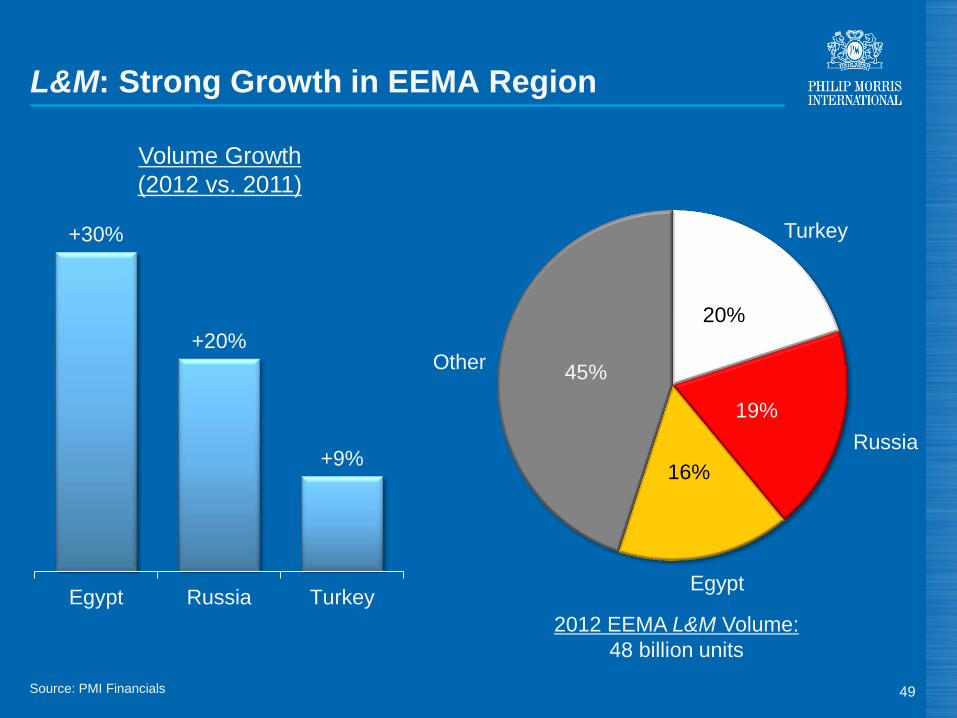
L&M: Strong Growth in EEMA Region
49
20%
19%
16%
45%
2012 EEMA L&M Volume:
48 billion units
Turkey
Russia
Egypt
Other
+30%
+20%
+9%
Egypt Russia Turkey
Volume Growth
(2012 vs. 2011)
Additional Growth Opportunities for PMI
● Geographic expansion
● Reduction in illicit trade
● Next Generation Products ("NGPs")
50
Source: PMI estimates and Nielsen
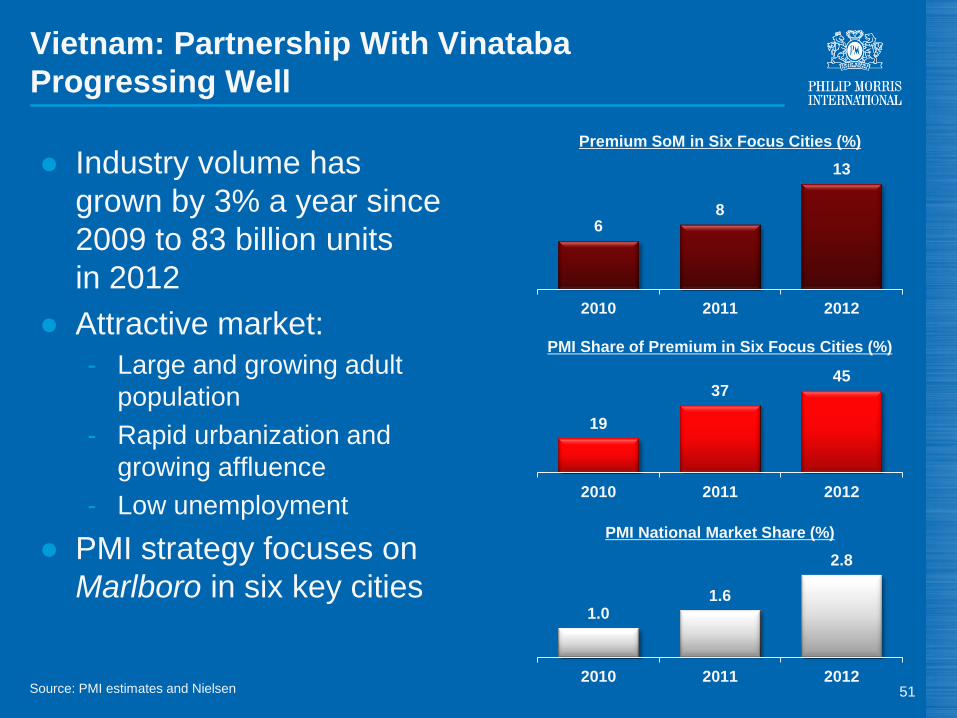
Vietnam: Partnership With Vinataba
Progressing Well
51
● Industry volume has
grown by 3% a year since
2009 to 83 billion units
in 2012
● Attractive market:
- Large and growing adult
population
- Rapid urbanization and
growing affluence
- Low unemployment
● PMI strategy focuses on
Marlboro in six key cities 1.0
1.6
2.8
2010 2011 2012
19
37 45
2010 2011 2012
6 8
13
2010 2011 2012
Premium SoM in Six Focus Cities (%)
PMI Share of Premium in Six Focus Cities (%)
PMI National Market Share (%)
Illicit Trade: Both an Opportunity and a Risk
● Estimated volume worldwide: 600 billion units
● Growing illicit trade category is “illicit whites”
52
Note: “Illicit whites” are branded cigarettes manufactured purely for export and resale without paying any taxes
Source: PMI estimates
Illicit Trade: Multi-Faceted Strategy
● Comprehensive approach by private and public sectors is
essential
● Need to tackle supply and demand
● PMI agreements with OLAF and INTERPOL
● WHO FCTC protocol on illicit trade
● Educational programs
53
Note: OLAF refers to the European Anti-Fraud Office. INTERPOL refers to the International Criminal Police Organization. WHO FCTC refers to the
WHO Framework Convention on Tobacco Control

NGPs: Steady Progress
● Clinical studies
● Perception and behavioral research
● Establishment of production facilities
● Addressing the regulatory environment
54
Platform 1 Platform 2 Platform 3
Free Cash Flow: Outlook
● Anticipate strong increase in currency-neutral free cash
flow in 2013
● Project free cash flow growth rate to exceed that of net
earnings in 2013
● Capex will increase over next few years:
- Additional capacity in Indonesia
- NGP manufacturing
● Forestalling-related inventory requirements expected to
fluctuate
55
Source: PMI Forecasts
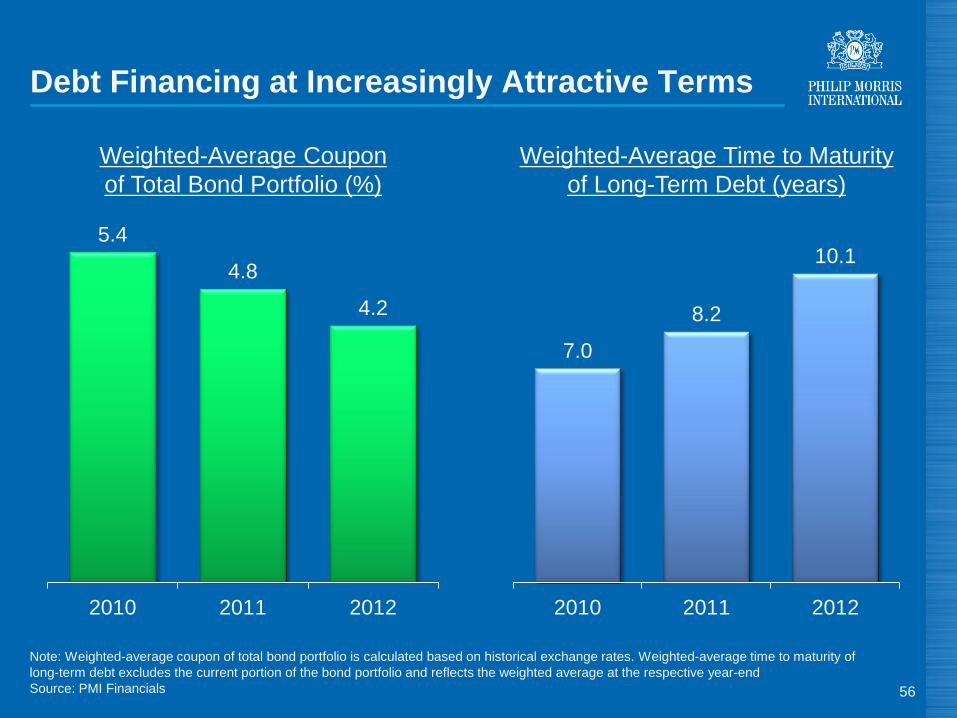
Debt Financing at Increasingly Attractive Terms
56
7.0
8.2
10.1
2010 2011 2012
5.4
4.8
4.2
2010 2011 2012
Weighted-Average Coupon
of Total Bond Portfolio (%)
Weighted-Average Time to Maturity
of Long-Term Debt (years)
Note: Weighted-average coupon of total bond portfolio is calculated based on historical exchange rates. Weighted-average time to maturity of
long-term debt excludes the current portion of the bond portfolio and reflects the weighted average at the respective year-end
Source: PMI Financials
NA
(25.0)%
15.0%
17.9%
26.2%
26.5%
28.3%
29.8%
31.0%
32.6%
34.2%
43.5%
46.4%
47.0%
56.0%
59.5%
84.8%
105.3%
Mondelēz
Novartis
Bayer
Unilever
PepsiCo
Vodafone
GlaxoSmithKline
Diageo
Coca-Cola
Heineken
Nestlé
Roche
BAT
PMI
McDonald's
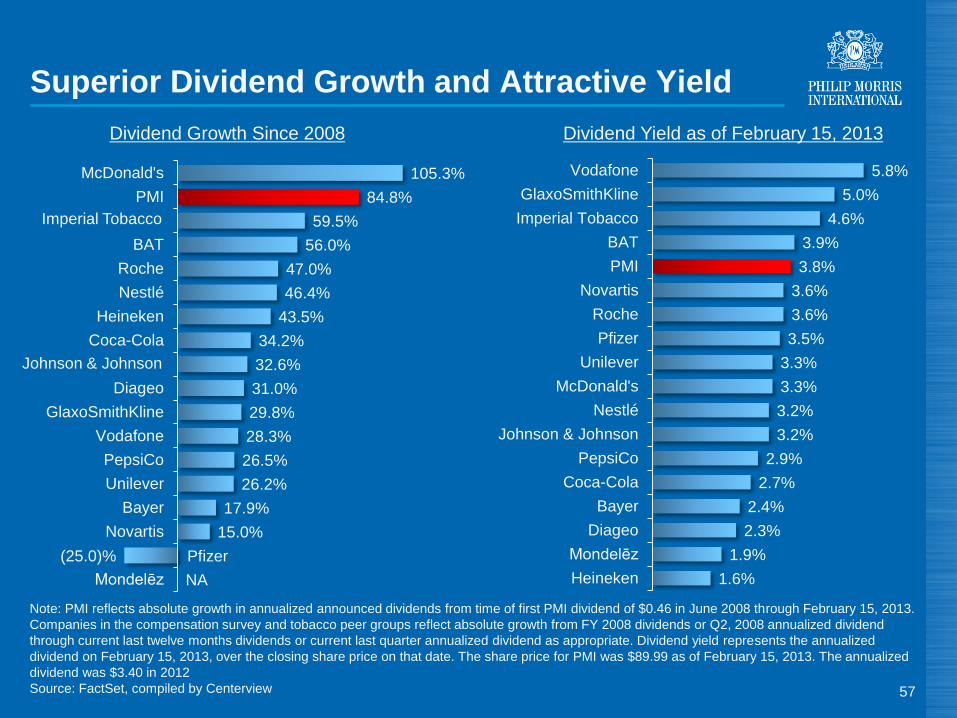
Superior Dividend Growth and Attractive Yield
57
Note: PMI reflects absolute growth in annualized announced dividends from time of first PMI dividend of $0.46 in June 2008 through February 15, 2013.
Companies in the compensation survey and tobacco peer groups reflect absolute growth from FY 2008 dividends or Q2, 2008 annualized dividend
through current last twelve months dividends or current last quarter annualized dividend as appropriate. Dividend yield represents the annualized
dividend on February 15, 2013, over the closing share price on that date. The share price for PMI was $89.99 as of February 15, 2013. The annualized
dividend was $3.40 in 2012
Source: FactSet, compiled by Centerview
Dividend Growth Since 2008
Pfizer
Imperial Tobacco
Johnson & Johnson
1.6%
1.9%
2.3%
2.4%
2.7%
2.9%
3.2%
3.2%
3.3%
3.3%
3.5%
3.6%
3.6%
3.8%
3.9%
4.6%
5.0%
5.8%
Heineken
Mondelēz
Diageo
Bayer
Coca-Cola
PepsiCo
Johnson & Johnson
Nestlé
McDonald's
Unilever
Pfizer
Roche
Novartis
PMI
BAT
Imperial Tobacco
GlaxoSmithKline
Vodafone
Dividend Yield as of February 15, 2013
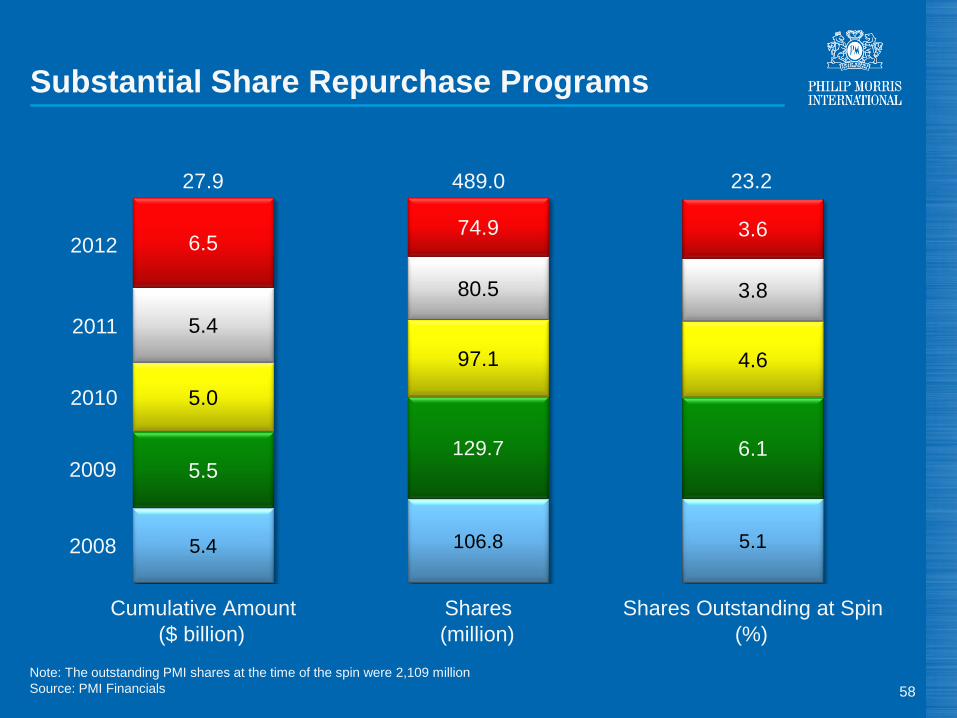
Substantial Share Repurchase Programs
58
Note: The outstanding PMI shares at the time of the spin were 2,109 million
Source: PMI Financials
5.4
5.5
5.0
5.4
6.5
Cumulative Amount
5.1
6.1
4.6
3.8
3.6
Shares Outstanding at Spin
27.9
($ billion)
23.2
(million) (%)
2010
2009
2008
489.0
106.8
129.7
97.1
80.5
74.9
Shares
2011
2012
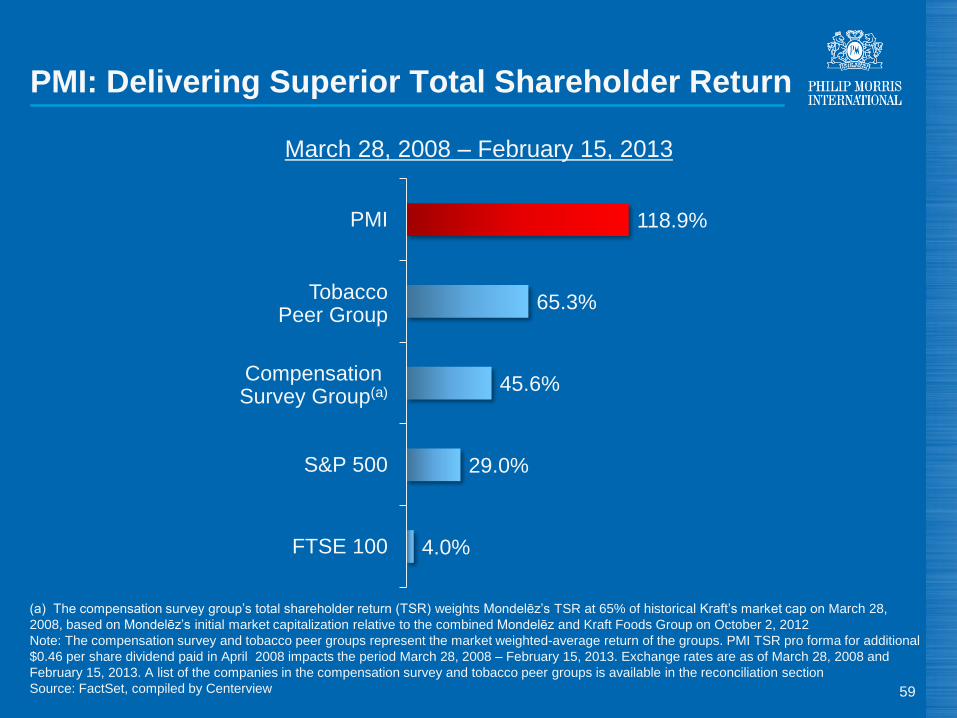
PMI: Delivering Superior Total Shareholder Return
59
4.0%
29.0%
45.6%
65.3%
118.9%
FTSE 100
S&P 500
PMI
Compensation Survey Group(a)
(a) The compensation survey group’s total shareholder return (TSR) weights Mondelēz’s TSR at 65% of historical Kraft’s market cap on March 28,
2008, based on Mondelēz’s initial market capitalization relative to the combined Mondelēz and Kraft Foods Group on October 2, 2012
Note: The compensation survey and tobacco peer groups represent the market weighted-average return of the groups. PMI TSR pro forma for additional
$0.46 per share dividend paid in April 2008 impacts the period March 28, 2008 – February 15, 2013. Exchange rates are as of March 28, 2008 and
February 15, 2013. A list of the companies in the compensation survey and tobacco peer groups is available in the reconciliation section
Source: FactSet, compiled by Centerview
Tobacco Peer Group
March 28, 2008 – February 15, 2013
PMI: Why We Are An Attractive Investment
● Tobacco sector has attractive business fundamentals
● PMI outperformance based on:
- Volume growth and share momentum
- World-class portfolio of brands
- Truly global footprint with leading position in emerging markets
- Innovation
- Superior conversion of revenues into cash
- Robust capital structure
● Steadfast commitment to shareholder value: over $50
billion returned to our shareholders since 2008 through a
balanced program of higher dividends and substantial
share repurchases
60
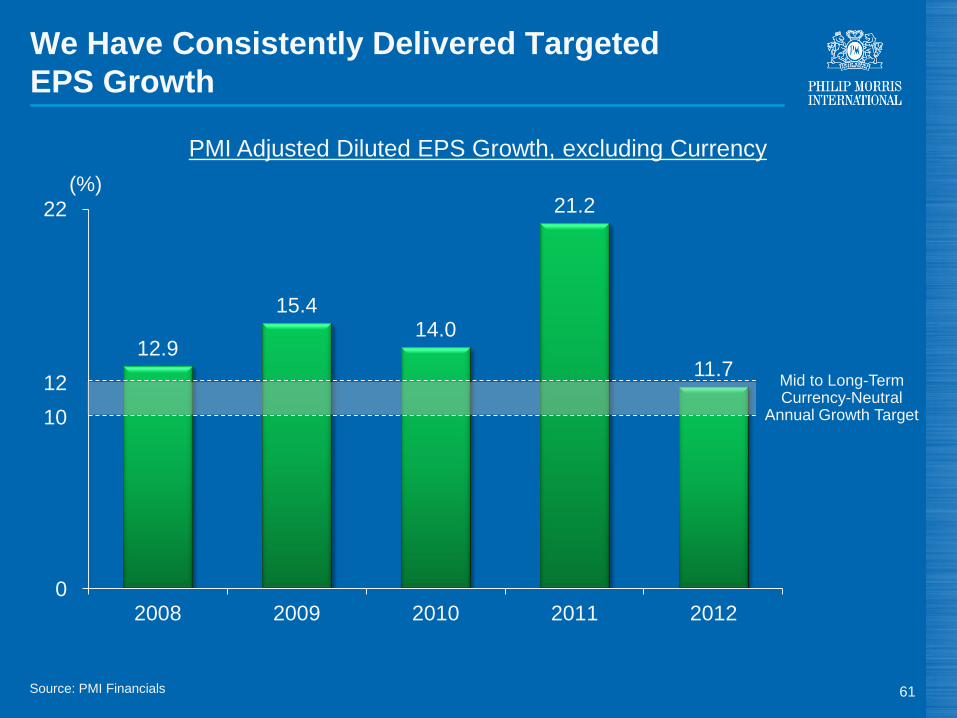
We Have Consistently Delivered Targeted
EPS Growth
61
12.9
15.4 14.0
21.2
11.7
0
22
2008 2009 2010 2011 2012
Mid to Long-Term Currency-Neutral
Annual Growth Target
PMI Adjusted Diluted EPS Growth, excluding Currency
Source: PMI Financials
10
12
0
22
(%)

62
Consumer Analyst Group of New York
(CAGNY) Conference
February 20, 2013
Jacek Olczak
Chief Financial Officer
Philip Morris International
Glossary and Reconciliation of
Non-GAAP Measures
65
Glossary
● Unless otherwise stated, results are compared with those of the same period
in the preceding year
● PMI stands for Philip Morris International Inc. and its subsidiaries
● PMI volumes refer to PMI cigarette shipment data, unless otherwise stated
● References to total international cigarette market, total cigarette market, total
market and market shares reflect our best estimates based on a number of
international and external sources
● Organic volume refers to volume excluding acquisitions
● Acquisitions, for the purposes of this presentation, also include our business
combination with Fortune Tobacco Corporation in the Philippines
● Net revenues exclude excise taxes
● OCI stands for Operating Companies Income, which is defined as operating
income before general corporate expenses and the amortization of
intangibles. OCI growth rates are on an adjusted basis which excludes asset
impairment, exit and other costs
● Adjusted OCI is defined as reported OCI adjusted for asset impairment, exit
and other costs
66
Glossary
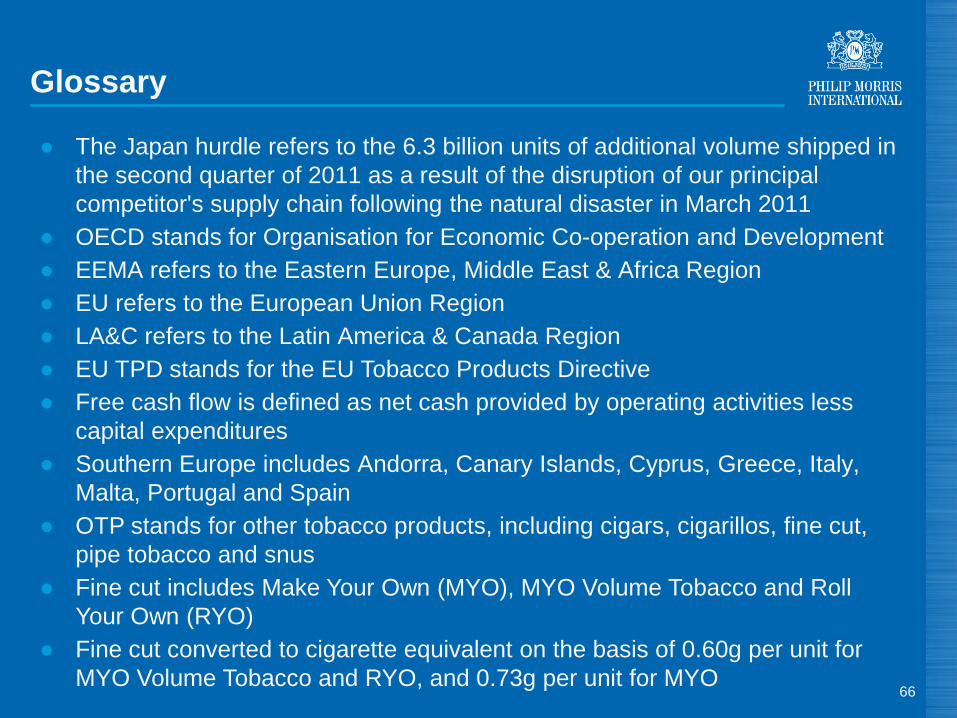
● The Japan hurdle refers to the 6.3 billion units of additional volume shipped in
the second quarter of 2011 as a result of the disruption of our principal
competitor's supply chain following the natural disaster in March 2011
● OECD stands for Organisation for Economic Co-operation and Development
● EEMA refers to the Eastern Europe, Middle East & Africa Region
● EU refers to the European Union Region
● LA&C refers to the Latin America & Canada Region
● EU TPD stands for the EU Tobacco Products Directive
● Free cash flow is defined as net cash provided by operating activities less
capital expenditures
● Southern Europe includes Andorra, Canary Islands, Cyprus, Greece, Italy,
Malta, Portugal and Spain
● OTP stands for other tobacco products, including cigars, cigarillos, fine cut,
pipe tobacco and snus
● Fine cut includes Make Your Own (MYO), MYO Volume Tobacco and Roll
Your Own (RYO)
● Fine cut converted to cigarette equivalent on the basis of 0.60g per unit for
MYO Volume Tobacco and RYO, and 0.73g per unit for MYO
Glossary
67
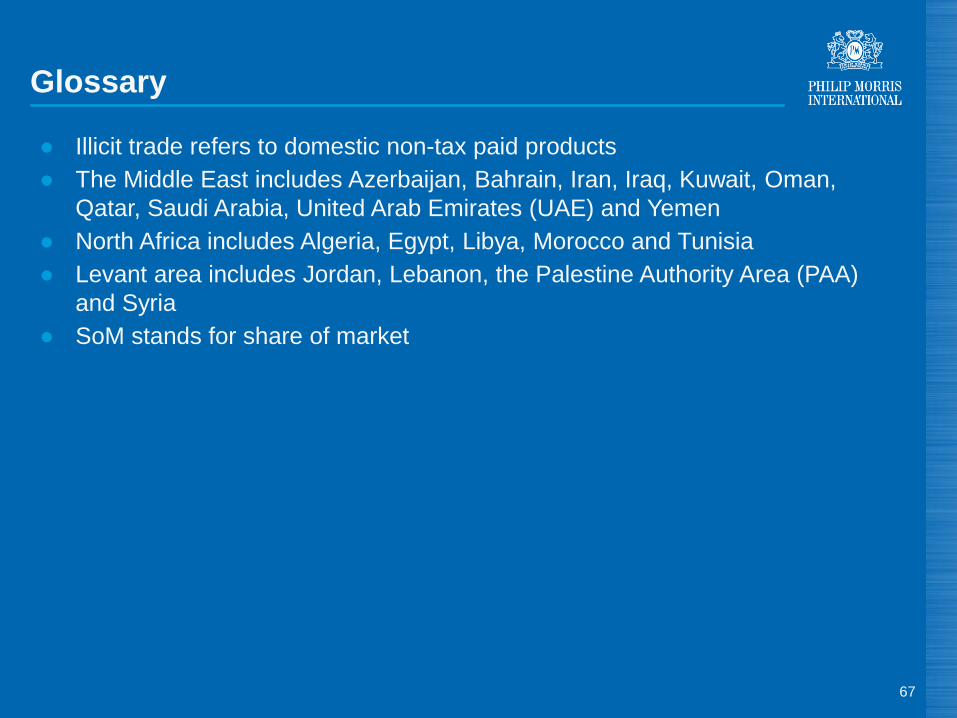
● Illicit trade refers to domestic non-tax paid products
● The Middle East includes Azerbaijan, Bahrain, Iran, Iraq, Kuwait, Oman,
Qatar, Saudi Arabia, United Arab Emirates (UAE) and Yemen
● North Africa includes Algeria, Egypt, Libya, Morocco and Tunisia
● Levant area includes Jordan, Lebanon, the Palestine Authority Area (PAA)
and Syria
● SoM stands for share of market
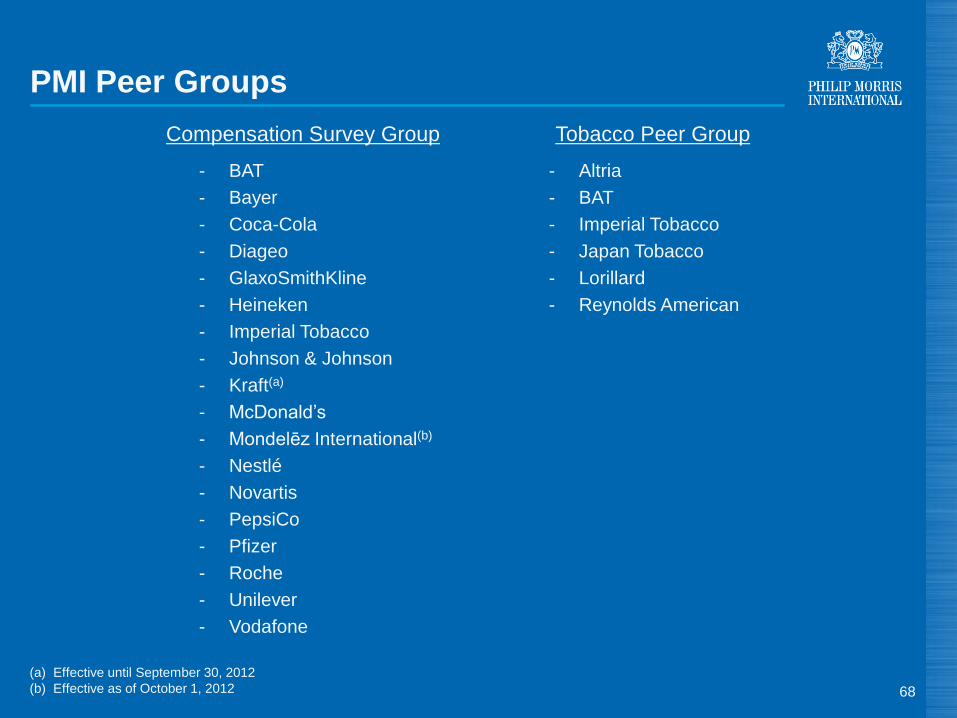
PMI Peer Groups
- BAT
- Bayer
- Coca-Cola
- Diageo
- GlaxoSmithKline
- Heineken
- Imperial Tobacco
- Johnson & Johnson
- Kraft(a)
- McDonald’s
- Mondelēz International(b)
- Nestlé
- Novartis
- PepsiCo
- Pfizer
- Roche
- Unilever
- Vodafone
Compensation Survey Group
- Altria
- BAT
- Imperial Tobacco
- Japan Tobacco
- Lorillard
- Reynolds American
Tobacco Peer Group
(a) Effective until September 30, 2012
(b) Effective as of October 1, 2012 68
69
PHILIP MORRIS INTERNATIONAL INC. and Subsidiaries
Reconciliation of Non-GAAP Measures
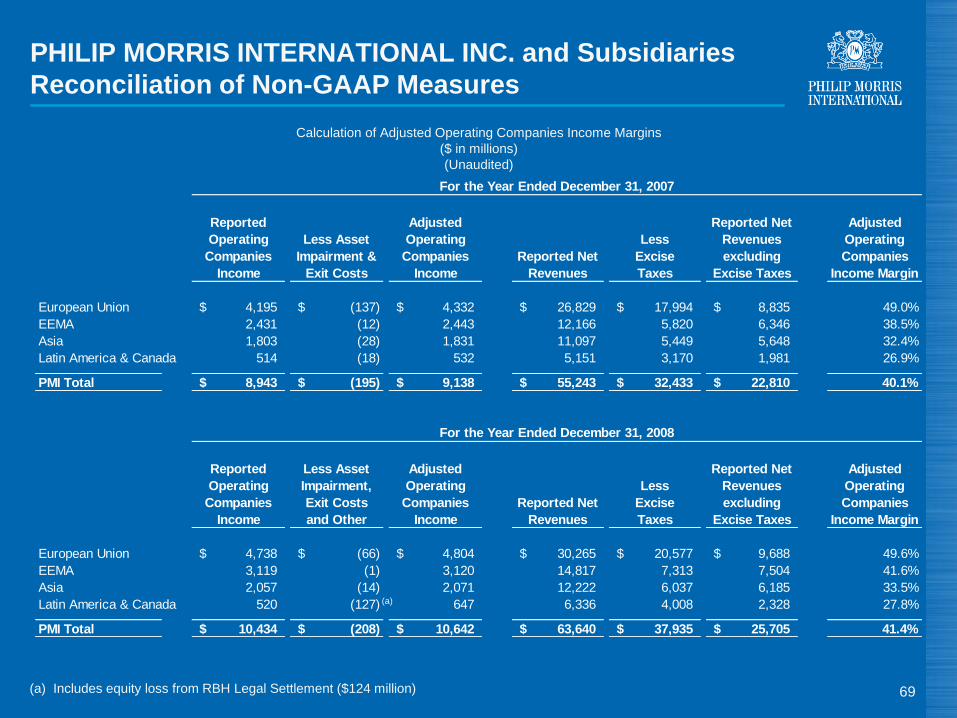
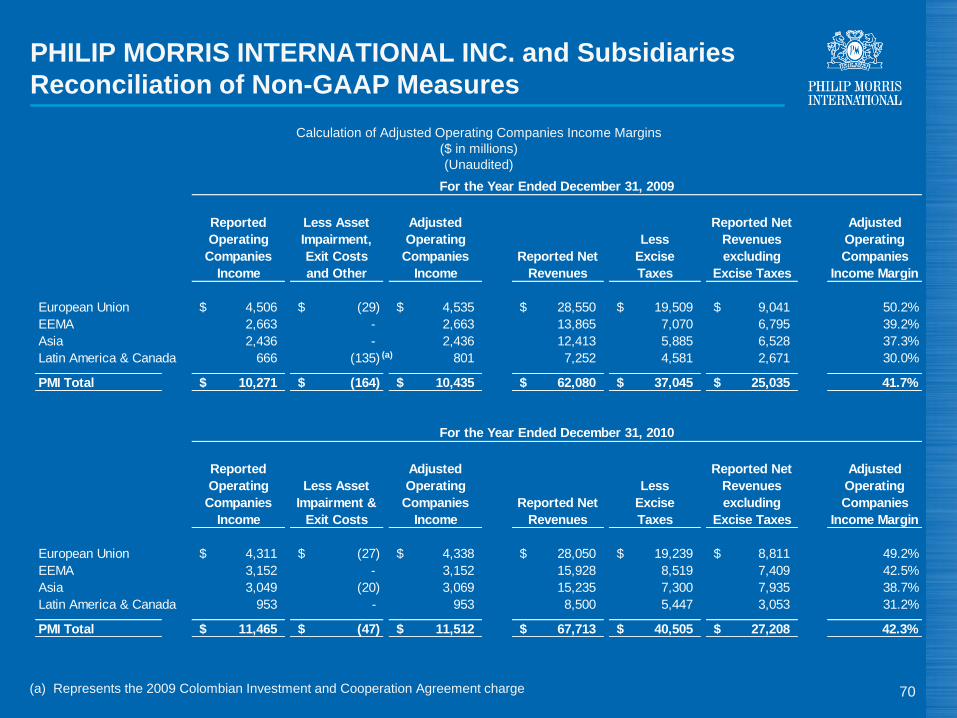
Calculation of Adjusted Operating Companies Income Margins
($ in millions)
(Unaudited)
European Union 4,195$ (137)$ 4,332$ 26,829$ 17,994$ 8,835$ 49.0%
EEMA 2,431 (12) 2,443 12,166 5,820 6,346 38.5%
Asia 1,803 (28) 1,831 11,097 5,449 5,648 32.4%
Latin America & Canada 514 (18) 532 5,151 3,170 1,981 26.9%
PMI Total 8,943$ (195)$ 9,138$ 55,243$ 32,433$ 22,810$ 40.1%
European Union 4,738$ (66)$ 4,804$ 30,265$ 20,577$ 9,688$ 49.6%
EEMA 3,119 (1) 3,120 14,817 7,313 7,504 41.6%
Asia 2,057 (14) 2,071 12,222 6,037 6,185 33.5%
Latin America & Canada 520 (127) 647 6,336 4,008 2,328 27.8%
PMI Total 10,434$ (208)$ 10,642$ 63,640$ 37,935$ 25,705$ 41.4%
For the Year Ended December 31, 2008
Reported
Operating
Companies
Income
Less Asset
Impairment,
Exit Costs
and Other
Adjusted
Operating
Companies
Income
Reported Net
Revenues
Less
Excise
Taxes
Reported Net
Revenues
excluding
Excise Taxes
Adjusted
Operating
Companies
Income Margin
Reported Net
Revenues
excluding
Excise Taxes
Adjusted
Operating
Companies
Income Margin
Reported
Operating
Companies
Income
Less Asset
Impairment &
Exit Costs
Adjusted
Operating
Companies
Income
Reported Net
Revenues
Less
Excise
Taxes
For the Year Ended December 31, 2007
(a) Includes equity loss from RBH Legal Settlement ($124 million)
(a)
70
PHILIP MORRIS INTERNATIONAL INC. and Subsidiaries
Reconciliation of Non-GAAP Measures
Calculation of Adjusted Operating Companies Income Margins
($ in millions)
(Unaudited)
European Union 4,506$ (29)$ 4,535$ 28,550$ 19,509$ 9,041$ 50.2%
EEMA 2,663 - 2,663 13,865 7,070 6,795 39.2%
Asia 2,436 - 2,436 12,413 5,885 6,528 37.3%
Latin America & Canada 666 (135) 801 7,252 4,581 2,671 30.0%
PMI Total 10,271$ (164)$ 10,435$ 62,080$ 37,045$ 25,035$ 41.7%
European Union 4,311$ (27)$ 4,338$ 28,050$ 19,239$ 8,811$ 49.2%
EEMA 3,152 - 3,152 15,928 8,519 7,409 42.5%
Asia 3,049 (20) 3,069 15,235 7,300 7,935 38.7%
Latin America & Canada 953 - 953 8,500 5,447 3,053 31.2%
PMI Total 11,465$ (47)$ 11,512$ 67,713$ 40,505$ 27,208$ 42.3%
For the Year Ended December 31, 2009
Reported
Operating
Companies
Income
Less Asset
Impairment,
Exit Costs
and Other
Adjusted
Operating
Companies
Income
Reported Net
Revenues
Less
Excise
Taxes
Reported Net
Revenues
excluding
Excise Taxes
Adjusted
Operating
Companies
Income Margin
For the Year Ended December 31, 2010
Reported
Operating
Companies
Income
Less Asset
Impairment &
Exit Costs
Adjusted
Operating
Companies
Income
Reported Net
Revenues
Less
Excise
Taxes
Reported Net
Revenues
excluding
Excise Taxes
Adjusted
Operating
Companies
Income Margin
(a)
(a) Represents the 2009 Colombian Investment and Cooperation Agreement charge
71
PHILIP MORRIS INTERNATIONAL INC. and Subsidiaries
Reconciliation of Non-GAAP Measures
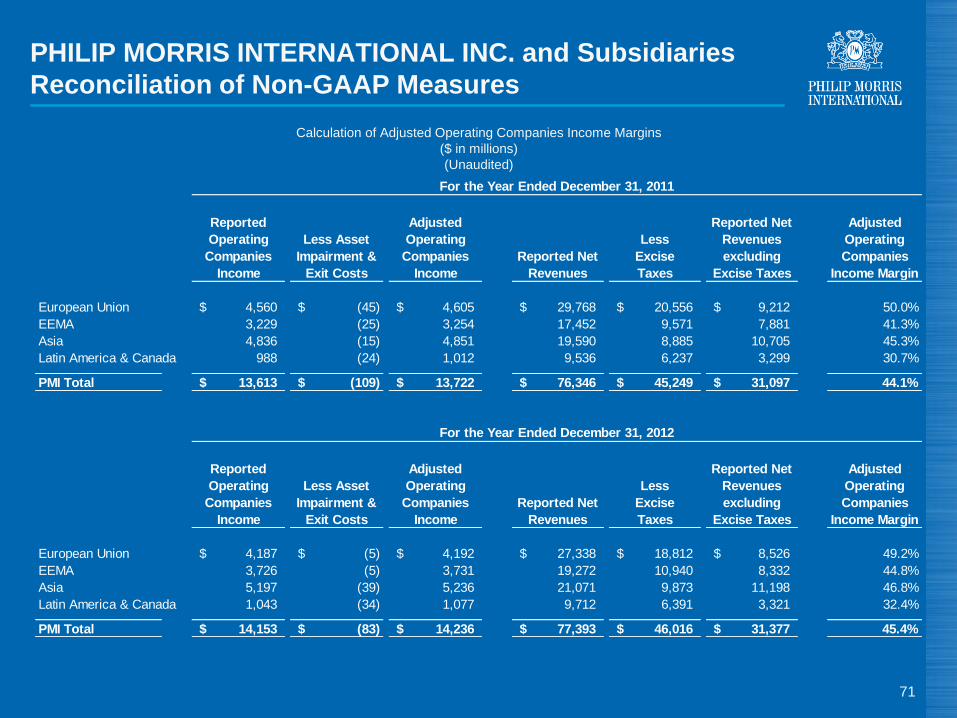
Calculation of Adjusted Operating Companies Income Margins
($ in millions)
(Unaudited)
European Union 4,560$ (45)$ 4,605$ 29,768$ 20,556$ 9,212$ 50.0%
EEMA 3,229 (25) 3,254 17,452 9,571 7,881 41.3%
Asia 4,836 (15) 4,851 19,590 8,885 10,705 45.3%
Latin America & Canada 988 (24) 1,012 9,536 6,237 3,299 30.7%
PMI Total 13,613$ (109)$ 13,722$ 76,346$ 45,249$ 31,097$ 44.1%
European Union 4,187$ (5)$ 4,192$ 27,338$ 18,812$ 8,526$ 49.2%
EEMA 3,726 (5) 3,731 19,272 10,940 8,332 44.8%
Asia 5,197 (39) 5,236 21,071 9,873 11,198 46.8%
Latin America & Canada 1,043 (34) 1,077 9,712 6,391 3,321 32.4%
PMI Total 14,153$ (83)$ 14,236$ 77,393$ 46,016$ 31,377$ 45.4%
Reported Net
Revenues
excluding
Excise Taxes
Adjusted
Operating
Companies
Income Margin
For the Year Ended December 31, 2012
Reported
Operating
Companies
Income
Less Asset
Impairment &
Exit Costs
Adjusted
Operating
Companies
Income
Reported Net
Revenues
Less
Excise
Taxes
Reported Net
Revenues
excluding
Excise Taxes
Adjusted
Operating
Companies
Income Margin
For the Year Ended December 31, 2011
Reported
Operating
Companies
Income
Less Asset
Impairment &
Exit Costs
Adjusted
Operating
Companies
Income
Reported Net
Revenues
Less
Excise
Taxes
72
PHILIP MORRIS INTERNATIONAL INC. and Subsidiaries
Reconciliation of Non-GAAP Measures
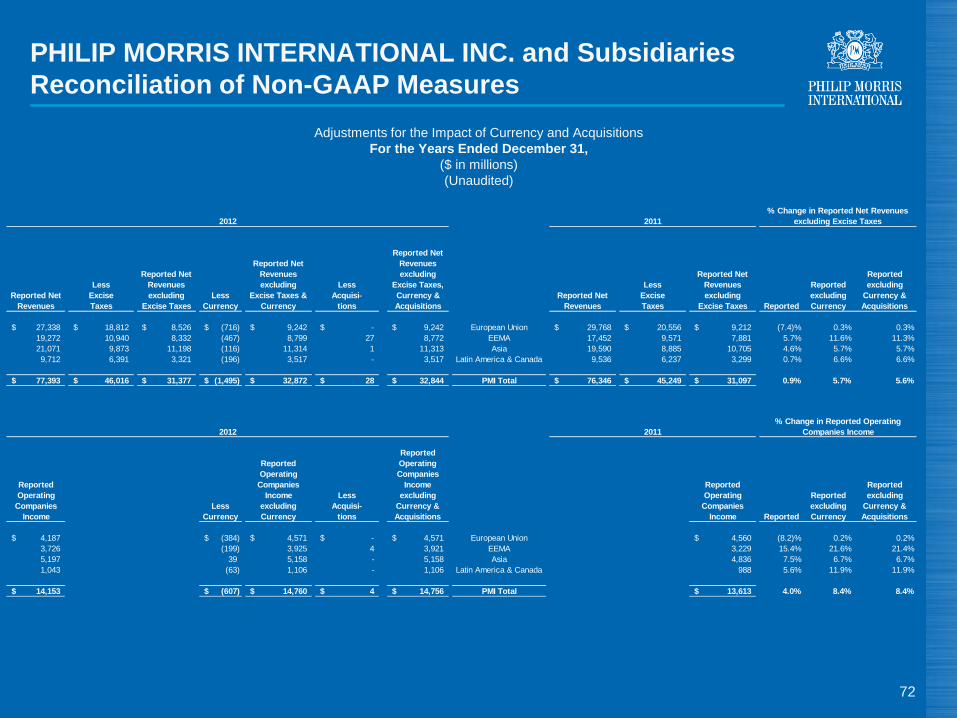
Adjustments for the Impact of Currency and Acquisitions
For the Years Ended December 31,
($ in millions)
(Unaudited)
Reported Net
Revenues
Less
Excise
Taxes
Reported Net
Revenues
excluding
Excise Taxes
Less
Currency
Reported Net
Revenues
excluding
Excise Taxes &
Currency
Less
Acquisi-
tions
Reported Net
Revenues
excluding
Excise Taxes,
Currency &
Acquisitions
Reported Net
Revenues
Less
Excise
Taxes
Reported Net
Revenues
excluding
Excise Taxes
Reported
Reported
excluding
Currency
Reported
excluding
Currency &
Acquisitions
27,338$ 18,812$ 8,526$ (716)$ 9,242$ -$ 9,242$ European Union 29,768$ 20,556$ 9,212$ (7.4)% 0.3% 0.3%
19,272 10,940 8,332 (467) 8,799 27 8,772 EEMA 17,452 9,571 7,881 5.7% 11.6% 11.3%
21,071 9,873 11,198 (116) 11,314 1 11,313 Asia 19,590 8,885 10,705 4.6% 5.7% 5.7%
9,712 6,391 3,321 (196) 3,517 - 3,517 Latin America & Canada 9,536 6,237 3,299 0.7% 6.6% 6.6%
77,393$ 46,016$ 31,377$ (1,495)$ 32,872$ 28$ 32,844$ PMI Total 76,346$ 45,249$ 31,097$ 0.9% 5.7% 5.6%
Reported
Operating
Companies
Income
Less
Currency
Reported
Operating
Companies
Income
excluding
Currency
Less
Acquisi-
tions
Reported
Operating
Companies
Income
excluding
Currency &
Acquisitions
Reported
Operating
Companies
Income
Reported
Reported
excluding
Currency
Reported
excluding
Currency &
Acquisitions
4,187$ (384)$ 4,571$ -$ 4,571$ European Union 4,560$ (8.2)% 0.2% 0.2%
3,726 (199) 3,925 4 3,921 EEMA 3,229 15.4% 21.6% 21.4%
5,197 39 5,158 - 5,158 Asia 4,836 7.5% 6.7% 6.7%
1,043 (63) 1,106 - 1,106 Latin America & Canada 988 5.6% 11.9% 11.9%
14,153$ (607)$ 14,760$ 4$ 14,756$ PMI Total 13,613$ 4.0% 8.4% 8.4%
2012 2011
% Change in Reported Operating
Companies Income
2012 2011
% Change in Reported Net Revenues
excluding Excise Taxes
73
PHILIP MORRIS INTERNATIONAL INC. and Subsidiaries
Reconciliation of Non-GAAP Measures
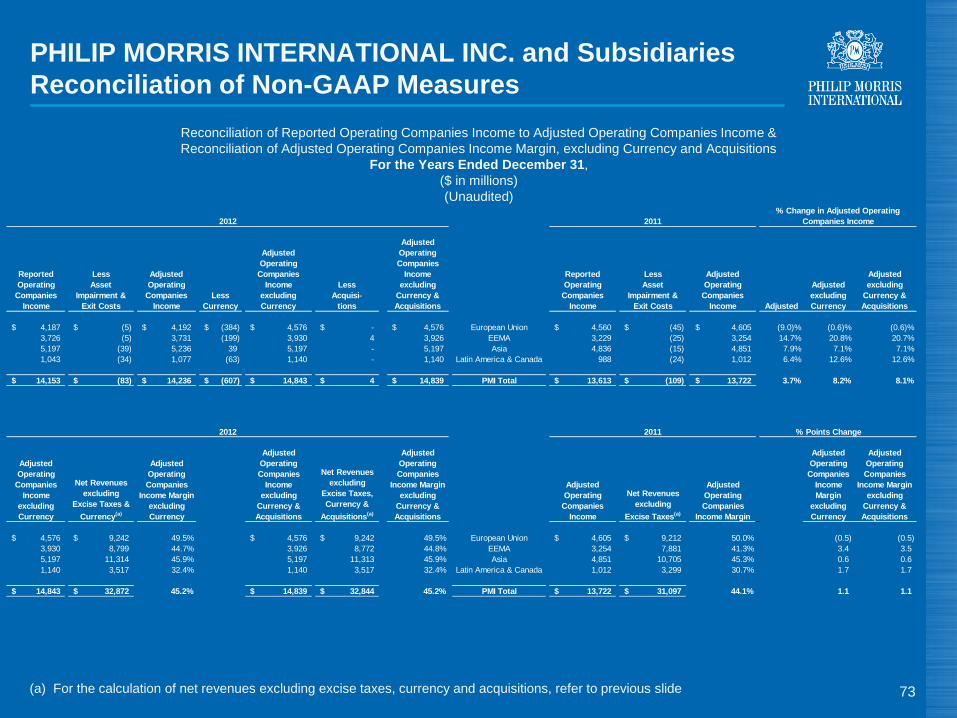
Reconciliation of Reported Operating Companies Income to Adjusted Operating Companies Income &
Reconciliation of Adjusted Operating Companies Income Margin, excluding Currency and Acquisitions
For the Years Ended December 31,
($ in millions)
(Unaudited)
Reported
Operating
Companies
Income
Less
Asset
Impairment &
Exit Costs
Adjusted
Operating
Companies
Income
Less
Currency
Adjusted
Operating
Companies
Income
excluding
Currency
Less
Acquisi-
tions
Adjusted
Operating
Companies
Income
excluding
Currency &
Acquisitions
Reported
Operating
Companies
Income
Less
Asset
Impairment &
Exit Costs
Adjusted
Operating
Companies
Income Adjusted
Adjusted
excluding
Currency
Adjusted
excluding
Currency &
Acquisitions
4,187$ (5)$ 4,192$ (384)$ 4,576$ -$ 4,576$ European Union 4,560$ (45)$ 4,605$ (9.0)% (0.6)% (0.6)%
3,726 (5) 3,731 (199) 3,930 4 3,926 EEMA 3,229 (25) 3,254 14.7% 20.8% 20.7%
5,197 (39) 5,236 39 5,197 - 5,197 Asia 4,836 (15) 4,851 7.9% 7.1% 7.1%
1,043 (34) 1,077 (63) 1,140 - 1,140 Latin America & Canada 988 (24) 1,012 6.4% 12.6% 12.6%
14,153$ (83)$ 14,236$ (607)$ 14,843$ 4$ 14,839$ PMI Total 13,613$ (109)$ 13,722$ 3.7% 8.2% 8.1%
% Points Change
Adjusted
Operating
Companies
Income
excluding
Currency
Net Revenues
excluding
Excise Taxes &
Currency(a)
Adjusted
Operating
Companies
Income Margin
excluding
Currency
Adjusted
Operating
Companies
Income
excluding
Currency &
Acquisitions
Net Revenues
excluding
Excise Taxes,
Currency &
Acquisitions(a)
Adjusted
Operating
Companies
Income Margin
excluding
Currency &
Acquisitions
Adjusted
Operating
Companies
Income
Net Revenues
excluding
Excise Taxes(a)
Adjusted
Operating
Companies
Income Margin
Adjusted
Operating
Companies
Income
Margin
excluding
Currency
Adjusted
Operating
Companies
Income Margin
excluding
Currency &
Acquisitions
4,576$ 9,242$ 49.5% 4,576$ 9,242$ 49.5% European Union 4,605$ 9,212$ 50.0% (0.5) (0.5)
3,930 8,799 44.7% 3,926 8,772 44.8% EEMA 3,254 7,881 41.3% 3.4 3.5
5,197 11,314 45.9% 5,197 11,313 45.9% Asia 4,851 10,705 45.3% 0.6 0.6
1,140 3,517 32.4% 1,140 3,517 32.4% Latin America & Canada 1,012 3,299 30.7% 1.7 1.7
14,843$ 32,872$ 45.2% 14,839$ 32,844$ 45.2% PMI Total 13,722$ 31,097$ 44.1% 1.1 1.1
2012 2011
2012 2011
% Change in Adjusted Operating
Companies Income
(a) For the calculation of net revenues excluding excise taxes, currency and acquisitions, refer to previous slide
74
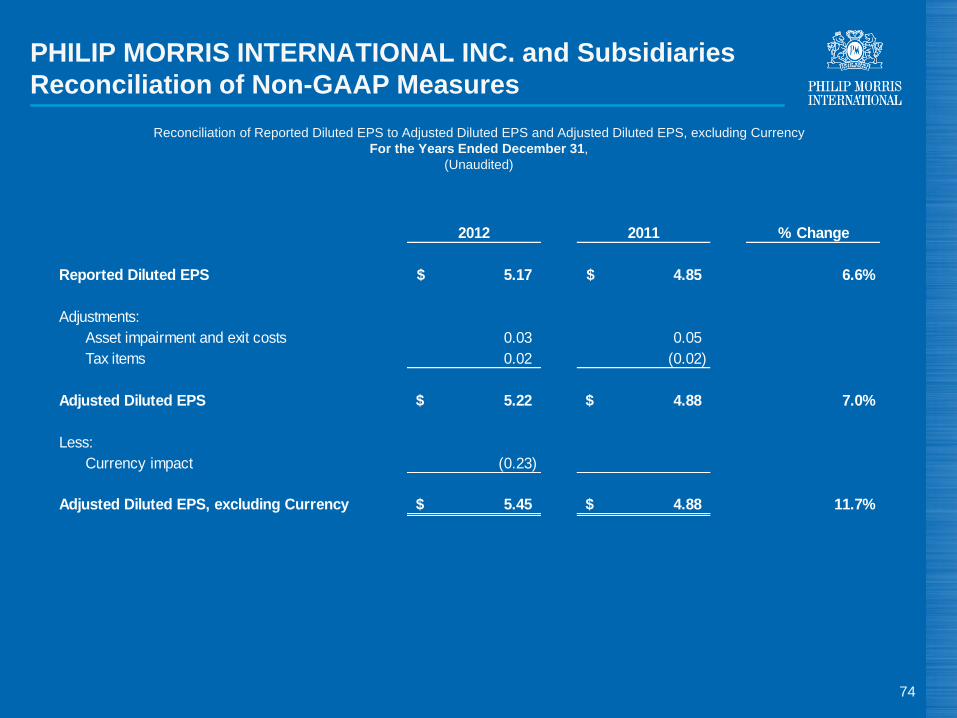
PHILIP MORRIS INTERNATIONAL INC. and Subsidiaries
Reconciliation of Non-GAAP Measures
Reconciliation of Reported Diluted EPS to Adjusted Diluted EPS and Adjusted Diluted EPS, excluding Currency
For the Years Ended December 31,
(Unaudited)
2012 2011 % Change
Reported Diluted EPS 5.17$ 4.85$ 6.6%
Adjustments:
Asset impairment and exit costs 0.03 0.05
Tax items 0.02 (0.02)
Adjusted Diluted EPS 5.22$ 4.88$ 7.0%
Less:
Currency impact (0.23)
Adjusted Diluted EPS, excluding Currency 5.45$ 4.88$ 11.7%
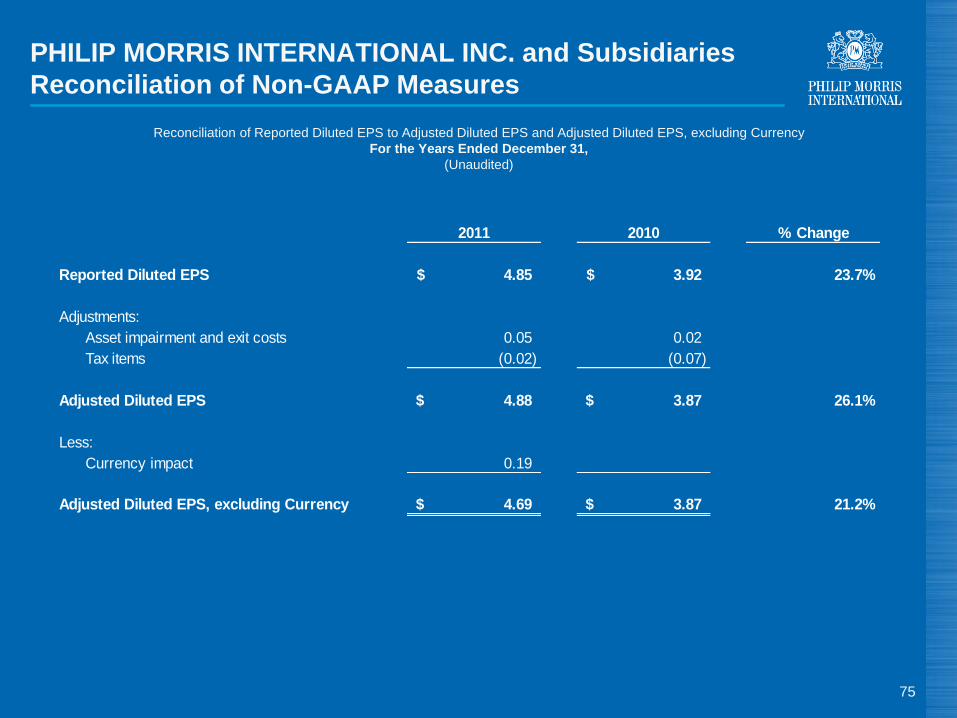
PHILIP MORRIS INTERNATIONAL INC. and Subsidiaries
Reconciliation of Non-GAAP Measures
Reconciliation of Reported Diluted EPS to Adjusted Diluted EPS and Adjusted Diluted EPS, excluding Currency
For the Years Ended December 31,
(Unaudited)
75
2011 2010 % Change
Reported Diluted EPS 4.85$ 3.92$ 23.7%
Adjustments:
Asset impairment and exit costs 0.05 0.02
Tax items (0.02) (0.07)
Adjusted Diluted EPS 4.88$ 3.87$ 26.1%
Less:
Currency impact 0.19
Adjusted Diluted EPS, excluding Currency 4.69$ 3.87$ 21.2%
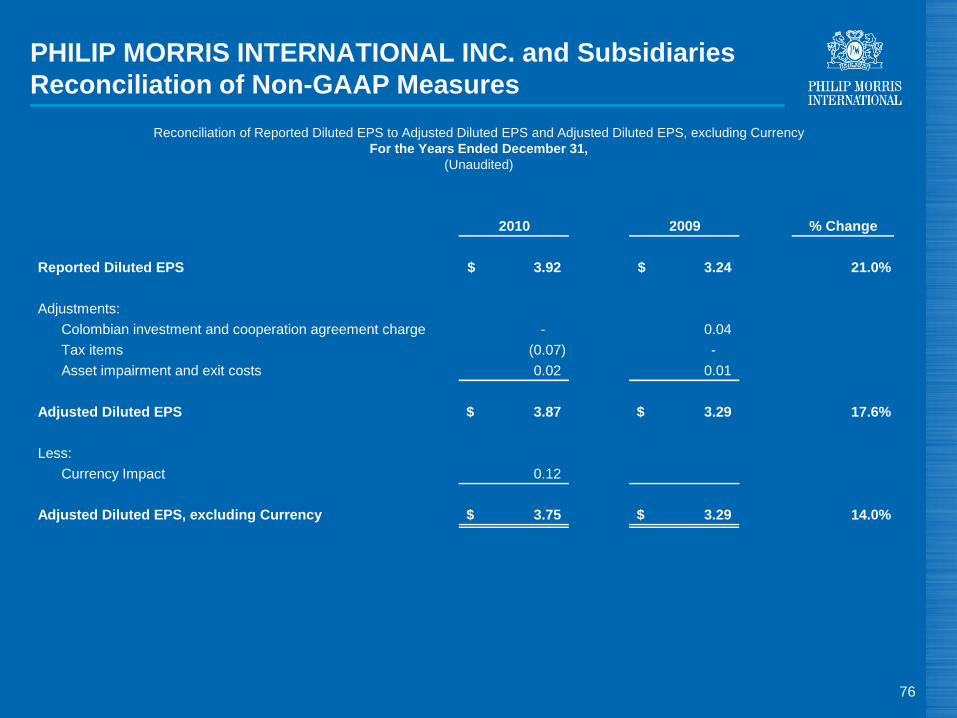
PHILIP MORRIS INTERNATIONAL INC. and Subsidiaries
Reconciliation of Non-GAAP Measures
Reconciliation of Reported Diluted EPS to Adjusted Diluted EPS and Adjusted Diluted EPS, excluding Currency
For the Years Ended December 31,
(Unaudited)
76
2010 2009 % Change
Reported Diluted EPS 3.92$ 3.24$ 21.0%
Adjustments:
Colombian investment and cooperation agreement charge - 0.04
Tax items (0.07) -
Asset impairment and exit costs 0.02 0.01
Adjusted Diluted EPS 3.87$ 3.29$ 17.6%
Less:
Currency Impact 0.12
Adjusted Diluted EPS, excluding Currency 3.75$ 3.29$ 14.0%
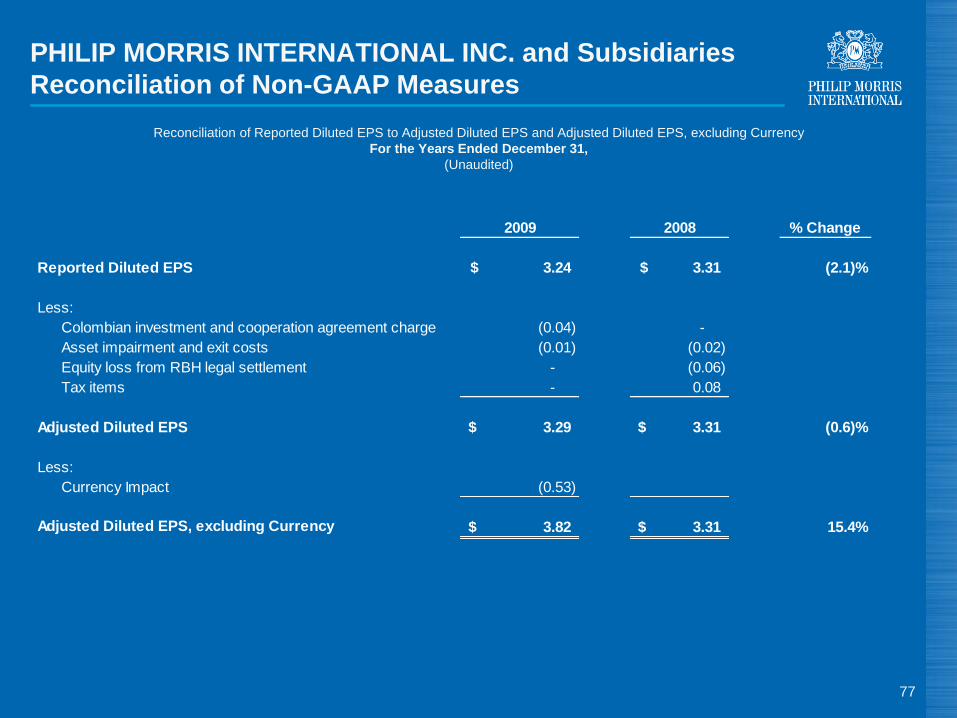
PHILIP MORRIS INTERNATIONAL INC. and Subsidiaries
Reconciliation of Non-GAAP Measures
Reconciliation of Reported Diluted EPS to Adjusted Diluted EPS and Adjusted Diluted EPS, excluding Currency
For the Years Ended December 31,
(Unaudited)
77
2009 2008 % Change
Reported Diluted EPS 3.24$ 3.31$ (2.1)%
Less:
Colombian investment and cooperation agreement charge (0.04) -
Asset impairment and exit costs (0.01) (0.02)
Equity loss from RBH legal settlement - (0.06)
Tax items - 0.08
Adjusted Diluted EPS 3.29$ 3.31$ (0.6)%
Less:
Currency Impact (0.53)
Adjusted Diluted EPS, excluding Currency 3.82$ 3.31$ 15.4%
78
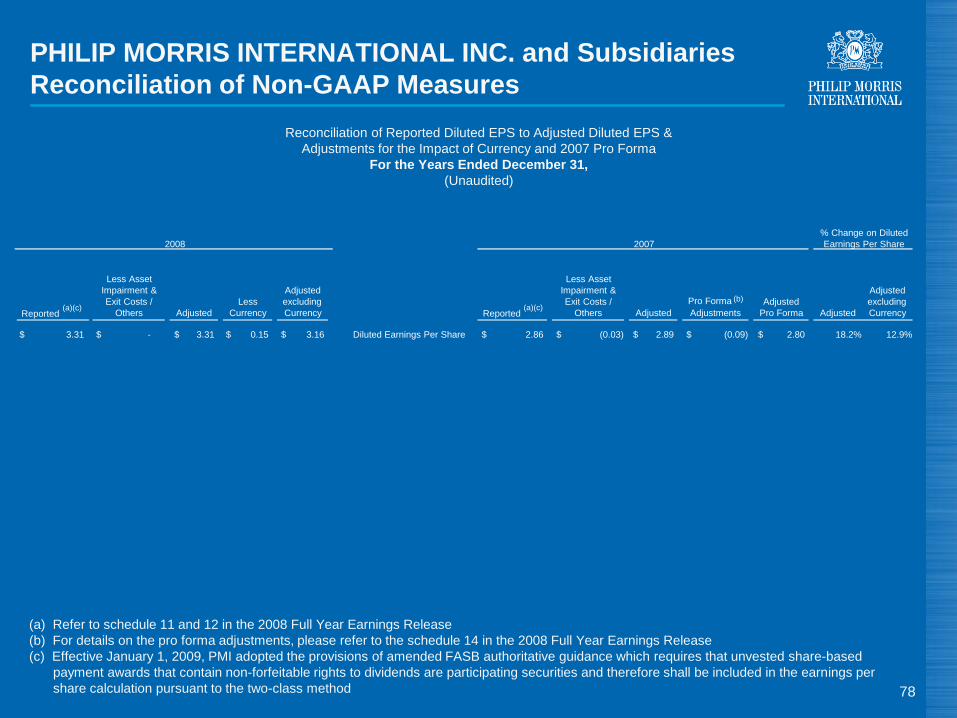
PHILIP MORRIS INTERNATIONAL INC. and Subsidiaries
Reconciliation of Non-GAAP Measures
Reconciliation of Reported Diluted EPS to Adjusted Diluted EPS &
Adjustments for the Impact of Currency and 2007 Pro Forma
For the Years Ended December 31,
(Unaudited)
Reported (a)(c)
Less Asset
Impairment &
Exit Costs /
Others Adjusted
Less
Currency
Adjusted
excluding
Currency Reported (a)(c)
Less Asset
Impairment &
Exit Costs /
Others Adjusted
Pro Forma (b)
Adjustments
Adjusted
Pro Forma Adjusted
Adjusted
excluding
Currency
3.31 $ - 3.31 $ 0.15 3.16 $ Diluted Earnings Per Share 2.86 $ (0.03) 2.89 $ (0.09) 2.80 $ 18.2% 12.9%
% Change on Diluted
Earnings Per Share 2008 2007
(a) Refer to schedule 11 and 12 in the 2008 Full Year Earnings Release
(b) For details on the pro forma adjustments, please refer to the schedule 14 in the 2008 Full Year Earnings Release
(c) Effective January 1, 2009, PMI adopted the provisions of amended FASB authoritative guidance which requires that unvested share-based
payment awards that contain non-forfeitable rights to dividends are participating securities and therefore shall be included in the earnings per
share calculation pursuant to the two-class method
$ $ $ $

Consumer Analyst Group of New York
(CAGNY) Conference
February 20, 2013
Jacek Olczak
Chief Financial Officer
Philip Morris International

![pm-june-2012 [Read-Only]tobaccoexhibits.musc.edu/wp-content/uploads/2013/11/pm-june-2012-R… · companies: Philip Morris Domestic, Philip Morris International and Philip Morris Industrial](https://img.pdfslide.net/doc/110x75/605e327ad336c824c43fb936/pm-june-2012-read-only-companies-philip-morris-domestic-philip-morris-international.jpg)