Embed Size (px)
Citation preview
Confidential: For Limited Circulation only
PMS advisory Note- Sept 2017
Confidential: For Limited Circulation only
I. Benefits of Investing through PMS platform
II. Fund manager & managed PMS Strategies
III. MOSL bouquet of PMS offerings
IV. Performance update of PMS offerings
V. Risk Return Analysis
VI. Fee Schedule
Confidential: For Limited Circulation only
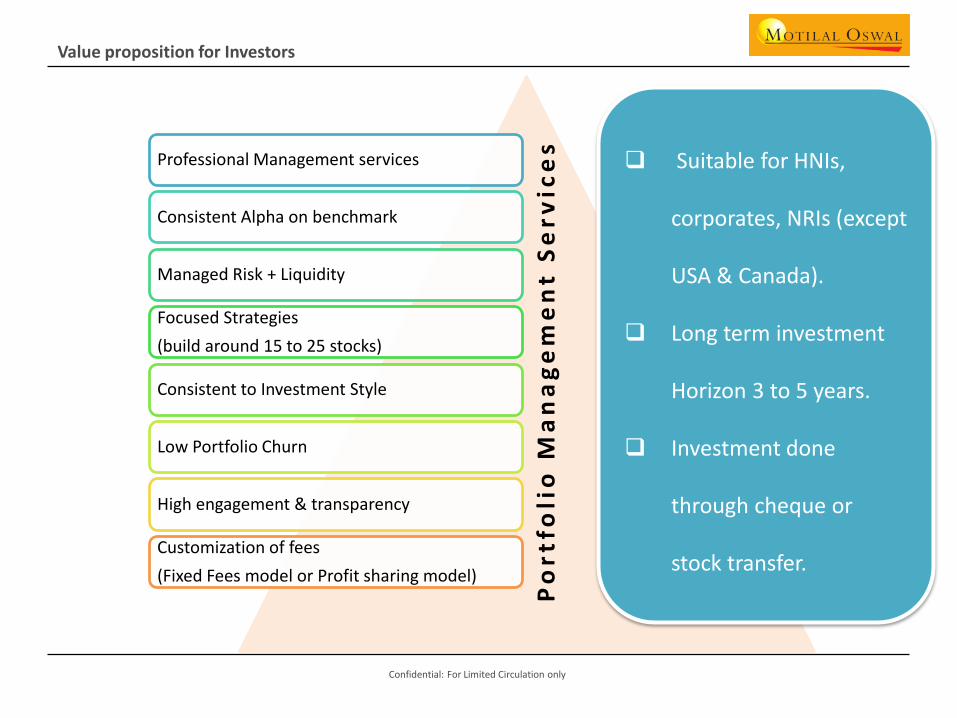
Professional Management services
Consistent Alpha on benchmark
Managed Risk + Liquidity
Focused Strategies
(build around 15 to 25 stocks)
Consistent to Investment Style
Low Portfolio Churn
High engagement & transparency
Customization of fees
(Fixed Fees model or Profit sharing model)
Value proposition for Investors
Po
rtf
oli
o M
an
ag
em
en
t S
er
vic
es
Suitable for HNIs,
corporates, NRIs (except
USA & Canada).
Long term investment
Horizon 3 to 5 years.
Investment done
through cheque or
stock transfer.
Confidential: For Limited Circulation only
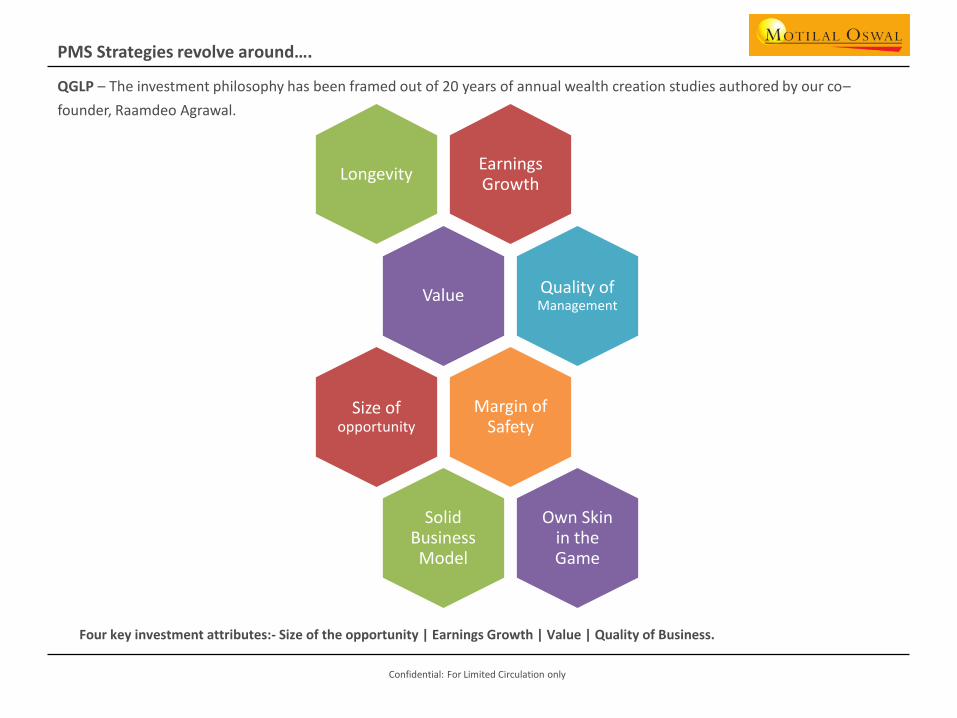
Four key investment attributes:- Size of the opportunity | Earnings Growth | Value | Quality of Business.
QGLP – The investment philosophy has been framed out of 20 years of annual wealth creation studies authored by our co–
founder, Raamdeo Agrawal.
PMS Strategies revolve around….
Earnings Growth
Longevity
Value Quality of Management
Margin of Safety
Size of opportunity
Solid Business Model
Own Skin in the Game
Confidential: For Limited Circulation only
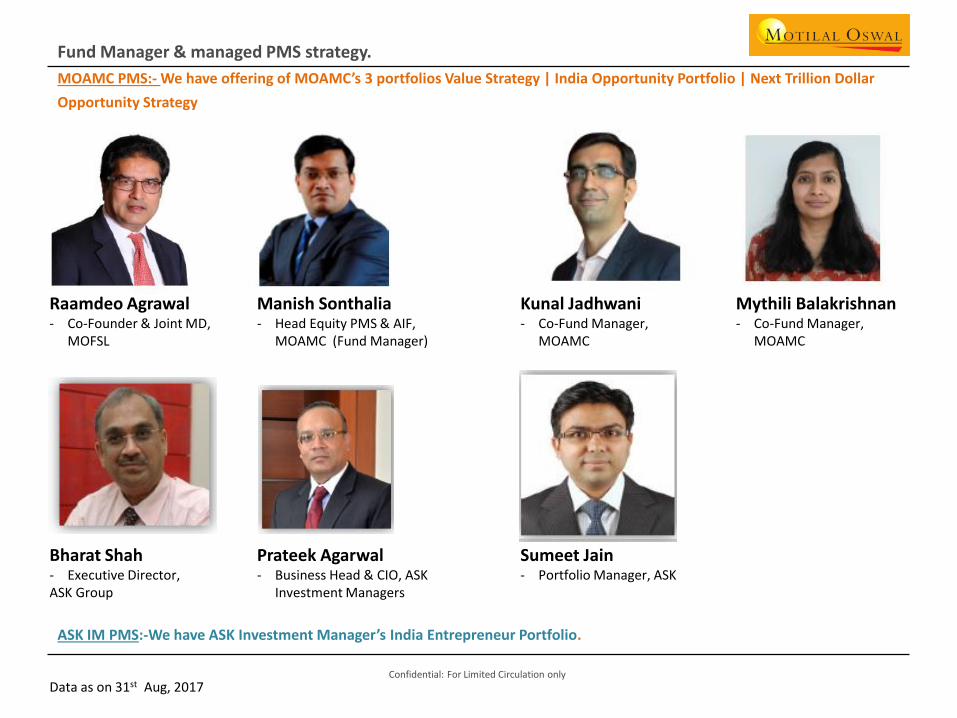
ASK IM PMS:-We have ASK Investment Manager’s India Entrepreneur Portfolio.
MOAMC PMS:- We have offering of MOAMC’s 3 portfolios Value Strategy | India Opportunity Portfolio | Next Trillion Dollar
Opportunity Strategy
Fund Manager & managed PMS strategy.
Raamdeo Agrawal - Co-Founder & Joint MD,
MOFSL
Manish Sonthalia- Head Equity PMS & AIF,
MOAMC (Fund Manager)
Kunal Jadhwani- Co-Fund Manager,
MOAMC
Mythili Balakrishnan- Co-Fund Manager,
MOAMC
Bharat Shah- Executive Director, ASK Group
Prateek Agarwal- Business Head & CIO, ASK
Investment Managers
Sumeet Jain- Portfolio Manager, ASK
Data as on 31st Aug, 2017
Confidential: For Limited Circulation only
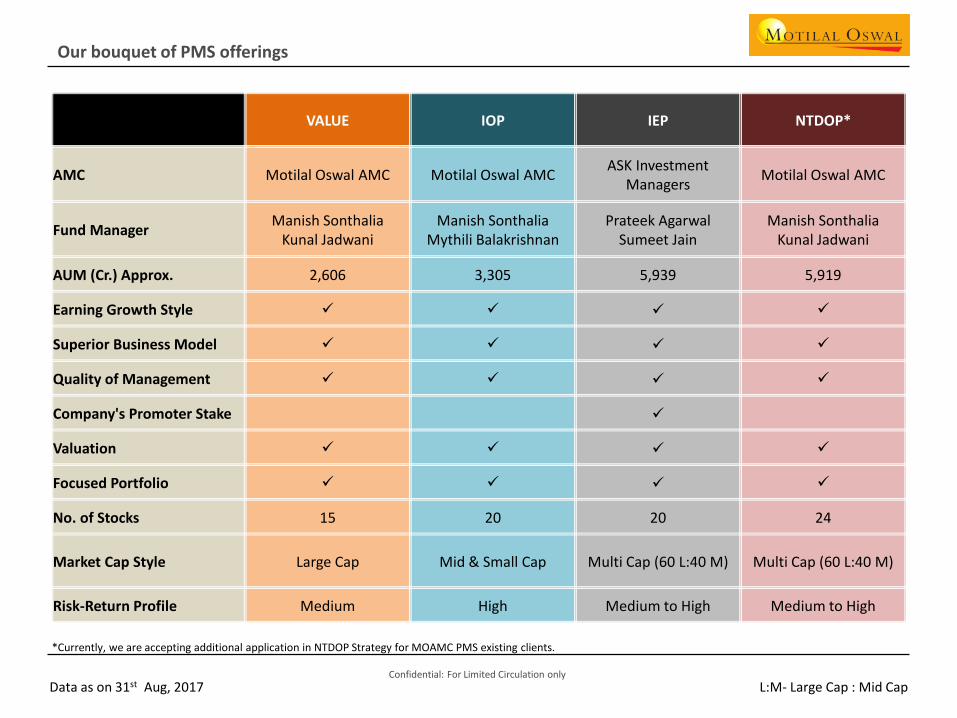
Our bouquet of PMS offerings
VALUE IOP IEP NTDOP*
AMC Motilal Oswal AMC Motilal Oswal AMCASK Investment
ManagersMotilal Oswal AMC
Fund ManagerManish Sonthalia
Kunal JadwaniManish Sonthalia
Mythili BalakrishnanPrateek Agarwal
Sumeet JainManish Sonthalia
Kunal Jadwani
AUM (Cr.) Approx. 2,606 3,305 5,939 5,919
Earning Growth Style
Superior Business Model
Quality of Management
Company's Promoter Stake
Valuation
Focused Portfolio
No. of Stocks 15 20 20 24
Market Cap Style Large Cap Mid & Small Cap Multi Cap (60 L:40 M) Multi Cap (60 L:40 M)
Risk-Return Profile Medium High Medium to High Medium to High
Data as on 31st Aug, 2017 L:M- Large Cap : Mid Cap
*Currently, we are accepting additional application in NTDOP Strategy for MOAMC PMS existing clients.
Confidential: For Limited Circulation only
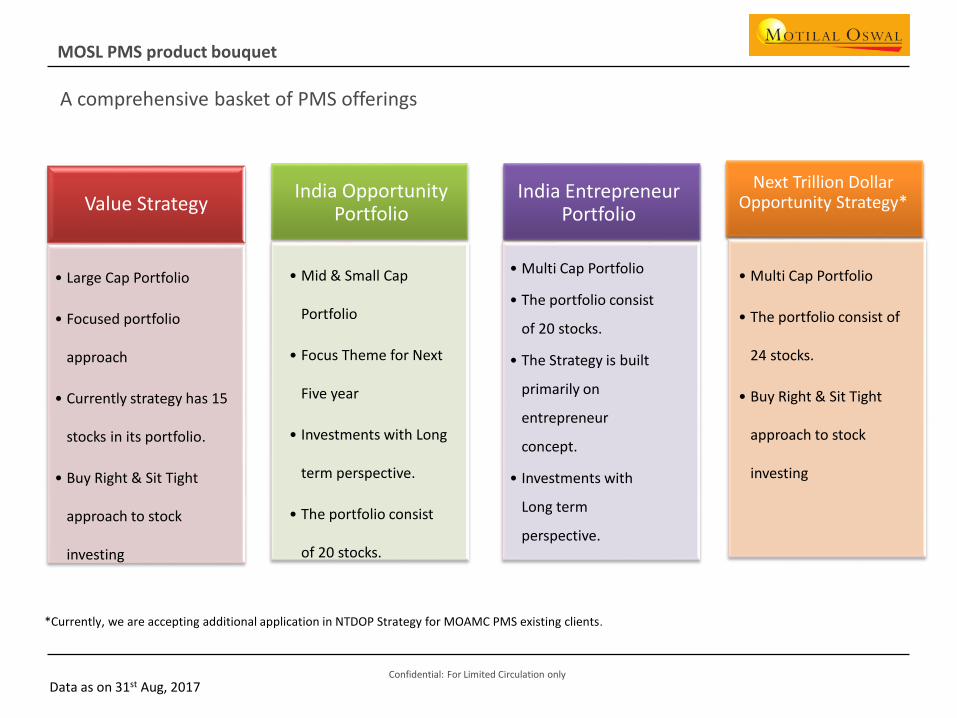
A comprehensive basket of PMS offerings
Value Strategy
• Large Cap Portfolio
• Focused portfolio
approach
• Currently strategy has 15
stocks in its portfolio.
• Buy Right & Sit Tight
approach to stock
investing
• Multi Cap Portfolio
• The portfolio consist
of 20 stocks.
• The Strategy is built
primarily on
entrepreneur
concept.
• Investments with
Long term
perspective.
• Mid & Small Cap
Portfolio
• Focus Theme for Next
Five year
• Investments with Long
term perspective.
• The portfolio consist
of 20 stocks.
India Opportunity Portfolio
India Entrepreneur Portfolio
Next Trillion Dollar Opportunity Strategy*
• Multi Cap Portfolio
• The portfolio consist of
24 stocks.
• Buy Right & Sit Tight
approach to stock
investing
*Currently, we are accepting additional application in NTDOP Strategy for MOAMC PMS existing clients.
MOSL PMS product bouquet
Data as on 31st Aug, 2017
Confidential: For Limited Circulation only
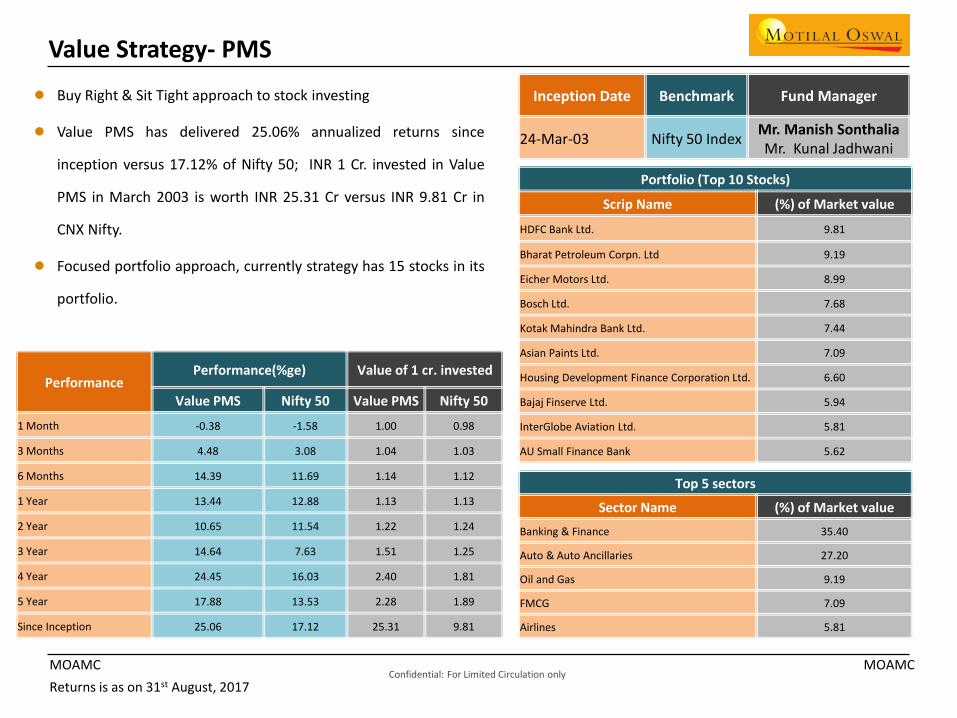
Value Strategy- PMS
● Buy Right & Sit Tight approach to stock investing
● Value PMS has delivered 25.06% annualized returns since
inception versus 17.12% of Nifty 50; INR 1 Cr. invested in Value
PMS in March 2003 is worth INR 25.31 Cr versus INR 9.81 Cr in
CNX Nifty.
● Focused portfolio approach, currently strategy has 15 stocks in its
portfolio.
Returns is as on 31st August, 2017
MOAMCMOAMC
PerformancePerformance(%ge) Value of 1 cr. invested
Value PMS Nifty 50 Value PMS Nifty 50
1 Month -0.38 -1.58 1.00 0.98
3 Months 4.48 3.08 1.04 1.03
6 Months 14.39 11.69 1.14 1.12
1 Year 13.44 12.88 1.13 1.13
2 Year 10.65 11.54 1.22 1.24
3 Year 14.64 7.63 1.51 1.25
4 Year 24.45 16.03 2.40 1.81
5 Year 17.88 13.53 2.28 1.89
Since Inception 25.06 17.12 25.31 9.81
Portfolio (Top 10 Stocks)
Scrip Name (%) of Market value
HDFC Bank Ltd. 9.81
Bharat Petroleum Corpn. Ltd 9.19
Eicher Motors Ltd. 8.99
Bosch Ltd. 7.68
Kotak Mahindra Bank Ltd. 7.44
Asian Paints Ltd. 7.09
Housing Development Finance Corporation Ltd. 6.60
Bajaj Finserve Ltd. 5.94
InterGlobe Aviation Ltd. 5.81
AU Small Finance Bank 5.62
Top 5 sectors
Sector Name (%) of Market value
Banking & Finance 35.40
Auto & Auto Ancillaries 27.20
Oil and Gas 9.19
FMCG 7.09
Airlines 5.81
Inception Date Benchmark Fund Manager
24-Mar-03 Nifty 50 IndexMr. Manish SonthaliaMr. Kunal Jadhwani
Confidential: For Limited Circulation only
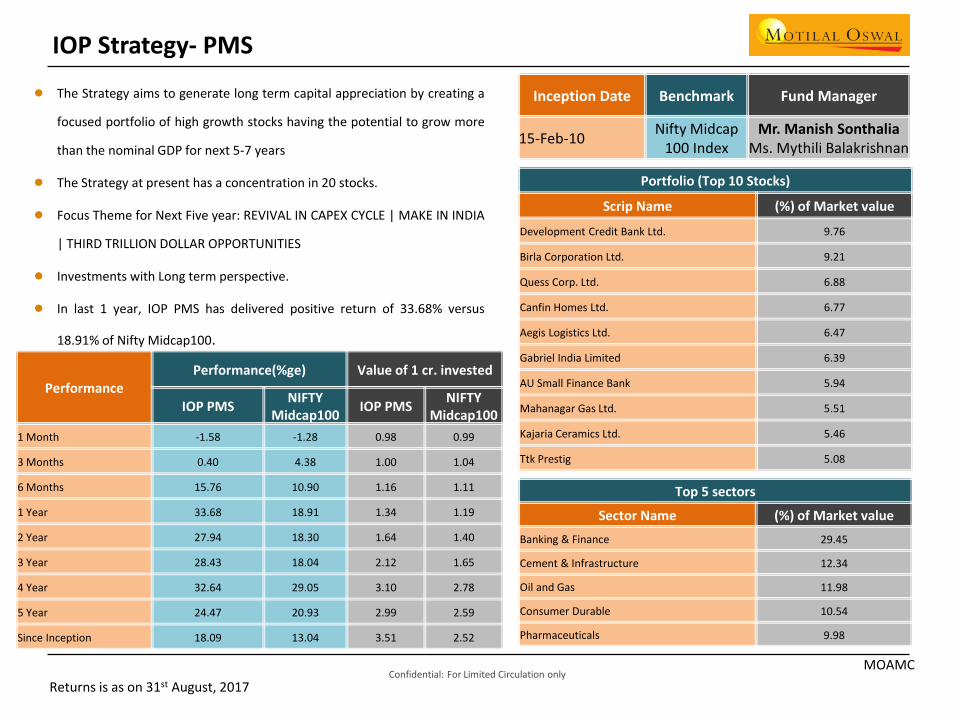
IOP Strategy- PMS
● The Strategy aims to generate long term capital appreciation by creating a
focused portfolio of high growth stocks having the potential to grow more
than the nominal GDP for next 5-7 years
● The Strategy at present has a concentration in 20 stocks.
● Focus Theme for Next Five year: REVIVAL IN CAPEX CYCLE | MAKE IN INDIA
| THIRD TRILLION DOLLAR OPPORTUNITIES
● Investments with Long term perspective.
● In last 1 year, IOP PMS has delivered positive return of 33.68% versus
18.91% of Nifty Midcap100.
Returns is as on 31st August, 2017
MOAMC
PerformancePerformance(%ge) Value of 1 cr. invested
IOP PMSNIFTY
Midcap100IOP PMS
NIFTY Midcap100
1 Month -1.58 -1.28 0.98 0.99
3 Months 0.40 4.38 1.00 1.04
6 Months 15.76 10.90 1.16 1.11
1 Year 33.68 18.91 1.34 1.19
2 Year 27.94 18.30 1.64 1.40
3 Year 28.43 18.04 2.12 1.65
4 Year 32.64 29.05 3.10 2.78
5 Year 24.47 20.93 2.99 2.59
Since Inception 18.09 13.04 3.51 2.52
Portfolio (Top 10 Stocks)
Scrip Name (%) of Market value
Development Credit Bank Ltd. 9.76
Birla Corporation Ltd. 9.21
Quess Corp. Ltd. 6.88
Canfin Homes Ltd. 6.77
Aegis Logistics Ltd. 6.47
Gabriel India Limited 6.39
AU Small Finance Bank 5.94
Mahanagar Gas Ltd. 5.51
Kajaria Ceramics Ltd. 5.46
Ttk Prestig 5.08
Top 5 sectors
Sector Name (%) of Market value
Banking & Finance 29.45
Cement & Infrastructure 12.34
Oil and Gas 11.98
Consumer Durable 10.54
Pharmaceuticals 9.98
Inception Date Benchmark Fund Manager
15-Feb-10Nifty Midcap
100 IndexMr. Manish Sonthalia
Ms. Mythili Balakrishnan
Confidential: For Limited Circulation only
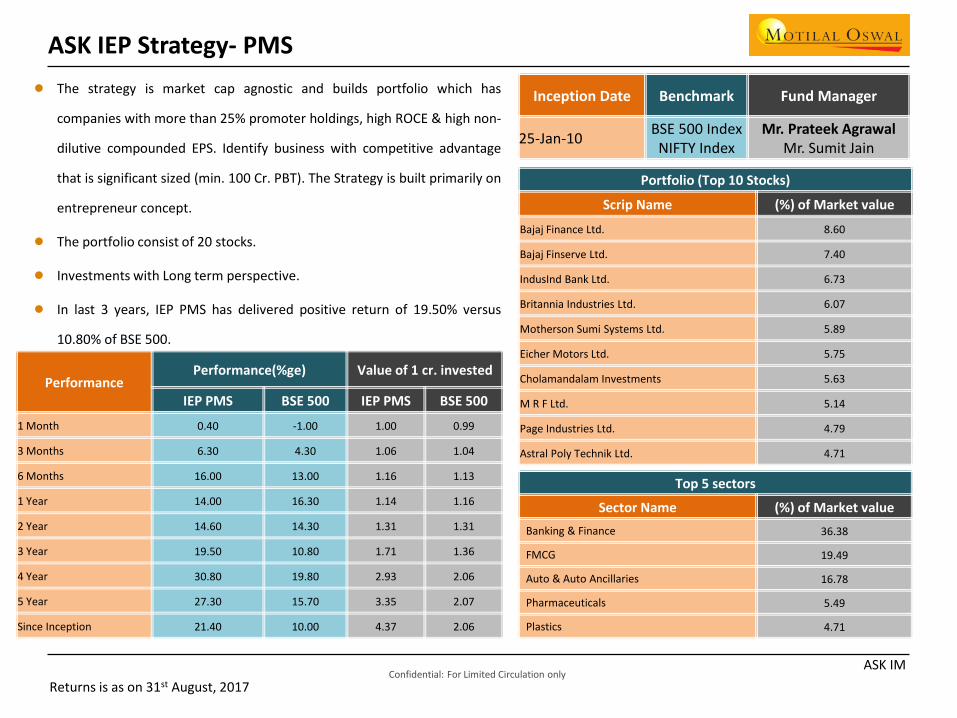
ASK IEP Strategy- PMS
● The strategy is market cap agnostic and builds portfolio which has
companies with more than 25% promoter holdings, high ROCE & high non-
dilutive compounded EPS. Identify business with competitive advantage
that is significant sized (min. 100 Cr. PBT). The Strategy is built primarily on
entrepreneur concept.
● The portfolio consist of 20 stocks.
● Investments with Long term perspective.
● In last 3 years, IEP PMS has delivered positive return of 19.50% versus
10.80% of BSE 500.
Returns is as on 31st August, 2017
ASK IM
PerformancePerformance(%ge) Value of 1 cr. invested
IEP PMS BSE 500 IEP PMS BSE 500
1 Month 0.40 -1.00 1.00 0.99
3 Months 6.30 4.30 1.06 1.04
6 Months 16.00 13.00 1.16 1.13
1 Year 14.00 16.30 1.14 1.16
2 Year 14.60 14.30 1.31 1.31
3 Year 19.50 10.80 1.71 1.36
4 Year 30.80 19.80 2.93 2.06
5 Year 27.30 15.70 3.35 2.07
Since Inception 21.40 10.00 4.37 2.06
Portfolio (Top 10 Stocks)
Scrip Name (%) of Market value
Bajaj Finance Ltd. 8.60
Bajaj Finserve Ltd. 7.40
IndusInd Bank Ltd. 6.73
Britannia Industries Ltd. 6.07
Motherson Sumi Systems Ltd. 5.89
Eicher Motors Ltd. 5.75
Cholamandalam Investments 5.63
M R F Ltd. 5.14
Page Industries Ltd. 4.79
Astral Poly Technik Ltd. 4.71
Top 5 sectors
Sector Name (%) of Market value
Banking & Finance 36.38
FMCG 19.49
Auto & Auto Ancillaries 16.78
Pharmaceuticals 5.49
Plastics 4.71
Inception Date Benchmark Fund Manager
25-Jan-10BSE 500 Index
NIFTY IndexMr. Prateek Agrawal
Mr. Sumit Jain
Confidential: For Limited Circulation only
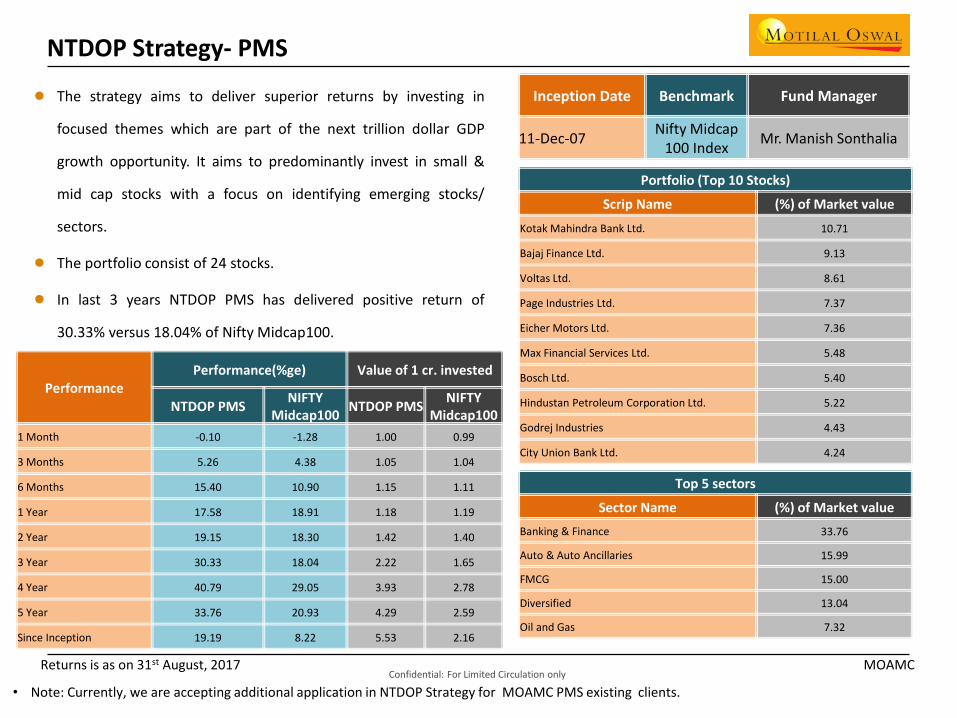
NTDOP Strategy- PMS
● The strategy aims to deliver superior returns by investing in
focused themes which are part of the next trillion dollar GDP
growth opportunity. It aims to predominantly invest in small &
mid cap stocks with a focus on identifying emerging stocks/
sectors.
● The portfolio consist of 24 stocks.
● In last 3 years NTDOP PMS has delivered positive return of
30.33% versus 18.04% of Nifty Midcap100.
Returns is as on 31st August, 2017 MOAMC
PerformancePerformance(%ge) Value of 1 cr. invested
NTDOP PMSNIFTY
Midcap100NTDOP PMS
NIFTY Midcap100
1 Month -0.10 -1.28 1.00 0.99
3 Months 5.26 4.38 1.05 1.04
6 Months 15.40 10.90 1.15 1.11
1 Year 17.58 18.91 1.18 1.19
2 Year 19.15 18.30 1.42 1.40
3 Year 30.33 18.04 2.22 1.65
4 Year 40.79 29.05 3.93 2.78
5 Year 33.76 20.93 4.29 2.59
Since Inception 19.19 8.22 5.53 2.16
Portfolio (Top 10 Stocks)
Scrip Name (%) of Market value
Kotak Mahindra Bank Ltd. 10.71
Bajaj Finance Ltd. 9.13
Voltas Ltd. 8.61
Page Industries Ltd. 7.37
Eicher Motors Ltd. 7.36
Max Financial Services Ltd. 5.48
Bosch Ltd. 5.40
Hindustan Petroleum Corporation Ltd. 5.22
Godrej Industries 4.43
City Union Bank Ltd. 4.24
Top 5 sectors
Sector Name (%) of Market value
Banking & Finance 33.76
Auto & Auto Ancillaries 15.99
FMCG 15.00
Diversified 13.04
Oil and Gas 7.32
Inception Date Benchmark Fund Manager
11-Dec-07Nifty Midcap
100 IndexMr. Manish Sonthalia
• Note: Currently, we are accepting additional application in NTDOP Strategy for MOAMC PMS existing clients.
Confidential: For Limited Circulation only
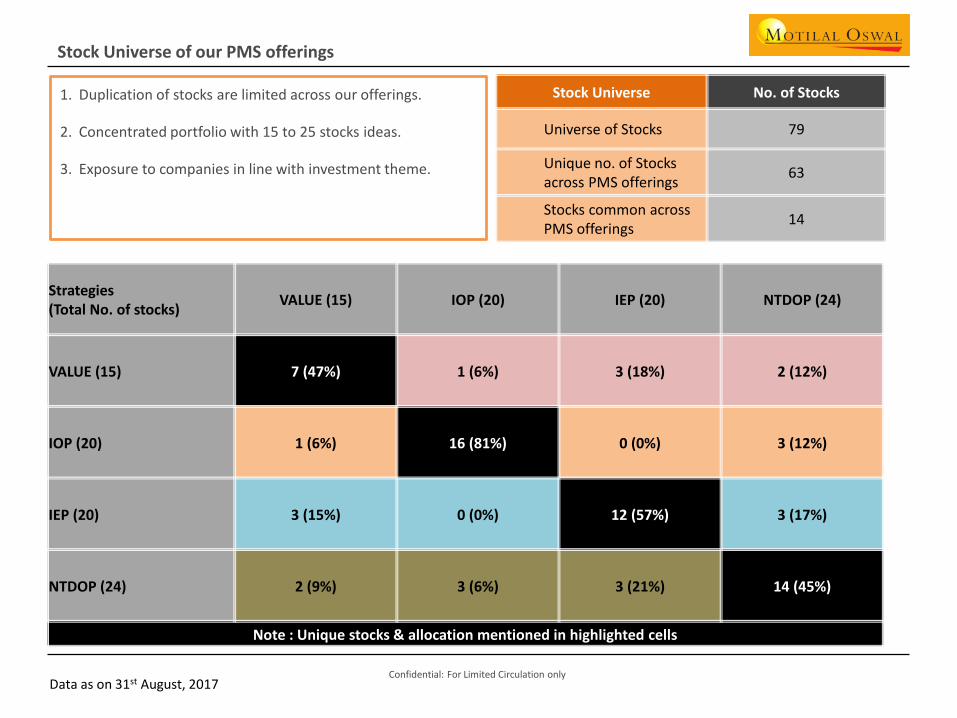
1. Duplication of stocks are limited across our offerings.
2. Concentrated portfolio with 15 to 25 stocks ideas.
3. Exposure to companies in line with investment theme.
Stock Universe of our PMS offerings
Stock Universe No. of Stocks
Universe of Stocks 79
Unique no. of Stocks across PMS offerings
63
Stocks common across PMS offerings
14
Strategies(Total No. of stocks)
VALUE (15) IOP (20) IEP (20) NTDOP (24)
VALUE (15) 7 (47%) 1 (6%) 3 (18%) 2 (12%)
IOP (20) 1 (6%) 16 (81%) 0 (0%) 3 (12%)
IEP (20) 3 (15%) 0 (0%) 12 (57%) 3 (17%)
NTDOP (24) 2 (9%) 3 (6%) 3 (21%) 14 (45%)
Note : Unique stocks & allocation mentioned in highlighted cells
Data as on 31st August, 2017
Confidential: For Limited Circulation only
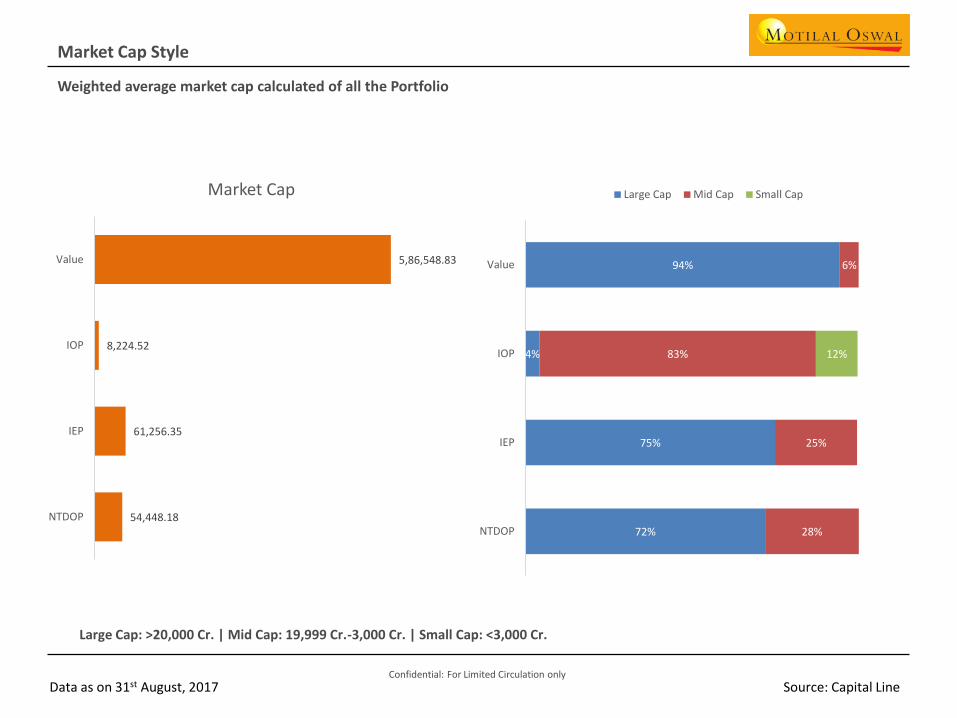
Large Cap: >20,000 Cr. | Mid Cap: 19,999 Cr.-3,000 Cr. | Small Cap: <3,000 Cr.
Weighted average market cap calculated of all the Portfolio
Market Cap Style
Source: Capital LineData as on 31st August, 2017
54,448.18
61,256.35
8,224.52
5,86,548.83
NTDOP
IEP
IOP
Value
Market Cap
72%
75%
4%
94%
28%
25%
83%
6%
12%
NTDOP
IEP
IOP
Value
Large Cap Mid Cap Small Cap
Confidential: For Limited Circulation only
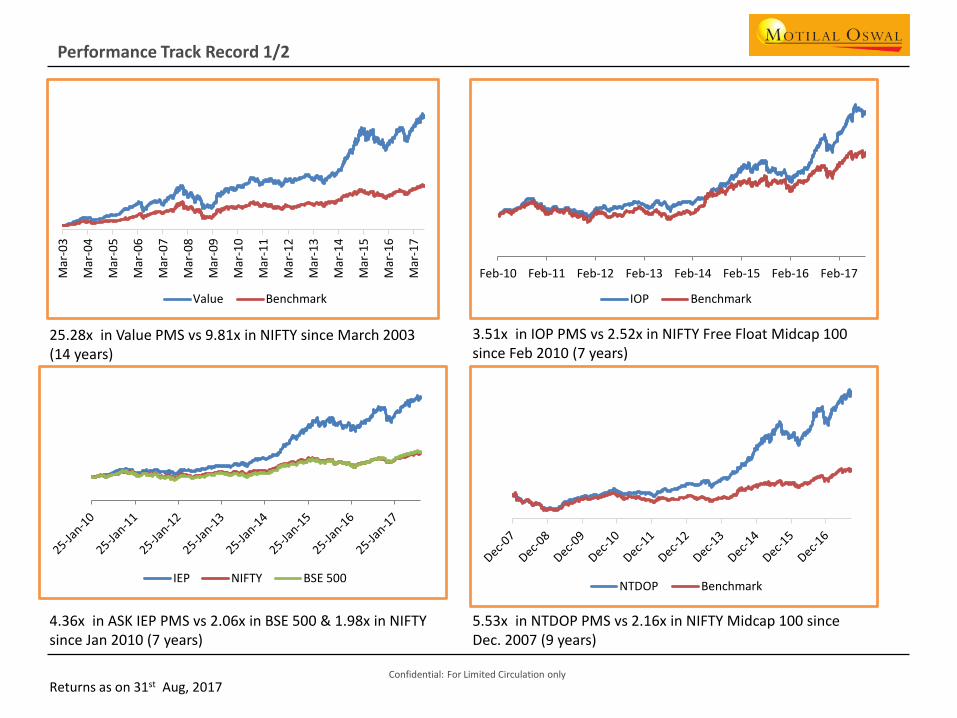
Performance Track Record 1/2
25.28x in Value PMS vs 9.81x in NIFTY since March 2003 (14 years)
3.51x in IOP PMS vs 2.52x in NIFTY Free Float Midcap 100 since Feb 2010 (7 years)
4.36x in ASK IEP PMS vs 2.06x in BSE 500 & 1.98x in NIFTY since Jan 2010 (7 years)
5.53x in NTDOP PMS vs 2.16x in NIFTY Midcap 100 since Dec. 2007 (9 years)
Returns as on 31st Aug, 2017
Mar
-03
Mar
-04
Mar
-05
Mar
-06
Mar
-07
Mar
-08
Mar
-09
Mar
-10
Mar
-11
Mar
-12
Mar
-13
Mar
-14
Mar
-15
Mar
-16
Mar
-17
Value Benchmark
NTDOP Benchmark
Feb-10 Feb-11 Feb-12 Feb-13 Feb-14 Feb-15 Feb-16 Feb-17
IOP Benchmark
IEP NIFTY BSE 500
Confidential: For Limited Circulation only
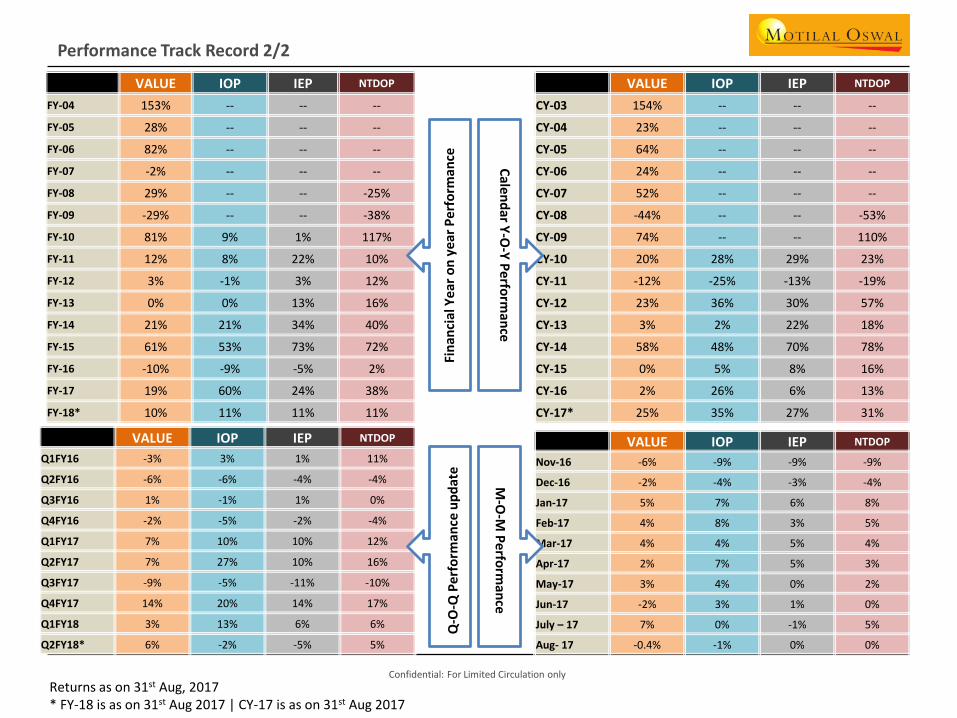
Performance Track Record 2/2
VALUE IOP IEP NTDOP
FY-04 153% -- -- --
FY-05 28% -- -- --
FY-06 82% -- -- --
FY-07 -2% -- -- --
FY-08 29% -- -- -25%
FY-09 -29% -- -- -38%
FY-10 81% 9% 1% 117%
FY-11 12% 8% 22% 10%
FY-12 3% -1% 3% 12%
FY-13 0% 0% 13% 16%
FY-14 21% 21% 34% 40%
FY-15 61% 53% 73% 72%
FY-16 -10% -9% -5% 2%
FY-17 19% 60% 24% 38%
FY-18* 10% 11% 11% 11%
VALUE IOP IEP NTDOP
CY-03 154% -- -- --
CY-04 23% -- -- --
CY-05 64% -- -- --
CY-06 24% -- -- --
CY-07 52% -- -- --
CY-08 -44% -- -- -53%
CY-09 74% -- -- 110%
CY-10 20% 28% 29% 23%
CY-11 -12% -25% -13% -19%
CY-12 23% 36% 30% 57%
CY-13 3% 2% 22% 18%
CY-14 58% 48% 70% 78%
CY-15 0% 5% 8% 16%
CY-16 2% 26% 6% 13%
CY-17* 25% 35% 27% 31%
VALUE IOP IEP NTDOP
Q1FY16 -3% 3% 1% 11%
Q2FY16 -6% -6% -4% -4%
Q3FY16 1% -1% 1% 0%
Q4FY16 -2% -5% -2% -4%
Q1FY17 7% 10% 10% 12%
Q2FY17 7% 27% 10% 16%
Q3FY17 -9% -5% -11% -10%
Q4FY17 14% 20% 14% 17%
Q1FY18 3% 13% 6% 6%
Q2FY18* 6% -2% -5% 5%
VALUE IOP IEP NTDOP
Nov-16 -6% -9% -9% -9%
Dec-16 -2% -4% -3% -4%
Jan-17 5% 7% 6% 8%
Feb-17 4% 8% 3% 5%
Mar-17 4% 4% 5% 4%
Apr-17 2% 7% 5% 3%
May-17 3% 4% 0% 2%
Jun-17 -2% 3% 1% 0%
July – 17 7% 0% -1% 5%
Aug- 17 -0.4% -1% 0% 0%
Fin
anci
al Y
ear
on
ye
ar P
erf
orm
ance
Q-O
-Q P
erf
orm
ance
up
dat
eM
-O-M
Pe
rform
ance
Cale
nd
ar Y-O
-Y P
erfo
rman
ce
Returns as on 31st Aug, 2017* FY-18 is as on 31st Aug 2017 | CY-17 is as on 31st Aug 2017
Confidential: For Limited Circulation only
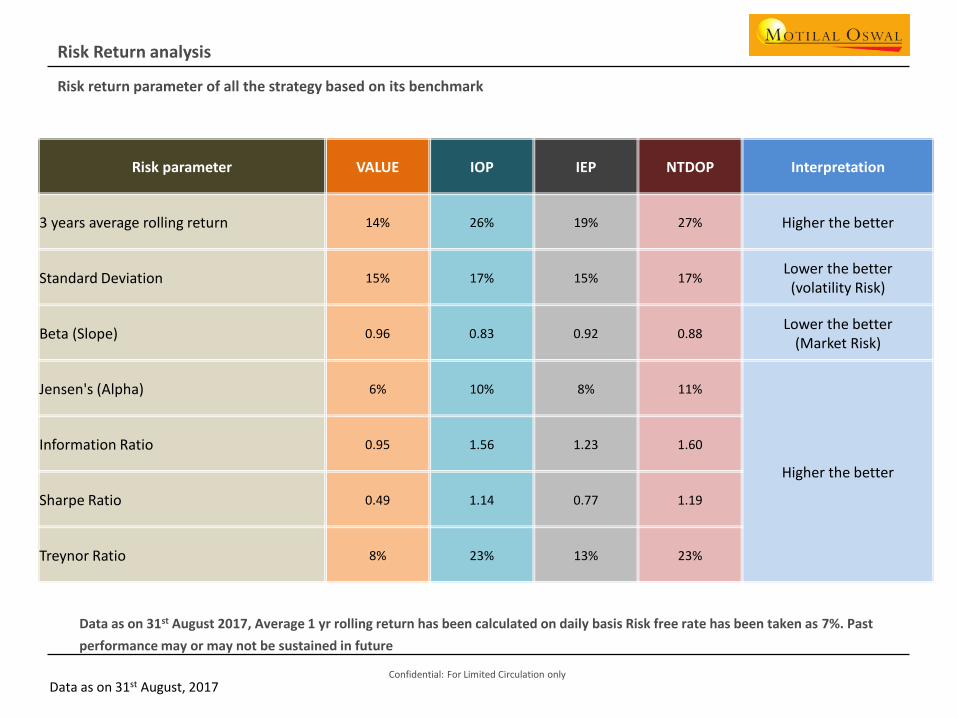
Data as on 31st August 2017, Average 1 yr rolling return has been calculated on daily basis Risk free rate has been taken as 7%. Past
performance may or may not be sustained in future
Risk return parameter of all the strategy based on its benchmark
Risk Return analysis
Risk parameter VALUE IOP IEP NTDOP Interpretation
3 years average rolling return 14% 26% 19% 27% Higher the better
Standard Deviation 15% 17% 15% 17%Lower the better
(volatility Risk)
Beta (Slope) 0.96 0.83 0.92 0.88Lower the better
(Market Risk)
Jensen's (Alpha) 6% 10% 8% 11%
Higher the better
Information Ratio 0.95 1.56 1.23 1.60
Sharpe Ratio 0.49 1.14 0.77 1.19
Treynor Ratio 8% 23% 13% 23%
Data as on 31st August, 2017
Confidential: For Limited Circulation only
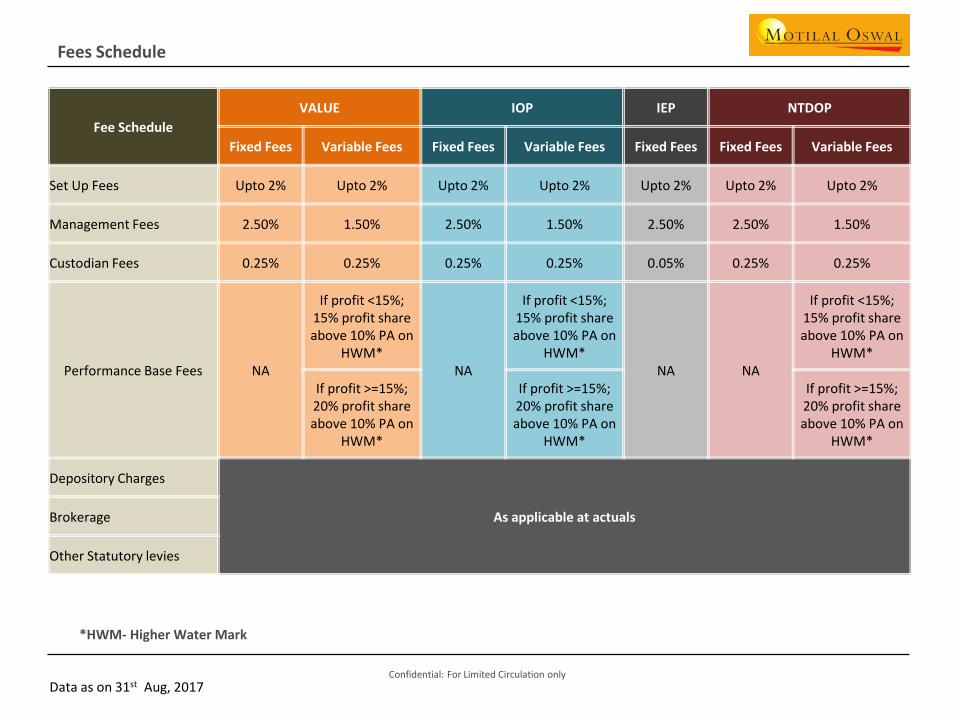
*HWM- Higher Water Mark
Fees Schedule
Fee Schedule
VALUE IOP IEP NTDOP
Fixed Fees Variable Fees Fixed Fees Variable Fees Fixed Fees Fixed Fees Variable Fees
Set Up Fees Upto 2% Upto 2% Upto 2% Upto 2% Upto 2% Upto 2% Upto 2%
Management Fees 2.50% 1.50% 2.50% 1.50% 2.50% 2.50% 1.50%
Custodian Fees 0.25% 0.25% 0.25% 0.25% 0.05% 0.25% 0.25%
Performance Base Fees NA
If profit <15%; 15% profit share above 10% PA on
HWM*NA
If profit <15%; 15% profit share above 10% PA on
HWM*NA NA
If profit <15%; 15% profit share above 10% PA on
HWM*
If profit >=15%; 20% profit share above 10% PA on
HWM*
If profit >=15%; 20% profit share above 10% PA on
HWM*
If profit >=15%; 20% profit share above 10% PA on
HWM*
Depository Charges
As applicable at actualsBrokerage
Other Statutory levies
Data as on 31st Aug, 2017
Confidential: For Limited Circulation only
Motilal Oswal Securities Ltd. (MOSL) Member of NSE, BSE & MSEI - CIN no.: U65990MH1994PLC079418
Registered Office Address: Motilal Oswal Tower, Rahimtullah Sayani Road, Opposite Parel ST Depot, Prabhadevi, Mumbai-400025; Tel No.: 022-3980 4263; www.motilaloswal.com.
Correspondence Address: Palm Spring Centre, 2nd Floor, Palm Court Complex, New Link Road, Malad (West), Mumbai- 400 064. Tel No: 022 3080 1000. Registration Nos.: NSE (Cash):
INB231041238; NSE (F&O): INF231041238; NSE (CD): INE231041238; BSE(Cash): INB011041257; BSE(F&O): INF011041257; BSE(CD); MSEI(Cash): INB261041231; MSEI(F&O): INF261041231;
MSEI(CD): INE261041231; CDSL: IN-DP-16-2015; NSDL: IN-DP-NSDL-152-2000; Research Analyst: INH000000412. AMFI: ARN 17397. Investment Adviser: INA000007100. Motilal Oswal Asset
Management Company Ltd. (MOAMC): PMS (Registration No.: INP000000670); PMS and Mutual Funds are offered through MOAMC which is group company of MOSL. Motilal Oswal Wealth
Management Ltd. (MOWML): PMS (Registration No.: INP000004409) is offered through MOWML which is a group company of MOSL. *Motilal Oswal Securities Ltd. is a distributor of Mutual
Funds, PMS, Fixed Deposit, Bond, NCDs, Insurance and IPOs. *Commodities are offered through Motilal Oswal Commodities Broker Pvt. Ltd. which is a group company of MOSL. *Real Estate is
offered through Motilal Oswal Real Estate Investment Advisors II Pvt. Ltd. which is a group company of MOFSL. *Private Equity is offered through Motilal Oswal Private Equity Investment
Advisors Pvt. Ltd which is a group company of MOFSL. *Research & Advisory services is backed by proper research and does not pertain to purchase or sale of any particular commodity. Please
read the Risk Disclosure Document prescribed by the Stock Exchanges carefully before investing. There is no assurance or guarantee of the returns. Details of Compliance Officer: Name: Neeraj
Agarwal, Email ID: [email protected], Contact No.:022-30801085. **Business Partner is an authorized sub-broker Motilal Oswal Securities Ltd. ^Account would be open after all procedure
relating to IPV and client due diligence is completed. ^Accounts would be open by using esign and all proofs would be collected in soft form.
* AUM Mentioned here is combined AUM of MOSL in all investment Products ( PMS, MF, fixed income, IREF)
Products mentioned in presentation are Third party product offered by MOSL
Investment in securities market are subject to market risk, read all the related documents carefully before investing.
18
Thank You !