Embed Size (px)
Citation preview

PODS:Interpreting Spatial and Temporal
Environmental Information
Edoardo (Edo) Biagioni
University of Hawai’i at Mānoa
The Challenge
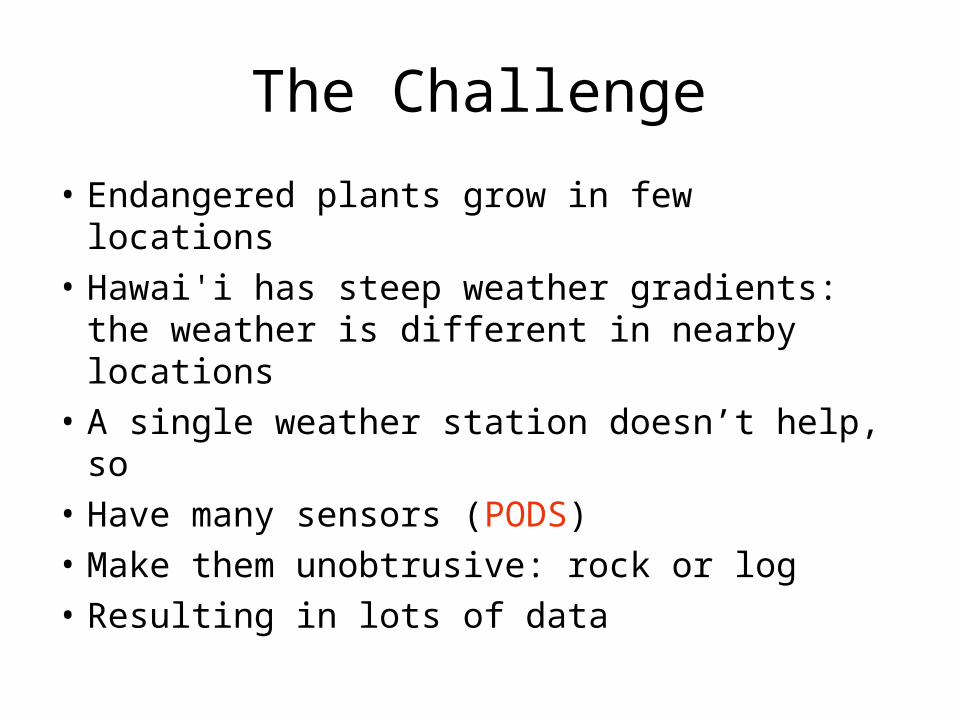
• Endangered plants grow in few locations
• Hawai'i has steep weather gradients: the weather is different in nearby locations
• A single weather station doesn’t help, so
• Have many sensors (PODS)
• Make them unobtrusive: rock or log
• Resulting in lots of data
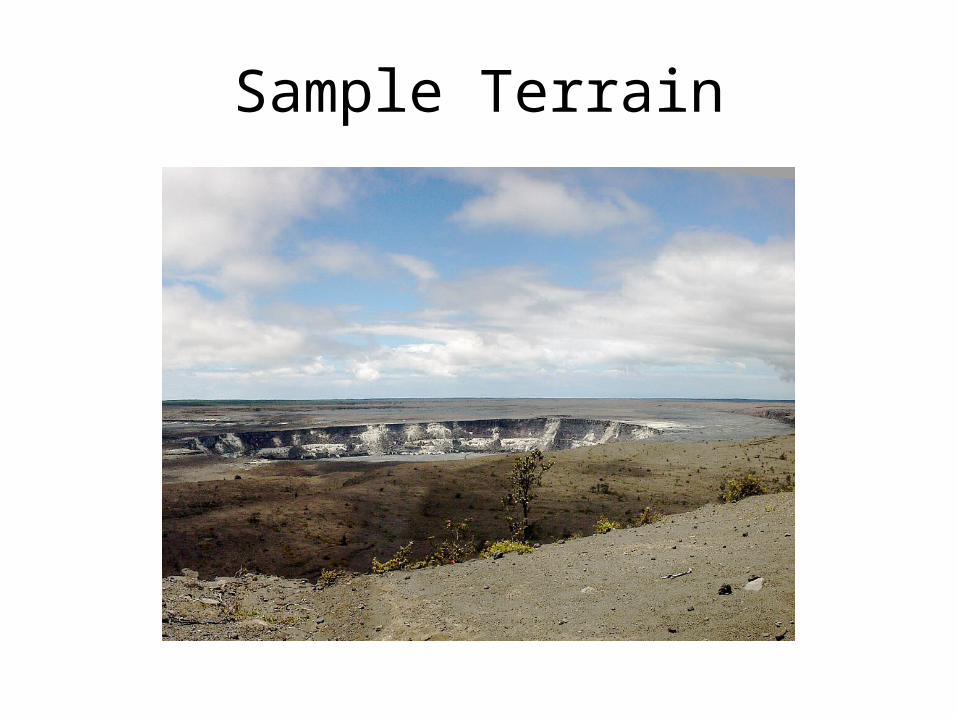
Sample Terrain
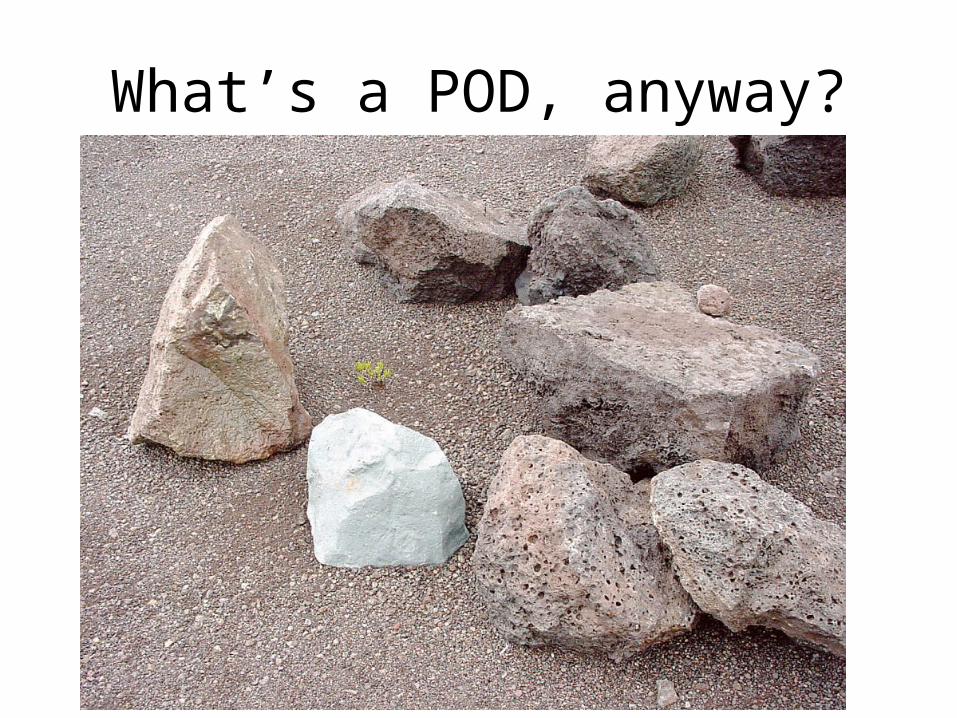
What’s a POD, anyway?

Inside a “Rock”
temperature
humidity
light
wind (bend)
Computer& Radio
Batteries
Internal: voltage

Data Collection
• Wind, Rain, Temperature, Light, Moisture
• At each pod
• Every 5 minutes to 1 hour, for years
• Images at some of the pods
• Networking challenge: getting the data back without discharging the batteries
• How to make sense of all this data?

Spatial Patterns
• Wet and dry areas have different plants
• Cold and warm areas have different plants
• Where is the boundary? The boundary will be different for different plant species
• Does cloud cover matter?
• Does wind matter? Pollinators, herbivores
Temporal Patterns
• Is this a warm summer? Winter?
• Is it a warm summer everywhere, or just in some places?
• Does it rain more when it is warmer?
• What events cause flowering?
• How long does it take the plant to recover after an herbivore passes?

Endangered: Silene Hawaiiensis
Who needs the Information?
• Scientists (botanists)
• High-School Students
• Virtual Tourists
What use is the Information?
• Study the plants, prevent decline
• Determine what is essential for the plant’s survival: e.g., how will global warming affect it?
• Locate alternative areas
• Watch what happens, instead of trying to reconstruct what happened
• Capture rare phenomena
How is the data communicated?
• Graphs, maps, tables
• Tables unwieldy for large numbers of PODS
• Graphs need many different scales
• Maps can help intuitive understanding
• Ultimately, need to find useful patterns
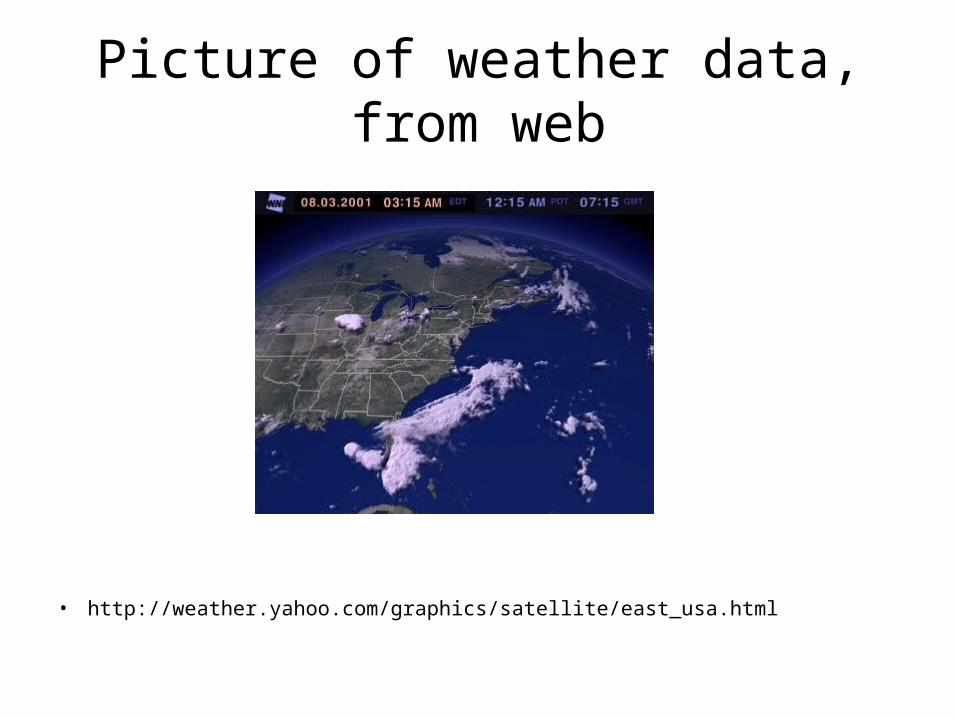
Picture of weather data, from web
• http://weather.yahoo.com/graphics/satellite/east_usa.html

Simple Map
http://red2.ics.hawaii.edu/cgi-bin/location
Blue: rain
Big Blue: recent rain
Cyan: cool, dry
Red: warm, dry
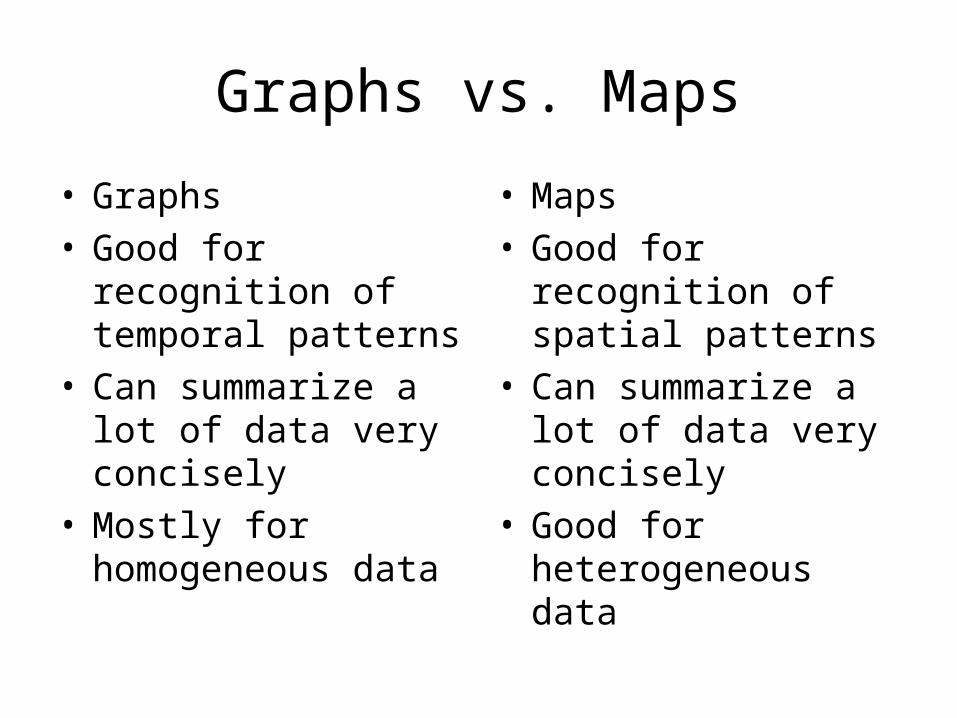
Graphs vs. Maps
• Graphs• Good for recognition
of temporal patterns• Can summarize a lot
of data very concisely• Mostly for
homogeneous data
• Maps• Good for recognition
of spatial patterns• Can summarize a lot
of data very concisely• Good for
heterogeneous data

Strategies
• Data Mining: search data for patterns, try to match to plant distribution
• Machine Learning: try to predict new data. If prediction is wrong, something unpredicted (unpredictable!) is happening
• Better maps, incorporating lots of data including images, but in a way that supports intuitive analysis

Better Map
Not (yet) automated on the web…
Blue: rain
Red: temperature
Yellow: sunlight
Plant population

Where to go from here
• Plant “surveillance”: being there, remotely
• Data Collection is only the essential first step
• Data Analysis must be supported by appropriate tools
• Find out what really matters in the life of an endangered plant

Acknowledgements and Links
• Co-Principal Investigators: Kim Bridges, Brian Chee
• Students: Shu Chen, Michael Lurvey, Dan Morton, Bryan Norman, and many more
• http://www.botany.hawaii.edu/pods/ pictures, data
• http://www.ics.hawaii.edu/~esb/pods/ these slides, the paper