Embed Size (px)
Citation preview
2008
-201
2 U
NAV
CO
PRO
POSA
L: G
EOD
ESY
ADVA
NC
ING
EAR
TH
SC
IEN
CE
RES
EARC
H
3-104 3-105
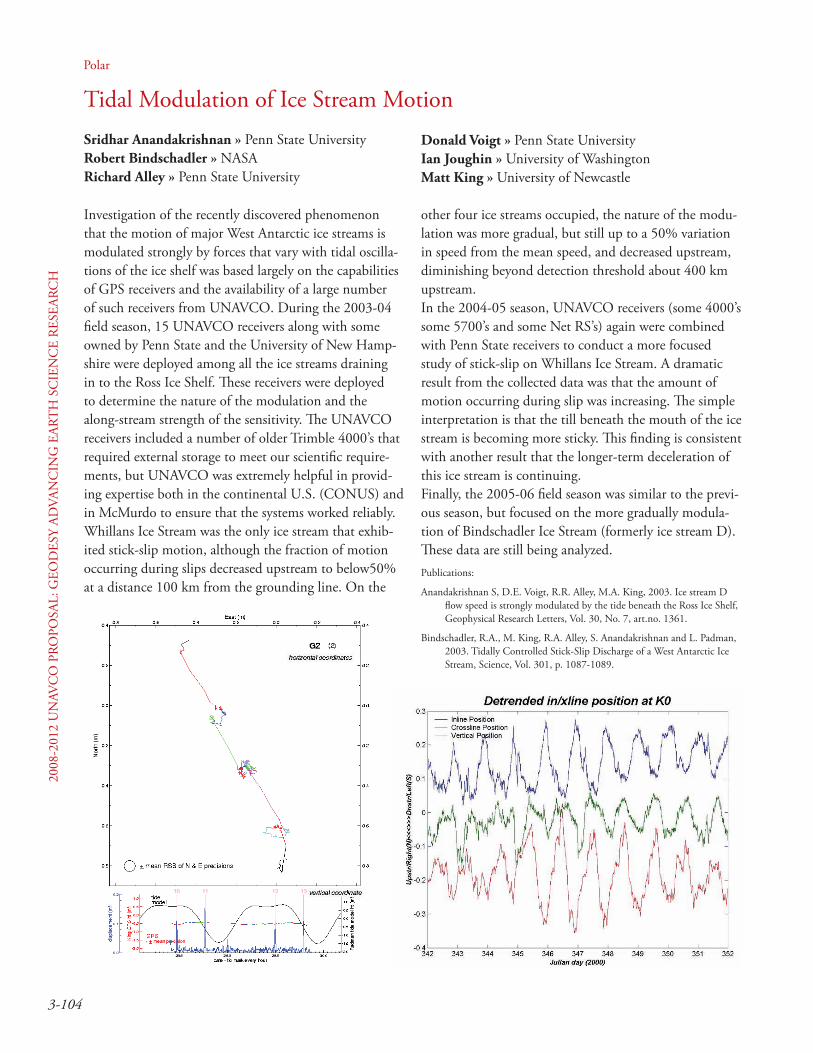
Investigation of the recently discovered phenomenon that the motion of major West Antarctic ice streams is modulated strongly by forces that vary with tidal oscilla-tions of the ice shelf was based largely on the capabilities of GPS receivers and the availability of a large number of such receivers from UNAVCO. During the 2003-04 field season, 15 UNAVCO receivers along with some owned by Penn State and the University of New Hamp-shire were deployed among all the ice streams draining in to the Ross Ice Shelf. These receivers were deployed to determine the nature of the modulation and the along-stream strength of the sensitivity. The UNAVCO receivers included a number of older Trimble 4000’s that required external storage to meet our scientific require-ments, but UNAVCO was extremely helpful in provid-ing expertise both in the continental U.S. (CONUS) and in McMurdo to ensure that the systems worked reliably.Whillans Ice Stream was the only ice stream that exhib-ited stick-slip motion, although the fraction of motion occurring during slips decreased upstream to below50% at a distance 100 km from the grounding line. On the
Tidal Modulation of Ice Stream MotionSridhar Anandakrishnan » Penn State UniversityRobert Bindschadler » NASARichard Alley » Penn State University
Polar
other four ice streams occupied, the nature of the modu-lation was more gradual, but still up to a 50% variation in speed from the mean speed, and decreased upstream, diminishing beyond detection threshold about 400 km upstream.In the 2004-05 season, UNAVCO receivers (some 4000’s some 5700’s and some Net RS’s) again were combined with Penn State receivers to conduct a more focused study of stick-slip on Whillans Ice Stream. A dramatic result from the collected data was that the amount of motion occurring during slip was increasing. The simple interpretation is that the till beneath the mouth of the ice stream is becoming more sticky. This finding is consistent with another result that the longer-term deceleration of this ice stream is continuing.Finally, the 2005-06 field season was similar to the previ-ous season, but focused on the more gradually modula-tion of Bindschadler Ice Stream (formerly ice stream D). These data are still being analyzed.
Donald Voigt » Penn State UniversityIan Joughin » University of WashingtonMatt King » University of Newcastle
Publications:
Anandakrishnan S, D.E. Voigt, R.R. Alley, M.A. King, 2003. Ice stream D flow speed is strongly modulated by the tide beneath the Ross Ice Shelf, Geophysical Research Letters, Vol. 30, No. 7, art.no. 1361.
Bindschadler, R.A., M. King, R.A. Alley, S. Anandakrishnan and L. Padman, 2003. Tidally Controlled Stick-Slip Discharge of a West Antarctic Ice Stream, Science, Vol. 301, p. 1087-1089.

3-104
2008-2012 UN
AVC
O PRO
POSAL: G
EOD
ESY ADVAN
CIN
G EART
H SC
IENC
E RESEARC
H
3-105
Observations and Models of Tidally Pulsed Flow of the Ross Ice Shelf, Antarctica
Kelly M. Brunt » Dept of Geological Sciences, University of MontanaLuke Copeland » University of Ottawa, CanadaEmily B. O’Donnell » Dept of Geophysical Sciences, University of ChicagoDouglas R. MacAyeal » Dept of Geophysical Sciences, University of Chicago
Polar
We examine the temporal pulsation of ice-stream flow associ-ated with ocean tide along the Siple Coast of West Antarctica using observations of similar flow pulsations at three locations near the front of the Ross Ice Shelf (RIS). A 16-day campaign of geodetic GPS observations was conducted at the front of the RIS (and processed using the Canadian PPP processor) where time-average flow of the ice shelf has greatest magnitude. The data reveal a smooth, diurnal cycle of horizontal flow vary-ing both along and transverse to the direction of time-average flow (Figure 1). The amplitude of tidally pulsed velocity is approximately 70% of the time-average flow (about 3 m/day at all three locations), and maxima of velocity along the direc-tion of time-average flow appear to lag local high tide by only an hour or two. This tidally driven flow pulsation is consistent with magnitudes observed at the grounding line of ice stream D [Anandakrishnan et al., 2003], and the degree to which flow pulsations vary in both along and across time-average flow direction is consistent with observations on the Brunt Ice Shelf [Doake et al., 2002].To assess the possible causes of tidal pulsations of ice-shelf and ice-stream flow, we conduct a series of ice-shelf model experi-ments using ocean tidal fields provided by the Padman et al. [2002] tide model analysis (Figure 2). We evaluate four separate hypotheses: that tidal pulsations are caused by (1) sea-surface slope and sub-ice-shelf currents associated with tide alone act-ing on ice-shelf creep rates, (2) velocity pulsations at grounding lines (ice stream inflows) alone acting on ice-shelf boundary conditions, (3) accordion-like collapse and expansion of void space within and at the edges of the RIS, and (4) stick-slip like behavior of ice-shelf flow over pinning points and past stagnant coastal boundaries. Initial results suggest that hypothesis (1) is unable to explain the full magnitude of the flow pulsations.
References
Anandakrishnan, S., D. E. Voigt, R. B. Alley, and M. A. King (2003), Ice Stream D flow speed is strongly modulated by the tide beneath the Ross Ice Shelf. Geophys. Res. Lett., 30(7), 13-1.
Figure 1: Geodetic GPS data illustrating the horizontal (longitudi-nal) variations at Nascent Iceberg as a function of time.
Figure 2: Predicted tidal height for GPS location data collected at Nascent Iceberg based on Padman et al. [2002]; the z-axis, or color axis, is in units of meters. Periods of high tide (red regions) are consistently associated with the most northward movement; periods of low tide are consistently associated with little northward movement.
Doake, C. S. M., H. F. J. Corr, K. W. Nicholls, A. Gaffikin, A. Jenkins, W. I. Bertiger, and M. A. King (2002), Tide-induced lateral movement of Brunt Ice Shelf, Ant-arctica. Geophys. Res. Lett., 29(8), 67-1.
Padman, L., H. A. Fricker, R. Coleman, S. Howard, and L. Erofeeva (2002), A new tide model for the Antarctic ice shelves and seas. Ann. Glaciol., 34(1), 247-254.

2008
-201
2 U
NAV
CO
PRO
POSA
L: G
EOD
ESY
ADVA
NC
ING
EAR
TH
SC
IEN
CE
RES
EARC
H
3-106 3-107
Erosion of Earth’s surface is generally assumed to be ubiquitous, but published findings from the Antarctic Dry Val-leys suggest nearly total preservation of ancient landscapes (~10 million years old). Our recent field observations on the active degradation of glacial moraines contradict the suggested stability of the Dry Valley’s landscape. Differential GPS was used to create high-resolution topographic profiles of previously dated moraines in the lower Wright valley. To calculate rates of surface erosion and magnitudes of topographic diffusivity, a computer model was used with the assumption that glacial moraines start with sharp crested profiles, which over time become smeared and rounded by erosion. Using the field data to constrain the parameters, the model tracked soil transport over the moraine surface and the relaxation of the moraine slopes over time. By visual inspection and simple slope angle measurements it can be shown that the moraines of the Dry Valleys are slowly degrading and the maximum values for topographic dif-fusivity are slightly lower than other arid climates around the world.
Funding for this project was provided by NSF OPP #338224 Stability of Landscapes and Ice Sheets in Dry Valleys, Antarctica: a Systematic Study of Exposure Ages of Soils and Surface Deposits.
Soil Erosion in Dry Valleys, AntarcticaJon Connolly » Department of Earth and Space Sciences, University of WashingtonJaakko Putkonen » Department of Earth and Space Sciences, University of Washington
Polar

3-106
2008-2012 UN
AVC
O PRO
POSAL: G
EOD
ESY ADVAN
CIN
G EART
H SC
IENC
E RESEARC
H
3-107
Histories of Climate and Ice Sheet DynamicsH. Conway » Dept of Earth and Space Sciences, University of WashingtonE.D Waddington » Dept of Earth and Space Sciences, University of WashingtonC.F. Raymond » Dept of Earth and Space Sciences, University of Washington
Polar
Polar ice sheets contain information about past climate and past ice dynamics in their internal stratigraphy, which consists of isochronous layers of accumulated snow, subsequently deformed by ice flow. This stratigra-phy has been widely imaged by ice-penetrating radars. When combined with continuous profiles of ice-sheet topography along flow lines as obtained with kinematic GPS, and measurements of ice motion and strain rate, these layers reveal spatial and temporal patterns of snow accumulation (Nereson et al., 2000; Waddington et al., in review) as well as histories of ice-sheet configuration and flow (Conway et al., 1999; Nereson and Raymond, 2001; Conway et al., 2002; Ng and Conway, 2004; Catania et al., 2005; 2006; Raymond et al., 2006). GPS data is routinely used in glaciology studies, and is crucial to the advancement of our modern day understanding of ice dynamics.
References
Catania, G., H. Conway, C.F. Raymond and T.A. Scambos, 2005. Surface morphology and internal layer stratigraphy in the downstream end of Kamb Ice Stream, West Antarctica. J. Glaciology, 51(174), 423-431.
Catania, G., H. Conway, C.F. Raymond and T.A. Scambos, 2006. Evidence for grounding-line fluctuations prior to the stagnation of Kamb Ice Stream, West Antarctica. J. Geophys. Res. 111 F01005, doi:10.1029/2005JF000355..
Conway, H., B.L. Hall, G.H. Denton, A.M. Gades, and E.D. Waddington. 1999. Past and future grounding-line retreat of the West Antarctic Ice Sheet. Science, 286(5438), 280-283.
Conway, H., G. Catania, C. F. Raymond, A. M. Gades, T. A. Scambos and H. Engelhardt, 2002. Switch of flow direction in an Antarctic ice stream. Nature, 419, 465-467.
Nereson, N.A. and C.F. Raymond,2001. The elevation history of ice streams and the spatial accumulation pattern along the Siple Coast of West Antarctica inferred from ground-based radar data from three inter-ice-stream ridges. Journal of Glaciology, 47(157) 303-313.
Nereson, N.A., C.F. Raymond, R.W. Jacobel and E.D. Waddington. 2000. The accumulation pattern across Siple Dome, West Antarctica, inferred from radar-detected internal layers. Journal of Glaciology, 46(152), 75-87.
Ng, F. and H. Conway, 2004. Fast-flow signature in the stagnated Kamb Ice Stream, West Antarctica. Geology, 32(6), 481-484.
Raymond, C.F., G.A. Catania, N.A. nereson and C.J. van der Veen, 2006. Bed radar reflectivity across the north margin of Whillans Ice Stream, West Antarctica, and implications for margin processes. Journal of Glaciology, 52(176), 3-10.
Waddington, E.D., T.A. Neumann, M.R. Koutnik, H.P. Marshall, and D.L. Morse. In review. Inference of accumulation-rate pattern from deep radar layers. Journal of Glaciology.
Research supported by NSF OPP-9316807, OPP-9615347, OPP-9725882, OPP-9909518; OPP-0087144.

2008
-201
2 U
NAV
CO
PRO
POSA
L: G
EOD
ESY
ADVA
NC
ING
EAR
TH
SC
IEN
CE
RES
EARC
H
3-108 3-109
The high accuracy of differential GPS (DGPS) systems allows for their use in measuring glacier ice velocity at high temporal resolutions. A new field research pro-gram was established in 2006 to study the dynamics and climate sensitivity of a surge-type tributary to the Kaskawulsh Glacier in the St Elias Mountains, southwest Yukon Territory, Canada. Three DGPS receivers were installed along a longitudinal profile of the glacier, in order to measure the local ice velocities. One receiver was placed near the terminus in what was thought to be relatively stagnant ice from the last surge, another was placed mid-glacier, and the third was placed in the accumulation zone in the upper glacier. The two upper stations were accompanied by meteorological stations where net radiation, wind speed and direction, air temperature, and relative humidity were monitored at five-minute intervals. The lowermost station was accom-panied by a miniature temperature and relative humidity logger and was not far from the proglacial stream site where temperature, humidity and stream stage were also monitored. Ablation was measured at regular intervals at all three sites, including at half-hourly intervals at the
DGPS Measurement of Ice Motion on a Post-Surge Alpine GlacierChris Doughty » Department of Earth Sciences, Simon Fraser University, CanadaGwenn Flowers » Department of Earth Sciences, Simon Fraser University, Canada
Polar
midstation. We are currently processing the data and examining them for signs of diurnal or other high-reso-lution fluctuations in flow rate that may be related to conditions at the glacier surface. The supraglacial hydrol-ogy varies dramatically over the length of the glacier and we are investigating whether there is a correspondence between slow-flowing ice near the glacier terminus and the dominance of moulin-based supraglacial drainage in that area.Real-time kinematic DGPS surveying was used to create a surface map of the glacier, with the ease of this tech-nique allowing for the collection of over 16,000 data points in a relatively short period of time compared to traditional surveying methods. These data will be combined with ice-penetrating radar measurements of ice thickness to characterize the geometry of the glacier and create digital elevation models that will be used for future numerical modeling studies.
This work was supported by grants from the Canada Foundation for Innova-tion and the Natural Sciences and Engineering Research Council of Canada.

3-108
2008-2012 UN
AVC
O PRO
POSAL: G
EOD
ESY ADVAN
CIN
G EART
H SC
IENC
E RESEARC
H
3-109
Tidal Modulation of Ross-Ice-Shelf Flow and its Relationship with Similar Modulation of Siple Coast Ice-Stream FlowDoug MacAyeal » University of ChicagoKelly Brunt » University of Chicago
Polar
In June 2007, we will propose to the National Science Founda-tion a project that involves deploying 10 UNAVCO geodetic GPS receivers on the Ross Ice Shelf during the 2008-2009 field season. This project is designed to collect GPS data simultaneously along a transect between the front of the Ross Ice Shelf and regions up-stream of the grounding line of Bindschadler Ice Stream (formerly Ice Stream D) for a minimum of two months. Several GPS instru-ments will be configured for 12-month deployment to investigate seasonal effects and the “inverse barometer effect.” The latter effect produces sea-surface displacements comparable to tides, but over different time scales, and should have a modulating effect on ice-shelf flow. Our goal is to better understand the connection between the front of the Ross Ice Shelf and the ice streams, paying close attention to the grounding line region. More GPS data are needed to resolve this relationship.During the 2005-2006 Antarctic field season, geodetic quality GPS receivers were deployed at Nascent Iceberg for two weeks in an effort to examine a diurnal, horizontal motion measured during a three days period of the previous season. A similar diurnal, hori-zontal motion has been observed at Bindschadler (D) Ice Stream (Anandakrishnan et al., 2003). The signal observed in the GPS data at the front of the ice shelf and in the ice stream prompted the generation of an ice shelf model aimed at describing its pos-sible causes. Preliminary model results indicate that the source of the signal is more complex than previously believed; results from two different types of forcing have generated two spatially different responses.Figure 1 is the response of our preliminary model to a tidal forcing. The purple circles represent McMurdo Station and Nascent Iceberg and the dark pink circles, labeled 0, 40, and 80, represent sites on Bindschadler (D) Ice Stream occupied by Anandakrishnan et al. (2003). Figure 2 is similar to Figure 1, however, in this case, the forcing mechanism is a pulse of the ice streams. The gray triangles on both figures represent the 10 proposed GPS sites for this study.
References
Anandakrishnan, S., D. E. Voigt, R. B. Alley, and M. A. King (2003), Ice Stream D flow speed is strongly modulated by the tide beneath the Ross Ice Shelf. Geophys. Res. Lett., 30(7), 13-1.
King, M. A., R. Coleman, and L. Nguyen (2003), Spurious periodic horizontal signals in sub-daily GPS position estimates. J. Geod., 77(1-2), 15-21.
This work was supported formerly by I-190; NSF OPP-0229546.
Figure 1. The spatial response of our preliminary model to a tidal forcing; purple circles represent McMurdo Station and Nascent Iceberg; dark pink circles represent sites occupied by Anandakrishnan et al. (2003); gray triangles represent proposed GPS sites for this study.
Figure 2. The spatial response of our preliminary model to ice stream pulsing; purple circles represent McMurdo Station and Nascent Iceberg; dark pink circles represent sites occupied by Anandakrishnan et al. (2003); gray triangles represent proposed GPS sites for this study.

2008
-201
2 U
NAV
CO
PRO
POSA
L: G
EOD
ESY
ADVA
NC
ING
EAR
TH
SC
IEN
CE
RES
EARC
H
3-110 3-111
Extreme uplift and sea level changes in southeast Alaska have been docu-mented by 1) a regional GPS deforma-tion array consisting of 74 sites (average 1-σ uncertainties: horizontal = ± 0.8 mm/yr, vertical = ± 2.1 mm/yr); 2) 18 tide gauge measurements of sea-level changes (1 σ = ± 5 mm/yr); and 3) 27 raised shoreline measurements of total uplift (1 σ = ± 0.3 m). The GPS data show peak uplift rates of 30 mm/yr in Glacier Bay, and also delineated a second center of rapid uplift east of Yakutat with peak rates of 32 mm/yr. The recent magnitude and distribu-tion of regional sea level rates (up to 25 mm/yr) based on decadal averages of tide gauge measurements in the Glacier Bay area are similar to those found in an earlier study of tide gauge measurements. A combination of dendrochronology and geomorphol-ogy was employed to identify and date raised shorelines throughout the region. These studies documented rapid and continuous total sea level changes of up to 5.5 m, and constrained the age of the ongoing uplift to less than 250 yrs. The raised shorelines show a pattern of higher uplift surrounding the region of peak GPS uplift rates in Glacier Bay, while the dating of these shorelines shows that they began uplifting at the same time the massive Glacier Bay Icefield began its retreat. This is a direct observation of glacial isostatic rebound processes acting on timescales of only a few hundred years in southern Alaska.
Observing Post Little Ice Age Glacier Rebound in Southeast AlaskaRoman J Motyka » Geophysical Institute, University of Alaska FairbanksChristopher F. Larsen » Geophysical Institute, University of Alaska FairbanksJeffrey T. Freymueller » Geophysical Institute, University of Alaska FairbanksKeith A. Echelmeyer » Geophysical Institute, University of Alaska Fairbanks
Polar
Figure 1. GPS uplift rates (mm/yr). GPS stations are shown with red diamonds. Contour interval is 2 mm/yr. Peak uplift rates are found in Glacier Bay (southern peak) and the Yakutat Icefield (northern peak).
References
Larsen, C. F., Freymueller, J. T., Echelmeyer, K. A., and Motyka, R. J., 2003. Tide gauge records of uplift along the Northern Pacific-North American Plate Boundary, 1937 to 2001. Journal of Geophysical Research, 108(B4), 2216-2231.
Larsen, CF, RJ Motyka, JT Freymueller, KA Echelmeyer, and ER Ivins, 2004. Rapid uplift of southern Alaska caused by recent ice loss. Geophysical Journal International, 158, 1118–1133.
Larsen, CF, Motyka, RJ, Freymueller, JT, Echelmeyer, KA, Ivins, ER, 2005. Rapid viscoelastic uplift in southeast Alaska caused by post-Little Ice Age glacial retreat. Earth and Planetary Science Letters 237, 548– 560.
This work was supported by NSF Grants EAR-9870144, EAR-0229934, and EAR-040881.

3-110
2008-2012 UN
AVC
O PRO
POSAL: G
EOD
ESY ADVAN
CIN
G EART
H SC
IENC
E RESEARC
H
3-111
Terminus Dynamics and Active Deformation of Proglacial Sediments at an Advancing Glacier: Taku Glacier, AlaskaRoman J Motyka » Geophysical Institute, University of Alaska FairbanksMartin Truffer » Geophysical Institute, University of Alaska FairbanksKeith A. Echelmeyer » Geophysical Institute, University of Alaska Fairbanks
Polar
Taku Glacier, an advancing former tidewater glacier in Alaska, has been actively pushing its proglacial sediments along part of its terminus over the last 50 years, producing so-called push moraines. The mobilization of these sediments, which were locally lifted more than 20 m above sea level by 2004, has happened episodically rather than steadily. The last major event of proglacial sediment deformation occurred in 2001, presumably caused by sliding along a basal detachment layer. Since then, most deformation has been localized within a few meters of the terminus, including impressive deformational features of the terminal ice, where slabs of ice, tens of centimeters in thickness, have undercut proglacial sediments and vegetation and lifted them up. Between 2002 and 2004, surface veloci-ties and horizontal displacements were measured across the terminus and in the proglacial push moraine area using GPS. Sediment displacement was highest between the end of March and mid-June. A decrease in displacement with distance from the terminus revealed that the sediments were deforming internally rather than along a basal de´collement. An observed wet clay-rich layer presumably acted as a major fault plane dur-ing the 2001 event.
Figure 1. Push moraine area in front of Taku Glacier. (a) Ortho-photo 2002 with terminus positions from 2001 to 2004. The contour lines represent the topography of the glacier surface near the terminus (m HAE). The toes of the bulges are shown with solid lines where based on measurements and with a dashed line where inferred. Points A–E refers to sites where different deformational features at the glacier-sediment interface were observed (note that A is 400 m west of figure boundary). (b) Map view with the contour lines of the glacier bed (m HAE). GPS2003 and GPS2004 are the locations of continuously running GPS. The arrow labeled ‘‘trench’’ shows the location where a trench was dug, and T-T’’ and P-P’-P’’ indicate the profiles discussed in the text. (c) Cross profile along profile P-P’’. The thrust layer at bulge 1 and at the toes of the other bulges was observed. The basal de´collement is inferred from seismic refraction measurements (not shown here).
References
Kuriger, M Truffer, EM, RJ Motyka, and AK Bucki. 2006. Episodic reactivation of large scale push moraines in front of the advancing Taku Glacier, Alaska. J. Geoph. Res., 111(F1), doi:10.1029/2005JF000385.
Motyka, RJ and KA Echelmeyer, 2003. Taku Glacier on the move again: Active defor-mation of proglacial sediments. Journal of Glaciology, 10(164), 50-59.
This work was supported by NSF Grant OPP-0221307.

2008
-201
2 U
NAV
CO
PRO
POSA
L: G
EOD
ESY
ADVA
NC
ING
EAR
TH
SC
IEN
CE
RES
EARC
H
3-112 3-113
During the summer 2006 field season, we undertook a pilot geophysical ex-periment at Helheim Glacier, East Greenland, in which we deployed a network of GPS instruments on and around the glacier to measure the ice deformation field as a function of time. The experiment was motivated by the discovery of a new class of earthquakes occurring at glaciers in Alaska, Antarctica, and Green-land (Ekström et al., 2003). Teleseismic analysis indicates that these glacial earthquakes may result from the rapid sliding of the glacial ice over the glacier bed, but little is understood about the mechanism by which the earthquakes occur. We installed 16 GPS receivers on Helheim glacier, one of Greenland’s largest outlet glaciers, in a network spanning an upglacier distance of ~25 km from a point ~10 km behind the calving front. We also installed three GPS receivers at nearby rock sites to help define a stable reference frame. The sta-tions were deployed in late June 2006, and retrieved in late August 2006. All of the GPS receivers recorded at a rate of at least 1 sample/5 sec. In addition, we operated several receivers for a few days each just behind the calving front dur-ing field visits in late June, late July, and late August, and we recorded the tidal
Helheim 2006: Geodetic Observations Of Glacier FlowM. Nettles » Lamont-Doherty Earth Observatory of Columbia UniversityM. Langer » Lamont-Doherty Earth Observatory of Columbia UniversityG. Ekström » Lamont-Doherty Earth Observatory of Columbia UniversityJ. L. Davis » Harvard-Smithsonian Center for AstrophysicsL. A. Stearns » Climate Change Institute, University of MaineG. S. Hamilton » Climate Change Institute, University of MaineP. Elósegui » Institute for Space Sciences, CSIC/IEEC, SpainT. B. Larsen » Geological Survey of Denmark and Greenland (GEUS), DenmarkA. P. Ahlstrom » Geological Survey of Denmark and Greenland (GEUS), DenmarkS. A. Khan » Danish National Space Center, DenmarkL. Stenseng » Danish National Space Center, DenmarkR. Forsberg » Danish National Space Center, Denmark
Polar
Figure 1. Helheim 2006 network geometry, overlain on a 2001 LANDSAT image.
stage using a pressure sensor near the end of Helheim Fjord for ~3 weeks during the experiment. Initial results show a variation in flow speed from about 25 m/day near the calving front to about 4 m/day at a location 35 km behind the front, resulting in a total linear strain during the deployment of more than 3%. The horizontal flow speeds are tidally
modulated, and an abrupt spatial change in vertical displacements due to the water tide indicates the probable location of the glacier grounding line. We are currently processing the full GPS dataset, and will combine our geodetic results with seismological and glaciologi-cal observations to place constraints on the conditions under which glacial earthquakes are generated and on the dynamics of glacier flow.ReferencesEkström, G., M. Nettles, and G. A. Abers, Glacial earthquakes, Science, 302, 622-624, 2003.Ekström, G., M. Nettles, and V. C. Tsai, Seasonality and increasing frequency of Greenland
glacial earthquakes, Science, 311, 1756-1758, 2006.Joughin, I., Greenland rumbles louder as glaciers accelerate, Science, 311, 1719-1720, 2006.Zwally, H. J., W. Abdalati, T. Herring, K. Larson, J. Saba, and K. Steffen, Surface melt-in-
duced acceleration of Greenland ice-sheet flow, Science, 297, 218-222, 2002.Project funding was provided by NSF-ARC 06-12609, NASA NNG04GL69G, NASA
NNG04-GK39G and others.
Figure 2. Replacing a solar panel in July 2006.

3-112
2008-2012 UN
AVC
O PRO
POSAL: G
EOD
ESY ADVAN
CIN
G EART
H SC
IENC
E RESEARC
H
3-113
Aircraft Based CO2 and Energy Fluxes on the Alaska North SlopeDr. Walt Oechel » Global Change Research Group, San Diego State UniversityRommel Zulueta » Global Change Research Group, San Diego State UniversityJoe Verfaillie » Global Change Research Group, San Diego State University
Polar
San Diego State University (SDSU) and the Global Change Research Group (GCRG) have been carrying out various aspects of ecological research on Arctic ecosystems since the early 1970s. The GCRG is currently heading a comprehensive study involving an integrated framework of multi-scale aircraft and satellite remote sensing, micrometeorological and CO2 and CH4 flux measurements, and hydro-ecological process model simulations over a 350-km North-South transect spanning the dominant Arctic topo-graphic and land cover units of northern Alaska. An extensive soil moisture manipulation involving a 60-hectare tundra flooding/draining experiment near Barrow, Alaska, is also underway. This research examines how biological and physical processes interact to control carbon uptake, storage and release in Arctic tundra ecosystems and how the self-organizing nature of these interactions varies across multiple spatial and temporal scales. Approximately 25% of the world’s soil organic carbon reservoir is stored at high northern latitudes in permafrost and seasonally-thawed soils, a region that is currently undergoing unprecedented warming and drying, as well as dramatic changes in human land use. Understanding how changes in annual and inter-an-nual ecosystem productivity interact and potentially offset the balance and stability of the Arctic soil carbon reservoir is of utmost importance to global climate change science.Since 1999, a light aircraft, the Sky Arrow, has been employed to extend the ground-based measurements over a larger area. The Sky Arrow 650TCN is an FAA certified aircraft from the Italian aircraft manufacturer, Iniziative Industriali Italiane (3I). One of the key components needed to measure CO2 and energy fluxes from the Sky Arrow is wind speed. To calculate wind speed, the motion of the aircraft relative to both the air and the ground must be known as precisely as possible. Airspeed is calculated from a gust probe with pressure sensors and a fluid dynamics model. Ground speed is calcu-lated with GPS attitude, accelerometers and post-processed differential GPS position and velocity measurements. Wind speed is calculated by subtracting
Figure 1. The current Alaska study area is indi-cated by a rectangular overlay of AVHRR satellite data. Permanent, ground-based measurements are located at Barrow, Atqasuk, and Ivotuk. The red dots indicate UNAVCO GPS base stations used by SDSU aircraft operations.
the ground speed from the airspeed. Long flight lines of 100 km or more close to the ground (10 m AGL) and the need for high frequency data (up to 50 Hz) make it necessary to do differential GPS corrections in post processing. The availability of reli-able, high speed (10 Hz) GPS data from the UNAVCO base stations in Barrow and Atqasuk have greatly im-proved the precision and robustness of the ground speed calculations.
Figure 2. Rommel Zulueta, a private pilot and Ph.D. student, flies the SDSU Sky Arrow past an eddy covariance tower on the tundra south of Barrow, Alaska.
ReferencesBrooks, S., Dumas, E., and Verfaillie, J. (2001) Development of the SkyArrow Surface/Atmosphere Flux
Aircraft for Global Ecosystem Research. American Institute of Aeronautics and Astronautics 39th Aerospace Sciences Meeting and Exhibit Proceedings, January 8-11, 2001.
Oechel, W.C., Vourlitis, G.L., Verfaillie, J., Crawford, T., Brooks, S., Dumas, E., Hope, A., Stow, D., Boynton, B., Nosov, V. and Zulueta, R. (2000) A scaling approach for quantifying the net CO2 flux of the Kuparuk River Basin, Alaska. Global Change Biology, 6, 160-173.
Brooks, S.B., Oechel, W.C., and Hastings, S.J., The New FAA Certified SDSU/NSF Sky Arrow ERA (Environmental Research Aircraft) for the Barrow Region 1999 Growing Season Fluxes and Remote Sensing. Arctic System Science Land-Atmosphere-Ice Interactions (ARCSS LAII) 1999 Science Workshop Record of the Meeting, Seattle, WA. March 11-13, 1999.
Oechel WC, Hastings SJ, Jenkins M, Riechers G, Grulke N, and Vourlitis GL. 1993. Recent change of arctic tundra ecosystems from a net carbon sink to a source. Nature. 361: 520-526.
This work is supported by NSF grants OPP-0421588, OPP-0436177, and OPP-0119060.

2008
-201
2 U
NAV
CO
PRO
POSA
L: G
EOD
ESY
ADVA
NC
ING
EAR
TH
SC
IEN
CE
RES
EARC
H
3-114 3-115
We used precision GPS units to accompany ground pen-etrating radar (GPR) ice profiles as well as to measure interseasonal ice motion in a region of large snow dunes in central East Antarctica. Snow megadunes are 2 to 10 meters tall, 2 to 10 km wavelength anti-dune structures that likely form by a standing-wave interaction with the katabatic wind inversion layer. GPS units were used to measure dune amplitude in the wind direction profile direction and to position GPR profile traces properly in both vertical and horizontal dimension. A series of poles near the center of the dune field study region showed the ice motion to be 3.85 +/- 0.2 m/year, at a bearing of 090. Amplitude of the dunes in the study site varied from 5 to 9 meters, and mean amplitude was 3.9 km. A nearby region showing a transition from dune mor-phology to normal plateau surface showed that as dune amplitude decreased, dune spacing also decreased, to approximately 2.5 km before becoming undetectable.
This research was supported by NSF-OPP grant 0125570.
References
Fahnestock, M., T. Scambos, C. Shuman, R. Arthern, D. Winebrenner, and R. Kwok, 2000. Snow megadune fields on the East Antarctic Plateau: extreme atmosphere-ice interaction. Geophysical Research Letters 27(22), 3719-3722.
Topography and Ice Motion of Antarctic Snow MegadunesT. A. Scambos » National Snow and Ice Data Center, CIRES, University of ColoradoR. Bauer » National Snow and Ice Data Center, CIRES, University of Colorado
Polar
Figure 2. Landsat 7 sub-scene of the Megadunes Field camp area. The solid magenta line indicates the GPR/GPS profile of Figure 3.
Figure 1. Aerial view of megadunes, some color enhancement to highlight structure.
Figure 3. GPR/GPS profile of central megadune field site, showing AWS locations, core locations, and indicating low-density regions in the ice core. Blue bands indicate extension of dune lee faces (glaze or ‘freezer-burn’ faces) into the subsurface. These generally coincide with the low-density zones in the core (core is off-profile, to back of page, by ~300m).

3-114
2008-2012 UN
AVC
O PRO
POSAL: G
EOD
ESY ADVAN
CIN
G EART
H SC
IENC
E RESEARC
H
3-115
The Effect of Permafrost Thawing and Thermokarst on Vegetation and Ecosystem Carbon Cycling in Alaskan Tundra
Edward A.G. Schuur » Department of Botany, University of FloridaHanna Lee » Department of Botany, University of FloridaJason G. Vogel » Department of Botany, University of Florida
Polar
Up to 450 billion tons of soil carbon (C) are estimated to be stored in high latitude ecosystems (Gorham, 1991). This quantity represents almost a third of the soil C stored in terrestrial ecosystems globally, and is several orders of magnitude greater than current annual anthropogenic CO2 emissions. Lati-tudinal gradients of soil C, field experiments, and laboratory incubations all show that soil C cycling in these northern ecosystems is likely to be strongly influenced by the effect of cold temperatures on rates of decomposition of soil organic matter (Kirschbaum, 2000). This ‘old’ soil C, climatically pro-tected from microbial decomposition in frozen or waterlogged soil, has been accumulating in these ecosystems throughout the Holocene since retreat of the last major ice sheets.Climate change scenarios predict that the greatest magnitude of warming will occur at high latitudes. This predicted warming is supported by observa-tional evidence over the last 25 years and is associated with warmer ground temperatures, permafrost (permanently frozen soil) thawing, and thermo-karst (ground subsidence as a result of ground ice thawing) (ACIA, 2004). Thermokarst has the potential to alter ecosystem C cycling by changing the vegetation structure and growth rates, and by altering soil microbial decom-position rates. Together, these changes can alter the balance of C cycling
processes in these ecosystems and cause feedbacks to climate change.We are testing how microelevation as caused by ground subsidence can be used as a predictive variable for ecosystem carbon fluxes and patterns of vegetation following permafrost thawing. We used high-precision GPS to quantify centimeter scale differences in surface topography and related these to measurements of ecosystem net carbon exchange (Figure 1). Developing regression relationships allows us to scale mea-surements of carbon exchange across larger spatial scales based on micro-topography.
References
ACIA. 2004. Impacts of a warming climate: Arctic climate impact assessment. Cambridge University Press, pp. 146.
Gorham, E. 1991. Northern peatlands: role in the carbon cycle and probable responses to climatic warming. Ecological Applications 1:182-195.
Kirschbaum, M. U. F. 2000. Will changes in soil organic carbon act as a positive or negative feedback on global warming. Biogeochemis-try 48: 21-51.
This work was supported by NSF Grants DEB-0516326 and EAR-0223193.
Figure 1. Map showing microelevation of a permafrost study plot where ground is locally subsided. Scale is in units of meters to an arbitrary baseline.

2008
-201
2 U
NAV
CO
PRO
POSA
L: G
EOD
ESY
ADVA
NC
ING
EAR
TH
SC
IEN
CE
RES
EARC
H
3-116 3-117
Continuously recording GPS stations on active valley glaciers have revealed the transient nature of flow, as glaciers speed up in the early melt season, and then slow down again during the peak of summer melting, as the “plumb-ing” system under glaciers evolves seasonally (Anderson et al., 2005; Thor-steinsson et al., 2005; Howat et al, submitted).GPS measurements of surface elevation and ice motion, combined with measurements of ice thickness, show accelerating shrinkage of Tyndall Gla-cier in Patagonia over the last few decades. Acceleration appears to be driven by a combination of climate and feedbacks associated mainly with lowering of the glacier surface (Raymond et al., 2005).Kinematic GPS methods have also been used to make repeat measurements of surface topography to estimate annual mass balance changes of Blue Glacier in the Olympic Mountains of Western Washington (http://www.geophys.washington.edu/Surface/Glaciology/PROJECTS/BLUE_GLAC/blue.html).
This research was supported by NSF OPP-9819056, OPP-0136112, INT-9802764, NASA 1215388.
GPS Measurements of Motion and Mass Balance of Alpine GlaciersE.D Waddington » Dept of Earth and Space Sciences, University of WashingtonH. Conway » Dept of Earth and Space Sciences, University of WashingtonC.F. Raymond » Dept of Earth and Space Sciences, University of Washington
Polar
References
Anderson, R.L., S.P. Anderson, K.R. Mac-Gregor, E.D. Waddington, S. O ‘Neel, C.A. Riihimaki and M.G. Loso. 2004. Strong feedbacks between hydrology and sliding of a small alpine glacier. Journal of Geophysical Research,109(F3), F03005 doi: 10.1029/2004JF000120.
Howat, I.M., S. Tulaczyk, E.D. Waddington, I. Joughin, H. Bjornsson. submitted. A simple basal sliding law for glaciers. Journal of Geophysical Research.
Raymond, C.F., T.A. Neumann, E. Rignot, K. Echelmeyer, A. Rivera and G. Casassa, 2005. Journal of Glaciology, 51(173), 239-247.
Thorsteinsson, T., E.D. Waddington, K. Matsuo-ka, I. Howat, and S. Tulaczyk. 2005. Survey of flow, topography and ablation on Myrdal-sjokull, S-Iceland. Jokull 55, 155-162.

3-116
2008-2012 UN
AVC
O PRO
POSAL: G
EOD
ESY ADVAN
CIN
G EART
H SC
IENC
E RESEARC
H
3-117
Ice-Core Site Selection: Detection of Slow Motion and Low Strain Rates on Polar Ice Sheets
E.D Waddington » Dept of Earth and Space Sciences, University of WashingtonH. Conway » Dept of Earth and Space Sciences, University of WashingtonC.F. Raymond » Dept of Earth and Space Sciences, University of Washington
Polar
Greenland, Antarctica, and other ice caps retain a memory of past climate in ice-core geochemi-cal time series. Preferred ice-core sites are at ice divides, where the annual motion is slow, but displacements are significant over the age of the climate record. Because these sites are far from fixed benchmark references, GPS measurements are essential. Because the ice is always moving, the ice-core paleoclimate records must also be correct-ed for displacements from deposition site to core site. To extract precipitation rates from annual-lay-er thicknesses in a core, cumulative vertical strain since deposition as snow must also be determined with ice-flow models constrained by modern ice-motion measurements. With UNAVCO assis-tance, we have conducted ice-motion surveys for all U.S. Antarctic Program deep ice-core projects since 1993, including Taylor Dome (Morse et al., in review; Waddington et al., in review), Siple Dome (Nereson et al., 1998a; 1998b), and the upcoming Western Divide core in central West Antarctica (Conway et al., 2005).
This research is supported by NSF OPP-9221261, OPP-9421644, OPP-9316807, and OPP-008714.
References
Conway, H., T.A. Neumann, S. Price, E.D. Waddington, D. Morse, K. Taylor, P.A. Mayewski, D. Dixon, E. Pettit, and E.J. Steig. Candidate drill site near the Ross-Amundsen ice divide, West Antarctica. Report presented to the Ice Core Working Group Meeting, Madison, WI. March 2005.
Morse, D.L., E.D. Waddington, and L.A. Rasmussen. In review. Ice deformation in the vicinity of an ice-core site at Taylor Dome, Antarctica, and a derived accumulation-rate history, Journal of Glaciology.
Nereson, N.A., C.F. Raymond, E.D. Waddington and R.W. Jacobel. 1998a. Migration of the Siple Dome ice divide, West Antarc-tica. Journal of Glaciology, 44(148) 632-652.
Nereson, N.A., R.C.A. Hindmarsh and C.F. Raymond. 1998b. Sensi-tivity of the divide position at Siple Dome, West Antarctica, to boundary forcing. Annals of Glaciology, 27, 207-214.
Waddington, E.D., T.A. Neumann, M.R. Koutnik, H.P. Marshall, and D.L. Morse. In review. Inference of accumulation-rate pat-tern from deep radar layers. Journal of Glaciology.
Figure 1. Horizontal surface velocity field across the Western Divide in Central West Antarctica. The velocity field was derived from repeat measurements of loca-tions of 104 survey poles placed in the ice. Drilling of a new deep ice core at site WDC (S79.4676, W112.0859) will start in 2006-07.

2008
-201
2 U
NAV
CO
PRO
POSA
L: G
EOD
ESY
ADVA
NC
ING
EAR
TH
SC
IEN
CE
RES
EARC
H
3-118 3-119
The TransAntarctic Mountains DE-Formation project (TAMDEF) was initiated in 1996 to measure rates of crustal rebound in southern Victoria Land, Antarctica. The rates are being used to test various isostatic rebound models and explore the tectonics of the western Ross Sea region. The project network was installed in three phases. The first phase installed sites north of 79°S, the second phase installed sites southward to 82°S. The third phase involved the installa-tion of several continuous stations at remote locations around the region.Campaign data have been collected each austral summer. In the first few years of the project, data quantities were limited by the memory capacity of the receivers and their large power needs. In more recent years, data has been recorded in a campaign mode for up to three months per year.Continuous data have been collected at an OSU/USGS/LINZ/UNAVCO collaborative site at Cape Roberts since late 2000. The site has oper-ated successfully and is currently
TAMDEF: Measuring Neotectonic Motions in the Antarctic InteriorMike Willis » Ohio State UniversityTerry Wilson » Ohio State UniversityStephanie Konfal » Ohio State University
Polar
Larry Hothem » U.S. Geological SurveyGraeme Blick » Land Information New ZealandTom James » Geological Survey of Canada
that found by Dietrich et al., 2004. Spatial averaging of the residual motions reveals a small amount of tectonic strain occurring over Mc-Murdo Sound. Vertical motions over the entire region are positive and are being compared to various rebound models.References
Willis, Wilson and James: Neotectonic Crustal Motions in the Antarctic Interior Measured by the TAMDEF GPS Network American Geophysical Union, Abstract. 2004
Willis, Wilson and James: Horizontal Crustal Mo-tions in the Antarctic interior: Comparison of GPS Measurements and Post-Glacial Re-bound Model Predictions. EGS/AGU/EUG Joint Assembly, Abstract. 2003.
Willis, Wilson and James: A comparison of Measured and Modeled Bedrock Motions for Southern Victoria Land, Antarctica in The State of GPS Vertical Positioning Preci-sion: Separation of Earth Processes by Space Geodesy. Cahiers du Centre Européen de Géodynamique et de Séismologie. 23. 2003.
Willis: The Crustal Response to Changing Tidal Loads Imposed by a Pinned Ice Shelf. Heis-kanen Symposium in Geodesy. Ohio State University. 2002.
This work is supported by NSF grant number OPP 0230285
Figure 1. Example data set from Cape Roberts, southern Victoria Land, Antarctica.
equipped with a 900MHz radio modem that allows data upload on a daily basis to the UNAVCO archive in Boulder. Two additional sites were constructed by the USGS in 2001. Mount Fleming is equipped with a radio modem in the same way as Cape Roberts. Fishtail Point has been upgraded, with the help of UNAVCO, to send data to the U.S. each day using a satellite modem. Three additional continuous sites were installed without communica-tions in 2003. All six sites allow us to investigate the seasonal elastic deflections of Earth’s crust in the region and to strengthen the data related to our reference frame.Processing the data has been com-pleted using both the PAGES package and the BERNESE package. The agreement between packages is excellent and the data are observed to be less noisy than is typical for GPS measurements. By inverting the motion of sites on the stable East Antarctic craton we derive an Euler pole that is essentially the same as

3-118
2008-2012 UN
AVC
O PRO
POSAL: G
EOD
ESY ADVAN
CIN
G EART
H SC
IENC
E RESEARC
H
3-119
Polar Earth Observatory Network (POLENET): Investigating Links between Geodynamics and Ice Sheets in AntarcticaTerry Wilson » Ohio State University and Byrd Polar Research CenterS. Anandakrishnan » Penn State UniversityR. Aster » New Mexico TechM. Bevis » Ohio State University and Byrd Polar Re-search CenterI. Dalziel » University of Texas Institute for GeophysicsL. Hothem » United States Geological Survey
Polar
The Polar Earth Observatory Net-work, or POLENET, is a recently proposed GPS/Seismic network, aimed at observing the Antarctic glaciologic and geologic system using a multidisci-plinary and internationally-coordinated approach. An observatory-style back-bone network of 18 co-located, contin-uously-recording GPS and broadband seismic sites across West Antarctica, as well as a two- to three- year GPS and seismic “International Polar Year (IPY)-only” deployment has been proposed (Figure 1). The co-location of GPS and seismic sensors provides important sci-ence synergies and significant logistical advantages. Cooperation of the GPS and seismic Principal Investigators, UNAVCO, and the Incorporated Re-search Institutes for Seismology (IRIS) will allow development and deploy-ment of the next-generation power and communication systems optimized for remote operations in extreme environ-ments.To refine estimates of recent ice mass change of the West Antarctic Ice Sheet, we will measure isostatic rebound with GPS, constrain mantle rheology through seismic studies, and dramati-cally improve continental-scale rebound model predictions used to correct ice mass trends derived from satellite al-timetry and time-varying gravity. Both the viscoelastic and elastic response
from mass change can be modeled from continuous GPS measurements, allowing for better estimates of Antarctica’s contribution to global sea level change. Seismological investigations, integrated with results from the geodetic studies, will provide first-order constraints on geological/tectonic parameters important for understanding ice sheet dynamics in West Antarctica. New seismic data will be used to develop high-resolu-tion seismic tomographic images, seismic receiver functions will be used to map the sediment thickness distribution beneath the ice sheet, and recordings of glacial earthquakes will help to constrain short-term slip events that are important for understanding ice sheet dynamics.
A. Huerta » Penn State UniversityA. Nyblade » Penn State UniversityC. Raymond » Jet Propulsion LaboratoryR. Smalley » University of MemphisD. Wiens » Washington UniversityR. Dietrich » Technical University of DresdenPOLENET International Consortium
Figure 1. POLENET GPS and seismic site location map. Blue dots are backbone GPS sites, yellow dots are backbone seismic sites, red dots are both GPS and seismic backbone sites, green dots are “IPY only” GPS sites, orange dots are “IPY only” seismic sites, and purple dots are GPS and/or seismic sites proposed or operated by international collaborators in the POLENET consortium. For more information regarding the POLENET proposal, please visit the following link: http://www.ipy.org/development/eoi/proposal-details.php?id=185