Embed Size (px)
Citation preview

Police complaints: statistics for England and Wales 2011/12
IPCC Research and Statistics Series: Paper 25

i
AcknowledgementsThe IPCC would like to thank staff from policeProfessional Standards Departments and their ITsuppliers for their continued co-operation in theprovision of police complaints data.

ii
Police complaints Contents
Contents
Acknowledgements i
Foreword 1
Introduction 3
Findings 5
Discussion 9
Tables and figures 12
References 29
Annex A: glossary of terms 30

1
Police complaints Foreword
Foreword
This report gives important insights into how thepolice complaints system works and the concernsthe public have about the conduct of the police. Itcontains information about the complaints thatthe police have recorded; the outcome of thepolice’s handling of those complaints; and theoutcome of appeals to the IPCC about the waycomplaints have been handled.
The total number of complaints recorded by thepolice has fallen for the second year. This follows aperiod of sustained growth since the creation ofthe IPCC in 2004. There is considerable variationbetween police forces in the number of recordedcomplaints and the number of allegations per1,000 employees. It is very important, however, notto take a simplistic view of these figures. Policeforces that record more complaints may be morealert to the need to ensure access to thecomplaints system; those recording fewercomplaints may be less ready to recognise andacknowledge complaints. On the other hand, assome police forces have told us, they may betaking early action to resolve issues that wouldotherwise have resulted in a formal complaint.
However, it is of some concern that, at the sametime as the number of recorded complaints hasreduced, the IPCC is upholding a rising number ofappeals from complainants whose complaints
should have been formally recorded, but were not.Nearly two-thirds of such appeals are successful.Police forces therefore urgently need to examinetheir own practice to ensure that they are notblocking access to the complaints system.
As is well known, confidence in and use of thecomplaints system is lower among certain sectionsof the community. Our recent confidence surveyshowed that 40% of respondents from ethnicminorities feared police harassment if they madecomplaints, compared to 17% of whiterespondents. It is noticeable in the findings of thisreport that only 17% of complainants wereidentified as under 30, in spite of the fact that thisis an age-group more likely to have experiencedpolice contact.
What is equally important is how police forceshave dealt with the complaints they record – interms of the outcomes and whether the concernsexpressed by complainants are being resolved. TheIPCC’s revised Statutory Guidance in 2010encouraged police forces to consider the servicereceived by the complainant, rather than making anarrow assessment of whether there had beenmisconduct. In that context, we expected theproportion of complaints upheld to increase since2010. That has not happened, and the proportionupheld remains at a low 12%. Again, there isconsiderable variation between police forces –with three police forces upholding more than onein five complaints, but seven upholding fewer thanone in ten.
In that context, it is of concern that not only hasthere been an increase in the number of appeals tothe IPCC from those dissatisfied with the way theircomplaint was handled; there has also been aconsiderable increase in the proportion of appealsthat we uphold. Overall, in the last year, we upheld

38% of appeals, compared with 30% or less in thethree preceding years. That includes the highproportion of non-recording appeals alreadyreferred to. But it also includes a steep rise in thenumber and percentage of successful appealsagainst the actual investigation of complaints bythe police themselves – 31% of those appeals wereupheld, compared to around 22% in previous years.So, nearly a third of police investigations appealedto us were deficient.
Once again, there is considerable variationbetween police forces, with some having over 40%of appeals against their investigations upheld.Police forces therefore need to examine theirpractice of investigating and upholding complaintsin light of appeal outcomes and comparisons withother similar police forces.
Finally, the report shows that despite someimprovements in the national average, it still takestoo long to resolve many complaints. There is alsosignificant variation between police forces, withsome taking much longer than the average andothers reporting increases in the time taken.
Given the challenging nature of policing, it isinevitable that at times the service provided to thepublic will fall below the standard they expect.Complaints are a vital source of public feedback,and an opportunity to improve public confidence.The complaints system must show that concernswill be taken seriously and that the police servicewill recognise those circumstances when theycould have done better and take rapid steps to putthis right. Police forces therefore need to ensurethat they record valid complaints and handle themin a way that is aimed at achieving resolution forthe complainant.
All chief constables should take personal interestin the findings of this report and assurethemselves that they and their staff are meetingtheir obligations to record and resolve validcomplaints from the public. In particular, theyshould look closely at the number and type ofappeals upheld by the IPCC. This is particularlyrelevant because, after November this year, chiefconstables will be responsible for dealing with
appeals against the way their own forces havehandled complaints in less serious cases. Thisshould provide a more immediate feedback loop toidentify and respond to good and bad localpractice at the front end, but it will also requirerigorous processes to ensure that initial decisionsare effectively reviewed. The IPCC is currentlyexamining ways of ensuring that we retaineffective oversight of this part of the complaintsprocess.
This report should also be of considerable interestto candidates hoping to be elected as Policing andCrime Commissioners (PCCs). PCCs can play animportant role in holding police forces to accountin relation to their interactions with the public. Wewill be briefing them on how they can use thesefindings to understand the concerns of theirconstituents and work with the police to addressthem.
Dame Anne OwersChair
2
Police Complaints Foreword

3
Police complaints Introduction
Introduction
This report presents figures on complaintsrecorded about the police in England and Wales forthe year 2011/12. These complaints are made bymembers of the public about the conduct of thoseserving with the police and are dealt with underthe Police Reform Act 2002 (PRA 2002).
Under the PRA 2002, police forces must record allcomplaints made by the public about the conductof those serving with the police. Complaintsregarding matters such as general policing policies,known as ‘direction and control’, are handledunder separate provisions1.
People who are not happy with how theircomplaint has been handled by the police canappeal to the IPCC. This report also presentsfigures on the numbers of appeals and IPCCdecisions on those.
For the third year, the report presents the results ofnine indicators for the complaints system. Theindicators were created to provide a useful toolthat the police and the public can use to judgeobjectively how well complaints are beinghandled. Unlike data on the number of complaintsrecorded, where an increase or decrease can beinterpreted as either good or bad, the indicatorsare unambiguous and should therefore supportpolice forces in taking action to improve theirperformance when necessary.
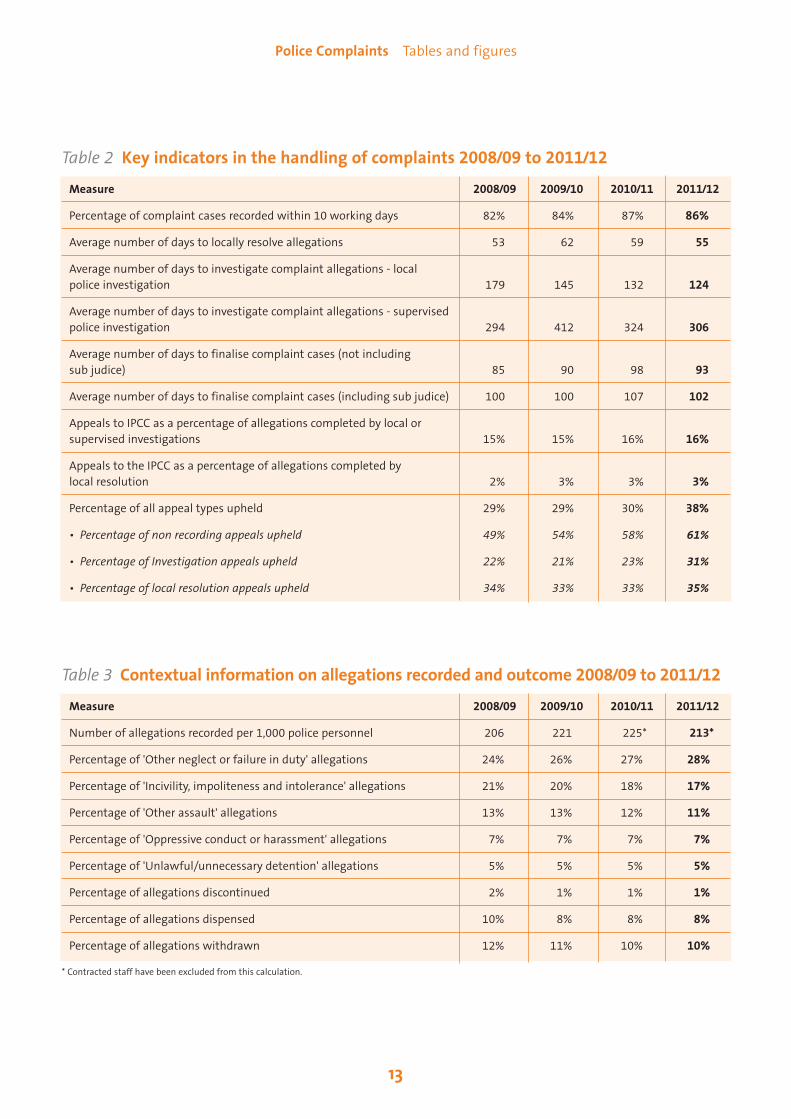
An overview of the indicators can be found in Table2, with associated contextual information in Table3. The results for each indicator give only limitedinsight when viewed alone, but collectively theyprovide a picture of how the system is performing.The IPCC publishes reports on these indicators forevery police force on a quarterly basis throughoutthe year. These reports include further detail as
well as comparisons with ‘most similar forces’ andare available on the IPCC website2.
Overview of the reportThe purpose of this report is to help inform public debate by presenting data on the indicators, an overview of the numbers and types of complaints, and information on howthese were resolved across police forces. It alsooutlines the demographics of people who madecomplaints and those who were the subject ofcomplaints.
What then follows is a discussion on thesefindings, placing them in the wider context ofpublic contact and dissatisfaction with the police,willingness to complain, and experience of thecomplaints system. A glossary of terms, such aslocal resolution, dispensation, and sub judice can be found at the back of this report.
An overview of the IPCC’s work with policecomplaints can be found in its annual report for2011/12. That report provides an overview of theIPCC’s own performance with regard to theinvestigations, appeals, and complaints it handles(IPCC, 2012).
Changes to the handling of complaints The IPCC revised its Statutory Guidance on 1 April2010. One of the key changes in the guidanceinvolved a move away from allegations beingjudged solely in terms of whether evidence ofmisconduct is found (this is referred to as‘substantiated’). Instead, complaints subject to aninvestigation are judged in terms of whether theyare ‘upheld’. A complaint should be upheld wherethe findings of an investigation show that theservice provided was below the standard areasonable person could expect. An upheld
1 For more information see Home Office Circular 19/2005 (Home Office, 2005) 2 See www.ipcc.gov.uk/en/Pages/police_complaints_stats.aspx

4
Police complaints Introduction
complaint may also result in a case to answer inrelation to misconduct or it may not3. This reportpresents outcomes of investigations that werecompleted under the old system (complaintsrecorded before 1 April 2010), and the newsystem.
3 See IPCC Statutory Guidance (2010) paras. 423 and 424 and 431 to 439 formore information.
5
Police complaints Findings
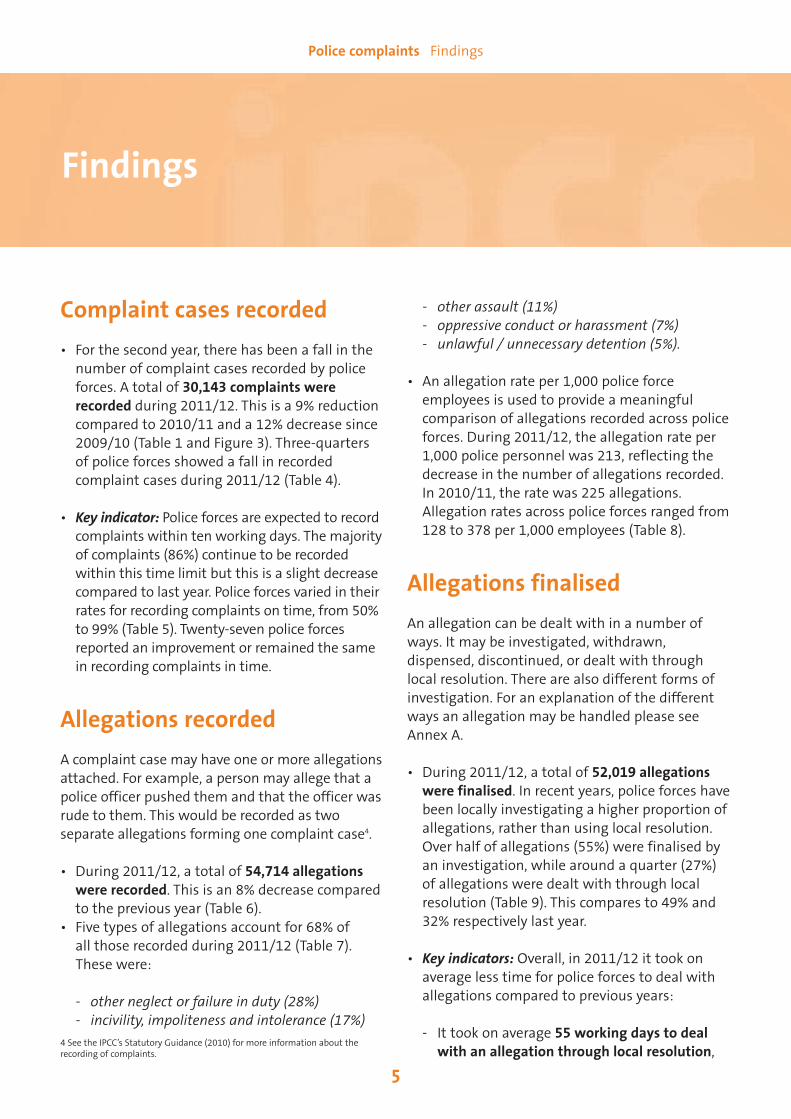
Complaint cases recorded• For the second year, there has been a fall in thenumber of complaint cases recorded by policeforces. A total of 30,143 complaints wererecorded during 2011/12. This is a 9% reductioncompared to 2010/11 and a 12% decrease since2009/10 (Table 1 and Figure 3). Three-quartersof police forces showed a fall in recordedcomplaint cases during 2011/12 (Table 4).
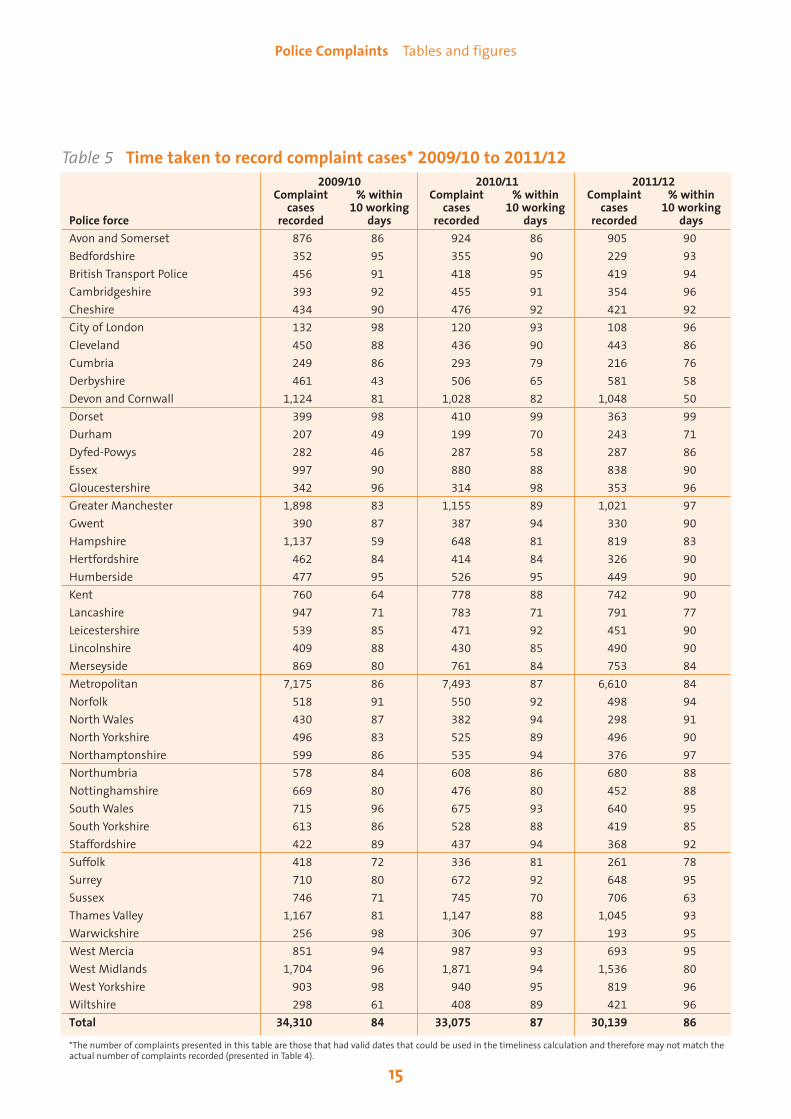
• Key indicator: Police forces are expected to recordcomplaints within ten working days. The majorityof complaints (86%) continue to be recordedwithin this time limit but this is a slight decreasecompared to last year. Police forces varied in theirrates for recording complaints on time, from 50%to 99% (Table 5). Twenty-seven police forcesreported an improvement or remained the samein recording complaints in time.
Allegations recordedA complaint case may have one or more allegationsattached. For example, a person may allege that apolice officer pushed them and that the officer wasrude to them. This would be recorded as twoseparate allegations forming one complaint case4.
• During 2011/12, a total of 54,714 allegationswere recorded. This is an 8% decrease comparedto the previous year (Table 6).
• Five types of allegations account for 68% of all those recorded during 2011/12 (Table 7).These were:
- other neglect or failure in duty (28%) - incivility, impoliteness and intolerance (17%)
4 See the IPCC’s Statutory Guidance (2010) for more information about therecording of complaints.
Findings
- other assault (11%) - oppressive conduct or harassment (7%)- unlawful / unnecessary detention (5%).
• An allegation rate per 1,000 police forceemployees is used to provide a meaningfulcomparison of allegations recorded across policeforces. During 2011/12, the allegation rate per1,000 police personnel was 213, reflecting thedecrease in the number of allegations recorded.In 2010/11, the rate was 225 allegations.Allegation rates across police forces ranged from128 to 378 per 1,000 employees (Table 8).
Allegations finalisedAn allegation can be dealt with in a number ofways. It may be investigated, withdrawn,dispensed, discontinued, or dealt with throughlocal resolution. There are also different forms ofinvestigation. For an explanation of the differentways an allegation may be handled please seeAnnex A.
• During 2011/12, a total of 52,019 allegationswere finalised. In recent years, police forces havebeen locally investigating a higher proportion ofallegations, rather than using local resolution.Over half of allegations (55%) were finalised byan investigation, while around a quarter (27%)of allegations were dealt with through localresolution (Table 9). This compares to 49% and32% respectively last year.
• Key indicators: Overall, in 2011/12 it took onaverage less time for police forces to deal withallegations compared to previous years:
- It took on average 55 working days to dealwith an allegation through local resolution,

6
Police complaints Findings
which is four days less than the average timetaken in 2010/11 (Table 10). The averagevaried across police forces from 27 to 116working days. Just over half of police forcesrecorded below or the same as the nationalaverage time to complete the local resolutionprocess. Twenty-eight police forces showedimprovements or remained the same in theiraverage time compared to last year.
- Over the past four years there has been asteady improvement in the average timetaken for the police to investigate anallegation. During 2011/12, it took on average124 working days to locally investigate anallegation, over a week less than in 2010/11(Table 10). This figure varied across policeforces, ranging from 58 to 260 working days,and 27 police forces showed improvements orremained the same compared to last year.
- It took on average 306 working days to dealwith an allegation through a supervisedinvestigation (Table 10).
The proportion of allegationsnot proceeded with• A total of 9,548 allegations were dispensed,discontinued, or withdrawn, accounting for 18% ofallegations finalised. This figure varied across policeforces ranging from 10% to 40% (Table 9). Theproportion of allegations dealt with in these wayshas gradually declined over the past eight years.
Investigation outcomes• On 1 April 2010, the IPCC introduced revisedStatutory Guidance5 that changed the waycomplaint allegations are handled by a local(police force) investigation. As time progresses,fewer allegations completed in a given financialyear would have started before theimplementation of this guidance. Of the
6 A complaint case is deemed finalised once all action, including criminalproceedings has been concluded. 7 See Annex A for a definition of sub judice.
5 See IPCC Statutory Guidance (2010)www.statguidance.ipcc.gov.uk/Pages/default.aspx
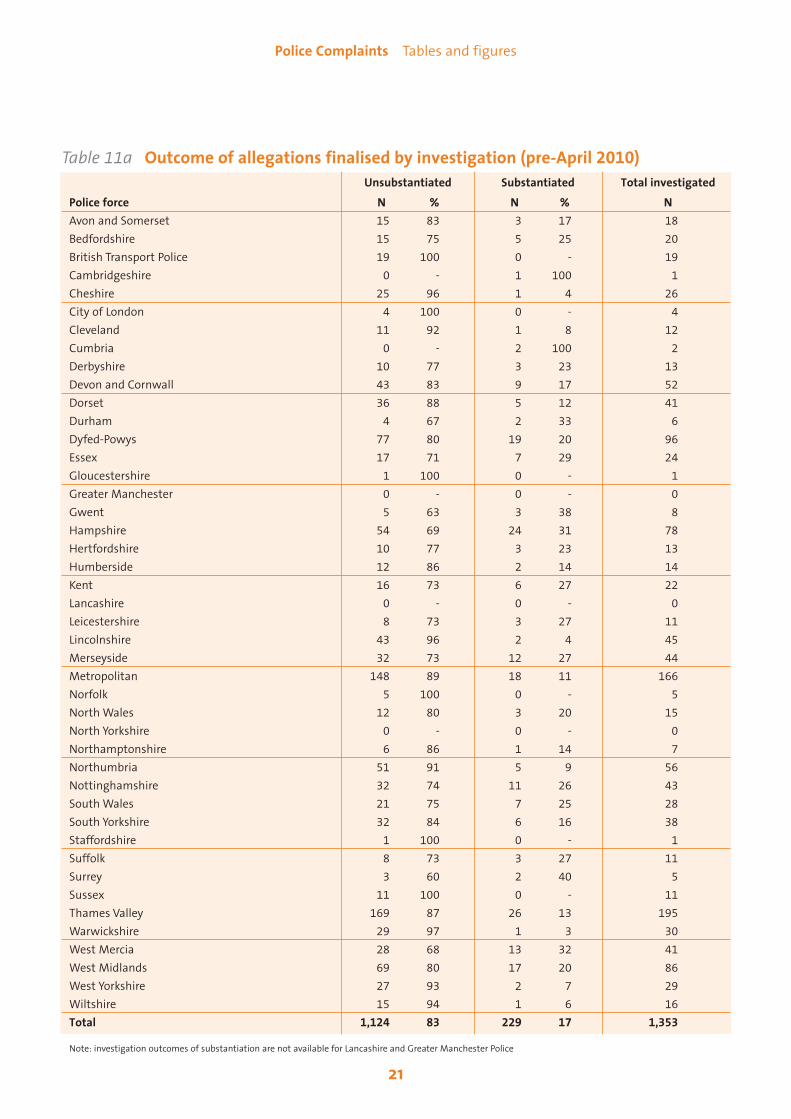
allegations finalised by an investigation during2011/12, 1,353 allegations were dealt withunder the old system; of these, 17% weresubstantiated (Table 11a).
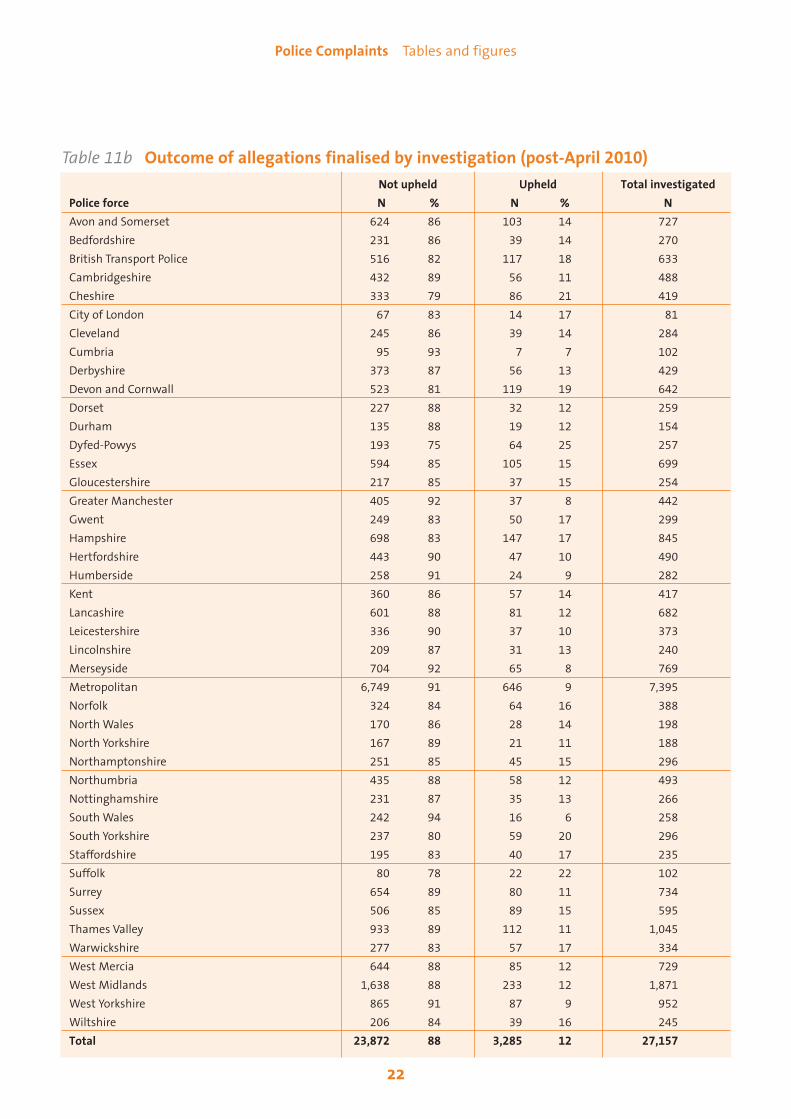
• Of the complaint cases that were started on orafter the 1 April 2010, 27,157 allegations werefinalised by a local investigation in 2011/12. Ofthese, 12% were upheld, a similar figure to2010/11. There was significant variation acrosspolice forces from 6% to 25% of allegationsupheld (Table 11b).
Complaints cases finalised• A total of 29,639 complaint cases were finalised6 during 2011/12. This is 14% fewerthan the previous year.
• Key indicator: During 2011/12, it took onaverage 102 working days to finalise acomplaint case (Table 12). This is animprovement compared to last year and similar to the time taken during 2009/10. The time taken to complete a complaint case varied across police forces, ranging from 48 to 154 working days. Twenty-six police forces reported an improvement orremained the same in the average time taken to complete a complaint case, with two-thirds of police forces coming under thenational average.
• Key indicator: A complaint can be subject to a period in sub judice7. When we remove any time spent in sub judice, the average time tocomplete all complaint cases was 93 workingdays, five days less than during 2010/11. Thetime varied across police forces, ranging from 36 to 132 working days (Table 12).

Appeals to the IPCCA complainant has the right to appeal to the IPCC ifthey are not happy about the way in which a policeforce has handled their complaint. An appeal can bemade about a decision to not record a complaint case,or about the process used to conduct a local resolution.They can also appeal about the handling of a local orsupervised investigation on the grounds of not beinginformed about the findings; the information usedin the investigation; the outcome; or the decisionnot to refer to the Crown Prosecution Service (CPS)8.
• During 2011/12, 6,339 appeals were made tothe IPCC about the handling of a complaint by apolice force9, which represents a 3% increasecompared to the previous year (Table 13).
• Key indicator: During 2011/12, 38% of allappeals finalised were upheld10 by the IPCC; thisis 8% higher than the previous year.
• There were 1,374 appeals made against thedecision by police forces not to record acomplaint in 2011/12. This is a 16% increase inthe number received compared to 2010/11. Inalmost two-thirds (61%) of completed appeals, aslight increase compared to last year, we upheldthe appeal and directed the police force torecord the complaint. The rate of upholding non-recording appeals has increased over recentyears from 49% in 2008/09 to 61% in 2011/12.
• There were 426 local resolution appealsmade tothe IPCC during 2011/12; a 20% decreasecompared to 2010/11. Of the appeals completedof this type, just over a third (35%) were upheld.This is similar to previous years’ figures.
• In 2011/12, the IPCC received 4,539investigation appeals, a slight increase (2%)compared to last year. Of the appealscompleted, 31% were upheld; this is a
7
Police complaints Findings
considerably higher rate than in previous years(around 21% to 23%).
Figures 1 and 2 show the number of appealsreceived and the percentage of valid appealsupheld by the IPCC from 2008/09 to 2011/12.
8 See Annex A for further information on appeal types.9 The appeals figures presented here are for police forces only. For appealsfigures that cover all the statutory bodies that the IPCC have jurisdiction over,including police authorities, please refer to the IPCC Annual Report for 2011/12.10 The upholding rate is a percentage of the number of valid appeals completedduring the reporting year. Completed appeals may have been recorded in a differentfinancial year to that in which it is completed. This applies to all appeal types.
7,000
6,000
5,000
4,000
3,000
2,000
1,000
0
Figure 1 Appeals received 2008/09to 2011/12
2008/09 2009/10 2010/11 2011/12
Investigation Local resolution Non-recording
70%
60%
50%
40%
30%
20%
10%
0%
Figure 2 Percentage of completed appeals upheld 2008/09 to 2011/12
2008/09 2009/10 2010/11 2011/12
Investigation Local resolution Non-recording
% up
held
No. receiv
ed
u
u
uu
u
ss
ss
nn n
n
n s

Profile of complainants• During 2011/12, 30,624 people complainedabout the conduct of someone serving with the police – a fall of 9% compared to theprevious year.
• The majority of complainants were men (Table 16).
• The majority of complainants were White andaged between 40 to 49 years of age (Tables 17and 18).
Profile of those subject to complaints• A total of 35,382 people serving with the police were subject to a recorded complaintduring 2011/12 – a 6% fall compared to theprevious year.
• The majority subject to a complaint were policeofficers rather than police staff (Table 19).
• The majority of those facing complaints weremen and White (Tables 20 and 21).
8
Police complaints Findings

9
Police complaints Discussion
A key finding in this report is the decline in thenumber of police complaints recorded in 2011/12,a decrease of 9%; this is the second year runningthat a reduction has been recorded. Since theformation of the current complaints system in2004, the picture had been of sustained growth inrecorded complaints. However, in recent years thenumbers are declining with three-quarters ofpolice forces (33 out of 44) reporting a decrease incomplaint cases. As is well known, rises or falls inthe numbers of complaints being made are notopen to simple interpretation. A rise may reflectgreater public dissatisfaction but may also be aresponse to efforts to make it easier to complain.Alternatively, a fall may reflect the complaintssystem being inaccessible rather than a reductionin public dissatisfaction.
Police forces that reported some of the greatestdecreases in complaint cases were asked for theirview on what might be driving this trend. Anumber told us that they are using the 10-dayassessment period before a recording decision ismade to establish the primary cause ofdissatisfaction and resolve the issue at the firstpoint of contact. They told us that this aimed toprovide a prompt resolution to the issue raised,whereas previously these issues would have beenrecorded as complaints from the outset. Somepolice forces also reported that they have usedlearning from previous complaints to take actionto address the most common allegations andimprove service delivery.
Action to improve service delivery and resolvematters at an early stage are welcomed. However,without further evidence, it cannot be assumedthat it is these actions which have led to thereduction in the number of recorded complaints.Indeed the fall in recorded complaints must alsobe viewed in the context of rising numbers of non-
Discussion
recording appeals submitted to and upheld by theIPCC. This provides clear evidence that too oftenvalid complaints from the public are not beingrecorded. It is important that police forcesexamine significant reductions in complaintsalongside their upheld non-recording appeals tosatisfy themselves and the public that they areproviding appropriate access to the complaintssystem for those who want to complain.
Wider context of public contact with thepolice and complainingThere is a mixed picture in terms of the generalcontact between the public and the police,experiences of this contact, and willingness tocomplain. Research commissioned by the IPCCasked a representative sample of the British publicabout their willingness to complain, awareness ofthe IPCC, and knowledge of how to complain(Inglis and Media, 2011). The percentage of people willing to complain was up from 59% in2009 to 68% in 2011. At the same time, thepercentage of people thinking their complaintwould be taken seriously or that it would be likelythat something would be done as a result of theircomplaint has increased since last year. However,there has been a very small rise in the percentageof respondents who do not know how to complainand are worried it would take too much time to complain.
The survey also showed that public perceptions ofthe police complaints system and the IPCC arepositive and stable, but that some key groupsremain more sceptical of the system and lessinclined to use it - young people, ethnic minorities,and people from lower socio-economicbackgrounds. It also showed that the disincentivesto complaining remain high and are felt morestrongly by ethnic minorities - 40% reportedfearing police harassment if they complained,

compared with 17% of White respondents (Inglisand Media, 2011).
Information about attitudes to and complaintsabout the police are also collected in the CrimeSurvey for England and Wales (CSEW)11. Latestfigures from the 2011/12 survey showed that 17%of people could recall being ‘really annoyed’ withthe actions of an officer at least once in the lastfive years, and of those, around one in ten went onto make a complaint. For those who made acomplaint, three quarters were ‘a bit’ or ‘verydissatisfied’ with the way that police dealt withtheir complaint. The main reason for notcomplaining was that there was seen to be nobenefit or point in doing so (ONS, 2012).
AppealsAppeals to the IPCC from members of the publicwho are not happy with how the police havehandled their complaint are a key indicator ofpublic satisfaction with the complaints system. Ofcontinuing concern is the increase in how oftenthe IPCC agrees with the complainant and upholdstheir appeal.
In almost two thirds of appeals about nonrecording of complaints the IPCC has agreed withthe complainant and directed the police force torecord their complaint.
The decrease in local resolution appeals coincideswith the decrease in dealing with complaintsthrough this process, but the rate of upholdingthese appeals has remained stable. This suggeststhat even though fewer of these processes arehappening, some police forces are still failing toengage properly with those complainants.
The proportion of complaints dealt with by apolice investigation has increased over the pastyears and there has been a slight increase in thenumber of investigation appeals received.However, of greater concern is the increase in thenumber of appeals upheld of this type, nowaround a third.
The increased number of appeals upheld in all
three categories suggests that police forces needto do more to ensure that they are meeting theirobligations to record, resolve, and investigatecomplaints to an acceptable standard. Thesefindings suggest that complainants are facingbarriers to accessing the complaints system whenthey had a valid complaint, and that too manyinvestigations are failing to achieve resolution forthe complainant first time.
Timeliness The timeliness measures for completing localresolutions and local police investigations continueto show some improvement. While there aresignificant variations between police forces, onaverage a complainant will wait just over sixmonths for their complaint to be handled througha local police investigation. For those dealt withthrough local resolution the individual will waitalmost three months for a conclusion. Researchshows that there has been a slight increase overthe past few years in people being worried that itwould take too much time to make a complaintabout the police (Inglis and Media, 2011). Theseresults show that although timeliness is improving,police forces need to do more to address thisconcern that complaints take too long to resolve.
Upheld rate for investigationsPreviously, police forces were required to make ajudgement as to whether there was evidence ofmisconduct at the end of an investigation into apublic complaint. Where misconduct could beproven, the allegation would be substantiated.This has now shifted to a threshold of whether theservice provided by the police ‘did not reach thestandard a reasonable person would expect’ (IPCC,2010), as it is often the case that a complainanthas received poor service even though the actionsof officers involved do not amount to misconduct.IPCC Statutory Guidance advises police forces thatcomplaints should be upheld in thesecircumstances. Similar proportions of allegationswere upheld (new system) in 2011/12 comparedto allegations substantiated (old system) inprevious years.
Given the new definition, one would expect thenumber of allegations being upheld to be higher
10
Police complaints Discussion
11 Prior to April 2012, this was known as the British Crime Survey

than past figures for allegations substantiated.However, this was not the case in 2011/12. It isdifficult to know the reasons for these findings but they do suggest that police forces need to domore to ensure that the Statutory Guidance isreflected in practice. The IPCC believes that thischange is important if the public are to haveconfidence in the complaints system. The IPCC willcontinue to closely monitor results through itsquarterly reporting of the indicators, usingcomparisons with the national average and ‘mostsimilar forces’ to identify areas of concern forindividual police forces and seek to ensure that the guidance is being applied consistently and correctly.
The IPCC will continue to uphold investigationappeals when it believes that the police forceshould have upheld the complaint. Police forcesshould look carefully at the results of their appealsto the IPCC and ensure that learning from these isreflected in future practice.
Forward lookDuring 2007/08, the IPCC carried out a Stock Takeof the police complaints system that revealed anumber of frustrations about how complaintswere handled. The Police Reform and SocialResponsibility Act (2011) will introduce a numberof changes to the way the complaints systemoperates. While some of the recommendations toimprove the complaints system from the IPCCStock Take have been progressed in the Act, itremains a heavily bureaucratic process. It remainsto be seen how the changes will be implementedin practice, particularly the local handling of someappeals, and how this will impact on the public’sconfidence in the complaints system.
The Act introduces Policing and CrimeCommissioners with elections due to take placesoon after the publication of this report. The IPCChas arranged a number of events for candidatesand will use this opportunity to inform themabout the complaints system and how they canuse the findings of this report to gain valuableinsight in to the issues which concern the public.
11
Police complaints Discussion
Statistical note• In the percentage column presented in thefollowing tables, ‘-‘ denotes zero and 0denotes less than 0.5%.
• Some percentages may add up to more orless than 100% due to rounding.
• Figures for British Transport Police havebeen fully included in the following tablesand figures; this may not have been thecase in previous reports.
• Average times are presented as workingdays and do not include weekends or bankholidays.
• Data with invalid start/end dates have beenremoved from average time calculations.Therefore, the numbers of complaint casesand allegations used in average timecalculations may be lower than the totalnumber of complainant cases andallegations recorded.

Police Complaints Tables and figures
Tables and figures
12
Table 1 Complaint cases recorded 2001/02 to 2011/12
2001/02 2002/03 2003/04 2004/05 2005/06 2006/07* 2007/08 2008/09 2009/10 2010/11 2011/12
Total recorded 16,654 15,248 15,885 22,898 26,268 29,322 29,350 31,747 34,310 33,099 30,143
% annual change -12 -8 4 44 15 12 0 8 8 -4 -9
* Figures for British Transport Police are included from this point onwards.
* Figures for British Transport Police are included from this point onwards.
40,000
35,000
30,000
25,000
20,000
15,000
10,000
5,000
0
Figure 3 Complaint cases recorded 2001/02 to 2011/12
2001/02 2002/03 2003/04 2004/05 2005/06 2006/07* 2007/08 2008/09 2009/10 2010/11 2011/12
13
Police Complaints Tables and figures
Table 2 Key indicators in the handling of complaints 2008/09 to 2011/12
Measure 2008/09 2009/10 2010/11 2011/12
Percentage of complaint cases recorded within 10 working days 82% 84% 87% 86%
Average number of days to locally resolve allegations 53 62 59 55
Average number of days to investigate complaint allegations - local police investigation 179 145 132 124
Average number of days to investigate complaint allegations - supervised police investigation 294 412 324 306
Average number of days to finalise complaint cases (not including sub judice) 85 90 98 93
Average number of days to finalise complaint cases (including sub judice) 100 100 107 102
Appeals to IPCC as a percentage of allegations completed by local or supervised investigations 15% 15% 16% 16%
Appeals to the IPCC as a percentage of allegations completed by local resolution 2% 3% 3% 3%
Percentage of all appeal types upheld 29% 29% 30% 38%
• Percentage of non recording appeals upheld 49% 54% 58% 61%
• Percentage of Investigation appeals upheld 22% 21% 23% 31%
• Percentage of local resolution appeals upheld 34% 33% 33% 35%
Table 3 Contextual information on allegations recorded and outcome 2008/09 to 2011/12
Measure 2008/09 2009/10 2010/11 2011/12
Number of allegations recorded per 1,000 police personnel 206 221 225* 213*
Percentage of 'Other neglect or failure in duty' allegations 24% 26% 27% 28%
Percentage of 'Incivility, impoliteness and intolerance' allegations 21% 20% 18% 17%
Percentage of 'Other assault' allegations 13% 13% 12% 11%
Percentage of 'Oppressive conduct or harassment' allegations 7% 7% 7% 7%
Percentage of 'Unlawful/unnecessary detention' allegations 5% 5% 5% 5%
Percentage of allegations discontinued 2% 1% 1% 1%
Percentage of allegations dispensed 10% 8% 8% 8%
Percentage of allegations withdrawn 12% 11% 10% 10%
* Contracted staff have been excluded from this calculation.

14
Police Complaints Tables and figures
Table 4 Complaint cases recorded 2011/12Percentage change
Police force 2010/11 2011/12 from 2010/11Avon and Somerset 924 905 -2
Bedfordshire 355 229 -35
British Transport Police 418 419 0
Cambridgeshire 455 354 -22
Cheshire 476 421 -12
City of London 120 108 -10
Cleveland 436 443 2
Cumbria 293 216 -26
Derbyshire 506 581 15
Devon and Cornwall 1,028 1,048 2
Dorset 410 363 -11
Durham 199 243 22
Dyfed-Powys 287 287 0
Essex 880 838 -5
Gloucestershire 314 353 12
Greater Manchester 1,155 1,021 -12
Gwent 387 330 -15
Hampshire 648 819 26
Hertfordshire 414 326 -21
Humberside 526 449 -15
Kent 778 742 -5
Lancashire 807 795 -1
Leicestershire 471 451 -4
Lincolnshire 430 490 14
Merseyside 761 753 -1
Metropolitan 7,493 6,610 -12
Norfolk 550 498 -9
North Wales 382 298 -22
North Yorkshire 525 496 -6
Northamptonshire 535 376 -30
Northumbria 608 680 12
Nottinghamshire 476 452 -5
South Wales 675 640 -5
South Yorkshire 528 419 -21
Staffordshire 437 368 -16
Suffolk 336 261 -22
Surrey 672 648 -4
Sussex 745 706 -5
Thames Valley 1,147 1,045 -9
Warwickshire 306 193 -37
West Mercia 987 693 -30
West Midlands 1,871 1,536 -18
West Yorkshire 940 819 -13
Wiltshire 408 421 3
Total 33,099 30,143 -9
15
Police Complaints Tables and figures
Table 5 Time taken to record complaint cases* 2009/10 to 2011/122009/10 2010/11 2011/12
Complaint % within Complaint % within Complaint % withincases 10 working cases 10 working cases 10 working
Police force recorded days recorded days recorded daysAvon and Somerset 876 86 924 86 905 90
Bedfordshire 352 95 355 90 229 93
British Transport Police 456 91 418 95 419 94
Cambridgeshire 393 92 455 91 354 96
Cheshire 434 90 476 92 421 92
City of London 132 98 120 93 108 96
Cleveland 450 88 436 90 443 86
Cumbria 249 86 293 79 216 76
Derbyshire 461 43 506 65 581 58
Devon and Cornwall 1,124 81 1,028 82 1,048 50
Dorset 399 98 410 99 363 99
Durham 207 49 199 70 243 71
Dyfed-Powys 282 46 287 58 287 86
Essex 997 90 880 88 838 90
Gloucestershire 342 96 314 98 353 96
Greater Manchester 1,898 83 1,155 89 1,021 97
Gwent 390 87 387 94 330 90
Hampshire 1,137 59 648 81 819 83
Hertfordshire 462 84 414 84 326 90
Humberside 477 95 526 95 449 90
Kent 760 64 778 88 742 90
Lancashire 947 71 783 71 791 77
Leicestershire 539 85 471 92 451 90
Lincolnshire 409 88 430 85 490 90
Merseyside 869 80 761 84 753 84
Metropolitan 7,175 86 7,493 87 6,610 84
Norfolk 518 91 550 92 498 94
North Wales 430 87 382 94 298 91
North Yorkshire 496 83 525 89 496 90
Northamptonshire 599 86 535 94 376 97
Northumbria 578 84 608 86 680 88
Nottinghamshire 669 80 476 80 452 88
South Wales 715 96 675 93 640 95
South Yorkshire 613 86 528 88 419 85
Staffordshire 422 89 437 94 368 92
Suffolk 418 72 336 81 261 78
Surrey 710 80 672 92 648 95
Sussex 746 71 745 70 706 63
Thames Valley 1,167 81 1,147 88 1,045 93
Warwickshire 256 98 306 97 193 95
West Mercia 851 94 987 93 693 95
West Midlands 1,704 96 1,871 94 1,536 80
West Yorkshire 903 98 940 95 819 96
Wiltshire 298 61 408 89 421 96
Total 34,310 84 33,075 87 30,139 86
*The number of complaints presented in this table are those that had valid dates that could be used in the timeliness calculation and therefore may not match theactual number of complaints recorded (presented in Table 4).

16
Police Complaints Tables and figures
Table 6 Allegations recorded 2011/12 and comparison to 2010/11Number Number Change in the Percentage
of allegations of allegations number of change from Police force 2010/11 2011/12 allegations 2010/11Avon and Somerset 1,536 1,446 -90 -6%
Bedfordshire 586 435 -151 -26%
British Transport Police 743 767 24 3%
Cambridgeshire 992 828 -164 -17%
Cheshire 740 721 -19 -3%
City of London 158 200 42 27%
Cleveland 742 855 113 15%
Cumbria 399 282 -117 -29%
Derbyshire 869 1065 196 23%
Devon and Cornwall 1,577 1,648 71 5%
Dorset 656 644 -12 -2%
Durham 324 498 174 54%
Dyfed-Powys 710 650 -60 -8%
Essex 1,489 1,586 97 7%
Gloucestershire 480 573 93 19%
Greater Manchester 1,878 2,041 163 9%
Gwent 758 578 -180 -24%
Hampshire 1,697 1,651 -46 -3%
Hertfordshire 792 743 -49 -6%
Humberside 1,003 906 -97 -10%
Kent 1,163 1,103 -60 -5%
Lancashire 1,421 1,471 50 4%
Leicestershire 786 780 -6 -1%
Lincolnshire 714 767 53 7%
Merseyside 1,710 1,860 150 9%
Metropolitan 13,894 12,255 -1,639 -12%
Norfolk 636 740 104 16%
North Wales 670 515 -155 -23%
North Yorkshire 1,047 915 -132 -13%
Northamptonshire 619 492 -127 -21%
Northumbria 1,340 1,416 76 6%
Nottinghamshire 805 805 0 0%
South Wales 1,169 1,043 -126 -11%
South Yorkshire 1,002 786 -216 -22%
Staffordshire 660 619 -41 -6%
Suffolk 562 475 -87 -15%
Surrey 1,122 1,150 28 2%
Sussex 1,137 1,029 -108 -9%
Thames Valley 2,181 1,856 -325 -15%
Warwickshire 640 469 -171 -27%
West Mercia 1,858 964 -894 -48%
West Midlands 3,666 2,808 -858 -23%
West Yorkshire 1,824 1,662 -162 -9%
Wiltshire 687 617 -70 -10%
Total 59,442 54,714 -4,728 -8%

17
Police Complaints Tables and figures
Table 7 Types of allegations recorded 2011/12Allegation groupings Allegation category N %
Oppressive behaviour Serious non-sexual assault 418 1%
Sexual assault 80 0%
Other assault 6,242 11%
Oppressive conduct or harassment 3,795 7%
Unlawful/unnecessary arrest
or detention 2,885 5%
Malpractice Irregularity in relation to
evidence/perjury 1,284 2%
Corrupt practice 370 1%
Mishandling of property 1,850 3%
Breach of PACE Breach of Code A PACE on
stop and search 666 1%
Breach of Code B PACE on
searching of premises and seizure
of property 1,586 3%
Breach of Code C PACE on detention,
treatment and questioning 2,515 5%
Breach of Code D PACE on
identification procedures 23 0%
Breach of Code E PACE on
tape recording 15 0%
Multiple or unspecified breaches of
PACE which cannot be allocated to
a specific code 71 0%
Lack of fairness and impartiality Lack of fairness and impartiality 2,615 5%
Discriminatory behaviour Discriminatory behaviour 1,195 2%
Other neglect of duty Other neglect or failure in duty 15,201 28%
Incivility Incivility, impoliteness and intolerance 9,236 17%
Traffic Traffic irregularity 548 1%
Other Other irregularity in procedure 1,664 3%
Improper disclosure of information 1,213 2%
Other sexual conduct 41 0%
Other 1,201 2%
Total allegations 54,714 100%

18
Police Complaints Tables and figures
Table 8 Number of allegations recorded per 1,000 police personnel 2011/12Allegations recorded Allegations per
Police force against employees only No of employees 1,000 employeesAvon and Somerset 1,446 5,953 243
Bedfordshire 435 2,403 181
British Transport Police 767 4,479 171
Cambridgeshire 828 2,715 305
Cheshire 719 4,121 174
City of London 200 1,344 149
Cleveland 854 2,260 378
Cumbria 282 2,204 128
Derbyshire 1,061 3,741 284
Devon and Cornwall 1,648 6,383 258
Dorset 644 2,935 219
Durham 498 2,511 198
Dyfed Powys Police 649 2,101 309
Essex 1,563 6,609 236
Gloucestershire 570 2,339 244
Greater Manchester 2,041 13,043 156
Gwent 578 2,600 222
Hampshire 1,647 6,610 249
Hertfordshire 743 4,253 175
Humberside 905 4,195 216
Kent 1,103 6,820 162
Lancashire 1,471 6,139 240
Leicestershire 780 3,838 203
Lincolnshire 766 2,423 316
Merseyside 1,860 7,348 253
Metropolitan 12,255 55,706 220
Norfolk 740 3,164 234
North Wales 514 2,791 184
North Yorkshire 908 2,858 318
Northamptonshire 492 2,794 176
Northumbria 1,416 6,780 209
Nottinghamshire 804 4,453 181
South Wales 1,041 5,364 194
South Yorkshire 786 5,683 138
Staffordshire 618 4,034 153
Suffolk 474 2,655 179
Surrey 1,150 4,543 253
Sussex 1,028 5,718 180
Thames Valley 1,850 8,552 216
Warwickshire 469 2,014 233
West Mercia 964 4,443 217
West Midlands 2,808 12,740 220
West Yorkshire 1,662 10,035 166
Wiltshire 614 2,457 250
Total 54,651 256,151 213This table excludes allegations made against contracted staff; there were 63 allegations made against contracted staff only. There were an additional 95 allegations made against contracted staff but these were also connected to police personnel and therefore remain counted in this table.Police service strength as of March 2011

19
Police Complaints Tables and figures
Table 9 Means by which allegations were finalised 2011/12Allegations Local investigated Withdrawn Dispensation Discontinuance resolution Total
Police force N % N % N % N % N % NAvon and Somerset 745 53 117 8 106 8 4 0 432 31 1,404
Bedfordshire 290 63 46 10 48 10 0 0 76 17 460
British Transport Police 652 85 52 7 22 3 0 0 37 5 763
Cambridgeshire 489 60 72 9 84 10 0 0 175 21 820
Cheshire 445 58 79 10 33 4 0 0 206 27 763
City of London 85 69 5 4 7 6 7 6 19 15 123
Cleveland 296 47 66 10 55 9 1 0 218 34 636
Cumbria 104 36 24 8 50 17 3 1 110 38 291
Derbyshire 442 44 103 10 43 4 50 5 364 36 1,002
Devon and Cornwall 694 46 146 10 172 12 4 0 478 32 1,494
Dorset 300 43 81 12 67 10 8 1 237 34 693
Durham 160 36 50 11 39 9 3 1 197 44 449
Dyfed-Powys 353 51 53 8 71 10 3 0 206 30 686
Essex 723 51 182 13 143 10 4 0 352 25 1,404
Gloucestershire 255 48 43 8 81 15 4 1 150 28 533
Greater Manchester 442 30 233 16 73 5 99 7 615 42 1,462
Gwent 307 52 65 11 52 9 0 0 168 28 592
Hampshire 923 63 84 6 66 5 4 0 381 26 1,458
Hertfordshire 503 69 50 7 68 9 0 0 106 15 727
Humberside 296 43 81 12 79 11 1 0 238 34 695
Kent 439 45 66 7 45 5 67 7 363 37 980
Lancashire 682 45 145 10 55 4 8 1 615 41 1,505
Leicestershire 384 50 45 6 29 4 4 1 306 40 768
Lincolnshire 285 36 91 11 36 5 7 1 375 47 794
Merseyside 813 54 188 13 81 5 5 0 415 28 1,502
Metropolitan 7,561 66 944 8 1,104 10 84 1 1,788 16 11,481
Norfolk 393 59 69 10 33 5 0 0 172 26 667
North Wales 213 44 34 7 36 7 1 0 202 42 486
North Yorkshire 188 21 24 3 65 7 2 0 607 69 886
Northamptonshire 303 55 52 9 26 5 5 1 167 30 553
Northumbria 549 44 236 19 130 10 5 0 333 27 1,253
Nottinghamshire 309 46 66 10 57 8 5 1 237 35 674
South Wales 286 29 256 26 127 13 16 2 310 31 995
South Yorkshire 334 46 71 10 49 7 9 1 261 36 724
Staffordshire 236 45 71 14 11 2 3 1 204 39 525
Suffolk 113 28 56 14 63 16 0 0 166 42 398
Surrey 739 68 42 4 62 6 3 0 248 23 1,094
Sussex 606 58 100 9 67 6 2 0 278 26 1,053
Thames Valley 1,240 56 106 5 132 6 11 0 736 33 2,225
Warwickshire 364 64 79 14 26 5 0 0 98 17 567
West Mercia 770 63 187 15 54 4 3 0 202 17 1,216
West Midlands 1,957 64 266 9 132 4 25 1 661 22 3,041
West Yorkshire 981 64 189 12 159 10 2 0 205 13 1,536
Wiltshire 261 41 64 10 64 10 5 1 247 39 641
Total 28,510 55 5,079 10 4,002 8 467 1 13,961 27 52,019

20
Police Complaints Tables and figures
Table 10 Time taken to finalise allegations* 2011/12Local resolution Local investigation Supervised investigation
Average Number of Average Number of Average Number ofnumber of days allegations number of days allegations number of days allegations
to finalise used in to finalise used in to finalise used inPolice force allegations calculation allegations calculation allegations calculation Avon and Somerset 35 432 110 728 196 17
Bedfordshire 79 75 116 286 0 0
British Transport Police 61 37 60 629 524 18
Cambridgeshire 44 175 87 484 80 4
Cheshire 55 206 145 445 0 0
City of London 27 19 86 85 0 0
Cleveland 64 218 172 296 0 0
Cumbria 31 110 80 101 0 0
Derbyshire 46 359 129 442 0 0
Devon and Cornwall 59 474 185 689 1,135^ 1
Dorset 41 237 175 300 0 0
Durham 62 197 150 160 0 0
Dyfed-Powys 116 206 260 353 0 0
Essex 69 352 133 723 0 0
Gloucestershire 38 150 58 252 0 0
Greater Manchester 54 595 111 415 0 0
Gwent 45 165 135 289 211 10
Hampshire 60 381 103 916 0 0
Hertfordshire 65 105 110 503 0 0
Humberside 57 238 87 282 43 2
Kent 52 359 132 434 240 2
Lancashire 49 553 78 587 65 4
Leicestershire 53 306 141 378 458 6
Lincolnshire 70 375 201 285 0 0
Merseyside 52 413 121 813 0 0
Metropolitan 51 1,504 68 6,204 269 83
Norfolk 40 172 137 393 0 0
North Wales 57 202 166 213 0 0
North Yorkshire 42 607 115 185 132 3
Northamptonshire 51 167 104 301 0 0
Northumbria 70 330 216 539 178 3
Nottinghamshire 68 237 200 297 0 0
South Wales 71 310 203 283 726 3
South Yorkshire 41 261 195 331 0 0
Staffordshire 62 204 147 236 0 0
Suffolk 64 166 167 113 0 0
Surrey 34 247 61 739 0 0
Sussex 36 274 117 603 152 3
Thames Valley 73 733 229 1,239 136 1
Warwickshire 77 98 191 364 0 0
West Mercia 53 202 171 761 580 9
West Midlands 60 636 166 1,928 368 16
West Yorkshire 46 199 117 974 75 1
Wiltshire 61 247 134 260 113 1
Total 55 13,533 124 26,838 306 187*The number of allegations presented in this table are allegations that had valid dates that could be used in the timeliness calculation and therefore may not matchthe actual number of allegations finalised (presented in Table 9).^ This relates to one complex complaint case that involved a criminal re-trial, appeal of misconduct outcomes, judicial review and a quashing order and a furtherreview of the misconduct outcome.
21
Police Complaints Tables and figures
Table 11a Outcome of allegations finalised by investigation (pre-April 2010)Unsubstantiated Substantiated Total investigated
Police force N % N % NAvon and Somerset 15 83 3 17 18
Bedfordshire 15 75 5 25 20
British Transport Police 19 100 0 - 19
Cambridgeshire 0 - 1 100 1
Cheshire 25 96 1 4 26
City of London 4 100 0 - 4
Cleveland 11 92 1 8 12
Cumbria 0 - 2 100 2
Derbyshire 10 77 3 23 13
Devon and Cornwall 43 83 9 17 52
Dorset 36 88 5 12 41
Durham 4 67 2 33 6
Dyfed-Powys 77 80 19 20 96
Essex 17 71 7 29 24
Gloucestershire 1 100 0 - 1
Greater Manchester 0 - 0 - 0
Gwent 5 63 3 38 8
Hampshire 54 69 24 31 78
Hertfordshire 10 77 3 23 13
Humberside 12 86 2 14 14
Kent 16 73 6 27 22
Lancashire 0 - 0 - 0
Leicestershire 8 73 3 27 11
Lincolnshire 43 96 2 4 45
Merseyside 32 73 12 27 44
Metropolitan 148 89 18 11 166
Norfolk 5 100 0 - 5
North Wales 12 80 3 20 15
North Yorkshire 0 - 0 - 0
Northamptonshire 6 86 1 14 7
Northumbria 51 91 5 9 56
Nottinghamshire 32 74 11 26 43
South Wales 21 75 7 25 28
South Yorkshire 32 84 6 16 38
Staffordshire 1 100 0 - 1
Suffolk 8 73 3 27 11
Surrey 3 60 2 40 5
Sussex 11 100 0 - 11
Thames Valley 169 87 26 13 195
Warwickshire 29 97 1 3 30
West Mercia 28 68 13 32 41
West Midlands 69 80 17 20 86
West Yorkshire 27 93 2 7 29
Wiltshire 15 94 1 6 16
Total 1,124 83 229 17 1,353
Note: investigation outcomes of substantiation are not available for Lancashire and Greater Manchester Police
22
Police Complaints Tables and figures
Table 11b Outcome of allegations finalised by investigation (post-April 2010)Not upheld Upheld Total investigated
Police force N % N % NAvon and Somerset 624 86 103 14 727
Bedfordshire 231 86 39 14 270
British Transport Police 516 82 117 18 633
Cambridgeshire 432 89 56 11 488
Cheshire 333 79 86 21 419
City of London 67 83 14 17 81
Cleveland 245 86 39 14 284
Cumbria 95 93 7 7 102
Derbyshire 373 87 56 13 429
Devon and Cornwall 523 81 119 19 642
Dorset 227 88 32 12 259
Durham 135 88 19 12 154
Dyfed-Powys 193 75 64 25 257
Essex 594 85 105 15 699
Gloucestershire 217 85 37 15 254
Greater Manchester 405 92 37 8 442
Gwent 249 83 50 17 299
Hampshire 698 83 147 17 845
Hertfordshire 443 90 47 10 490
Humberside 258 91 24 9 282
Kent 360 86 57 14 417
Lancashire 601 88 81 12 682
Leicestershire 336 90 37 10 373
Lincolnshire 209 87 31 13 240
Merseyside 704 92 65 8 769
Metropolitan 6,749 91 646 9 7,395
Norfolk 324 84 64 16 388
North Wales 170 86 28 14 198
North Yorkshire 167 89 21 11 188
Northamptonshire 251 85 45 15 296
Northumbria 435 88 58 12 493
Nottinghamshire 231 87 35 13 266
South Wales 242 94 16 6 258
South Yorkshire 237 80 59 20 296
Staffordshire 195 83 40 17 235
Suffolk 80 78 22 22 102
Surrey 654 89 80 11 734
Sussex 506 85 89 15 595
Thames Valley 933 89 112 11 1,045
Warwickshire 277 83 57 17 334
West Mercia 644 88 85 12 729
West Midlands 1,638 88 233 12 1,871
West Yorkshire 865 91 87 9 952
Wiltshire 206 84 39 16 245
Total 23,872 88 3,285 12 27,157

23
Police Complaints Tables and figures
Table 12 Time taken to finalise complaint cases* 2011/12Average number of Average number of
Number of days to finalise days to finalise complaint cases complaint cases complaint cases
Police force finalised (NOT inc sub judice) (inc sub judice)Avon and Somerset 858 69 71
Bedfordshire 236 87 120
British Transport Police 413 77 83
Cambridgeshire 393 79 88
Cheshire 421 85 92
City of London 88 49 61
Cleveland 379 78 92
Cumbria 229 50 63
Derbyshire 533 98 99
Devon and Cornwall 1,046 118 129
Dorset 380 75 93
Durham 225 49 52
Dyfed-Powys 266 132 154
Essex 816 118 123
Gloucestershire 336 56 65
Greater Manchester 876 83 98
Gwent 325 70 82
Hampshire 688 70 75
Hertfordshire 319 77 99
Humberside 408 65 74
Kent 622 80 96
Lancashire 796 72 79
Leicestershire 471 98 106
Lincolnshire 461 93 100
Merseyside 653 76 82
Metropolitan 6,453 112 120
Norfolk 546 88 100
North Wales 266 85 93
North Yorkshire 459 63 67
Northamptonshire 419 72 84
Northumbria 660 98 109
Nottinghamshire 423 118 127
South Wales 580 102 105
South Yorkshire 421 96 105
Staffordshire 355 80 90
Suffolk 252 87 94
Surrey 627 36 48
Sussex 705 92 97
Thames Valley 1,202 120 126
Warwickshire 239 97 125
West Mercia 781 94 106
West Midlands 1,767 109 116
West Yorkshire 825 86 99
Wiltshire 421 71 74
Total 29,639 93 102
*Numbers presented are the total number of cases finalised, including those with invalid dates. Total number of cases used in the calculation is 29,598.

24
Police Complaints Tables and figures
Table 13 Appeals received and completed by the IPCC 2008/09 to 2011/12
Appeal type 2008/09 2009/10 2010/11 2011/12
Investigation appealsReceived 2,684 3,631 4,453 4,539
Completed 2,402 2,928 4,259 3,526
Upheld 528 603 971 1,095
% Upheld 22% 21% 23% 31%
Local resolution appealsReceived 473 566 532 426
Completed 442 449 474 312
Upheld 149 150 156 109
% Upheld 34% 33% 33% 35%
Non-recording appealsReceived 811 1,160 1,188 1,374
Completed 706 932 1,105 1,088
Upheld 349 499 639 662
% Upheld 49% 54% 58% 61%
Total appealsReceived 3,968 5,357 6,173 6,339
Completed 3,550 4,309 5,838 4,926
Upheld 1,026 1,252 1,766 1,866
% Upheld 29% 29% 30% 38%
This data is taken from the IPCC’s internal case tracking management system.
The upholding rate is a percentage of the number of valid appeals completed during the reporting year.Completed appeals may have been recorded in a different financial year to that which it is completed. Somereceived appeals may be deemed 'invalid'; these are not counted as 'completed' appeals

25
Police Complaints Tables and figures
Table 14 Appeals received to the IPCC by police force 2011/12Investigation Local resolution Non-recording Total
appeals appeals appeals appealsPolice force N % N % N % NAvon and Somerset 112 75 9 6 28 19 149Bedfordshire 67 71 7 7 20 21 94British Transport Police 64 80 2 3 14 18 80Cambridgeshire 62 78 4 5 14 18 80Cheshire 53 75 8 11 10 14 71City of London 23 77 1 3 6 20 30Cleveland 51 80 4 6 9 14 64Cumbria 24 60 5 13 11 28 40Derbyshire 77 71 6 6 26 24 109Devon and Cornwall 98 60 21 13 45 27 164Dorset 40 68 3 5 16 27 59Durham 30 50 8 13 22 37 60Dyfed Powys 50 81 5 8 7 11 62Essex 129 78 8 5 28 17 165Gloucestershire 53 84 3 5 7 11 63Greater Manchester 118 55 23 11 73 34 214Gwent 38 73 7 13 7 13 52Hampshire 119 77 8 5 28 18 155Hertfordshire 55 71 4 5 18 23 77Humberside 45 55 4 5 33 40 82Kent 97 71 12 9 27 20 136Lancashire 113 61 14 8 58 31 185Leicestershire 56 62 7 8 27 30 90Lincolnshire 45 58 10 13 23 29 78Merseyside 145 82 10 6 21 12 176Metropolitan 1,214 81 49 3 231 15 1,494Norfolk 55 73 7 9 13 17 75North Wales 57 58 10 10 32 32 99North Yorkshire 38 62 14 23 9 15 61Northamptonshire 53 69 5 6 19 25 77Northumbria 119 61 22 11 53 27 194Nottinghamshire 57 73 5 6 16 21 78South Wales 64 60 6 6 37 35 107South Yorkshire 51 61 10 12 22 27 83Staffordshire 34 45 9 12 32 43 75Suffolk 28 47 12 20 20 33 60Surrey 78 74 4 4 24 23 106Sussex 124 79 11 7 21 13 156Thames Valley 130 67 22 11 43 22 195Warwickshire 38 95 0 - 2 5 40West Mercia 166 81 4 2 35 17 205West Midlands 261 73 22 6 76 21 359West Yorkshire 168 62 10 4 94 35 272Wiltshire 40 59 11 16 17 25 68Total 4,539 72 426 7 1,374 22 6,339
This data is taken from the IPCC’s internal case tracking management system.

26
Police Complaints Tables and figures
Table 15 Outcome of completed appeals to the IPCC by police force 2011/12Investigation appeals Local resolution appeals Non-recording appeals Total appeals
Completed Upheld Upheld Completed Upheld Upheld Completed Upheld Upheld Completed Upheld UpheldPolice force N N % N N % N N % N N %Avon and Somerset 86 30 35 5 4 80 17 10 59 108 44 41
Bedfordshire 45 13 29 3 0 - 19 15 79 67 28 42
British Transport Police 57 15 26 3 1 33 11 6 55 71 22 31
Cambridgeshire 48 11 23 4 1 25 9 4 44 61 16 26
Cheshire 40 10 25 7 2 29 7 4 57 54 16 30
City of London 16 3 19 0 0 - 4 3 75 20 6 30
Cleveland 39 17 44 1 1 100 9 4 44 49 22 45
Cumbria 16 6 38 5 1 20 8 6 75 29 13 45
Derbyshire 41 6 15 4 1 25 24 17 71 69 24 35
Devon and Cornwall 87 33 38 15 8 53 35 24 69 137 65 47
Dorset 28 7 25 2 0 - 13 11 85 43 18 42
Durham 26 7 27 9 1 11 21 14 67 56 22 39
Dyfed Powys 33 5 15 4 0 - 3 1 33 40 6 15
Essex 126 35 28 7 2 29 21 7 33 154 44 29
Gloucestershire 47 16 34 1 0 - 6 3 50 54 19 35
Greater Manchester 81 27 33 15 5 33 61 44 72 157 76 48
Gwent 34 8 24 6 1 17 5 3 60 45 12 27
Hampshire 88 22 25 4 0 - 21 11 52 113 33 29
Hertfordshire 43 11 26 4 1 25 15 8 53 62 20 32
Humberside 34 2 6 4 1 25 28 17 61 66 20 30
Kent 73 20 27 7 3 43 28 19 68 108 42 39
Lancashire 96 35 36 12 6 50 50 31 62 158 72 46
Leicestershire 45 7 16 7 1 14 22 8 36 74 16 22
Lincolnshire 28 7 25 6 3 50 20 12 60 54 22 41
Merseyside 114 51 45 8 3 37 17 12 71 139 66 47
Metropolitan 950 320 34 27 14 52 172 86 50 1,149 420 37
Norfolk 46 13 28 4 2 50 10 5 50 60 20 33
North Wales 46 21 46 6 2 33 21 15 71 73 38 52
North Yorkshire 22 3 14 13 1 8 8 5 63 43 9 21
Northamptonshire 41 17 41 4 2 50 14 8 57 59 27 46
Northumbria 77 30 39 20 11 55 49 37 76 146 78 53
Nottinghamshire 50 18 36 4 1 25 11 9 82 65 28 43
South Wales 55 18 33 5 2 40 26 19 73 86 39 45
South Yorkshire 36 7 19 11 3 27 18 11 61 65 21 32
Staffordshire 21 6 29 7 2 29 26 14 54 54 22 41
Suffolk 22 6 27 8 6 75 16 9 56 46 21 46
Surrey 48 19 40 4 0 - 15 8 53 67 27 40
Sussex 85 20 24 6 3 50 14 10 71 105 33 31
Thames Valley 109 31 28 17 5 29 32 19 59 158 55 35
Warwickshire 32 4 13 1 0 - 1 1 100 34 5 15
West Mercia 132 36 27 2 0 - 27 12 44 161 48 30
West Midlands 202 74 37 16 8 50 67 37 55 285 119 42
West Yorkshire 147 39 27 6 0 - 74 56 76 227 95 42
Wiltshire 34 9 26 8 1 13 13 7 54 55 17 31
Total 3,526 1,095 31 312 109 35 1,088 662 61 4,926 1,866 38
This data is taken from the IPCC’s internal case tracking management system.

27
Police Complaints Tables and figures
Table 18 Age of complainants 2011/12Age group N %17 and below 342 1
18-29 5,024 16
30-39 5,038 16
40-49 6,313 21
50-59 3,671 12
60+ 2,189 7
Unknown 8,047 26
Total 30,624 100
Tables 16 to 18: Complainants are only counted once in these tables regardlessof how many complaints they have made throughout the year.
Table 17 Ethnicity of complainants 2011/12
Ethnicity N %White 17,256 56
Asian 1492 5
Black 1589 5
Other 744 2
Unknown 9543 31
Total 30,624 100
Table 16 Gender of complainants 2011/12
Gender N %Male 19,461 64
Female 10,856 35
Transsexual 6 0
Transgender 10 0
Unknown 291 1
Total 30,624 100

28
Police Complaints Tables and figures
Table 20 Gender of those subject to a complaint 2011/12
Gender N %Female 8,443 24
Male 25,959 73
Unknown 980 3
Total 35,382 100
Table 21 Ethnicity of those subject to a complaint 2011/12
Ethnicity N %White 31,321 89
Asian 879 2
Black 489 1
Other 534 2
Unknown 2,159 6
Total 35,382 100
Tables 20 and 21: Subjects are only counted once in Tables 20 and 21 regardlessof how many complaints have been made against them throughout the year.
Table 19 Status of those subject to a complaint 2011/12
Status N %Police officer ranks 31,771 90
Police staff including traffic wardens 2,145 6
Community support officers 856 2
Contracted staff 121 0
Special constables 507 1
Total 35,400 100
The total number of subjects in Table 19 will not match the figures in thefollowing tables on subjects. This is because individuals may hold differentranks when subject to more than one complaint throughout the year. In suchcases they will be counted twice in this table but not in the following tables.

29
Police Complaints References
References
Dhani, A and Kaiza, P. (2011) Police Service StrengthEngland and Wales, 31 March 2011 Home OfficeStatistical Bulletin 13/11 London: Home Office
Home Office (2005) Home Office Circular 19/2005:Guidance on the Handling of Complaints Relatingto the Direction and Control of a Police Force by aChief Officer London: Home Office
Independent Police Complaints Commission (2010) Statutory Guidance to the Police Service andPolice Authorities on the Handling of ComplaintsLondon: IPCC
Independent Police Complaints Commission (2011)Police Complaints: statistics for England and Wales2010/11 London: IPCC
Independent Police Complaints Commission (2012)Annual Report and Statement of Accounts 2011/12London: IPCC
Inglis, G and Media, K. (2011) Confidence in thepolice complaints system: a survey of the generalpopulation during 2011 London: IPCC
Office for National Statistics (2012) Crime statisticsfor England and Wales 2011/12 London: ONS

30
Police Complaints Annex A: glossary of terms
Annex A: glossary of terms
The following terms are listed in the order theyappear in the text of this report, which follows theprocess by which a complaint may be handled.
Complaint case: A single complaint case maycontain one or more linked allegations, made byone or more complainants, against one or morepersons serving with the police.
Allegation: This describes the type of behaviourbeing complained about. A single complaint casecan have one or many allegations attached. Forexample, a person may allege that an officerpushed them and was rude to them. This would berecorded as two separate allegations forming onecomplaint case. An allegation is recorded againstan allegation category.
Complainants: Under the PRA, the following typesof people can make a complaint about the conductof someone serving with the police:
• any member of the public who alleges thatpolice misconduct was directed at them
• any member of the public who alleges that theyhave been ‘adversely affected’ by policemisconduct, even if it was not directed at them
• any member of the public who claims that theywitnessed misconduct by the police
• a person acting on behalf of someone who fallswithin any three of the categories above. Thiscategory of person is classed as an ‘agent’ or‘representative’, not as a complainant in his orher own right, and must have the writtenpermission of the complainant.
Being ‘adversely affected’ is interpreted broadly inthe legislation and includes distress,inconvenience, loss or damage, or being put indanger or at risk. This might apply, for example, toother people present at the incident, or to the
parent of a child or young person, or a friend of theperson directly affected. It does not includesomeone distressed by watching an incident ontelevision.
A witness is defined in the PRA 2002 as someonewho ‘acquired his knowledge of that conduct in amanner which would make him a competentwitness capable of giving admissible evidence ofthat conduct in criminal proceeding’. This includes,for example, someone in control of CCTV camerasor in possession of material evidence.
One complaint case can have multiplecomplainants attached and one individual canmake more than one complaint within thereporting year.
Subjects: The PRA broadened the range of peoplewho could be subject to a complaint. Complaintscan be made against the following policepersonnel:
• police officers of any rank• police staff, including community supportofficers and traffic wardens
• special constables • contracted-out staff designated under Section39 of the PRA – for example, escort or custodyofficers employed by another company.
Local resolution: For less serious complaints, suchas rudeness or incivility, a complainant may agreeto local resolution. Usually, this involves a localpolice supervisor handling the complaint andagreeing with the complainant a way of dealingwith it. This might be an explanation orinformation to clear up a misunderstanding; anapology on behalf of the police force; and/or anoutline of what actions will be taken to preventsimilar complaints in the future.

Investigation: In other circumstances (or if thecomplainant declines local resolution) it may bedecided that a complaint requires a thoroughexamination of the incident. This involves theappointment of an investigating officer who willlook into a complaint and produce a report thatdetails the outcome of each allegation.
Investigation outcomes:• Unsubstantiated / Substantiated: These are theoutcomes of allegations that have been judgedsolely in terms of whether evidence ofmisconduct was found. This outcome will onlyapply to complaints recorded prior to 1 April2010. As time progresses there will be fewerallegations with these outcomes.
• Not upheld / Upheld: As of 1 April 2010, policeforces are expected to also record whether acomplaint is upheld or not upheld. A complaintwill be upheld if the service or conductcomplained about does not reach the standard areasonable person could expect. This means thatthe outcome is not solely linked to provingmisconduct (IPCC, 2010, paras. 423, 424 and 431to 439).
Local investigations: Are carried out entirely by thepolice. Complainants have a right of appeal to theIPCC following a local investigation.
Supervised investigations: Are carried out by thepolice under their own direction and control. TheIPCC sets out what the investigation should look at(which is referred to as the investigation’s ‘termsof reference’) and will receive the investigationreport when it is complete. Complainants have aright of appeal to the IPCC following a supervisedinvestigation.
Managed investigations: Are carried out by policeforces under the direction and control of the IPCC.
Independent investigations: Are carried out byIPCC investigators and are overseen by IPCCcommissioners. IPCC investigators have all thepowers of the police themselves.
Dispensation: In some cases, there may be reasonsnot to take a complaint forward. Examples may
include complaints where there is insufficientinformation, or complaints that are vexatious,oppressive or an abuse of the complaintprocedures. In such cases, a police force can applyto the IPCC for a dispensation. If this is granted, itmeans that no action needs to be taken withregard to the complaint. In other cases, where thematter of complaint was sub judice, the policeforce does not need the IPCC’s consent to dispensewith the complaint once the criminal proceedingshave concluded, providing reasonable efforts havebeen made to pursue the complaint.
Discontinuance: In some instances, police forcesmay find it impractical to conclude aninvestigation. This could occur if a complainantrefuses to co-operate, if the complaint isrepetitious or refers to an abuse of procedure, or ifthe complainant agrees to local resolution. In suchcases, the police force can apply to the IPCC todiscontinue the investigation.
Withdrawn: No further action may be taken withregard to a complaint if the complainant decidesto retract their allegation(s).
Sub judice: Subsequent to recording, the start ofany work on a complaint may be postponedbecause the matter is considered to be sub judice.This is when a person linked to a complaint case isassociated with separate criminal proceedings.
Investigation appeal: This applies to all complaintsinvestigated by the police force itself or where theinvestigation has been supervised by the IPCC. Thecomplainant may appeal on a number of groundsagainst the police investigation, if they feel theyhave not been adequately informed about thefindings of the investigation; disagree with thefindings; disagree with any proposals for action, orlack of proposals; or disagree with the decision notto refer the report to the CPS. There is no avenue ofappeal from independent or managedinvestigations (IPCC, 2010, paras. 510 to 524).
Local resolution appeal: Complainants are entitledto appeal against the local resolution process ifthey did not agree to a local resolution; the policedid not explain sufficiently that they must agree to
31
Police Complaints Annex A: glossary of terms

the process; or they think the police did not followthe process they agreed for the local resolution ofthe complaint. Complainants cannot appealagainst the outcome of a local resolution (IPCC,2010, paras. 292 to 295).
Non-recording appeal: Under the PRA 2002, thepolice have a duty to record all complaints aboutthe conduct of a serving member of the police.Complainants have the right to appeal to the IPCCif the police force did not record their complaint ordid not notify the correct police force of thecomplaint if it was made originally to the wrongpolice force. The IPCC reviews the appeal todetermine whether the police force’s refusal torecord the complaint was justified. It the appeal isupheld, the IPCC can direct the police force torecord the complaint (IPCC, 2010, paras.133 to136).
Invalid appeals:When an appeal is received to theIPCC, a number of checks are made to confirmwhether the appeal is a valid one. These checksdetermine whether the appeal is complete enoughand contains sufficient information; there is a rightof appeal e.g. there are no appeals against an IPCCinvestigation; and the appeal has been madewithin the 28 day time limit. If these are met, theappeal is deemed invalid and not counted as acompleted appeal.
32
Police Complaints Annex A: glossary of terms
Independent Police Complaints Commission90 High HolbornLondonWC1V 6BH
www.ipcc.gov.ukTel: 0300 020 0096Email: [email protected]
October 2012Reference POL/41
Published by the Independent PoliceComplaints Commission (IPCC).
© Independent Police ComplaintsCommission (IPCC) 2012.
ISBN: 978-0-9564130-9-3