Embed Size (px)
Citation preview

Bureau of Justice Statistics
U.S. Department of JusticeOffice of Justice Programs
Police Use of ForceCollection of National Data
Number of residents age 12 or older216 million
No face-to-face contact with police in 1996171 million
Face-to-face contact with police in 199645 million
About 1 in 5 persons age 12 or older had a face-to-face contact with a police officer during 1996. About 1 in 430 persons of this age alleged that police threatened or used force.
Residents needed or offered help 14.6 million (33% of contacts)
Victim or witness to crime 14.4 million (32% of contacts)
Force threatened or used during the contact 500,000 (1% of contacts)
Jointly published with the National Institute of Justice
About 1 in 5 persons age 12 or older had a face-to-face contactwith a police officer during 1996. About a quarter of 1% of all persons of this age alleged that police threatened or used force.
revised on 1/6/98

U.S. Department of JusticeOffice of Justice ProgramsBureau of Justice Statistics
Police Use of ForceCollection of National Data
By Lawrence A. GreenfeldPatrick A. Langan, Ph.D.Steven K. Smith, Ph.D.
with assistance fromRobert J. KaminskiNational Institute of Justice
November 1997, NCJ-165040

U.S. Department of JusticeBureau of Justice Statistics
Jan M. Chaiken, Ph.D.Director
This report was written by Lawrence A. Greenfeld,Patrick A. Langan, and Steven K. Smith of the Bureau of Justice Statistics. Information on the programs at the National Institute of Justice was provided by RobertJ. Kaminski. Jodi Brown assisted with verification. TomHester and Tina Dorsey edited and produced the report,assisted by Jayne Robinson. Marilyn Marbrooksupervised final production, assisted by Yvonne Boston.
The authors would like to gratefully acknowledge the numerous people who made the development and administration of the Police-Public Contact Survey possible. At the Bureau of the Census, Kathy Creigh-ton, Chief Crime Surveys Branch of the DemographicSurveys Division, Marilyn Monahan, and Edwina Jara-millo all facilitated the final construction of the question-naire and managed the field aspect of data collection.Ruth Beads and Steve Phillips of the ProgrammingBranch processed the data and Dave Hubble of the Statistical Methods Division provided the estimationspecifications. In addition, we would like to express our appreciation to the more than two dozen people who provided comments on the questionnaire during its development. Finally, we would like to extend ourthanks to Mark Henriquez and John Firman of the Inter-national Association of Chiefs of Police who contributedinformation on the activities of their organization on thistopic.
Data presented in this report can be obtained from the National Archive of Criminal Justice Data at the University of Michigan, 1-800-999-0960.
An electronic version of this report and other reports are available from the BJS Internet page:http://www.ojp.usdoj.gov/bjs/
Contents
Foreword, iii
Highlights, iv
National data collection on policeuse of force, 1
Planning for a national data collection program, 2
The Police-Public Contact Survey, 4
National Police-Use-of-Force DatabaseProject, 15
National research on the use of forceby police, 19
Plans and recommendations for the collection of data on police use of force, 22
Appendixes
Questionnaire for Police-Public Contact Survey, 23
Appendix I: Selected responses to Police-Public Contact Survey, 29
Appendix II: Data tables from Police-Public Contact Survey, 32
ii Police Use of Force

Foreword
Collection of National Data iii
This publication represents the second annual reportto the Congress as required by Section 210402 of theViolent Crime Control and Law Enforcement Act of1994, which mandates the acquisition of data by the Attorney General on the “use of excessive force by lawenforcement officers.” The findings reported are theresult of the joint efforts of the Bureau of Justice Statis-tics (BJS) and the National Institute of Justice (NIJ) toundertake the data collection and research activitiesoutlined in the initial report.
The first report, National Data Collection on Police Use of Force, NCJ-160113, April 1996, described the activities that would be carried out in 1996 as experi-ments in both learning from the public about their con-tacts with the police and learning from the police whatkinds of information they maintain on their contacts withthe public. In addition, the first report described someof the new research projects that had been fielded atvarious sites examining force and the circumstancessurrounding its use.
To learn more about the use of force requires an un-derstanding of the reasons for and the results of police-citizen encounters. During 1996, BJS carried out a special survey of 6,421 residents age 12 or older entitled the Police-Public Contact Survey. The surveywas designed to obtain information to help guide futuredevelopment of a final questionnaire on this topic. The pilot survey was not intended as a source of de-tailed or precise statistics on the topic of police use offorce. However, its results do provide preliminary esti-mates of the prevalence of citizen contacts with the police, including contacts in which police use force.
One of the most significant developments from fieldingthe Police-Public Contact Survey is that we are nowable to estimate, for the first time, the prevalence of allkinds of encounters between the police and members of the public, favorable as well as unfavorable. In1996, for example, about 45 million Americans age 12or older (about 1 in 5 residents of this age) were esti-mated to
have had at least one face-to-face contact with a policeofficer. Of these, about 500,000 (about 1 in 500 resi-dents of this age) were estimated to have been warnedabout a potential use of force or actually had forceused against them during a contact with police during1996.
Although the preliminary survey did not permit estimat-ing the extent of "excessive" use of force, it is clearlyonly a small fraction of this number.
BJS and NIJ also undertook a joint project with the International Association of Chiefs of Police (IACP) to acquire use of force data from local law enforcementagencies. Now in its second year of funding, this pro-ject has focused on developing a uniform set of datacollection goals and developing a constituency for sup-plying data on these incidents. During the past year,nearly 400 local law enforcement agencies indicated aninterest in the project by requesting copies of the datacollection instruments and the software devised by theproject to collect incident-level data for reporting to thenational database. The project has also established aWorld Wide Web site to advise the public and law en-forcement agencies about the mission of the data col-lection effort (http://www.policeforce.org).
We believe these data collection efforts have initiated a new opportunity to better understand what takesplace when citizens and police interact. For the major-ity of such contacts, members of the public initiate thecontact with the police, and most often it is to report acrime or seek assistance.
We gratefully acknowledge the assistance of attendeesat the Police Use-of-Force Workshop in 1995, theIACP, participating law enforcement agencies, the Bu-reau of the Census, and those persons who providedinformation to the Police-Public Contact Survey.
Jan M. Chaiken, Ph.D.DirectorBureau of Justice Statistics
Jeremy TravisDirectorNational Institute of Justice

Prevalence of citizen contact with police
An estimated 44.6 million persons(21% of the population age 12 orolder) had a face-to-face contact with a police officer during 1996.
Men, whites, and persons in their20's were the most likely to haveface-to-face contact.
Hispanics and blacks were about70% as likely as whites to havecontacts with the police.
Nearly 3 in 10 persons with acontact in 1996 reported multiplecontacts with police during the year.
Reasons for citizen contact with police
The most common reasons cited forcontact with police among residentsage 12 or older:
an estimated 33% of residents whohad contact with police had asked foror provided the police with some type of assistance; and
an estimated 32% of those whohad contact with police had reported acrime, either as a victim or a witness.
Receiving traffic tickets and beinginvolved in traffic accidents were alsocommon reasons for police contacts.
For just under a third of those withcontacts, the police initiated thecontact; for most, nearly half of thosewith contacts, the citizen had initiatedthe contact. (The remainder wereunclear from the data.)
Teenagers were the most likely tohave a police-initiated contact, andpersons age 60 or older were theleast likely.
Persons age 60 or older were themost likely to have a citizen-initiatedcontact with the police, and teenagerswere the least likely.
Hispanics had a higher level ofpolice-initiated contacts and a lowerlevel of self-initiated contacts.
Police actions during contacts with citizens
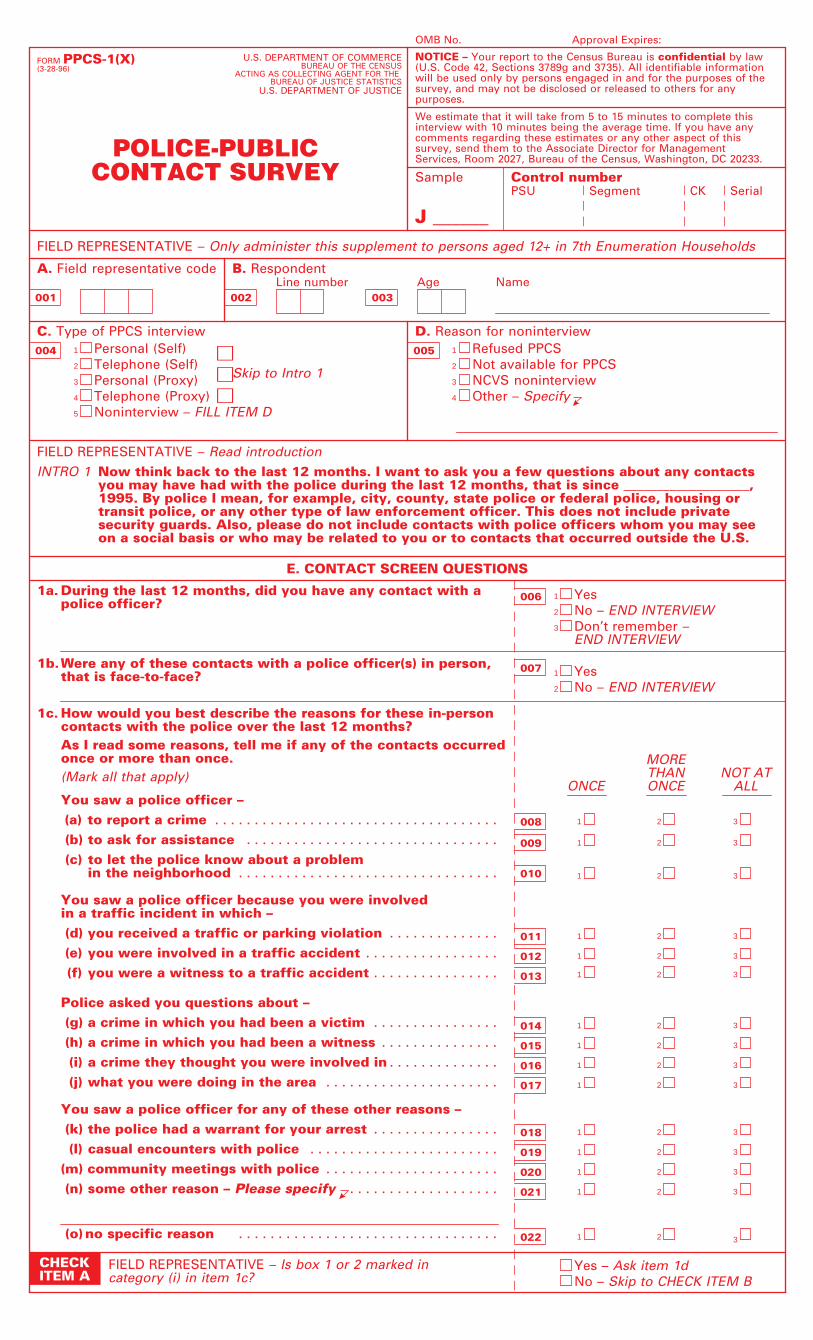
An estimated 1.2 million personswere handcuffed during 1996, orabout 0.6% of the population age 12 or older.
Men, minorities, and persons underthe age of 30 represented a relativelylarge percentage of those handcuffed,compared to their representationamong persons with contact withpolice.
An estimated 500,000 persons (0.2% of the population age 12 orolder) were hit, held, pushed, choked,threatened with a flashlight, restrainedby a police dog, threatened or actuallysprayed with chemical or pepperspray, threatened with a gun, orexperienced some other form of force.Of the 500,000, about 400,000 werealso handcuffed.
Highlightsfrom the Police-Public Contact Survey
About the Police-Public Contact Survey
In 1996 the Census Bureau inter-viewed a nationally representativesample of 6,421 persons age 12or older. Extrapolated to anational population, the 6,421represent nearly 216 millionpersons. Interviewers determinedthat 1,308 out of the 6,421 hadface-to-face contact with policeduring the year. The 1,308represent about 44.6 millionpersons nationwide.
Of the 6,421 persons, 14 said that they were hit, pushed,choked, threatened with aflashlight, restrained by a policedog, threatened with or actuallysprayed with chemical or pepperspray, threatened with a gun, orthat they experienced some otherform of force. Extrapolated to anational population, the 14represent nearly 500,000 persons.Because the 500,000 estimate isbased on so few cases, there is a
iv Police Use of Force

The total estimated number whowere handcuffed or were hit, held,pushed, choked, threatened with aflashlight, restrained by a police dog,threatened or actually sprayed withchemical or pepper spray, threatenedwith a gun, or who experienced someother form of force was 1.3 millionpersons (0.6% of the population age12 or older).
Of the 1.3 million, about 60% werepersons who, for some reason, hadaroused police suspicions.
Recommended changesto the survey
Analysis of the pretest data revealsthe following needed changes infuture editions of the Police-Public Contact Survey: ask whether therespondent or the police initiated thecontact; expand the list of specificreasons for police-public contact toobtain greater detail; ask whether,from the respondent’s perspective, the force applied was appropriate orexcessive; ask more questions abouttraffic stops; investigate possiblediscrepancies between what thissurvey found versus what is knownfrom other data sources.
The limited pretest sample found 1,308 respondents(representin g 44.6 million persons) who had a face-to-face police contact
Respondent self-reports
All respondentsPersons withpolice contact
Contact involved threat or use of force
Indication of possibleprovocation
Total 6,421 1,308 14 10White 5,029 1,086 7 5Black 630 97 2 1Hispanic 495 74 4 3Other 267 51 1 1
Fourteen respondents reported apolice threat or use of force. Thisincluded 7 of the 1,086 whites withpolice contact (0.6%), 2 of the 97blacks with police contact (2.1%),and 4 of the 74 Hispanics with policecontact (5.4%). The small numberof respondents prevents a reliablecomparison of police use of forceexperienced by black, white, andHispanic respondents.
The pretest findings do demonstratethat a full-sample survey could
provide useful information about thedifferences, if any, in the extent towhich racial and ethnic subgroups of the population experience policeuse of force.
Ten of the fourteen respondentsindicating that police force wasthreatened or used also reportedtheir own actions may have pro-voked police to threaten or use forceduring the contact. For example,the respondent threatened theofficer or resisted being handcuffed.
Collection of National Data v

Introduction
The lack of reliable data on the extentof excessive force received the atten-tion of the U. S. Congress in enactingthe Violent Crime Control and LawEnforcement Act of 1994. The actrequires the Attorney General to col-lect data on excessive force by policeand to publish an annual report fromthe data (Title XXI, Subtitle D, PolicePattern or Practice):
Section 210402. Data on Use of Excessive Force
The Attorney General shall, throughappropriate means, acquire dataabout the use of excessive force by law enforcement officers.
Data acquired under this sectionshall be used only for research or statistical purposes and may not contain any information that may reveal the identity of the victim or any law enforcement officer.
The Attorney General shall publishan annual summary of the data acquired under this section.
The first report to Congress in April1996 entitled National Data Collectionon Police Use of Force summarizedwhat was known from studies that examined the issue of police use offorce and gathered data on the inci-dence of its use. The report notedsome of the difficulties encounteredby researchers and police executivesin collecting use-of-force data, includ-ing variations in definitions of policeuse of force, reluctance by policeagencies to provide reliable data, con-cerns about the misapplication of re-ported data, the lack of attention toprovocation, and the degree of detailneeded to adequately describe indi-vidual incidents.
Federally funded efforts by the Bureau of Justice Statistics (BJS) andthe National Institute of Justice (NIJ)were initiated during this past year tocollect national data on police use offorce. This report describes some results of these efforts. Subsequentannual reports will provide resultsfrom continuing federally sponsoredactivities.
Collection of National Data 1
National data collection on police use of force

Police-use-of-force workshop
In May 1995 the National Institute of Justice and the Bureau of Justice Statistics convened a Police Use-of-Force Workshop to discuss the provi-sions of Section 210402 of the ViolentCrime Control and Law EnforcementAct. The workshop brought togetherover 40 experts, including chiefs ofpolice, lawyers, researchers, policeunion representatives, Federalagency representatives, police train-ers, and civilian review board repre-sentatives. The participantsdiscussed the obstacles to acquiringdata on excessive force and debatedthe most appropriate collectionprocedures.
Workshop participants noted that acquiring data on the use of exces-sive force would be difficult becausethere is no single, consensual defini-tion of “excessive force” among po-lice, researchers, and legal analystsand there is little agreement about thebest sources for obtaining data rele-vant to the incidence and prevalenceof excessive force. Workshop partici-pants considered possible methodsthat could be used to gather data fromthe two major sources of information:the public and law enforcementagencies.
The first-year report to Congress
In April 1996 BJS and NIJ forwardedthe first annual report to the Congressthat described the various strategiesunder consideration for addressingthe requirements of Title XXI. Thisreport (NCJ-160113, April 1996) re-viewed the available research litera-ture and discussed the objectives ofnewly funded research on this topicundertaken by NIJ. The report alsodescribed a number of potential datacollection challenges, including vari-able definitions used by agencies indetermining whether force had been
used and other statistical and organ-izational impediments. The report examined the potential availability of use-of-force data from a variety of sources, such as official agency records (law enforcement records,court records, citizen complaint boardrecords, arrest records, and injury reports), national surveys of law enforcement officers, and national surveys of the public. The report con-cluded with information on two datacollection strategies selected, basedon the workshop described above:
BJS would undertake a police-publiccontact supplement to the NationalCrime Victimization Survey (NCVS),the second largest ongoing householdsurvey sponsored by the Federal Government.
NIJ and BJS would jointly fund theInternational Association of Chiefs ofPolice (IACP) to adapt and expandthe data collection protocols for meas-uring the use of force developed bythe Virginia Association of Chiefs ofPolice (VACOP) for use by local po-lice departments in other States.
Fielding the data collectionprograms
The Police-Public Contact Survey
BJS fielded a pretest of the police-public contact survey in 1996. Publicreview and comment on the surveyinstrument was obtained through a December 1995 notification in theFederal Register. A 3-month datacollection effort was conducted duringMay, June, and July 1996 among6,421 persons age 12 or older.
The survey instrument reflected com-ments received from about two dozenexternal reviewers. In February 1997the Bureau of the Census providedBJS with a final dataset containing the results of 6,421 interviews.
The police use-of-force databaseproject
In 1993 and 1994 the VACOP askedlocal law enforcement agencies in theState to voluntarily provide data onthe use of force. This effort laid thefoundation for a Federal grantawarded to IACP jointly by BJS andNIJ in September 1995.
This grant provided a year of fundingfor IACP to examine the viability of anational program to collect incident-level data on the use of force.Through a series of meetings aroundthe country with State and local lawenforcement agencies and the StateAssociations of Chiefs of Police (SA-COP), the IACP developed a stan-dardized data collection form foragencies to use in recording informa-tion about use-of-force incidents.During the year seven State associa-tions volunteered to serve as pilotsites to evaluate the forms and to en-courage participation within their re-spective States.
In September 1996 a second-yeargrant was awarded to continue theprogram. IACP has created a versionof the data collection forms that canbe filled out on a computer using aWindows-based interface. As ofMarch 1997 nearly 400 local law en-forcement agencies had requestedthis data-entry software, though theagencies from whom data have beenreceived to date are primarily partici-pants in the VACOP program. Theproject has established an Internetsite (http://www.policeforce.org) as a source of information for the publicand also for participating local law enforcement agencies.
2 Police Use of Force
Planning for a national datacollection program
revised on 12/29/97

Future data collection
The Police-Public Contact Survey offered a useful opportunity to assessthe public’s willingness to describetheir interactions with the police. Thesmall size of this pilot study, however,imposed limitations for in-depth analy-sis. After reviewing the individualitems on the pretest questionnaire fortheir clarity and production of usefuldata, BJS may propose, for publiccomment, a final version of its surveyfor fielding in 1998.
BJS and NIJ have continued to fundthe IACP’s National Police-Use-of-Force Database Project in FY 97. Nofunding has been sought to continuethe project in FY 98.
In FY 95, FY 96, and FY 97, no fundswere appropriated to support the twocollection programs described. Be-cause funding was specifically re-quested to fulfill the Title XXI mandatefor annual data collection on the po-lice use of excessive force, but wasnot provided, it is unclear whether thepilot efforts can be continued.
Collection of National Data 3

The pretest Police-Public ContactSurvey was conducted as a specialsupplement to an ongoing survey ofhouseholds that provides data for theNational Crime Victimization Survey.The NCVS is a continuously operatingsurvey (since 1973) in which inter-views are conducted with the Ameri-can public concerning recent crimevictimization experiences. Interviews(both face-to-face and by phone) are carried out by the U.S. Census Bureau under the sponsorship of the Bureau of Justice Statistics. Only persons age 12 or older are eligiblefor interview in the NCVS.
Collecting the data
Developing the questionnaire
Prior to preparing the pretest versionof the questionnaire, other question-naires were examined that includedquestions about police use of force.Included among the questionnairesexamined were instruments used bythe Phoenix Police Department, theVirginia Association of Chiefs of Po-lice, the Police Executive ResearchForum, and the International Associa-tion of Chiefs of Police. BJS, togetherwith NIJ, also commissioned threeoutside experts on the use of force toprepare papers recommending alter-native measurement issues andstrategies.
BJS and NIJ jointly sponsored a Police Use-of-Force Workshop onMay 31, 1995. The workshop solic-ited advice on data collection consid-erations from more than 40 police officials, researchers, and represent-atives of various organizations, includ-ing citizen complaint boards.1 FBIand Civil Rights Division officials fromthe Department of Justice also at-tended the workshop. The partici-pants urged BJS to consider
integrating questions on use of forceby law enforcement into the ongoingquestionnaire protocols.
Following the workshop, BJS staffprepared an initial version of thequestionnaire for the Police-PublicContact Survey.
To obtain comments and suggestionsfor improving the questionnaire, BJSpublished an announcement in theFederal Register (Vol. 60, No. 234) on December 6, 1995, notifying inter-ested persons that the questionnairewas available for review. In responseto the notification and to other out-reach efforts, BJS received commentsfrom about 30 persons. Reviewersincluded eight police chiefs, threeother police employees, and numer-ous researchers.
As a result of reviewers’ comments,significant modifications were made to the original questionnaire. Sugges-tions were adopted for: (a) distin-guishing private security officers frompublic police, (b) distinguishing be-tween different types of police con-tacts, (c) obtaining information onprovocation associated with policeuse of force, (d) obtaining informationboth on prevalence and incidence ofcontacts, (e) and obtaining the re-spondent’s assessment of the propri-ety of police conduct.
Prior to finalizing the questionnaire,Census Bureau staff convened re-spondent focus groups and utilizedthe services of their cognitive labora-tory staff to identify questions thatwould possibly cause difficulty for respondents. In addition, Field Division staff were asked to commenton potential problem areas for theirstaff in carrying out the interviews.Following these efforts, a final versionof the instrument (see pages 23-28)was prepared by the Forms Design
Branch of the Census Bureau, andinterviewer training was conductedduring April 1996.
Selecting the sample and fielding the questionnaire
The NCVS is based on interviews withrepresentative samples of Americanhouseholds. Once a household is selected to be in the sample, all themembers of that household age 12 or older are placed on a schedule to be interviewed every 6 months for 3 years. The survey design calls foreach household member to be inter-viewed seven times altogether overthe 3-year period. Of all the inter-views conducted in the NCVS in anygiven month, approximately one-seventh involve persons being inter-viewed for the first time, another one-seventh involve those being interviewed for the second time, another one-seventh involve inter-views for the third time, and so on.Persons designated to be asked thebattery of questions for the Police-Public Contact Survey were limited tothe one-seventh of the sample thatwas scheduled for its seventh (andfinal) interview in May, June, or July of 1996. These outgoing rotationhouseholds were chosen to minimize adverse effects on the NCVS of par-ticipation in this special supplement,while at the same time providing a nationally representative sample of respondents.
Sample sizes were as follows:
1996 Numberinterview of personsmonth interviewed
Total 6,421May 2,144June 2,217July 2,060
Because those interviewed had aknown probability of selection, it ispossible to weight the sample data to provide national estimates of the
4 Police Use of Force
The Police-Public Contact Survey
1See McEwen. National Data Collection on Police Use of Force, NCJ-160113, April 1996, for a list of attendees.
revised on 12/30/97

number of persons with and withoutcontacts with the police. The 6,421persons interviewed represented216,000,000 persons age 12 or older,an average statistical weight per per-son interviewed of nearly 34,000.
Respondents in the Police-PublicContact Survey were asked abouttheir contacts with police during the 12 months prior to their interview.Respondents interviewed in May 1996were therefore asked about contactsthat occurred anytime during the pe-riod June 1995 to May 1996. Thoseinterviewed in June 1996 were askedabout contacts between July 1995and June 1996. Interviews in July1996 covered the period from August1995 through July 1996. On average,the 12-month reference period in-cluded 6 months in 1995 and 6months in 1996. To simplify presen-tation of findings from the Police-Public Contact Survey, this report de-scribes police-public contacts as"1996 contacts," but in fact about halfthe contacts were in 1995 and halfwere in 1996.
The questionnaire was fielded begin-ning in May 1996. Monthly activityand data reports were provided to BJS staff within 2 weeks following themonth being reported upon. BJS staffcarried out summary analyses ofmonthly data in an effort to identifyand correct problem areas in the ad-ministration of the instrument. Fieldreports indicated no identifiable ques-tionnaire, respondent, or responsedenigration problems during the3-month period of interviewing. Interviewing was terminated in August1996.
Among persons who had no contactwith police, the interview took 1 min-ute on average to complete. Amongthose who had police contact, the average length of the interview was 10 minutes.
The survey of the 6,421 persons wasintended as a pretest of the question-naire. Consequently, the surveyshould not be viewed as a source ofin-depth or precise statistics on thetopic of police use of force. Rather,survey findings provide empirical in-formation to help guide future devel-opment of an improved questionnaireon the topic. Because of the prelimi-nary nature of the survey, the usualpractice of testing observed differ-ences for statistical significance wasnot followed.
Many of the findings from the pretestwere consistent with what might beexpected. For example, the likelihoodof a police-initiated contact was foundto decline with age. However, certainfindings were counterintuitive andshould not be taken seriously due tothe small sample size in this pretest.2
For example, males undoubtedly aremore likely than females to be sus-pected of a crime. Yet pretest resultsindicated little difference between thesexes: 1.3% of males and 1.1% offemales said they were suspected of a crime. Similarly, results regard-ing warrants are not credible: 0.2% ofmales and 0.3% of females said police had a warrant for their arrest. One possible explanation for thecounterintuitive results is small sam-ple size.
One of the goals of the pretest was toinvestigate use of force by police dur-ing encounters with citizens. Twospecific questions in the questionnairewere used to identify persons againstwhom force was used or threatened:questions 2a and 2b.
2a. "In any of these contacts with a police officer, did any officer warn youthat he or she would use physicalforce such as: a nightstick or baton, afirearm, a chemical spray, a flashlight,a police dog, or any device other thanhandcuffs to restrain you or to takeyou into custody?"
2b. "In any of these contacts with a police officer, did any officer actuallyuse any form of physical force againstyou including using any of the itemsjust mentioned?"
A "yes" to either 2a or 2b was the sole basis for distinguishing personsagainst whom force was used (orthreatened) from those against whomforce was not used (or threatened).On this basis, of the total 6,421 re-spondents in the survey, 14 wereclassified in this report as personsagainst whom force was used orthreatened. Because of the smallnumber of respondents reporting thatforce was used or threatened, in-depth analysis of the details of use-of-force incidents was not possible.
Collection of National Data 5
2Estimates of rare events based on smallsamples are unreliable. With larger samples,estimates become more reliable.

Results of the data collection
The prevalence of police contact with citizens
In 1996 there were about 216 millionU.S. residents age 12 or older.Based upon the results of the Police-Public Contact Survey, about 45 mil-lion U.S. residents, or about 21% ofthose age 12 or older, were estimatedto have had at least one face-to-facecontact with a law enforcement officerduring the year (figure 1).3
Respondents were asked to identifythe major reasons for their contactswith the police and also the frequencyof such contacts during the year. Themost common reasons given for hav-ing such contacts were that the re-spondent sought the assistance of or provided assistance to the police (15 million), was a victim of a crime or a witness to a crime (14 million), or received a traffic ticket from the police (11 million).
6 Police Use of Force
Number of residents age 12 or older with face-to-face contact with police during 1996, by reason for contact
Number of residents age 12 or older 216 million
Involved/witnessed traff ic accident7 mill ion
Questioned as possible suspect in crime4 millionPolice served warrant0.5 mi ll ionCommunity meetings/casual contacts with 2 mil lion
Other reasons20 mil l ion
Face-to-face contact wi th pol ice in 1996 45 mil lion
No face-to-face contact with police in 1996 171 million
Some respondents reported more than one reason for a face-to-face contact with police during 1996. Consequently the sum of detailed reasons for contacts exceeds the 45 mill ion persons shown.
Vict im or witness to crime14 mill ion
Traffic ticket from police11 mill ion
Assistance from or to pol ice15 mil l ion
Figure 1
3Survey findings published throughout the report were all based on statisticallyweighted estimates.
revised on 1/5/98

About 1 in 4 males were estimatedto have had a contact with the policecompared to about 1 in 5 females (figure 2). Black and Hispanic resi-dents were about equally likely tohave had a contact with the police,and whites were more likely than either minority to have had a policecontact during 1996. Persons age 60 or older had the lowest prevalenceof contact with the police (11%), andpersons age 20 to 29 had the highestcontact levels (27%).
Collection of National Data 7
Percentage of respondents with face-to-face contact with policein 1996, by race, sex, and age
Percent of residents age 12 or older withface-to-face contact with police in 1996 21%
Age 12-1919%
Age 20-2927%
Age 30-3924%
Age 40-4924%
Age 50-5919%
Age 60 or older11%
Contacts by age of respondents
Males23%
Females19%
Contacts by sex of respondents
White respondents22%
Black respondents16%
Hispanic respondents15%
Contacts by race and ethnicity of respondents
Figure 2

8 Police Use of Force
Traffic tickets
Based on survey results, about 10.5 million people of the nearly 200 million age 16 or older or 5% received at least 1 traffic ticket in 1996. The overall national rate rises to 6% when the 10.5 million are calculated as a percent-age of the Nation’s 177 million licensed drivers. However, the rate for the youngest drivers teenagers in the age range 16 to 19 is nearly twice the overall national rate: 11.4%. The rate of being ticketed is highest for teenagers and declines with age (figure 3).
Estimated percent of licenseddrivers who received a traffic ticket within each age group in 1996
Overall 6.0% 16-19 11.4 20-29 9.7 30-39 7.1 40-49 5.0 50-59 3.8 60 or older 2.0
The high ticketing rates of teenagers is reflected in thefact that licensed drivers age 16 to 19 account for about5% of all drivers but nearly 10% of those receivingtickets.
Percent of: Those with Drivers tickets
Total 100.0% 100.0%16-19 5.2% 9.8%20-29 19.0 30.930-39 23.2 27.440-49 20.3 17.1
50-59 13.1 8.260 or older 19.3 6.5
Among the 10.5 million who received a traffic ticketin 1996, an estimated 15.5%, or about 1.6 million persons, received more than 1 ticket during the year. The 1.6 million represent about 1% of the 177 million licensed drivers. Teenagers and persons in their twenties accounted for just over 60% of those with multiple traffic tickets during 1996, more than double their share of licensed drivers.
Percent of licensed drivers of each age receiving at least one traffic ticket in 1996
16-19 20-29 30-39 40-49 50-59 60 or older0%
2%
4%
6%
8%
10%
12%
14%
Age of drivers
Note: The number of licensed drivers at each age was obtained from Highway Statist ics, 1995, the Federal Highway Administration.
Figure 3

Citizens with multiple police contacts
Some of the respondents had re-peated contacts with police during1996 (figure 4). Among persons whoreported a crime to police, approxi-mately a fourth said they reported acrime on more than one occasion dur-ing the year. The repeat contact ratewas also a fourth for certain othercontacts: ask police for help, offerhelp to police, and witness to a crime.The repeat contact rate was below afourth among those who said theywere ticketed (16%), those who werein an accident (9%), those who hadwitnessed an accident (13%), thosewho were victims (15%), those whofelt they had been suspected of acrime (11%), and those who werequestioned about their presence in aparticular area (19%). The repeatcontact rate was highest among per-sons who had casual encounters withpolice (60%) and those who attendedcommunity meetings with police(41%).
Collection of National Data 9
Of persons with each type of contact, the percent having more than one contact of that type, 1996
Report a crime
Need help
Help police
Traffic ticket
Involved traffic accident
Witnessed traffic accident
Crime victim
Witnessed a crime
Suspect in crime
Questioned about presence
Served a warrant
Casual encounter
Community meetings
0% 10% 20% 30% 40% 50% 60% 70%
Figure 4
revised on 1/5/98

Reasons for contacts with police
Among residents age 12 or older, anestimated 7% said they had a contactwith a police officer during 1996 be-cause they had witnessed a crime orthey had been the victim of a crime
(figure 5). About the same percent-age of the population said they hadsought the assistance of the police forsome other reason, and about 5% ofresidents of this age said they hadreceived a traffic ticket during theyear.
The survey questionnaire did not specifically ask who initiated the con-tact: the respondent or police. How-ever, most contacts, by their nature,can be categorized as either policeinitiated or citizen initiated. Accord-ingly, respondents who said the reason for the contact was (a) to
10 Police Use of Force
Percentage of respondents with face-to-face contact with police in 1996, by selected reasons for contact
Figure 5
Percent of residents with face-to-face contact with police 21%
Witness to or victim of crime 7%
Age 20-299%
Traffic ticket 5%
Males6%
Females4%
White respondents6%
Black respondents3%
Hispanic respondents5%
Age 12-195%
Age 20-299%
Age 30-397%
Age 40-495%
Age 50-594%
Age 60 or older2%
Males7%
Females6%
White respondents7%
Black respondents5%
Hispanic respondents4%
Age 12-195%
Age 30-398%
Age 40-498%
Age 50-596%
Age 60 or older3%
Age 12-195%
Hispanic respondents5%
Males7%
Females7%
White respondents7%
Black respondents5%
Age 20-298%
Age 30-398%
Age 40-499%
Age 50-597%
Age 60 or older4%
Needed help or offered help to police 7%

tto report a crime, (b) to ask police forhelp, (c) to offer assistance to police,(d) to give information about their vic-timization, or (e) to give informationabout a crime they had witnessed,were categorized as citizen-initiatedcontacts. Respondents who said the reason for the contact was that theywere (a) ticketed, (b) a suspect, (c)questioned about being in a particulararea, or (d) being served an arrestwarrant, were categorized as police-initiated contacts. Other types of contacts such as having a casualencounter with police or attending a community meeting with police were left unclassified because suchcontacts are frequently initiated byeither.
Overall, about 44% of respondentshad initiated the contact with the police during 1996, while for about32% of respondents the police hadinitiated the contact for the remain-der (24%), it is uncertain how the contact had been initiated (figure 6).
Male respondents are more likely thanfemale respondents to report that thepolice initiated the contact, while fe-male respondents are more likely thanmales to have initiated the contact.4 While white and black respondentswere about equally likely either to have initiated the contact or to havehad the police initiate contact, His-panic respondents reported a differentbasis for contacts with the police.Compared to white and black respondents, Hispanic respondentsevidenced a higher level of police-
initiated contact and a lower level ofself-initiated contact. Language andcultural barriers as well as prior expe-rience with police in native countriesmay play a significant role in the distri-bution of police contacts among His-panic residents:
The percentage of respondents reporting that police initiated the face-to-face contact declines with age. Conversely, the percentage ofrespondents reporting that they had initiated the police contact increaseswith age:
Collection of National Data 11
4These and other differences noted in this report were not tested for statisticalsignificance.
Who initiates contact with police?
Total PoliceRe-sident
Un-deter-mined
ResidentsWhite 100% 31% 44% 25%Black 100 30 42 28Hispanic 100 42 34 24
Who initiates contact with police?
Total PoliceRe-sident
Un-deter-mined
Age12-19 100% 41% 34% 25%20-29 100 38 42 2030-39 100 34 44 2240-49 100 27 48 2550-59 100 23 50 2760 or older 100 19 45 36
Percentage of face-to-face contacts that were police- or citizen - initiated in 1996, by race, age, and sex of respondents
Figure does not separately show those contacts in which it could not be determined who initiated the contact.
Percent of respondents
Total
Male
Female
White
Black
Hispanic
12-19
20-29
30-39
40-49
50-59
60 or older
0% 20% 40% 60%
Police-initiatedCitizen-initiated
Figure 6

Actions by police during contacts with citizens
The survey questionnaire (see pages23-28) included detailed questions(Questions 6a, 6b, and Check Item D)about specific types of force policemight have used (or threatened touse). For example, one questionasked: Did a police officer "kick you?"Another question asked: Did a policeofficer "push you?" Responses toeach of the questions were analyzedto learn which specific types of forcewere alleged to have occurred.5
For many types, no one in the surveysaid that type of force had occurred.For example, no one alleged that theyhad been kicked, hit with a flashlight,
attacked by a police dog, or shot at bypolice. The specific types of forcethat were alleged to have occurredwere: hit, held, pushed, choked,threatened with a flashlight, restrainedby a police dog, threatened or actuallysprayed with chemical or pepperspray, threatened with a gun, or someother form of force used against them.Altogether, 14 respondents, repre-senting 500,000 persons nationwide(or 0.2% of the total population age 12or older), alleged that one of theaforementioned types of force oc-curred. In addition to those types offorce, approximately 400,000 out ofthe 500,000 would have also been handcuffed. The remaining 100,000were not handcuffed.
Separate from questions about policeuse of force, respondents were askedwhether they had been handcuffed bypolice. Based on survey results, an
estimated 1.2 million people alto-gether were handcuffed in 1996, orabout 0.6% of the total population age12 or older. The 1.2 million includesthe 400,000 who were handcuffedduring an encounter that also includedone of the specified types of force.The remaining 800,000 out of the 1.2million were handcuffed only.
To summarize, in 1996 an estimated500,000 persons were hit, held,pushed, choked, threatened with aflashlight, restrained by a police dog,threatened or actually sprayed withchemical or pepper spray, threatenedwith a gun, or had some other form offorce used against them (figure 7). An estimated 800,000 had none ofthese forms of force used againstthem but were handcuffed only. The500,000 plus the 800,000 total to 1.3million, or 0.6% of the population age12 or older.
12 Police Use of Force
5The questionnaire (Questions 2a and 2b) askedrespondents whether police used or threatenedforce. Only respondents who said "yes" werethen asked to be specific about the type of forceused or threatened.
Distribution of residents by whether or not the contact with police involved handcuffing or a threat or actual use of force, 1996
Figure 7
Number of personswith face-to-face
contact with policein 1996
44,600,000
Contacts withoutforce
43,300,000
Contacts withhandcuffing only
800,000
Males52%
Females48%
Age 12-1912%
Age 20-2922%
Age 30-3924%
Age 40 or older40%
White respondents82%
Black respondents9%
Hispanic respondents5%
Males67%
Females33%
White respondents64%Black respondents15%
Hispanic respondents16%
Age 12-1920%
Age 20-2934%
Age 30-3918%
Age 40 or older28%
Males87%
Females13%
White respondents48%Black respondents16%
Hispanic respondents28%
Age 12-1951%
Age 20-2914%
Age 30-3921%
Age 40 or older14%
Contacts by sex of respondent
100%
Contacts by race and ethnicity of respondent
100%
Contacts by age of respondent
100%
Contacts by sex of respondent
100%
Contacts by race and ethnicity of respondent
100%
Contacts by age of respondent
100%
Contacts by sex of respondent
100%
Contacts by race and ethnicity of respondent
100%
Contacts by age of respondent
100%
Contacts with forceor the threat
of force500,000*
Note: Figures may not add to 100% because of rounding and the exclusion of those persons classified as "other" from the presentation.*Most of the 500,000 also said they were handcuffed.

Demographic characteristics of per-sons having contact with police variedaccording to the nature of the contact.For example, in 1996 males ac-counted for 47% of those reporting no contact with the police, 53% ofthose with a contact, 57% of thosecontacts initiated by the police, and73% of contacts in which handcuffingoccurred. A similar pattern was seenfor minorities and persons under age30. Those describing contacts withpolice that resulted in handcuffingwere the most likely to have beenmale, minority, and young:
Statistics on handcuffing compared to FBI arrest statistics
Demographic characteristics of per-sons handcuffed by police (from thePolice-Public Contact Survey) gener-ally correspond closely to characteris-tics of persons arrested by police(from the FBI’s Crime in the UnitedStates 1995, Washington, D.C.,1996). Males comprised 73% of per-sons handcuffed and 80% of thosearrested. Persons under age 30 were57% of persons handcuffed and 59%of those arrested. However, blackswere 17% of persons handcuffed but32% of those arrested.
Police handling of suspects
Based upon respondent descriptionsof the reasons for a face-to-face con-tact with police, an estimated 4.4 mil-lion persons age 12 or older werequestioned during 1996 either as pos-sible suspects in a crime or becausethe police were suspicious about theirpresence in an area. About 17% ofthe 4.4 million, or 740,000 persons,reported that during the contact theywere “patted down” or searched bythe police (figure 8). Of the 4.4 mil-lion, altogether 365,000 (8%) werehandcuffed.
Among those patted down by police,70% said they were also handcuffedor force was threatened or used dur-ing the contact. For the 5 out of 6 respondents who attributed the con-tact to police suspicions about themand who were not patted down, lessthan 6% reported that they werehandcuffed or threatened with force orhad force used against them.
It cannot be determined from thesedata the order in which the police decisions occurred to pat down, hand-cuff, or invoke force or the threat offorce or even whether the police con-sidered respondents as suspects priorto engaging in any of these actions.What is known is that about 8 out of10 people who felt the police consid-ered them possible suspects or whoindicated they believed that the policewere suspicious about them during acontact also reported they were notpatted down, were not handcuffed,and were not threatened with force.
Collection of National Data 13
Actions taken by police among self-perceived suspects in a crime, 1996
Patted down by police 740,000
Not patted down by police 3,690,000
Handcuffed224,000
Force used or threatened292,000
Neither224,000
Handcuffed141,000
Force used or threatened69,000
Neither3,480,000
Note: Respondents were classified as believing they were suspects if they reported the police asked them questions about a crime they thought they were involved in or if the policequestioned them about their presence in a particular area.
Persons who were questioned bypolice as possible suspects in a crime 4,430,000
Figure 8
Type of contact with police in 1996
Nocontact
Anycontact
Initiat-ed bypolice
Hand-cuffedduringcontact
Total (in millions) 171.0 44.6 14.0 1.2
Percent of totalMale 47% 53% 57% 73% Minority* 21 15 16 36 Under age 30 30 35 44 57
*Includes Hispanic and black respondents.

Potential provocation during police-citizen contacts
Because of the small number of respondents in the Police-Public Con-tact Survey who reported use of forceor the threat of force, no firm conclu-sions can be drawn about possibleprovocation by the respondent even if he or she may have self-reportedsuch provocation during a forcefulcontact with police. Therefore, thespecific actions of the respondent are not presented.
Respondents who reported that theywere threatened with force or againstwhom force was used were queriedabout any of their behaviors duringthe contact with police that could haveprovoked police. Among the esti-mated 500,000 persons who werethreatened with force or against whomforce was actually used, most self- reported that they had engaged in atleast 1 of the following threateningthe officer, assaulting the officer, ar-guing with the officer, interfering withthe officer in the arrest of someoneelse, possessing a weapon, blockingan officer or interfering with his/hermovement, trying to escape or evadethe officer, resisting being handcuffed,resisting being placed in a police vehicle, inciting bystanders to becomeinvolved, trying to protect someoneelse from an officer, or drinking or us-ing drugs at the time of the contact.
Of the 6,421 persons interviewed inthe Police-Public Contact Survey, 14(representing 500,000 persons) saidpolice used or threatened force. The14 were then asked a series of ques-tions intended to determine if theirconduct at the time may have pro-voked police to use force. Ten gaveanswers that suggested they mayhave provoked police. Answers fromthe remaining four did not suggestprovocation. No firm conclusions canbe drawn from these results. Themain reason is that the sample uponwhich results are based is too small to yield a reliable national estimate of the number of instances of unpro-voked police use of force.
Conclusions
Given the small number of cases, a preliminary conclusion that could bedrawn is that use of force is rare in police-citizen contacts and it is often accompanied, according to theself-reports of respondents, by somepossibly provocative behavior. Largersamples of citizens in the future wouldhelp to clarify both the extent and typeof provocation in cases of police useof force and, more importantly, shedlight on those interactions in which nopotential provocation was reported tohave occurred.
See Appendix II for more detailed findings from the Police-Public Contact Survey.
14 Police Use of Force

Project background
During the past 2 years, the NationalPolice Use-of-Force Database Projecthas been under development as a pilot effort to collect incident-based use-of-force information from local lawenforcement agencies. The project isadministered by the International As-sociation of Chiefs of Police (IACP)with funding from the Bureau of Jus-tice Statistics (BJS) and the NationalInstitute of Justice (NIJ).
In September 1995 BJS and NIJ awarded a 1-year grant of $199,976 to the IACP to undertake the imple-mentation of a common set of datacollection activities across a numberof jurisdictions. The collection wouldpermit the development of compara-ble statistics on the use of force.
During the first year the IACP held a series of meetings with State and local agencies, various members ofthe State Associations of Chiefs of Police (SACOP), and the U.S. BorderPatrol to formulate a standard datacollection form to record incident-level police-use-of-force information.Seven SACOP organizations Arkansas, New Jersey, New York,Vermont, Virginia, Washington, andWest Virginia volunteered to serveas pilot sites to encourage participa-tion among local police agencieswithin their States. The U.S. BorderPatrol also volunteered to participate.The data collection instrument anddata transmission procedures werefield-tested by agencies in the pilotStates during 1996.
In September 1996 IACP wasawarded a second grant to continuedata collection and reporting. As ofMarch 1997 almost 400 individual lawenforcement agencies had indicatedan interest in participation by request-ing copies of the documentation for
the collection program or by reviewingthe Windows-based software that was developed to facilitate datacollection/reporting to the nationaldatabase.
Expanding project participation
The IACP has taken an active role inkeeping the Nation’s law enforcementcommunity informed about the database project. These activities includeholding a workshop at the 1996 IACP annual conference, as well as provid-ing information to the National Asso-ciation of Women Law EnforcementExecutives, the National Organizationof Black Law Enforcement Execu-tives, the National Sheriffs’ Associa-tion, and the Hispanic CommandOfficers Association.
The project has been highlighted inseveral local and professional publica-tions. For example, an article in theOctober 1996 issue of the journal Law Enforcement Technology was responsible for increased requestsfrom local departments for the IACPsoftware.
The project has also developed a program of field outreach to the par-ticipating pilot sites and local depart-ments. Project staff are currentlyworking with several local police de-partments to develop an on-line reportthat will meet or exceed the currentpolice use-of-force accreditation re-quirement of the Commission for Accreditation for Law EnforcementAgencies, Inc. (CALEA). Further-more, technical assistance from theIACP is available to all participatingagencies and those interested inparticipating.
Project home page(www.policeforce.org)
In December 1996 the National Police Use-of-Force Database Projectimplemented an Internet site on theWorld Wide Web. The website
facilitates public access to informationabout the project. It contains a gen-eral description of the project as wellas electronic links to other criminaljustice agencies such as the BJS,NIJ, and the FBI. Additionally, it con-tains links to several comprehensivedirectories of law enforcement agen-cies with Internet websites.
Data collection procedures
Each participating agency uses theelectronic use-of-force form to recordinformation surrounding the incident.These incidents are then aggregatedand either sent to the participating SACOP office and then forwarded to the IACP or sent directly to theIACP.
Procedures to protect agencyidentification
The actual name and location of eachparticipating agency are not availableon the dataset. At the time of soft-ware installation, each local agency is provided a randomly generatedunique identification number to ac-company their data submission. Thisensures the anonymity of contributingagencies. A second unique identifica-tion number is generated at the Statelevel for statewide data transmitted tothe IACP. Therefore the exact identi-fication of the data contributor cannotbe determined from the submitteddata. Agencies can release their owndata to the public if desired. Locallythe information may be public as amatter of State law.
Collection of National Data 15
National Police Use-of-ForceDatabase Project
revised on 1/5/98

Electronic file transfer
Originally, the project was designed touse a floppy disk to transfer data fromlocal and State agencies to the centraldatabase. However, as the numberof participants in the project grows,the handling of numerous disks willbecome more difficult. A system to facilitate the electronic transfer of datafrom State and local agencies to thecentral database is being developed.A full-time automated data server hasbeen dedicated for use-of-force pro-ject participants. The site providesthe latest use-of-force software up-grades and technical documentation.Two SACOP States are using this fa-cility to automate their transfer of dataon a test basis. This will soon be ex-panded to all interested pilot Statesand independent local agencies. Thisactivity will allow large amounts ofdata to be received efficiently and re-duce reliance on floppy-disk transfer(figure 9).
Types of data collected
The automated database allows directentry of incident-related information,including type of force used, charac-teristics of the officer and the subject,and whether a related complaint wasfiled. The incident record consists ofthree parts a form describing whenthe incident occurred and the circum-stances, a form obtaining informationon the officer involved and the type offorce used, and a form on the subject,compiling demographic information aswell as any forceful behavior onhis/her part. (See the use-of-force incident report screens on pages 17and 18.)
Analytic opportunities
The database project will support awide variety of possible research ac-tivities relating to the officer, the sub-ject, and the circumstances underwhich force is used in law enforce-ment. Among the types of standardreports that will be generated from thedatabase project are
Type of force used by incident circumstance Subject drug/alcohol intoxication
at time of incident Number of use-of-force incidents
per officer Force incidents by officer ranked
by years of service Force incidents by officer ranked
by age of officer Force incidents by subject ranked
by age of subject Subject ranked by type of force
used Race, gender, and education for
officers and subjects Complaints and complaint disposi-
tions.
Preliminary data
While some preliminary data areavailable covering the first jurisdic-tions to participate, no specific statisti-cal findings are included in this report,because data collection continuesfrom other jurisdictions to ensuremore complete coverage and greater representativeness. It is anticipatedthat data from this project will beavailable for analysis for the next an-nual report to the Congress.
16 Police Use of Force
Participating agencies in the National Use-of-Force Database Project
(Source Agencies)Federal law
enforcement agencies
Individual lawenforcement personnel
Individual lawenforcement personnel
(Source Agencies)State and local law
enforcement agencies
National dataset
International Association of Chiefs of Police
State Association of Chiefsof Police
Figure 9
revised on 1/5/98

Collection of National Data 17

18 Police Use of Force

Current research
This section presents brief summariesof recently completed and ongoingNational Institute of Justice (NIJ) sup-ported research on police use offorce. While these studies build onNIJ’s history of funding on this par-ticular issue,6 NIJ has also examinedthe problem of use of force betweenthe police and the public within abroader context.
For example, in 1996 NIJ and the Office of Community Oriented PoliceServices conducted the National Sym-posium on Police Integrity. Approxi-mately 200 professionals includingpolice executives; police officers; researchers; and labor union, civilrights, community, and governmentrepresentatives were assembledfor a 2½-day meeting to discuss thecurrent issues of police integrity.While the use of excessive force bypolice was not highlighted as a centraltopic, the issue was discussed andreviewed at the symposium in relationto selecting, hiring, training, and main-taining professional standards andintegrity.
NIJ also has supported research onviolence against the police, such asPinizzotto, Davis, and Miller’s (1997)in-depth study of 52 officers seriouslyassaulted and Pate and Fridell's(1993) analysis of trends and circum-stances of felonious killings of law enforcement officers (see citationsof sources on page 21).
Regarding studies on the use of ex-cessive force by police, four recentprojects have been completed, andtwo additional studies are expected to be finished this year.
Survey of agencies
In 1992, Antony Pate and Lorie Fridellreceived an NIJ grant to survey a rep-resentative sample of 1,697 law en-forcement agencies7 regarding theiruse-of-force reporting policies, thetypes of force used by officers, citizencomplaints about excessive force, thedisposition of those complaints, andlitigation concerning allegations of excessive force in the previous year.
Among the findings are that mostagencies mandate the reporting ofonly more serious forms of force us-age by officers (for example, firearmdischarges); the use of unarmedphysical force is much more commonthan the use of less-than-lethal weap-ons or firearms; rates of excessiveuse-of-force complaints ranged from15.7 to 47.5 per 1,000 sworn person-nel, depending on agency size; and329 responding agencies reported2,558 civil suits filed in 1991 resultingfrom excessive force charges, while348 responding agencies reported122 criminal charges, and 114 re-sponding agencies reported payingalmost $50 million in civil damagesamong those cases disposed in 1991,even though few cases were resolvedin favor of the litigant (two-thirds ofthe civil suits were pending at the timeof the survey).
Findings from the survey were pub-lished in two volumes by The PoliceFoundation in Police Use-of-Force:Official Reports, Citizen Complaints,and Legal Consequences (Pate andFridell, 1993).
Researchers' recommendations
The Police Executive Research Forum (PERF) received an NIJ grantto bring together top researchers inthe policing and criminal justice fieldto review, synthesize, and presentnew theoretical approaches and em-pirical research addressing the prob-lem of excessive force by police. InPERF’s publication, edited by WilliamGeller and Hans Toch, contributingauthors addressed definition andmeasurement issues, correlates ofpolice use of force, administrative re-view procedures, the utility of lawsuitsfor preventing brutality, public opinionabout excessive force, police recruitscreening methods, theoretical andinternational perspectives on exces-sive force, and other issues. Whilethe findings and recommendationsfrom this report are too numerous tosummarize here, they are presentedin PERF’s report And Justice for All:A National Agenda for Understandingand Controlling Police Abuse of Force(Geller and Toch, 1995).
Police pursuits
The issue of police pursuits and theuse of excessive force was examinedby Geoffrey Alpert, University ofSouth Carolina, using multiple meth-ods and sources of data (such asagency records, a national survey,and interviews with police managers,officers, and offenders).
Based on a sample of 737 municipaland county police agencies8 selectedbetween October 1994 and May1995, the study found that 38% of de-partments do not collect or maintaininformation on police pursuits andonly 31% consistently maintain police-pursuit statistics. Most departments(91%) had written policies governing
Collection of National Data 19
National research on the useof force by policeby Robert J. KaminskiNational Institute of Justice
6See, for example, Kenneth J. Matulia, A Balanceof Forces (1982), supported by NIJ Grant No.79-NI-AX-0131, and Arnold Binder, Peter Scharf,and Raymond Galvin, Use of Deadly Force byPolice Officers. NIJ Final Report, Grant No.79-NI-AX-0134, 1982.
7The sample consisted of 1,016 municipalpolice departments, 588 sheriffs’ agencies, 43 county police departments, and 50 Statepolice agencies, from which 1,111 completedsurveys were obtained (representing a 65.5%response rate).
8Four hundred thirty-six agencies provided us-able data, representing a 59.2% response rate.
revised on 1/6/98

pursuits, but in many departments thepolicies were developed more than 25years ago. Sixty percent of the agen-cies provide entry-level driver trainingto recruits, but little or no training ondecisionmaking, such as when to pur-sue. In 1993, one-quarter of the de-partments experienced pursuits thatresulted in officers using force to ap-prehend a suspect, but in only 24 inci-dents were allegations of excessive orunreasonable force filed against theofficer.
Case studies revealed that adopting a “violent-felony only” pursuit policyreduced pursuits from 279 in 1992 to51 in 1993 in the Metro-Dade PoliceDepartment, while the number of pur-suits increased from 17 in 1993 to 122 in 1994 following the adoption of a more liberal pursuit policy by the Omaha Police Department. Thisstudy also utilized multivariate analy-ses to identify factors predictive ofpursuit-related accidents and injuries,and the likelihood of suspect escape.In addition, surveys of officers, jailedsuspects, and the public were con-ducted. The full details of this studyare available in the final report entitledPolice Pursuit Driving and the Use ofExcessive Force (Alpert, 1996).
Police psychologists
In The Role of Police Psychology inControlling Excessive Force (1994),Ellen Scrivner examined the role ofpolice psychologists in identifying riskfactors among police officers that con-tribute to police use of excessiveforce in performing their duties.
In addition to examining the types ofservices provided to officers in a sample of police agencies, her surveyof 65 police psychologists identifiedfive profiles of officers with excessive-force problems. These were officerswith personality disorders, officerswho experienced previous job-relatedtraumatic incidents, officers who
experienced early-career-stage prob-lems (for example: impulsiveness orlow tolerance for frustration), officerswho were sensitive to challenge andprovocation, and officers who wereexperiencing personal problems (forexample, separation, divorce, or lossof status). Several suggestions fordealing with the problem of excessiveforce are offered in this report.
Scrivner subsequently received a supplemental grant to examine modelprograms in police departments thatuse psychologists to develop interven-tions to respond to the use of exces-sive force by officers. The final reportfor this project has been reviewed andis being updated prior to publication.
Phoenix police study
The Phoenix Police Department, inconjunction with Rutgers Universityand Arizona State University, receivedan NIJ grant to study the incidenceand nature of the force used by andagainst Phoenix police officers duringarrest situations.9 Officers were sur-veyed over a 2-week period in June1994, resulting in analysis of 1,585adult custody arrests.10
An additional sample of 185 suspectinterviews were matched to the officersurveys to obtain the suspect’s per-spective of the arrest incident. Exam-ining the full range or continuum offorce used in arrest situations (frompolice presence to the use of deadlyforce), this study found that officersand suspects used some physicalforce in about 1 of every 5 and 1 ofevery 6 arrests, respectively; themagnitude of the force used by
officers and suspects was typically at the low end of the continuum; officersused a weapon in only 2% of the ar-rests, which most often was a flash-light; and the single best predictor ofpolice use of force was suspect use offorce.
Other predictors were whether the arrest involved both a male officer andsuspect, whether the suspected of-fense was violent, and whether thesuspect was involved with a gang, under the influence of alcohol, orknown to be resistive, assaultive, or armed with a weapon.
The Principal Investigator of thePhoenix study, Joel Garner, is cur-rently engaged in a five-cityreplication.11 This multisite projectbuilds upon and seeks to overcomecertain limitations of the researchfrom Phoenix. For example, it will at-tempt to examine the role of neighbor-hood characteristics as determinatesof the amount of force used by andagainst the police. Findings from thisproject are expected in October 1998.
Multidepartment study
In An Analysis of Police Use-of-ForceData, Geoffrey Alpert is analyzing andcomparing data sets on police use offorce from three police departments(Eugene and Springfield, Oregon;Metro-Dade, Florida).
These data will be analyzed to deter-mine the relationships among theamounts of resistance met by police,the amounts of force used by officersto control suspects, and the demo-graphic characteristics of suspectsand officers.
20 Police Use of Force
9The research team consisted of Joel Garnerand Jeffrey Fagan (Rutgers University); TomSchade, John Hepburn, and Aogan Mulcahy(Arizona State University); and John Buchananand Richard Groeneveld (Phoenix PoliceDepartment).10This number represents 85% of the total adultcustody arrests made during the study period.
11The cities are St. Petersburg, Florida; Dallas,Texas; Colorado Springs, Colorado; Charlotte,North Carolina; and San Diego, California.
revised on 1/6/98

A unique aspect of this study is thatthe use-of-force data collected by theEugene and Springfield Police Depart-ments was obtained within a broadercontext of determining the essentialtypes and minimum levels of physicalabilities (work skills) that police offi-cers require to perform their duties.Officers in these agencies were askedto complete a "physical abilities jobtask analysis" data collection form for1 month beginning in 1995. Becausethe focus of the survey was not to obtain data on use of force for depart-mental review purposes, some of thevalidity problems typically associatedwith the reporting on use of force byofficers may be avoided.
The Metro-Dade Police Departmentdata consist of 1,311 use-of-force reports from 1992 to 1994. These reports contain information regardingthe type of force used, the amount of citizen resistance, and the nature of injuries incurred. This study is expected to be completed in June1998. To obtain copies of these final reports, please contact NCJRS at 1-800-732-3277.
Collection of National Data 21
References
Alpert, Geoffrey. Police Pursuit Driving and the Use of Excessive Force.NIJ Final Report, Grant No. 95-IJ-CX-0066, 1996.
Binder, Arnold; Peter Scharf; and Raymond Galvin. Use of Deadly Force by Police Officers. NIJ Final Report, Grant No. 79-NI-AX-0134, 1982.
Fridell, Lorie A. and Antony M. Pate. Death on Patrol: Felonious Homi-cides of American Police Officers. NIJ Draft Final Report, Grant No.91-IJ-CX-K025, 1995.
Garner, Joel; John Buchanan; Tom Schade; and John Hepburn. Under-standing the Use of Force By and Against the Police. NIJ Research inBrief, 1996.
Geller, William A. and Hans Toch, eds. And Justice for All: A NationalAgenda for Understanding and Controlling Police Abuse of Force. Washington, D.C.: Police Executive Research Forum, 1995.
Matulia, Kenneth J. A Balance of Forces. Gaithersburg, MD: InternationalAssociation of Chiefs of Police, 1982.
Pate, Antony M. and Lorie A. Fridell. Police Use of Force: Official Reports,Citizen Complaints, and Legal Consequences, Volumes I and II. Washing-ton, D.C.: The Police Foundation, 1993.
Pinizzotto, Anthony J.; Edward F. Davis; and Charles E. Miller III. In theLine of Fire: A Study of Selected Felonious Assaults on Law EnforcementOfficers. Washington, D.C.: U.S. Department of Justice, 1997.
Scrivner, Ellen M. The Role of Police Psychology in Controlling Excessive Force. NIJ Research Report, NCJ-146206, 1994.
revised on 1/6/98

National Institute of Justice
In FY 97 NIJ continues to fund research on police activities andwould consider proposals that address police use-of-force issues. In progress police use-of-force pro-jects previously described will con-tinue throughout 1998.
Bureau of Justice Statistics
Questionnaire for Police-Public Contact Survey
No major problems were encounteredin using the questionnaire (duplicatedon pages 23-28) with the 6,421 re-spondents. Nevertheless, in the process of analyzing the data on the6,421, ideas emerged for improvingboth the administration and content of the questionnaire, most notably:
Respondents were presented with a list of 12 specific reasons for havingcontact with police: for example, "toreport a crime" or "you were involvedin a traffic accident." A 13th reasonwas nonspecific: "some other reason Please specify." Most of the rea-sons given under "Please specify" arelisted in Appendix I. As can be seen,many need not have been separatelyspecified because they clearly fit into1 of the existing 12 categories.Some, though, did not conveniently fitinto any of the 12. For example,some respondents said their job (asprobation officer, as parole officer, oras court employee) brought them intodaily contact with police, suggestingthe need to expand the question-naire’s list of specific reasons for con-tact to include "job-related contacts."Other categories should be added aswell. Note that altogether about 160respondents gave a reason under"Please specify" but only about a third of them were also coded as re-sponding affirmatively to any of the 12specific reasons. Thus, more respon-dents had 1 of the 12 specified types
of contacts than were coded byinterviewers.
Only respondents who said policequestioned them about suspectedcriminal activity were asked whetherthey were frisked. Consequently, it is not possible to estimate from thesurvey the percentage of the totalpopulation who were frisked, only the percentage of self-described sus-pects who were frisked. The questionof frisking should be asked of all re-spondents who had face-to-face con-tacts. Similarly, not all respondentswere asked whether they were subse-quently charged with a crime, and notall were asked for their evaluation ofpolice conduct during their encounter.The survey’s value would be en-hanced if all respondents were askedsuch questions.
The questionnaire asked respond-ents whether police used or threat-ened "force." Only respondents whosaid "yes" were then asked to be spe-cific about the type of force used orthreatened. A better approach toidentifying persons against whomforce was used might be to presentthe respondent with a list of actions for example, hit you, pushed you,threatened you with a flashlight and have the respondent indicate allthat apply. All respondents wouldthen be asked whether they perceivedthat the police had used or threatenedforce. A respondent who does notsay that any of the listed actions tookplace, yet says force was used, wouldthen be asked to specify the type offorce. All respondents who said thatforce was used would then be pre-sented a list of citizen actions thatsometimes provoke police to useforce for example, argued with po-lice, resisted being handcuffed, triedto run away and asked to indicateall that apply.
Many of the contacts that citizenshave with police are in connectionwith traffic stops. To learn moreabout these stops, the questionnaireshould ask whether the respondentwas the driver or a passenger;whether the driver received a ticket, awritten warning, or a verbal warning;and what the nature of the stop was(random stop, moving violation).
Respondents should be asked whoinitiated the contact: the respondentor police.
Certain findings (for example, num-ber of persons handcuffed, numberwho were crime victims) appeared inconsistent with what other nationalstatistics indicate or suggest. Effortsto improve the survey should investi-gate such inconsistencies.
National police use-of-force database project
The project is designed to provideuseful information for the Nation tobetter understand the circumstancesunder which force is used by the po-lice and to estimate the overall num-ber of incidents. Just as important asthese aims is that local agencies canuse the data generated by their owndepartments for better resource man-agement and service delivery. Datacan be used by department managersto identify the most likely circum-stances under which force is used bytheir officers and to develop trainingcurricula for officers regarding the ap-propriate level of force and use ofequipment. Law enforcement will bein a better position to assess thechange in use of force resulting fromnew areas of training and equipment.
22 Police Use of Force
Plans and recommendations for the collection of data on police use of force
revised on 1/6/98
The project will continue to streamlinethe data collection and transmission procedures to facilitate data collectionand reporting. Expanding the number of participating agencies and docu-menting the utility of the data are alsoimportant ongoing project activities.
NOTICE – Your report to the Census Bureau is confidential by law(U.S. Code 42, Sections 3789g and 3735). All identifiable informationwill be used only by persons engaged in and for the purposes of thesurvey, and may not be disclosed or released to others for anypurposes.
We estimate that it will take from 5 to 15 minutes to complete thisinterview with 10 minutes being the average time. If you have anycomments regarding these estimates or any other aspect of thissurvey, send them to the Associate Director for ManagementServices, Room 2027, Bureau of the Census, Washington, DC 20233.POLICE-PUBLIC
CONTACT SURVEY
FORM PPCS-1(X)(3-28-96)
U.S. DEPARTMENT OF COMMERCEBUREAU OF THE CENSUS
ACTING AS COLLECTING AGENT FOR THE BUREAU OF JUSTICE STATISTICS
U.S. DEPARTMENT OF JUSTICE
Sample
J ______
Control numberPSU Segment CK Serial
FIELD REPRESENTATIVE – Only administer this supplement to persons aged 12+ in 7th Enumeration Households
A. Field representative code B. RespondentLine number Age Name
C. Type of PPCS interview1
2
3
4
5
Personal (Self)Telephone (Self)Personal (Proxy)Telephone (Proxy)Noninterview – FILL ITEM D
D. Reason for noninterview1
2
3
4
Refused PPCS Not available for PPCSNCVS noninterviewOther – Specify
FIELD REPRESENTATIVE – Read introductionINTRO 1 Now think back to the last 12 months. I want to ask you a few questions about any contacts
you may have had with the police during the last 12 months, that is since ___________________,1995. By police I mean, for example, city, county, state police or federal police, housing ortransit police, or any other type of law enforcement officer. This does not include privatesecurity guards. Also, please do not include contacts with police officers whom you may see on a social basis or who may be related to you or to contacts that occurred outside the U.S.
E. CONTACT SCREEN QUESTIONS
1a. During the last 12 months, did you have any contact with apolice officer?
Yes No – END INTERVIEW
1
2
1b.Were any of these contacts with a police officer(s) in person,that is face-to-face? Yes
No – END INTERVIEW
3
1c. How would you best describe the reasons for these in-personcontacts with the police over the last 12 months?
(Mark all that apply)
1
Skip to Intro 1
OMB No.
As I read some reasons, tell me if any of the contacts occurredonce or more than once.
You saw a police officer –(a) to report a crime . . . . . . . . . . . . . . . . . . . . . . . . . . . . . . . . . . . .
You saw a police officer because you were involvedin a traffic incident in which –
Police asked you questions about –
You saw a police officer for any of these other reasons –
(m) community meetings with police . . . . . . . . . . . . . . . . . . . . . .
2
ONCE
MORETHANONCE
CHECKITEM A
FIELD REPRESENTATIVE – Is box 1 or 2 marked incategory (i) in item 1c?
Yes – Ask item 1dNo – Skip to CHECK ITEM B
001 002 003
004 005
006
007
008
009
010
011
012
013
014
015
016
017
018
019
020
021
022
1 2
1 2
1 2
1 2
1 2
1 2
1 2
1 2
1 2
1 2
1 2
1 2
1 2
1 2
NOT ATALL
3
3
3
3
3
3
3
3
3
3
3
3
3
3
3
Don’t remember – END INTERVIEW
1
2
Approval Expires:
(b) to ask for assistance . . . . . . . . . . . . . . . . . . . . . . . . . . . . . . . .
(c) to let the police know about a problemin the neighborhood . . . . . . . . . . . . . . . . . . . . . . . . . . . . . . . . .
(d) you received a traffic or parking violation . . . . . . . . . . . . . .
(e) you were involved in a traffic accident . . . . . . . . . . . . . . . . .
(f) you were a witness to a traffic accident . . . . . . . . . . . . . . . .
(g) a crime in which you had been a victim . . . . . . . . . . . . . . . .
(h) a crime in which you had been a witness . . . . . . . . . . . . . . .
(i) a crime they thought you were involved in . . . . . . . . . . . . . .
(j) what you were doing in the area . . . . . . . . . . . . . . . . . . . . . .
(k) the police had a warrant for your arrest . . . . . . . . . . . . . . . .
(l) casual encounters with police . . . . . . . . . . . . . . . . . . . . . . . .
(n) some other reason – Please specify . . . . . . . . . . . . . . . . . . .
(o) no specific reason . . . . . . . . . . . . . . . . . . . . . . . . . . . . . . . . .

Page 2 FORM PPCS-1(X) (3-28-96)
CHECKITEM B
FIELD REPRESENTATIVE – Is box 1 or 2marked in category (j) in item 1c?
Yes – Ask item 1eNo – Skip to item 1f
1e. You reported that the police asked youquestions about what you were doing in thearea. Did they frisk you or pat you down?
Yes No
1f. During any of these in-person contacts, did apolice officer handcuff you?
YesNo –Skip to item 2a
1g.For which of the contacts you reported did apolice officer handcuff you?
1
2
3
To report a crime
4
To ask for assistance
To let the police know about a problem in theneighborhood
(Mark all that apply)
FIELD REPRESENTATIVE – Read only categoriesmarked 1 or 2 in item 1c.
5
6
7
8
9
Received a traffic or parking violation
Involved in a traffic accident
Was a witness to a traffic accident
A crime in which respondent had been a victim
A crime in which respondent had been a witness
A crime they thought respondent was involved in
What respondent was doing in the area
Police had a warrant for respondent’s arrest
Casual encounters with police
Community meetings with police
Some other reason
No specific reason
10
11
12
13
14
15
16
2a. In any of these contacts with a police officer, didany officer warn you that he or she would usephysical force such as: a nightstick or baton, afirearm, a chemical spray, a flashlight, a policedog, or any device other than handcuffs torestrain you or to take you into custody?
Yes No
2b. In any of these contacts with a policeofficer, did any officer actually use any formof physical force against you including usingany of the items just mentioned?
Yes No
CHECKITEM C
FIELD REPRESENTATIVE – Is box 1 (Yes)marked in item 2a or 2b?
Yes – Ask item 3No – END INTERVIEW
3. How many times did the police actually useor threaten to use force against you duringthe last 12 months?
None000
1
2
1
2
1
2
1
2
More than once – How many times?
Read INTRO 2
INTRO 2 You say that police used force against you more than once during the last 12 months.Please limit your answers in the following questions to any contact in which youreceived an injury or which you consider to have been the most serious.
4a. Did you know that the person was a policeofficer at the time of this incident?
Yes – Ask item 4bNo – Skip to item 4c
1
2
4b.How did you know that the person was apolice officer at the time of the incident?
1
2
3
4
5
Wore a uniform
Skip to item 5
Don’t know – Skip to item 56
(Mark all that apply)
Skiptoitem5
E. CONTACT SCREEN QUESTIONS – Continued
Other reason – Specify
Showed respondent a badge or identification
Arrived in a police vehicle
024
025
026
027
028
030
031
042
043
044
045
046
029
Told respondent
Other – Specify
047
048
049
050
051
032
033
034
035
036
037
038
039
040
041
1d. You reported that the police asked youquestions about a crime they thought youwere involved in. Did they frisk you or patyou down?
Yes No
1
2
023
001 Once Skip to item 4a

Page 3FORM PPCS-1(X) (3-28-96)
5. Was the police officer in this incident a(read answer categories) –
1 member of a city or county policedepartment, sheriff’s department, or statepolice department?
(Mark all that apply)
CHECKITEM D
FIELD REPRESENTATIVE – ASK the followingfor each weapon that is marked in item 6b.
E. CONTACT SCREEN QUESTIONS – Continued
058
2
3
Federal law enforcement officer such asthe FBI, the DEA, Immigration/INS,Customs, military police, or a Park Ranger?an officer from some other police agencysuch as housing police, transit police, orcampus police?Don’t know what kind of police agency4
6a. During the incident, did the police officer,do any of the following (read answercategories)?
059 1
2
3
4
5
6
Hit or punch youKick youHold you by the arm Push youUse a chokeholdUse some other form of force – Please specify
060
061
062
063
064
(Mark all that apply )
6b.During the incident, did a police officer,warn use or actually use any of thefollowing weapons (read answer categories)?
066 1
2
3
4
5
6
Nightstick or batonFlashlightPolice dog Chemical or pepper sprayFirearmSomething else – Please specify
067
068
069
070
071
No weapon was used – Skip to item 77072
CHECKITEM E
FIELD REPRESENTATIVE – Is box 2 or 3marked for category e (firearm) in CHECK ITEM D?
Yes – Ask item 6cNo – Skip to item 7
a. Nightstick or baton . . . . . . . . . . . . . . . . . . . . .
b. Flashlight . . . . . . . . . . . . . . . . . . . . . . . . . . . . . .
c. Police dog . . . . . . . . . . . . . . . . . . . . . . . . . . . . .
d. Chemical or pepper spray. . . . . . . . . . . . . . . .
e. Firearm (such as a handgun, rifle or shotgun)
f. Other weapon . . . . . . . . . . . . . . . . . . . . . . . . . .
1 2
THREATENRESPONDENT
ONLY
073
RESTRAINEDRESPONDENT
ONLY
ACTUALLYUSED IT ON
RESPONDENT
3
6c. You said that a firearm was actually usedagainst you. Did the police officer shootthe firearm during this contact?
Yes No – Skip to item 7
079
6d.Were you shot by the officer during thiscontact?
080 Yes No
1
2
1
2
4c. Why didn’t you know that the person was apolice officer at the time of the incident?
1
2
3
4
5
Did not wear a uniform
Don’t know6
(Mark all that apply)Did not show respondent a badge or identification
Did not arrive in a police vehicle
Never told respondent
Other – Specify
052
053
054
055
056
057
How was the weapon used by the policeofficer. Was it used only to threaten orrestrain you or was it actually used on you?
074
075
078
1
1
1
1
1076
077
2
2
2
2 3
3
3
3
32
None7065

Page 4 FORM PPCS-1(X) (3-28-96)
9. Was it daytime or nighttime when theincident occurred?
1
2
DaytimeNighttime
E. CONTACT SCREEN QUESTIONS – Continued
096
Was the officer White, Black, or some otherrace?
11a. Tell me about the officer with whom youhad the contact.
098 1
2
3
WhiteBlackOther – Specify
Don’t know4
CHECKITEM F
FIELD REPRESENTATIVE – Is the number initem 10 more than 1?
Yes – Skip to item 11cNo – Ask item 11a
Don’t know number of officers0
Number of officers present09710. How many officers were present during
this incident?
F. CHARACTERISTICS OF OFFICER(S)
11b. Was the officer male or female? 1
2
MaleFemale
099Skip to item 12a
11c. Tell me about the officers with whomyou had the contact.
1
2
3
4
5
6
7
8
All whiteAll blackAll of some other raceMostly whiteMostly blackMostly some other raceEqually mixed Don’t know race of any/some
100
Were the officers White, Black, or someother race?
11d. Were the officers male or female? 101 All maleAll femaleMostly maleMostly femaleEqually mixed Don’t know
1
2
3
4
5
6
095 1
2
3
Drinking only Drugs onlyBoth drinking and using drugs
8b. Which was it, drinking, using drugs, orboth?
7. Did you do any of the following during theincident (read answer categories)?(Mark all that apply)
081
082
083
084
1 Threaten the officerAssault or attack the officerArgue with the officerInterfere with the officer while he/she wasinterviewing, investigating, or arrestingsomeone elsePossess a weapon such as a firearm, knife,or clubBlock an officer’s exit or entrance or interferewith his or her movement in any wayAttempt to escape, hide, or evade theofficer such as by fleeing or being involvedin a high-speed chaseResist being handcuffed
Ask bystanders to become involved in theincidentTry to protect someone else from an officerDo anything else that might haveprovoked the officer to use or warn youabout the use of force – Please specify
Did nothing
2
3
4
5
6
7
8
9
10
11
13
Resist being placed in a police vehicle
12
085
086
087
088
089
090
091
092
093
8a. 094 1
2
Yes No – Skip to item 9
Had you been drinking or using drugsbefore this incident?

Page 5FORM PPCS-1(X) (3-28-96)
H. OFFENSES
14. Following this contact with the police,were you charged with any (other) crimessuch as (read answer categories) –
124
125
126
127
128
129
130
131
132
133
134
135
136
1
2
3
4
5
6
7
8
9
Murder?Rape?Sexual assault?Robbery?Assault?Burglary?Theft or larceny?Motor vehicle theft?Trafficking in drugs?Possession of drugs?Possession of firearm or concealed weapon?Gambling?Some other offense?– Please specify
(Mark all that apply)
10
11
12
13
13. As a result of this contact with thepolice, were you charged with any of thefollowing crimes (read answer categories)?
117 1
2
3
4
Resisting arrestAssaulting an officerUnlawful flight from the officerObstructing justice
(Mark all that apply)
Other – Please specify5
118
119
120
121
Don’t knowNo charges
6
7
122
12f. What type of care did the officer receivefor his/her injury?
116 1
2
3
4
No care receivedEmergency services onlyHospitalizationOther – Specify
Don’t know5
G. INJURIES
12a. Were you injured as a result of thisincident?
102 1
2
YesNo – Skip to item 12d
12b. What type of injury was it (read answercategories)?
103 1
2
3
4
Gunshot woundBroken bones or teeth knocked outInternal injuries(Mark all that apply)
Bruises, black eye, cuts, scratches,swelling or chipped teethOther – Please specify5
104
105
106
107
12c. What type of care did you receive foryour injury?
108 1
2
3
4
5
No care receivedRespondent treated self (e.g. bandage)Emergency services onlyHospitalizationOther – Specify
12d. To your knowledge, was any police officerinjured in this incident?
109 1
2
3
Yes – Ask item 12eNo Don’t know Skip to item 13
12e. What type of injury was it (read answercategories)?
110 1
2
3
4
Gunshot woundBroken bones or teeth knocked outInternal injuries(Mark all that apply)
Bruises, black eye, cuts, scratches,swelling or chipped teethOther – Please specify5
111
112
113
114
Don’t know6115
No charges14137
123

Page 6 FORM PPCS-1(X) (3-28-96)
15. Looking back at this incident, do you feelthe police behaved properly orimproperly?
138 1
2
3
Properly – END INTERVIEWImproperlyDon’t know
I. CITIZEN ACTIONS TAKEN
16a. Did you take any formal or informalactions, such as filing a complaint orlawsuit, claiming that unnecessary orexcessive force was used against you bypolice in this incident?
139 1
2
16b. Have your actions only been informal, suchas a telephone call to the policedepartment to complain about the incident,with no official written complaint orlawsuit filed with any public agency?
140 1
2
16c. With whom have you actually filed formalwritten complaints or initiated formalactions (read answer categories)?
141 1
2
Civilian Complaint Review BoardLaw enforcement agency employing theofficerLocal prosecutor’s officeThe FBI or the U.S. Attorney’s officeFiled a lawsuit against the lawenforcement agency or the localgovernmentFiled a lawsuit against the officer involvedin the contact
3
4
5
6
(Mark all that apply)
17. In your own words, how would you describe the incident and how it happened. Whatstarted the incident? What happened next?
Yes No – END INTERVIEW
Yes – END INTERVIEWNo
142
143144145
146

Selected responses to question 1c. "How would you best describe the reasons forthese in-person contacts with the police over thelast 12 months?. . . Please specify"
Specified reasons that fit into category (a) to report a crime
1) Had contact with police when machinery owned by respondent was vandalized
2) Had contact with police when some kids threw rocksat son's car and broke windshield
3) Showed police where vandalism at work occurred
4) Reported theft of car
5) Theft of car stereo when someone broke in car
6) Reported break-in of residence/business
7) To report theft of property
8) To report a stalking
9) Called police to pick up stolen tires found in bushes
10) Provided police with a statement for a robbery report
11) Police talked to respondent about someone usingcredit card
12) Respondent is supervisor called police when employees were threatened to be shot
13) Respondent works at convenience store called police for gas run-offs
14) Police responded to 911 call
15) Police responded to house burglar alarm
16) Respondent shot someone
17) Talked to police about a stabbing outside apartmentbuilding respondent was not a witness
18) Saw police when found suspicious narcotics andturned them in
19) To aid in police investigation
Specified reasons that fit into category (b) to ask for assistance
1) Locked keys in car
2) Alarm system malfunctioned police investigated
3) Driveway blocked by vehicle police called
4) Police officer gave respondent's car a jump-start
5) Officer pulled beside car to shine lights while fixing flat tire
6) Reported daughter/brother as runaways
7) Police had to remove son with mental problems fromschool
8) Police came because respondent had threatenedsuicide
9) Police looking for respondent's sister's children wanted officer present when respondent told sister
10) Police contacted respondent to let him know sonwas killed in car wreck
11) Police responded to a fire
12) Death at home
13) To discuss personal matters regarding son's ex-wife
14) Saw police about permit/license
15) Saw police after neighbor child came to respon-dent's door in distress
16) Asked for increased police surveillance
17) To check out Census Bureau lady
18) 93-year-old respondent called police because he thought man was going to give him a bath
19) Ran out of gasoline
20) Asked officer for directions
21) Received a ride
22) Conservation officer bow hunter safety course
23) Personal reason
24) Police wrote up accident report when respondentfell on pavement
25) Police contacted respondent about a prescription
26) When tornado hit my house
Appendix I
Selected responses to Police-Public Contact Survey
Collection of National Data 29

Specified reasons that fit into category (c) to let the police know about a problem
1) To report a smoking incident on city bus
2) Disturbance outside respondent's home
3) Saw police at school when there are problems
4) Police responded to fights (domestic violence, other fights)
5) Saw police when let them know about bike inwalkway
6) Reported a lady with no shoes outside at 4 in themorning in sub-zero weather
7) Reported suspicious people in the neighborhood
8) Had sold house to people in Montana Freemencompound
9) Police contacted respondent regarding dumpster in neighborhood
10) Animals in neighborhood
Specified reasons that fit into category (d) you received a traffic or parking violation
1) Received a ticket (not wearing a seatbelt, driving too close, parking ticket)
2) Received a warning for speeding
3) Stopped for a traffic violation
4) Parked in fire lane officer asked respondentto leave
5) Respondent forgot to put tag decal on license tag officer did not give ticket or warning
Specified reason that fit into category (e) you were involved in a traffic accident
1) Relating to an accident (to report an accident, make out an accident report)
Specified reason that fit into category (h) a crime in which you had been a witness
1) Witnessed a crime
Specified reasons that fit into category (i) a crime they thought you were involved in
1) Police confiscated property
2) Police thought respondent threw egg at car
Specified reasons that fit into category (l) casual encounters with police
1) Gave donation to police for police association
2) Spoke to officers on a casual basis
3) Police seeking money for charity
4) Friends with policeman
5) Helped officer find an address
6) Police came into restaurant
7) Some officers are customers of respondent
8) Social basis (to have coffee, say hello)
9) Doing volunteer work
Specified reasons that fit into category (m) community meetings with police
1) School meeting in class regarding police work
2) Gets in contact with the police for the Town WATCH
3) While working on election board
4) Police talked to students at school
Specified reasons that did not fit into existingcategories
Legal/criminal justice contacts
1) Asked to leave during divorce proceeding
2) Neighbor complained about children making too muchnoise
3) Swimming in river
4) Saw police when doing community service to satisfyfighting
5) Saw police when posted bail
6) Saw police when visiting someone in State prison
7) Police contacted respondent about shoveling snowinto street
8) Neighbors complained about music being too loudduring party
9) Saw police when took gun in to be destroyed
30 Police Use of Force

10) Son got in fight at school, police brought him home
11) Son shooting fireworks neighbors called police
12) Traffic school
13) Civil summons, court order, served subpoena
14) Jury duty
15) Respondent working with undercover policeman
16) Respondent works at bank police investigatingATM fraud
17) Respondent had to go to court
18) Crime was committed in another apartment policecame to respondent's apartment by mistake
19) Saw police when escorted rape victim to hospital
20) Police looking for someone
Job-related contacts
1) Respondent is a school official who meets with policeafter a student gets arrested
2) Works with police on a daily basis
3) During court proceedings respondent is a lawyer
4) Respondent works with local sheriff to help people locate flaws in security systems
5) Respondent is chief of security on job called policefor authorization to search other employees' workplace
6) Respondent works at hospital and officers bring in prisoners for treatment
7) Sees police every day on job because respondent notifies police of people needing help (EMT worker)
8) Respondent is dispatcher for wrecking service has contact with police routinely
9) Works with police (bail bondsman and town mayor)
Other motor-vehicle-related contacts
1) Passenger in car when driver received speedingticket
2) Police stopped car for routine traffic stop
3) Pulled over because had arm out of car window
4) Police stopped respondent to check weight of truck
5) To pick up relative's car
6) Department of Transportation inspection
7) Police conducted a safety check
8) Talked to police about a ticket daughter received and should not have
Questioning by the police
1) Questioned by the police (for break-in of neighbor'shouse, police investigation of area crime)
Collection of National Data 31

Table 1a. U.S. population who had face-to-face contact with police, by sex, race and ethnicity, and reason for contact, 1996
Estimated percent of populationSex Race and ethnicity
Reason for face-to-face contact Total Male Female White Black Hispanic Other
For any reason 20.7% 22.5% 19.0% 22.1% 15.6% 15.1% 19.1%I reported a crime 5.9 6.1 5.7 6.5 4.1 3.7 4.4I asked police for help 4.7 4.5 4.8 5.1 2.9 2.9 4.9I reported a problem 3.7 4.0 3.3 3.9 2.0 3.2 4.2Police ticketed me 5.1 6.1 4.1 5.5 3.2 5.0 3.1I was in a traffic accident 2.5 2.6 2.5 2.7 2.0 1.4 2.3I witnessed an accident 1.1 1.0 1.1 1.2 .6 .6 .7I was the victim of a crime 3.1 3.0 3.3 3.5 1.4 2.1 3.3I witnessed a crime 1.6 1.9 1.4 1.7 1.6 1.0 1.0Police suspected me of a crime 1.2 1.3 1.1 1.2 .8 1.9 1.6Police asked why I was there 1.2 1.5 1.0 1.3 1.4 .5 1.9Police had a warrant for my arrest .2 .2 .3 .2 .3 .2 ... I had a casual encounter 3.7 3.9 3.5 4.2 2.5 1.9 1.9I attended a community meeting 1.1 1.2 1.1 1.2 1.1 .2 1.5Some other reason 6.5 7.0 6.0 3.9 2.0 3.2 4.2
Estimated numberSex Race and ethnicity
Reason for face-to-face contact Total Male Female White Black Hispanic Other
Population total 215,528,900 104,205,370 111,323,530 163,882,680 25,393,550 17,158,920 9,093,740For any reason 44,556,000 23,399,000 21,158,000 36,262,000 3,964,000 2,593,000 1,738,000I reported a crime 12,722,000 6,351,000 6,371,000 10,640,000 1,049,000 634,000 399,000I asked police for help 10,087,000 4,735,000 5,352,000 8,393,000 744,000 500,000 450,000I reported a problem 7,892,000 4,194,000 3,698,000 6,449,000 508,000 557,000 378,000Police ticketed me 10,947,000 6,337,000 4,610,000 8,988,000 815,000 865,000 278,000I was in a traffic accident 5,454,000 2,677,000 2,777,000 4,501,000 501,000 241,000 210,000I witnessed an accident 2,326,000 1,076,000 1,250,000 2,007,000 151,000 102,000 65,000I was the victim of a crime 6,755,000 3,108,000 3,646,000 5,753,000 343,000 360,000 299,000I witnessed a crime 3,467,000 1,934,000 1,532,000 2,776,000 419,000 179,000 93,000Police suspected me of a crime 2,611,000 1,362,000 1,249,000 1,945,000 197,000 326,000 143,000Police asked why I was there 2,690,000 1,578,000 1,112,000 2,070,000 361,000 84,000 175,000Police had a warrant for my arrest 492,000 195,000 297,000 378,000 84,000 30,000 ...I had a casual encounter 8,042,000 4,104,000 3,938,000 6,901,000 640,000 327,000 174,000I attended a community meeting 2,437,000 1,201,000 1,236,000 1,986,000 285,000 32,000 134,000Some other reason 14,066,000 7,342,000 6,723,000 11,760,000 1,075,000 724,000 506,000
Note: Persons having multiple contacts or more than one reason for any single contact appear in the table more than once. Consequently, the sum of the detailed reasons for contact exceeds the 44.5 million persons total shown. Percentages were derived from unrounded data. All population numbers are rounded....Not in sample.
Appendix II
Data tables from Police-Public Contact Survey
32 Police Use of Force
revised on 1/6/98

Table 1b. U.S. population who had face-to-face contact with police, by age of respondent and reason for contact, 1996
Estimated percent of population in each age categoryReason for face-to-face contact 12-19 20-29 30-39 40-49 50-59 60 or older
For any reason 18.6% 27.3% 24.3% 23.6% 18.7% 10.9%I reported a crime 4.4 8.2 7.4 7.0 5.4 2.8I asked police for help 3.5 5.7 5.6 6.2 4.4 2.4I reported a problem 2.6 3.9 5.1 4.8 3.7 1.7Police ticketed me 4.6 8.9 6.7 4.7 3.5 1.7I was in a traffic accident 2.4 3.1 3.2 2.4 2.1 1.9I witnessed an accident 1.2 2.2 1.2 .8 1.1 .1I was the victim of a crime 3.1 4.2 4.3 3.2 2.3 1.5I witnessed a crime 1.2 2.9 1.6 2.0 1.4 .5Police suspected me of a crime 2.4 2.0 1.1 .9 .8 .4Police asked why I was there 2.4 1.7 1.0 1.6 .6 .3Police had a warrant for my arrest .6 .2 .2 .2 .1 .1I had a casual encounter 4.1 4.5 4.2 5.2 2.7 1.6I attended a community meeting 1.3 .6 1.4 1.8 1.1 .6Some other reason 5.5 7.9 6.4 8.7 6.8 3.9
Estimated number in each age categoryReason for face-to-face contact 12-19 20-29 30-39 40-49 50-59 60 or older
Population total 30,224,900 36,557,440 43,574,000 38,783,630 24,810,910 41,194,440For any reason 5,634,000 9,967,000 10,588,000 9,147,000 4,634,000 4,490,000I reported a crime 1,319,000 3,011,000 3,209,000 2,702,000 1,346,000 1,136,000I asked police for help 1,062,000 2,081,000 2,420,000 2,413,000 1,081,000 1,000,000I reported a problem 783,000 1,408,000 2,239,000 1,866,000 909,000 687,000Police ticketed me 1,388,000 3,262,000 2,898,000 1,805,000 870,000 688,000I was in a traffic accident 732,000 1,130,000 1,376,000 912,000 519,000 785,000I witnessed an accident 356,000 797,000 538,000 299,000 277,000 58,000I was the victim of a crime 930,000 1,535,000 1,865,000 1,241,000 578,000 605,000I witnessed a crime 370,000 1,075,000 708,000 767,000 345,000 202,000Police suspected me of a crime 726,000 730,000 484,000 334,000 189,000 148,000Police asked why I was there 721,000 616,000 454,000 625,000 158,000 117,000Police had a warrant for my arrest 190,000 70,000 76,000 95,000 30,000 31,000I had a casual encounter 1,237,000 1,659,000 1,812,000 2,025,000 670,000 640,000I attended a community meeting 400,000 206,000 598,000 709,000 279,000 246,000Some other reason 1,676,000 2,898,000 2,806,000 3,389,000 1,681,000 1,586,000
Note: Percentages were derived from unrounded data. All population numbers are rounded.
Collection of National Data 33

Table 2a. U.S. population who had face-to-face contact with police, by sex, race and ethnicity, and reason for contact, 1996
Estimated percent of populationSex Race and ethnicity
Reason for face-to-face contact Total Male Female White Black Hispanic Other
For any reason 20.7% 22.5% 19.0% 22.1% 15.6% 15.1% 19.1%I was a victim or witness to crime 6.7 7.0 6.4 7.3 5.2 4.0 5.0I needed or offered help 6.8 6.9 6.7 7.4 4.5 4.7 6.4Police ticketed me 5.1 6.1 4.1 5.5 3.2 5.0 3.1I saw or was in a traffic accident 3.1 3.1 3.1 3.5 2.0 1.6 3.0I came under suspicion 2.1 2.3 1.8 2.0 1.7 2.1 3.1Police had a warrant for my arrest .2 .2 .3 .2 .3 .2 ... I attended a community meeting 1.1 1.2 1.1 1.2 1.1 .2 1.5Some other reason 9.1 9.9 8.3 10.0 6.2 5.5 7.1
Estimated numberSex Race and ethnicity
Reason for face-to-face contact Total Male Female White Black Hispanic Other
Population total 215,528,900 104,205,370 111,323,530 163,882,680 25,393,550 17,158,920 9,093,740For any reason 44,556,000 23,399,000 21,158,000 36,262,000 3,964,000 2,593,000 1,738,000I was a victim or witness to crime 14,417,000 7,247,000 7,170,000 11,970,000 1,310,000 680,000 458,000I needed or offered help 14,586,000 7,144,000 7,443,000 12,052,000 1,138,000 814,000 582,000Police ticketed me 10,947,000 6,337,000 4,610,000 8,988,000 815,000 865,000 278,000I saw or was in a traffic accident 6,744,000 3,280,000 3,465,000 5,694,000 501,000 274,000 275,000I came under suspicion 4,430,000 2,430,000 2,000,000 3,337,000 443,000 366,000 283,000Police had a warrant for my arrest 492,000 195,000 297,000 378,000 84,000 30,000 ... I attended a community meeting 2,437,000 1,201,000 1,236,000 1,986,000 285,000 32,000 134,000Some other reason 19,556,000 10,308,000 9,248,000 16,405,000 1,562,000 945,000 644,000
Reason for face-to-face contact Specific items under question 1c that formed basis for categorized reasonI was a victim or witness to crime (a) (g) (h)I needed or offered help (b) (c)Police ticketed me (d)I saw or was in a traffic accident (e) (f)I came under suspicion (i) (j)Police had a warrant for my arrest (k)I attended a community meeting (m)Some other reason (l) (n) (o)
Note: Percentages were derived from unrounded data. All population numbers are rounded....Not in sample.
34 Police Use of Force
revised on 1/5/98

Table 2b. U.S. population who had face-to-face contact with police, by age of respondent and reason for contact, 1996
Estimated percent of population in each age categoryReason for face-to-face contact 12-19 20-29 30-39 40-49 50-59 60 or older
For any reason 18.6% 27.3% 24.3% 23.6% 18.7% 10.9%I was a victim or witness to crime 5.4 9.3 8.3 8.0 6.1 2.9I needed or offered help 4.9 7.8 8.1 9.2 6.6 3.7Police ticketed me 4.6 8.9 6.7 4.7 3.5 1.7I saw or was in a traffic accident 3.1 4.4 3.6 3.0 2.6 1.9I came under suspicion 3.7 2.9 1.8 2.4 1.2 .5Police had a warrant for my arrest .6 .2 .2 .2 .1 .1I attended a community meeting 1.3 .6 1.4 1.8 1.1 .6Some other reason 8.4 11.1 9.4 12.1 8.2 5.1
Estimated number in each age categoryReason for face-to-face contact 12-19 20-29 30-39 40-49 50-59 60 or older
Population total 30,224,900 36,557,440 43,574,000 38,783,630 24,810,910 41,194,440For any reason 5,634,000 9,967,000 10,588,000 9,147,000 4,634,000 4,490,000I was a victim or witness to crime 1,617,000 3,389,000 3,605,000 3,103,000 1,511,000 1,191,000I needed or offered help 1,474,000 2,846,000 3,535,000 3,549,000 1,646,000 1,507,000Police ticketed me 1,388,000 3,262,000 2,898,000 1,805,000 870,000 688,000I saw or was in a traffic accident 943,000 1,623,000 1,575,000 1,179,000 638,000 785,000I came under suspicion 1,112,000 1,077,000 802,000 927,000 306,000 206,000Police had a warrant for my arrest 190,000 70,000 76,000 95,000 30,000 31,000I attended a community meeting 400,000 206,000 598,000 709,000 279,000 246,000Some other reason 2,531,000 4,044,000 4,090,000 4,704,000 2,045,000 2,111,000
Reason for face-to-face contact Specific items under question 1c that formed basis for categorized reasonI was a victim or witness to crime (a) (g) (h)I needed or offered help (b) (c)Police ticketed me (d)I saw or was in a traffic accident (e) (f)I came under suspicion (i) (j)Police had a warrant for my arrest (k)I attended a community meeting (m)Some other reason (l) (n) (o)
Note: Percentages were derived from unrounded data. All population numbers are rounded.
Collection of National Data 35

Table 3. U.S. population who had face-to-face contact with police, by sex, race and ethnicity, age, and whether contact was citizen- or police-initiated, 1996
Estimated percent of populationSex Race and ethnicity
Who initiated contact Total Male Female White Black Hispanic Other
Any contact 20.7% 22.5% 19.0% 22.1% 15.6% 15.1% 19.1%Police 6.5 7.7 5.5 6.9 4.7 6.3 5.4Respondent 9.0 9.3 8.8 9.8 6.5 5.2 8.4Undetermined 5.1 5.5 4.8 5.4 4.4 3.6 5.2
Estimated numberSex Race and ethnicity
Who initiated contact Total Male Female White Black Hispanic Other
Population total 215,528,900 104,205,370 111,323,530 163,882,680 25,393,550 17,158,920 9,093,740Any contact 44,556,000 23,399,000 21,158,000 36,262,000 3,964,000 2,593,000 1,738,000
Police 14,052,000 7,975,000 6,077,000 11,280,000 1,191,000 1,087,000 494,000Respondent 19,420,000 9,655,000 9,765,000 16,114,000 1,653,000 885,000 768,000Undetermined 11,085,000 5,769,000 5,316,000 8,868,000 1,120,000 621,000 476,000Not applicable (no contact) 170,972,000 80,807,000 90,166,000 127,621,000 21,430,000 14,566,000 7,356,000
Estimated percent of population in each age categoryWho initiated contact 12-19 20-29 30-39 40-49 50-59 60 or older
Any contact 18.6% 27.3% 24.3% 23.6% 18.7% 10.9%Police 7.6 10.4 8.1 6.4 4.3 2.0Respondent 6.4 11.4 10.6 11.2 9.4 4.9Undetermined 4.6 5.5 5.6 6.0 5.0 4.0
Estimated number in each age categoryWho initiated contact 12-19 20-29 30-39 40-49 50-59 60 or older
Population total 30,224,900 36,557,440 43,574,000 38,783,630 24,810,910 41,194,440Any contact 5,634,000 9,967,000 10,588,000 9,147,000 4,634,000 4,490,000
Police 2,310,000 3,798,000 3,550,000 2,467,000 1,057,000 835,000Respondent 1,928,000 4,149,000 4,611,000 4,343,000 2,333,000 2,025,000Undetermined 1,396,000 2,020,000 2,427,000 2,337,000 1,243,000 1,631,000Not applicable (no contact) 24,591,000 26,590,000 32,986,000 29,636,000 20,177,000 36,704,000
Note: Percentages were derived from unrounded data. All population numbers are rounded.
36 Police Use of Force
Collection of National Data 37
Table 4. U.S. population who were handcuffed by police, by sex, race and ethnicity, and age, 1996
Estimated percent of populationSex Race and ethnicity
Total Male Female White Black Hispanic Other
Handcuffed .6% .8% .3% .4% .8% 1.4% .9%
Estimated number Sex Race and ethnicity
Total Male Female White Black Hispanic Other
Population total 215,528,900 104,205,370 111,323,530 163,882,680 25,393,550 17,158,920 9,093,740Handcuffed 1,192,000 868,000 325,000 680,000 197,000 235,000 79,000
Estimated percent of population in each age category12-19 20-29 30-39 40-49 50-59 60 or older
Handcuffed 1.3% .8% .5% .5% .4% ...
Estimated number in each age category12-19 20-29 30-39 40-49 50-59 60 or older
Population total 30,224,900 36,557,440 43,574,000 38,783,630 24,810,910 41,194,440Handcuffed 384,000 301,000 214,000 198,000 96,000 ...
Note: Percentages were derived from unrounded data. All population numbers are rounded....Not in sample.

38 Police Use of Force
Table 5. U.S. population who were subjected to force or threat of force by police, by sex, race, ethnicity, and age, 1996
Estimated percent of populationSex Race and ethnicity
Total Male Female White Black Hispanic Other
Total 100.0% 100.0% 100.0% 100.0% 100.0% 100.0% 100.0%Not subjected to force or threat of force 99.8 99.6 99.9 99.9 99.7 99.2 99.6Subjected to actual force or threat of force
.2 .4 .1 .1 .3 .8 .4
Estimated number Sex Race and ethnicity
Total Male Female White Black Hispanic Other
Population total 215,528,900 104,205,370 111,323,530 163,882,680 25,393,550 17,158,920 9,093,740Not subjected to force or threat of force 215,026,000 103,769,000 111,257,000 163,642,000 25,312,000 17,016,000 9,055,000Subjected to actual force or threat of force
503,000 437,000 66,000 241,000 81,000 143,000 39,000
Estimated percent of population in each age category12-19 20-29 30-39 40-49 50-59 60 or older
Total 100.0% 100.0% 100.0% 100.0% 100.0% 100.0%Not subjected to force or threat of force 99.1 99.8 99.8 99.8 100.0 100.0Subjected to actual force or threat of force
.9 .2 .2 .2 ... ...
Estimated number in each age category12-19 20-29 30-39 40-49 50-59 60 or older
Population total 30,224,900 36,557,440 43,574,000 38,783,630 24,810,910 41,194,440Not subjected to force or threat of force 29,967,000 36,486,000 43,469,000 38,715,000 24,811,000 41,194,000Subjected to actual force orthreat of force
258,000 71,000 105,000 69,000 ... ...
Note: Percentages were derived from unrounded data. All population numbers are rounded....Not in sample.
revised on 1/6/98