Embed Size (px)
Citation preview
Policies and Performance of Ethiopian Cereal Markets
Shahidur Rashid and Asfaw Negassa
Development Strategy and Governance Division, International Food Policy Research Institute – Ethiopia Strategy Support Program II, Ethiopia
IFPRI-ADDIS ABABA P.O. Box 5689 Addis Ababa, Ethiopia Tel: +251-11-646-2921 Fax: +251-11-646-2318 E-mail: [email protected]
IFPRI HEADQUARTERSInternational Food Policy Research Institute 2033 K Street, NW • Washington, DC 20006-1002 USA Tel: +1-202-862-5600 Skype: IFPRIhomeoffice Fax: +1-202-467-4439 E-mail: [email protected] www.ifpri.org
Ethiopia Strategy Support Program II (ESSP II)
ESSP II Working Paper No. 21
May 2011
ESSP II Working Paper 21
ii
THE ETHIOPIA STRATEGY SUPPORT PROGRAM (ESSP)
WORKING PAPERS
ABOUT ESSP II
The Ethiopia Strategy Support Program II is an initiative to strengthen evidence-based policymaking in Ethiopia in the areas of rural and agricultural development. Facilitated by the International Food Policy Research Institute (IFPRI), ESSP II works closely with the government of Ethiopia, the Ethiopian Development Research Institute (EDRI), and other development partners to provide information relevant for the design and implementation of Ethiopia’s agricultural and rural development strategies. For more information, see http://www.ifpri.org/book-757/ourwork/program/ethiopia-strategy-support-program or http://www.edri.org.et/.
.
ABOUT THESE WORKING PAPERS
The Ethiopia Strategy Support Program II (ESSP II) Working Papers contain preliminary material and research results from IFPRI and/or its partners in Ethiopia. The papers are not subject to a formal peer review. They are circulated in order to stimulate discussion and critical comment. The opinions are those of the authors and do not necessarily reflect those of their home institutions or supporting organizations.
About the Author(s)
Shahidur Rashid: Senior Research Fellow, Markets, Trade, and Institutions Division, International Food Policy Research Institute Asfaw Negassa: Consultant, Socioeconomic Program, International Maize and Wheat Improvement Centre, Addis Ababa, Ethiopia
iii
Policies and Performance of Ethiopian Cereal Markets
Shahidur Rashid and Asfaw Negassa
Development Strategy and Governance Division, International Food Policy Research Institute – Ethiopia Strategy Support Program II, Ethiopia
The authors prepared the original version of this paper for a policy workshop in Addis Ababa organized by the Ethiopia Strategy Support Program II (ESSP II). Funded by a consortium of donors, ESSP was established to undertake actionable research to fill knowledge gaps, improve knowledge management, and strengthen national capacity to undertake relevant economic analysis. We are especially thankful to Paul Dorosh for many helpful comments on earlier versions of this paper.
iv
Table of Contents
1. Introduction ...................................................................................................................... 1
2. Evolution of cereal market policies .................................................................................. 2
2.1. The imperial regime (1960–1974) ............................................................................ 2
2.2. State-controlled markets (1975–1990) ..................................................................... 3
2.3. Liberalization and rapid growth (1991–2009) ........................................................... 4
3. Public investments in infrastructure and information ....................................................... 6
3.1. Road network ........................................................................................................... 6
3.2. Telephone and telecommunication services ............................................................ 8
3.3. Trucks and transport services .................................................................................. 9
3.4. Marketing and pricing information .......................................................................... 10
4. The structure of cereal markets ..................................................................................... 11
4.1. The marketing chain and the key actors ................................................................. 11
4.2. Broad changes in the cereal market structure ........................................................ 12
4.2.1. Changing role of public food marketing ........................................................... 14
4.2.2. Cereal processing ........................................................................................... 14
4.2.3. Cooperatives ................................................................................................... 15
5. Performance of cereal markets ...................................................................................... 17
5.1. Price analyses ........................................................................................................ 17
5.1.1. Review of available market integration studies ............................................... 17
5.1.2. Seasonality of major cereal prices .................................................................. 18
5.1.3. Variability in grain prices ................................................................................. 20
5.2. Marketing costs and margins .................................................................................. 21
6. Summary and implications ............................................................................................. 24
References ............................................................................................................................ 25
Annex .................................................................................................................................... 28
v
List of Tables
Table 3.1. Number of trucks, telephone subscription, and road network by type in thousands . 6
Table 3.2. Size and distribution of licensed commercial trucks by operator groups, 2006 ........ 9
Table 4.1. Broad structural changes in Ethiopian cereals markets since the 1960s ................ 13
Table 4.2. Processing capacity and regional distribution of flour mills in Ethiopia, 2007–08. .. 15
Table 4.3. Cooperative membership and use of cooperative for cereals sales, 2005 and 2008 ....................................................................................................................... 16
Table 5.1. Summary of cereal market integration studies in Ethiopia ...................................... 18
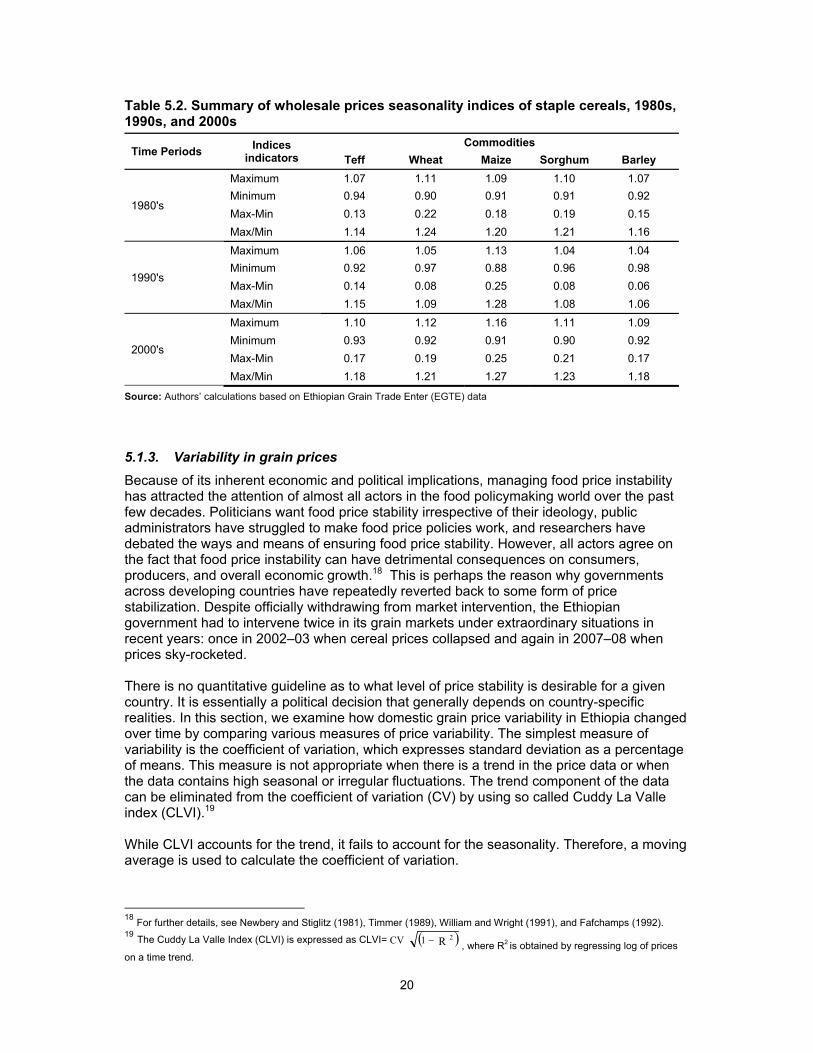
Table 5.2. Summary of wholesale prices seasonality indices of staple cereals, 1980s, 1990s, and 2000s ............................................................................................................... 20
Table 5.3. Cereal price variability, 1983–2008 ......................................................................... 21
Table 5.4. Changes in real costs and margins of grain trade, 1996–2008 .............................. 22
List of Figures
Figure 3.1. Trends in road development in Ethiopia, 1951–2007 .............................................. 7
Figure 3.2. Cellular phone ownership in Ethiopia and its neighbors, 2000–2008. ..................... 8
Figure 4.1. Cereal value chain map involving traditional market channels in Ethiopia ............ 11
Figure 5.1. Price seasonality indices of three major cereals, 1980s, 1990s, and 2000s ......... 19
1
1. Introduction
Cereal production and marketing is the single largest sub-sector within Ethiopia’s agriculture. It dominates in terms of its share in rural employment, agricultural land use, and calorie intake, as well as its contribution to national income. The sub-sector accounts for roughly 60 percent of rural employments, about 73 percent of total cultivated land, more than 40 percent of a typical household’s food expenditure, and more than 60 percent of total caloric intake of a typical household in the country.1 The contribution of cereals to national income is also large: according to available estimates, cereals’ contribution to agricultural value added is 65 percent (Diao et al. 2007), which translates to about 30 percent of GDP.2 Thus, it is no surprise that, despite differing political ideologies, all agricultural production and marketing policies since the 1960s have had a focus on the cereals sub-sector. Since 1991, strategies for both growth and poverty reduction have placed a heavy emphasis on cereal production and marketing. The Agricultural Development Led Industrialization (ADLI) strategy, the Sustainable Development and Poverty Reduction Plan (SDPRP), and the Plan for Accelerated and Sustained Development to End Poverty (PASDEP) all highlight the importance of cereals in Ethiopia’s overall economic development. The Government of Ethiopia (GoE) instituted the Participatory Demonstration and Extension Training System (PADETS), in the mid-1990s with the specific purpose of increasing cereal production through demonstration of seed-fertilizer technology. As part of these strategies, the Government of Ethiopia (GoE) has undertaken substantial market reforms, accelerated investments in road and communication networks, and initiated programs to increase cereal production through large-scale demonstrations of the benefits of modern seeds and greater fertilizer use. The structure of Ethiopian cereal markets has undergone massive changes since the 1960s due to dramatic shifts in government agricultural production and market policies, vast improvements in marketing infrastructure, and major increases in domestic production. This paper documents these experiences. It begins by giving a historical overview of policies that have directly or indirectly affected cereal production and marketing. Section 3 discusses public investments in infrastructure and information. This is followed by the sections that present analysis on market structure and performances, respectively. The paper concludes with a summary of key points and policy implications.
1 These numbers are taken from various CSA publications. 2 This calculation is based on the fact that agriculture accounts for 48 percent of the GDP.
2
2. Evolution of cereal market policies
The structure of Ethiopian cereal markets has undergone dramatic changes throughout the past several decades. To a large extent, these shifts mirror the underlying ideological positions of successive governments, from the feudalistic system of the 1950s and 1960s to the pervasive state interventions under the Derg regime to an extended period of major investments in road and telecommunications infrastructure, accompanied by considerable liberalization of markets, under the Meles government. This section describes these policy shifts, highlighting changes in the roles of the state and in the size and structure of cereal markets over time.3
2.1. The imperial regime (1960–1974)
Ethiopia’s cereal markets under Emperor Haile Selassie in the 1960s were characterized by a high share of marketed cereals in total production, limited government intervention, and very high transport costs because of the minimal road and telecommunications infrastructure. During this period, large landholders and local political and religious authorities leased most of the land cultivated by small farmers . Because renters paid rents to landlords and tributes to the state or church in kind, the marketed “surplus” of cereals is estimated to have been fairly high (25–30 percent of production), even though the production of most farmers was near subsistence levels (Ghose 1985, 136, Table 4). Government interventions in this period centered on the Ethiopian Grain Board (EGB), established in 1950, reformed and renamed as the Ethiopian Grain Council (EGC) in 1960.4 The EGB’s mandate included a wide range of activities, such as export licensing for oilseeds and pulses, quality control, supervision of marketing intelligence, and the regulation of domestic and export purchases and sales. Available studies suggest that it did not live up to expectations for performing all of its mandated activities. The agency was plagued with inefficiencies due to its low capital base and inadequate storage network, and almost exclusively intervened to provide services to feudal landlords, private exporting organizations, and private traders (Lirenso 1987; Gutema 1988). The EGB successfully controlled and set prices of exported grains, oilseeds, and pulses, but it failed to stabilize domestic prices because it did not hold stocks and thus, could not buy and sell significant quantities in domestic markets. To correct these institutional drawbacks, the government established the Ethiopian Grain Council (EGC) in 1960.5 The objectives of the EGC were to hold stocks, stabilize grain prices (particularly in urban areas), and improve production of cereals, oilseeds, and pulses for export. However, the EGC was ultimately ineffective in achieving this wide range of objectives. Furthermore, the EGC concentrated its interventions in a limited number of production regions and urban areas, while neglecting much of the country (particularly remote areas). As a result, Holmberg (1977) argues, the policy interventions did not contribute toward the development of interregional grain trade.
3 See Annex 1.1 for a summary of major government policy measures related to cereal markets from 1950–2007. 4 Ethiopian Grain Board Proclamation No. 113 of 1950. 5 General Notice No. 267 of 1960.
3
2.2. State-controlled markets (1975–1990)
Consistent with its ideology, the socialist government of Ethiopia from 1975–1990 instituted a wide range of controls over all grain production and marketing. These included determination of annual quotas, restrictions on private grain trade and interregional grain movement, determination of days on which the local markets were to be held, and rationing of grain to urban consumers.6 The administration set wholesale prices of cereals for many provincial markets and changed little between 1976 and the late 1980s (Webb and von Braun 1994, 48). Land reforms under the Derg regime, following the coup in 1973, assigned ownership of land to the state but operational control to small holders, who were no longer obligated to pay large rents in kind. When this system failed to generate a sufficient marketed surplus to supply urban consumption needs, the government established the Agricultural Marketing Corporation (AMC) in 1976 to procure grain for public distribution and price stabilization.7 The government gave the agency responsibility for handling almost all aspects of agricultural input and output markets: exports and imports of agricultural products, buying and selling of inputs, and processing and marketing of finished products. In addition, the AMC constructed storage facilities, such as silos, and other structures and machinery. By 1987, the AMC had 104 purchase and sales centers, 630,000 tons of storage capacity in 81 locations in the country, and a fleet of 225 trucks that handled 25–30 percent of its annual transport.8 However, the AMC concentrated on cereal procurement in the major grain producing regions. For example, more than 80 percent of the AMC’s grain supplies came from three regions: Shewa, Gojam, and Arsi (Gutema 1988; Lirenso 1987). There is a large body of literature documenting various negative consequences of these policies on the grain markets’ structure and performance. The delivery quotas badly affected small farmers, as the quota set by the peasants associations often did not take into consideration the capacity constraints and consumption requirements of the poor peasants. Farmers allegedly had to buy from the market to meet the quota requirement. Moreover, the forced quota delivery at a fixed price had other negative impacts on farmers, reducing their production and incomes (Taffesse 1997) 9, promoting the marketing of low-quality produce, increasing farmers’ dependence on local markets, and decreasing regional grain market integration (Franzel et al. 1989) A plethora of government restrictions also hampered trading. While governmental authorities allowed grain traders to operate, they had to sell a significant proportion of their purchases to the AMC at substantially lower prices than open market prices for both purchases from farmers and sales to consumers. Regulations also prevented individual traders from transporting more than 100 kg of grain; this was strongly enforced until the area’s quota had been fulfilled (Franzel et al. 1989). Public grain marketing also hindered spatial arbitrage, adversely affecting the efficiency of the grain trade. Regional governments also considerably impeded interregional grain trade. In some regions, the government completely banned the private sector from participating. Whenever authorities allowed private sector businesses to operate, they were asked to meet several conditions in order to stay in the grain marketing 6 For details, see Franzel et al. 1989; Lirenso 1987; Lemma 1996. 7 Agricultural Marketing Corporation Establishment Proclamation No. 105/1976. 8 In subsequent years, the resources and the extent of activities of the AMC increased. During the period from 1989–1990, the AMC had 8 regional offices, 27 branch offices, 121 purchasing centers or selling centers or both, and 2013 grain collection points (Lirenso 1994). 9 The quotas assigned to each farmer could be adjusted according to a farmers’ level of production, however. Since an increase in production could lead to an increase in the amount required to be sold to the Peasant Association, a profit-maximizing farmer could, in theory, base his production decisions on a weighted average of the quota sales price and the market price, not simply on the market prices as in the case of an infra-marginal quota. Econometric estimates for the 1980s suggest that because of these disincentive effects of the quota system, teff production was reduced by about 4 percent (Taffesse 1997).
4
business. These conditions included meeting licensing requirements, delivering quality grain to the AMC under a quota delivery (accounting for at least 50 percent of traders’ purchases), meeting the quota within a specified time limit, respecting fixed producer prices, not engaging in hoarding, and avoiding the illegal movement of grain (Lirenso 1987). The government enforced these restrictions on the private grain trade through roadblocks. Any trader attempting to move grain prior to meeting the quota delivery and without getting permission from the Grain Purchase Task Force lost all its grain at the roadblock, as well as its trading license. The socialist government started introducing changes in grain marketing policies in 1987 due to pressure from international donors for reforms, internal political pressure, worsening economic conditions, and the ideological and economic policy changes in the former USSR and Eastern European countries (Lirenso 1994; Amha, 1999). The government revamped the AMC in 1987, giving it a new organizational structure and removing its mandate for direct export of grains, import of agricultural products, and purchase and sale of inputs.10 In 1988, the government allowed private permits to move grain as long as traders agreed to sell half of their grain to the AMC at AMC-specified prices (Franzel et al. 1989). In March 1990, the government undertook major grain marketing policy reforms, which included the removal of movement restrictions, the abolition of forced quota delivery, and the elimination of the AMC’s monopoly power. The Derg regime fell soon after.
2.3. Liberalization and rapid growth (1991–2009)
Following the overthrowing of the Derg regime in May 1991, the government launched various economic reform programs, including major cereal market reforms. As part of the reorganization and re-structuring of government parastatals that began in 1992,11 the government reorganized the Agricultural Marketing Corporation (AMC) as a public enterprise and allowed it to operate in the open market in competition with the private sector.12 Also changing the agency’s name to the Ethiopian Grain Trade Enterprise (EGTE), the government gave it the following new mandates: (1) stabilize prices with an objective to encourage production and protect consumers from price shocks, (2) earn foreign exchange through exporting grains to the world market, and (3) maintain a strategic food reserve for disaster response and emergency food security operations. However, the EGTE encountered at least three major problems in the subsequent years. First, there was a constant tension between fulfilling its mandate of price stabilization and that of competitiveness and profitability (Bekele 2002). Second, the EGTE was not effective in stabilizing grain prices due to its limited grain purchases and sales network and shortage of working capital. The closure of branch offices and procurement and sales centers resulted in shrinkage of the EGTE’s grain-marketing network, which consequently reduced public procurement and led to under-utilization of the EGTE’s resources (Lirenso 1994). Finally, the EGTE was often not able to guarantee purchases at pre-announced prices due to logistic and capital constraints, which led to a decline in farmers’ confidence and loss of policy credibility (Rashid and Assefa 2006). A series of proclamations and regulations from 1999–2000 substantially revised the EGTE’s mandates. These proclamations required the EGTE to gradually move away from price stabilization and focus on promoting exports, facilitating Emergency Food Security Reserves, and helping national disaster prevention and preparedness programs. At the same time, the government merged the EGTE with the Ethiopian Oil Seeds and Pulses 10 Legal Notice No. 103 of 1987. 11 Council of Ministers Regulation No. 25/1992 12 Council of Ministers’ Regulation No. 104/1992
5
Export Corporation (EOPEC) in 1999 in order to increase its logistical capability.13 With these reforms, the EGTE’s market shares diminished from about 40 percent in the 1980s to about 3 percent when it almost withdrew from price stabilization in the early 2000s. However, the EGTE could not stay away from price stabilization for long. With increasing adoption of new technology and favorable rainfall, Ethiopia enjoyed two consecutive years of bumper crops in 2000–2001 and 2001–2002. But the blessings of technology and good weather did not translate into improvements in farm households’ well-being. The farm gate price of maize declined by an unprecedented 80 percent in early 2002, making maize farming highly unprofitable—so much that some farmers allegedly did not find it worthwhile to harvest their maize crops. The ratio of input prices to producers’ prices increased from 1.7 in 2000 to about 9.0 in 2002, while fertilizer application declined by 22 percent in the next cropping year14. Although price stabilization was no longer in its mandate, the government directed the EGTE to buy maize in order to boost farmers’ confidence. The EGTE procured 18,000 metric tons of maize, of which 11,000 tons were exported. The situation took a turn for the worse in mid-2002, however. When expected rains did not come in time for the main cropping season (meher), farmers reduced modern input applications; it became evident that cereal production would be significantly lower than the previous year. Production forecasts for maize were revised downward by as much as 52 percent, making both the government and its development partners nervous about a looming food security crisis, with potentially 15 million people facing starvation. Generous donor support, including more than one million ton of food aid, eventually averted the crisis. The EGTE faced quite the opposite challenge in 2005–2008. Despite consecutive years of reported good harvests, prices of major cereals started rising sharply in late 2005, as did overall macro-inflation. Local grain procurement by the WFP and EGTE fell to almost zero, and strategic cereal reserves declined at an unprecedented low level of only 17,000 tons (Rashid and Lemma 2010), posing significant risk of increased vulnerability for poor households. Furthermore, although many rural households had access to the large-scale Productive Safety Net Program (PSNP), urban households lacked access to similar programs. Therefore, rising nominal prices in the main urban centers became a major policy concern, leading the government to implement an urban food rationing program in April 2007. Actual distribution of wheat under this program began in Addis Ababa in June 2007; and by August 2008, 11 other urban centers had been added. Between June 2007 and June 2008, the program distributed about 249,000 tons of wheat at a subsidized rate of 1,800 Ethiopian birr (ETB) (or about US$180) per metric ton, which was 41 percent lower than the wholesale price in June 2007 of $308 per metric ton and 76 percent lower than the wholesale price in June 2008 of $763 per metric ton in the Addis Ababa market.15
13 Council of Ministers Regulations No. 58/1999. 14 These are authors’ estimates based on Agricultural Input Supplies Enterprise (AISE) data. 15 Because of the high price differentials, urban food rationing served as an income transfer program. According to data from an urban household survey administered by the WFP in June and July 2008, about 93 percent of recipient households immediately sold their ration on the open market, either to buy other cereals or to meet other consumption expenditure.
6
3. Public investments in infrastructure and information
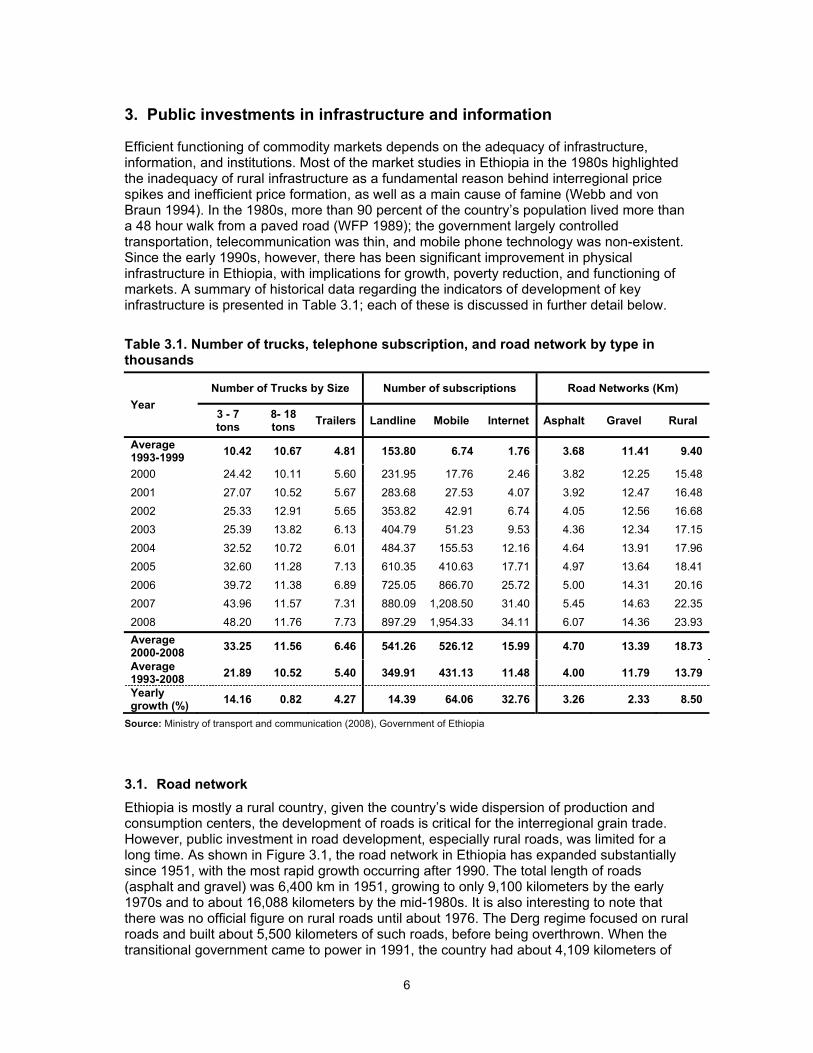
Efficient functioning of commodity markets depends on the adequacy of infrastructure, information, and institutions. Most of the market studies in Ethiopia in the 1980s highlighted the inadequacy of rural infrastructure as a fundamental reason behind interregional price spikes and inefficient price formation, as well as a main cause of famine (Webb and von Braun 1994). In the 1980s, more than 90 percent of the country’s population lived more than a 48 hour walk from a paved road (WFP 1989); the government largely controlled transportation, telecommunication was thin, and mobile phone technology was non-existent. Since the early 1990s, however, there has been significant improvement in physical infrastructure in Ethiopia, with implications for growth, poverty reduction, and functioning of markets. A summary of historical data regarding the indicators of development of key infrastructure is presented in Table 3.1; each of these is discussed in further detail below.
Table 3.1. Number of trucks, telephone subscription, and road network by type in thousands
Year
Number of Trucks by Size Number of subscriptions Road Networks (Km)
3 - 7 tons
8- 18 tons
Trailers Landline Mobile Internet Asphalt Gravel Rural
Average 1993-1999
10.42 10.67 4.81 153.80 6.74 1.76 3.68 11.41 9.40
2000 24.42 10.11 5.60 231.95 17.76 2.46 3.82 12.25 15.48
2001 27.07 10.52 5.67 283.68 27.53 4.07 3.92 12.47 16.48
2002 25.33 12.91 5.65 353.82 42.91 6.74 4.05 12.56 16.68
2003 25.39 13.82 6.13 404.79 51.23 9.53 4.36 12.34 17.15
2004 32.52 10.72 6.01 484.37 155.53 12.16 4.64 13.91 17.96
2005 32.60 11.28 7.13 610.35 410.63 17.71 4.97 13.64 18.41
2006 39.72 11.38 6.89 725.05 866.70 25.72 5.00 14.31 20.16
2007 43.96 11.57 7.31 880.09 1,208.50 31.40 5.45 14.63 22.35
2008 48.20 11.76 7.73 897.29 1,954.33 34.11 6.07 14.36 23.93
Average 2000-2008
33.25 11.56 6.46 541.26 526.12 15.99 4.70 13.39 18.73
Average 1993-2008
21.89 10.52 5.40 349.91 431.13 11.48 4.00 11.79 13.79
Yearly growth (%)
14.16 0.82 4.27 14.39 64.06 32.76 3.26 2.33 8.50
Source: Ministry of transport and communication (2008), Government of Ethiopia
3.1. Road network
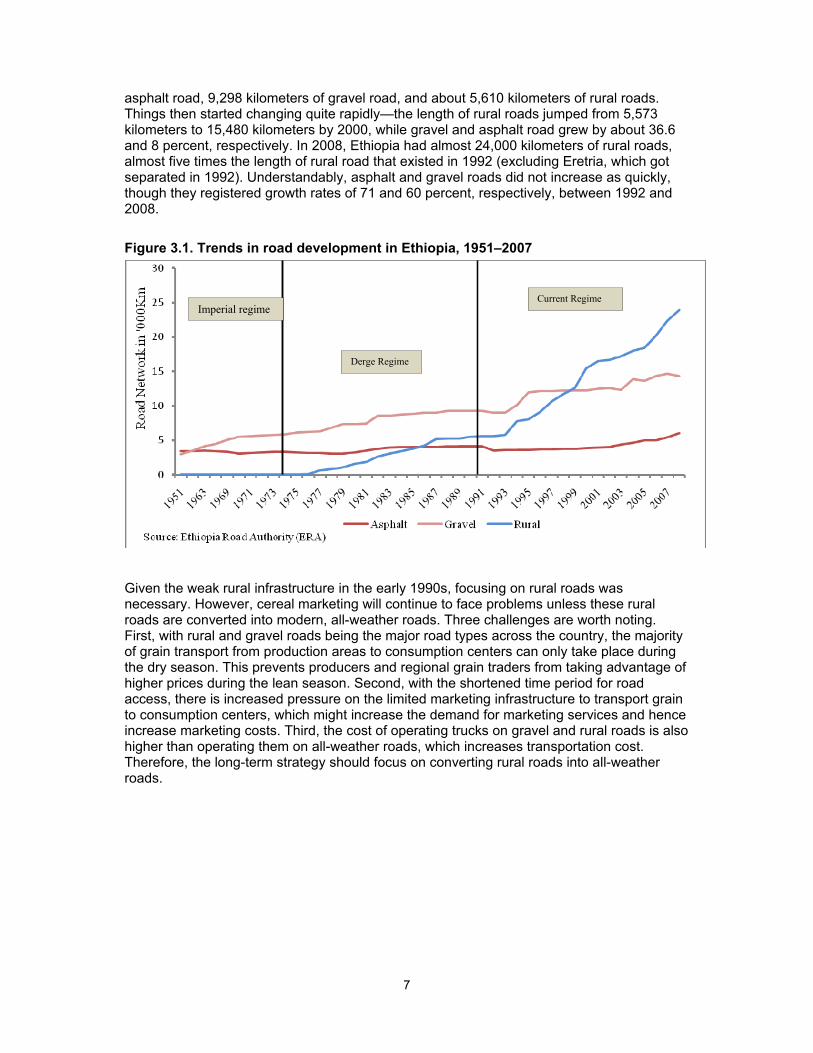
Ethiopia is mostly a rural country, given the country’s wide dispersion of production and consumption centers, the development of roads is critical for the interregional grain trade. However, public investment in road development, especially rural roads, was limited for a long time. As shown in Figure 3.1, the road network in Ethiopia has expanded substantially since 1951, with the most rapid growth occurring after 1990. The total length of roads (asphalt and gravel) was 6,400 km in 1951, growing to only 9,100 kilometers by the early 1970s and to about 16,088 kilometers by the mid-1980s. It is also interesting to note that there was no official figure on rural roads until about 1976. The Derg regime focused on rural roads and built about 5,500 kilometers of such roads, before being overthrown. When the transitional government came to power in 1991, the country had about 4,109 kilometers of
7
asphalt road, 9,298 kilometers of gravel road, and about 5,610 kilometers of rural roads. Things then started changing quite rapidly—the length of rural roads jumped from 5,573 kilometers to 15,480 kilometers by 2000, while gravel and asphalt road grew by about 36.6 and 8 percent, respectively. In 2008, Ethiopia had almost 24,000 kilometers of rural roads, almost five times the length of rural road that existed in 1992 (excluding Eretria, which got separated in 1992). Understandably, asphalt and gravel roads did not increase as quickly, though they registered growth rates of 71 and 60 percent, respectively, between 1992 and 2008.
Figure 3.1. Trends in road development in Ethiopia, 1951–2007
Given the weak rural infrastructure in the early 1990s, focusing on rural roads was necessary. However, cereal marketing will continue to face problems unless these rural roads are converted into modern, all-weather roads. Three challenges are worth noting. First, with rural and gravel roads being the major road types across the country, the majority of grain transport from production areas to consumption centers can only take place during the dry season. This prevents producers and regional grain traders from taking advantage of higher prices during the lean season. Second, with the shortened time period for road access, there is increased pressure on the limited marketing infrastructure to transport grain to consumption centers, which might increase the demand for marketing services and hence increase marketing costs. Third, the cost of operating trucks on gravel and rural roads is also higher than operating them on all-weather roads, which increases transportation cost. Therefore, the long-term strategy should focus on converting rural roads into all-weather roads.
Imperial regime
Derge Regime
Current Regime
8
3.2. Telephone and telecommunication services
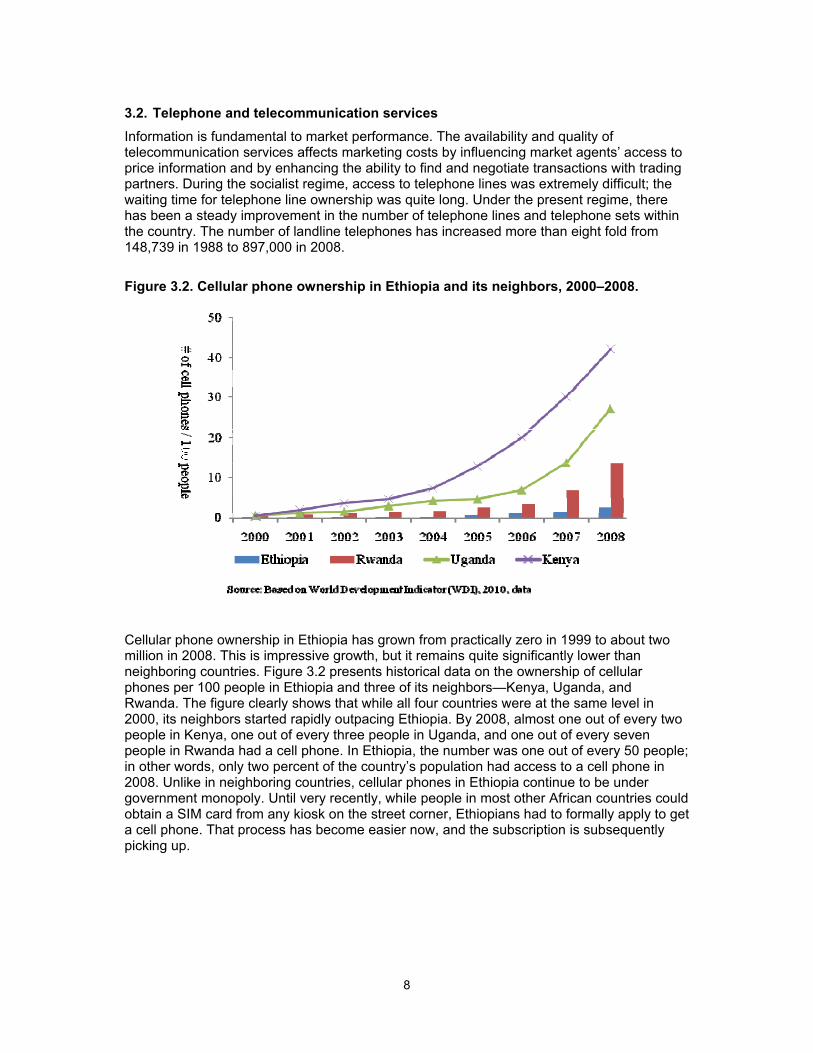
Information is fundamental to market performance. The availability and quality of telecommunication services affects marketing costs by influencing market agents’ access to price information and by enhancing the ability to find and negotiate transactions with trading partners. During the socialist regime, access to telephone lines was extremely difficult; the waiting time for telephone line ownership was quite long. Under the present regime, there has been a steady improvement in the number of telephone lines and telephone sets within the country. The number of landline telephones has increased more than eight fold from 148,739 in 1988 to 897,000 in 2008.
Figure 3.2. Cellular phone ownership in Ethiopia and its neighbors, 2000–2008.
Cellular phone ownership in Ethiopia has grown from practically zero in 1999 to about two million in 2008. This is impressive growth, but it remains quite significantly lower than neighboring countries. Figure 3.2 presents historical data on the ownership of cellular phones per 100 people in Ethiopia and three of its neighbors—Kenya, Uganda, and Rwanda. The figure clearly shows that while all four countries were at the same level in 2000, its neighbors started rapidly outpacing Ethiopia. By 2008, almost one out of every two people in Kenya, one out of every three people in Uganda, and one out of every seven people in Rwanda had a cell phone. In Ethiopia, the number was one out of every 50 people; in other words, only two percent of the country’s population had access to a cell phone in 2008. Unlike in neighboring countries, cellular phones in Ethiopia continue to be under government monopoly. Until very recently, while people in most other African countries could obtain a SIM card from any kiosk on the street corner, Ethiopians had to formally apply to get a cell phone. That process has become easier now, and the subscription is subsequently picking up.
9
3.3. Trucks and transport services
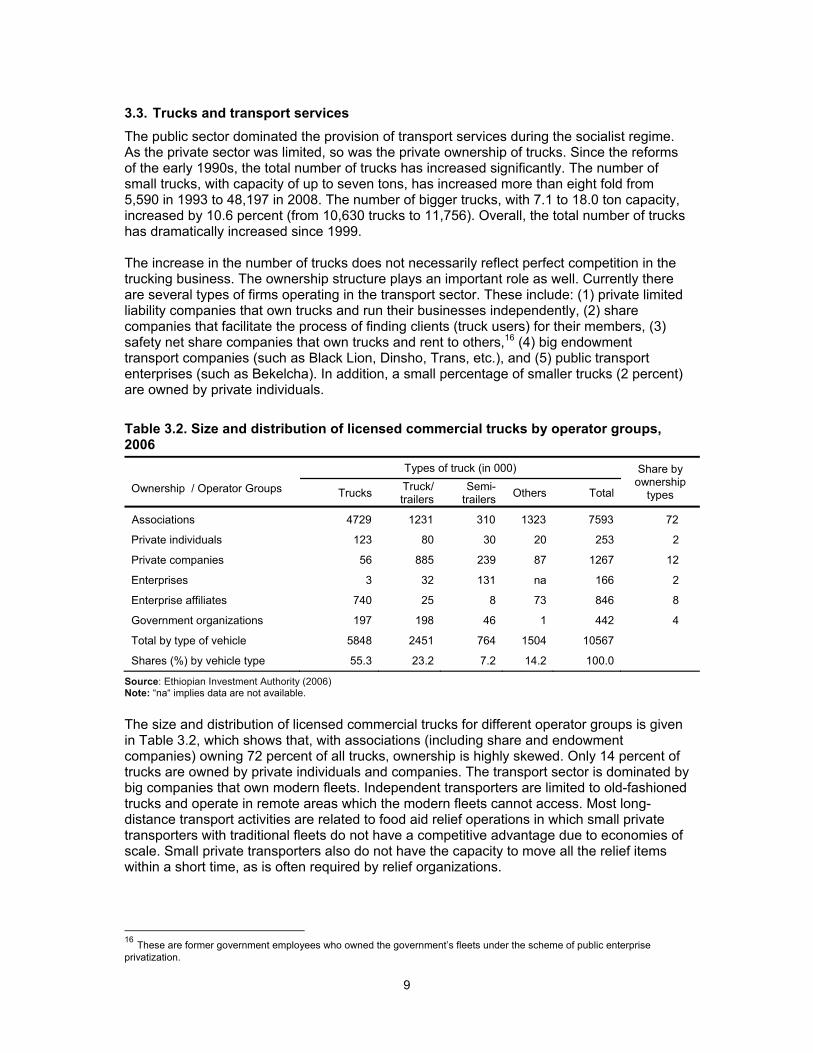
The public sector dominated the provision of transport services during the socialist regime. As the private sector was limited, so was the private ownership of trucks. Since the reforms of the early 1990s, the total number of trucks has increased significantly. The number of small trucks, with capacity of up to seven tons, has increased more than eight fold from 5,590 in 1993 to 48,197 in 2008. The number of bigger trucks, with 7.1 to 18.0 ton capacity, increased by 10.6 percent (from 10,630 trucks to 11,756). Overall, the total number of trucks has dramatically increased since 1999. The increase in the number of trucks does not necessarily reflect perfect competition in the trucking business. The ownership structure plays an important role as well. Currently there are several types of firms operating in the transport sector. These include: (1) private limited liability companies that own trucks and run their businesses independently, (2) share companies that facilitate the process of finding clients (truck users) for their members, (3) safety net share companies that own trucks and rent to others,16 (4) big endowment transport companies (such as Black Lion, Dinsho, Trans, etc.), and (5) public transport enterprises (such as Bekelcha). In addition, a small percentage of smaller trucks (2 percent) are owned by private individuals.
Table 3.2. Size and distribution of licensed commercial trucks by operator groups, 2006
Ownership / Operator Groups
Types of truck (in 000) Share by ownership
types Trucks Truck/ trailers
Semi-trailers
Others Total
Associations 4729 1231 310 1323 7593 72
Private individuals 123 80 30 20 253 2
Private companies 56 885 239 87 1267 12
Enterprises 3 32 131 na 166 2
Enterprise affiliates 740 25 8 73 846 8
Government organizations 197 198 46 1 442 4
Total by type of vehicle 5848 2451 764 1504 10567
Shares (%) by vehicle type 55.3 23.2 7.2 14.2 100.0
Source: Ethiopian Investment Authority (2006) Note: “na“ implies data are not available.
The size and distribution of licensed commercial trucks for different operator groups is given in Table 3.2, which shows that, with associations (including share and endowment companies) owning 72 percent of all trucks, ownership is highly skewed. Only 14 percent of trucks are owned by private individuals and companies. The transport sector is dominated by big companies that own modern fleets. Independent transporters are limited to old-fashioned trucks and operate in remote areas which the modern fleets cannot access. Most long-distance transport activities are related to food aid relief operations in which small private transporters with traditional fleets do not have a competitive advantage due to economies of scale. Small private transporters also do not have the capacity to move all the relief items within a short time, as is often required by relief organizations.
16 These are former government employees who owned the government’s fleets under the scheme of public enterprise privatization.
10
3.4. Marketing and pricing information
Gaining access to market information is important for the efficient operation of the interregional grain trade. The availability of market information and the ability of grain traders to use it efficiently affect the extent to which they can exploit profitable spatial arbitrage opportunities. Likewise, producers also need market information to make their production and marketing decisions, while policymakers need it to make effective policy decisions. Traditionally, grain traders have relied on informal sources of market information, such as friends and neighbors who visited markets, friends or traders in different markets, market visits, etc. Under the socialist regime, the ways in which traders accessed market information did not change. A few government organizations, such as the EGTE and CSA, collect agricultural prices around the country. However, the EGTE prices are collected only for its own internal marketing and administrative decisionmaking. Price information from public sources are not adequately analyzed or communicated to other economic agents. As a result, regional wholesale grain traders rely mostly on brokers in central markets for price information. The Grain Market Research Project (GMRP) in 1996 initiated a system of collection and dissemination of price information through radio broadcast and bulletins. When the project ended in 1998, the data collection continued, but the analysis, radio broadcast, and reporting of the market information continued on a significantly reduced scale or ended. In addition to price information, actors in the grain market need information regarding food aid pledges and arrivals, planned and actual local grain purchases by donor agencies, planned and actual commercial imports and exports of grains, expected production situation (surpluses and shortages), stock release from the food security reserve or intended purchases for the food security reserve, and changes in the demand for grain. Currently, there are no well-coordinated channels through which this information is communicated to various participants. The Ethiopian Commodity Exchange (ECX) may at some point play this role, but as of mid-2009, trade in cereals was too small for the ECX prices to serve as reliable indicators of overall market conditions.
11
4. The structure of cereal markets
Wide regional dispersions in production and consumption in Ethiopia provide the opportunity for the interregional grain trade and re-enforce the importance of well-developed transport and storage for efficient spatial and temporal arbitrage by the marketing agents. This section discusses the organization of cereal markets, with emphasis on the changing composition of market actors and broad changes in the overall structure.
4.1. The marketing chain and the key actors
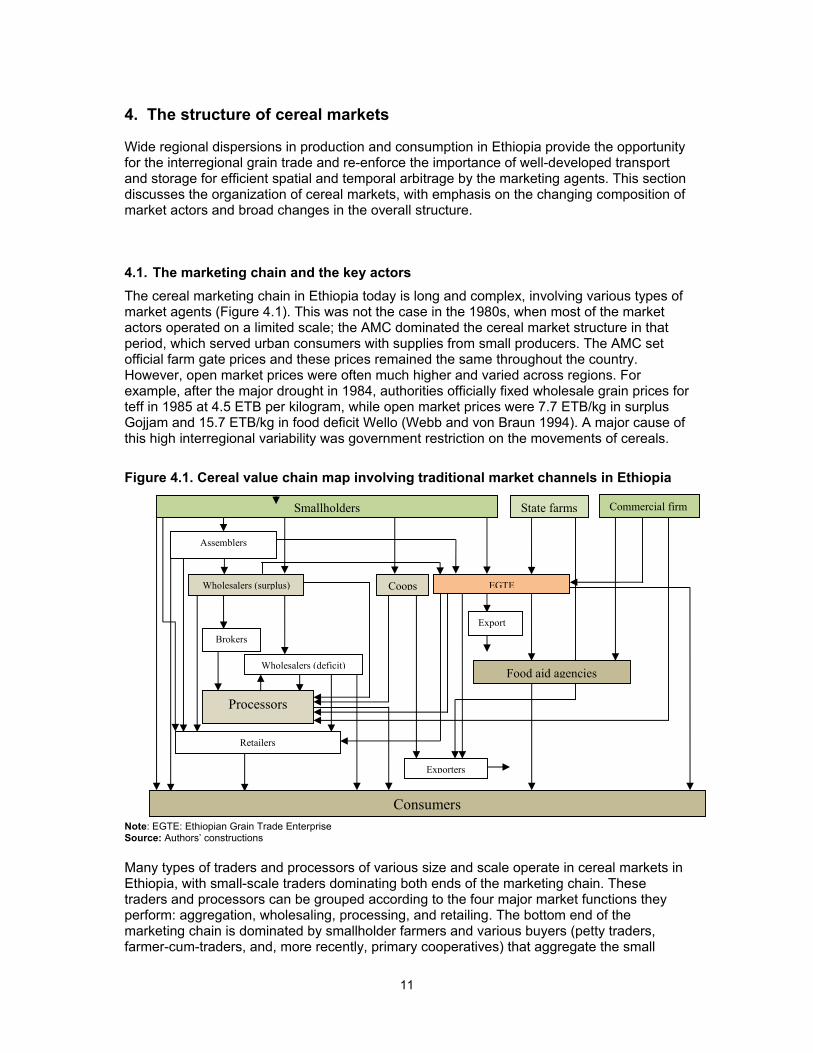
The cereal marketing chain in Ethiopia today is long and complex, involving various types of market agents (Figure 4.1). This was not the case in the 1980s, when most of the market actors operated on a limited scale; the AMC dominated the cereal market structure in that period, which served urban consumers with supplies from small producers. The AMC set official farm gate prices and these prices remained the same throughout the country. However, open market prices were often much higher and varied across regions. For example, after the major drought in 1984, authorities officially fixed wholesale grain prices for teff in 1985 at 4.5 ETB per kilogram, while open market prices were 7.7 ETB/kg in surplus Gojjam and 15.7 ETB/kg in food deficit Wello (Webb and von Braun 1994). A major cause of this high interregional variability was government restriction on the movements of cereals.
Figure 4.1. Cereal value chain map involving traditional market channels in Ethiopia
Note: EGTE: Ethiopian Grain Trade Enterprise Source: Authors’ constructions
Many types of traders and processors of various size and scale operate in cereal markets in Ethiopia, with small-scale traders dominating both ends of the marketing chain. These traders and processors can be grouped according to the four major market functions they perform: aggregation, wholesaling, processing, and retailing. The bottom end of the marketing chain is dominated by smallholder farmers and various buyers (petty traders, farmer-cum-traders, and, more recently, primary cooperatives) that aggregate the small
Processors
Consumers
Retailers
Brokers
Export
Assemblers
Wholesalers (surplus) Coops EGTE
Exporters
Wholesalers (deficit)
Smallholders Commercial firmState farms
Food aid agencies
12
volumes typically sold by individual farmers. The other key actors at the bottom of the marketing chain are state and commercial farmers, owning more than 100 hectares of land, who account for roughly five percent of maize and wheat production. Some of these farmers also have cereal trading businesses that supply flour millers, aid agencies, the EGTE, and wholesalers. At the second tier of the chain are the wholesalers, including the EGTE, who mainly perform the tasks of temporal and spatial arbitrage. Wholesalers are also the main suppliers of raw materials to flour millers and other processors. The final stage of the marketing chain is retailing to the consumers. Brokers (traders who arrange cereal trades but do not buy or sell grain themselves) also play a key role in the coordination of grain buying, selling, and transporting by matching buyers and sellers, inspecting and witnessing transactions, and providing guarantees to enforce contracts. In general, brokers operate at both the production and consumption end of the marketing chain. However, the major activities of brokers are concentrated in Addis Ababa, where the brokers receive grain from the regional wholesalers, inspect its quality, determine its price, and sell it on behalf of their clients. Two major changes in the cereal market structure in recent years have been the introduction of the Ethiopian Commodity Exchange (ECX) and the emergence of aid agencies as important buyers. The launching of the ECX coincided with global price hikes and the balance-of-payment crisis in the country, which led to a rationing of foreign exchange and further escalation of cereal prices in domestic markets. The cereal market was quite volatile and, unlike coffee, the government did not pass any law that would require traders to bring cereals to the EXC trade floor. According to available data, since its inception in April 2008 until February 2009, ECX traded only 950 tons of maize and 90 tons of wheat. Given the size of the cereal markets, this volume of trade is unlikely to have any significant impact. On the other hand, although the government barred donors from buying during the 2007–2009 price hikes, their shares increased quite significantly in the early 2000s. For example, a review of the WFP’s local procurement data indicates that during 2003–2004 to 2006–2007, it procured an average of 394,443 tons of maize and wheat from Ethiopia, of which the EGTE’s share was 20.1 percent. Some large cereal traders have also become regular suppliers to the WFP and other nongovernmental organizations.
4.2. Broad changes in the cereal market structure
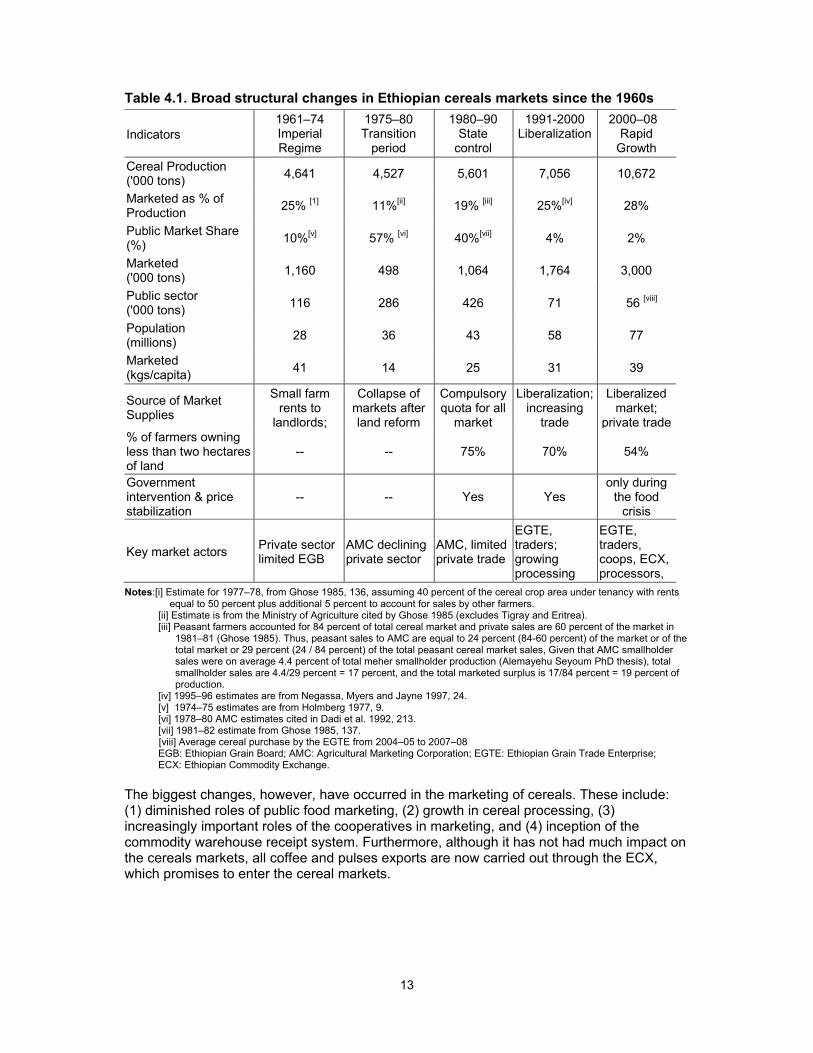
Changes in the cereal market structure may mean changes in: (1) the number of market actors at both the production and marketing level, (2) the scale at which market actors operate, and (3) the functions that the market actors perform. The scope of a systematic assessment of each of these aspects is limited due to unavailability of detailed data. However, broad changes can be traced based on available surveys and secondary data. This is what is attempted in this section. Table 4.1 presents the general structural changes in Ethiopian cereal markets. Since the 1980s, there have been at least three major changes at the production level. First, the proportion of farm households owning less than two hectares of land has dropped from 75 percent in the 1990s to less than 55 percent in 2007–2008. The second major change at the production level has been the emergence of commercial farmers. Although they represent less than one percent of total holdings, this group accounts for five percent of total maize production and much larger share of marketed supplies. Finally, although coverage is not yet extensive, cooperatives are playing an increasingly important role in cereal markets (Bernard and Spielman 2009).
13
Table 4.1. Broad structural changes in Ethiopian cereals markets since the 1960s
Indicators 1961–74 Imperial Regime
1975–80 Transition
period
1980–90 State
control
1991-2000 Liberalization
2000–08 Rapid
Growth
Cereal Production ('000 tons)
4,641 4,527 5,601 7,056 10,672
Marketed as % of Production
25% [1] 11%[ii] 19% [iii] 25%[iv] 28%
Public Market Share (%)
10%[v] 57% [vi] 40%[vii] 4% 2%
Marketed ('000 tons)
1,160 498 1,064 1,764 3,000
Public sector ('000 tons)
116 286 426 71 56 [viii]
Population (millions)
28 36 43 58 77
Marketed (kgs/capita)
41 14 25 31 39
Source of Market Supplies
Small farm rents to
landlords;
Collapse of markets after land reform
Compulsory quota for all
market
Liberalization; increasing
trade
Liberalized market;
private trade % of farmers owning less than two hectares of land
-- -- 75% 70% 54%
Government intervention & price stabilization
-- -- Yes Yes only during
the food crisis
Key market actors Private sector limited EGB
AMC declining private sector
AMC, limited private trade
EGTE, traders; growing processing
EGTE, traders, coops, ECX, processors,
Notes:[i] Estimate for 1977–78, from Ghose 1985, 136, assuming 40 percent of the cereal crop area under tenancy with rents equal to 50 percent plus additional 5 percent to account for sales by other farmers.
[ii] Estimate is from the Ministry of Agriculture cited by Ghose 1985 (excludes Tigray and Eritrea). [iii] Peasant farmers accounted for 84 percent of total cereal market and private sales are 60 percent of the market in
1981–81 (Ghose 1985). Thus, peasant sales to AMC are equal to 24 percent (84-60 percent) of the market or of the total market or 29 percent (24 / 84 percent) of the total peasant cereal market sales, Given that AMC smallholder sales were on average 4.4 percent of total meher smallholder production (Alemayehu Seyoum PhD thesis), total smallholder sales are 4.4/29 percent = 17 percent, and the total marketed surplus is 17/84 percent = 19 percent of production.
[iv] 1995–96 estimates are from Negassa, Myers and Jayne 1997, 24. [v] 1974–75 estimates are from Holmberg 1977, 9. [vi] 1978–80 AMC estimates cited in Dadi et al. 1992, 213. [vii] 1981–82 estimate from Ghose 1985, 137. [viii] Average cereal purchase by the EGTE from 2004–05 to 2007–08 EGB: Ethiopian Grain Board; AMC: Agricultural Marketing Corporation; EGTE: Ethiopian Grain Trade Enterprise; ECX: Ethiopian Commodity Exchange.
The biggest changes, however, have occurred in the marketing of cereals. These include: (1) diminished roles of public food marketing, (2) growth in cereal processing, (3) increasingly important roles of the cooperatives in marketing, and (4) inception of the commodity warehouse receipt system. Furthermore, although it has not had much impact on the cereals markets, all coffee and pulses exports are now carried out through the ECX, which promises to enter the cereal markets.
14
4.2.1. Changing role of public food marketing
As discussed in section 2, cereal markets went through a dramatic change during the Derg regime. The AMC market share increased from a mere 10 percent during 1960–1974 to about 57 percent by the 1980s (Table 4.1). The government market share declined during 1980–1990 to 40 percent; this decline was not due to reduced public interventions, but rather to a decline in production and marketed supplies. The large government presence not only changed the market structures but also—as structure, conduct, performance (SCP) literature postulates—affected the conduct and performance of the cereal markets. Using the data from Table 4.1, some interesting calculations can be done to further elaborate the magnitude of the structural changes and its implications for the private sector. During 1975–1980, average production of major cereals was 4.5 million tons, of which 11 percent was marketed surplus. Given that the government’s share was 57 percent, this implies that the government controlled 285,000 tons of the half a million tons of marketed surplus, leaving the rest for the private sector. A survey performed by the International Food Policy Research Institute (IFPRI) suggests that a smaller assembler at the bottom of the marketing chain dealt in about 100 quintals of cereals. Assuming all marketed surplus passes through these small traders, there were a little more than 21,000 traders of this sort in the 1980s. In the 2000s, cereal production has averaged 10.7 million tons; of this, 28.1 percent, equivalent to 2.95 million tons, was marketed. Given that the EGTE’s share was only 1.87 percent, this implies that the government dealt in only 56,000 tons of cereal and left the rest (about 3.0 million tons) for the private market. Based on IFPRI survey results that a small trader deals in 10 tons of cereals per year, this means that the number of small traders in the 2000s was about 300,000, or about 14 times more the than the number of traders in the 1980s. These statistics not only demonstrate the increase in competition, but also indicate that cereal trading is a major part of livelihood for the rural population.
4.2.2. Cereal processing
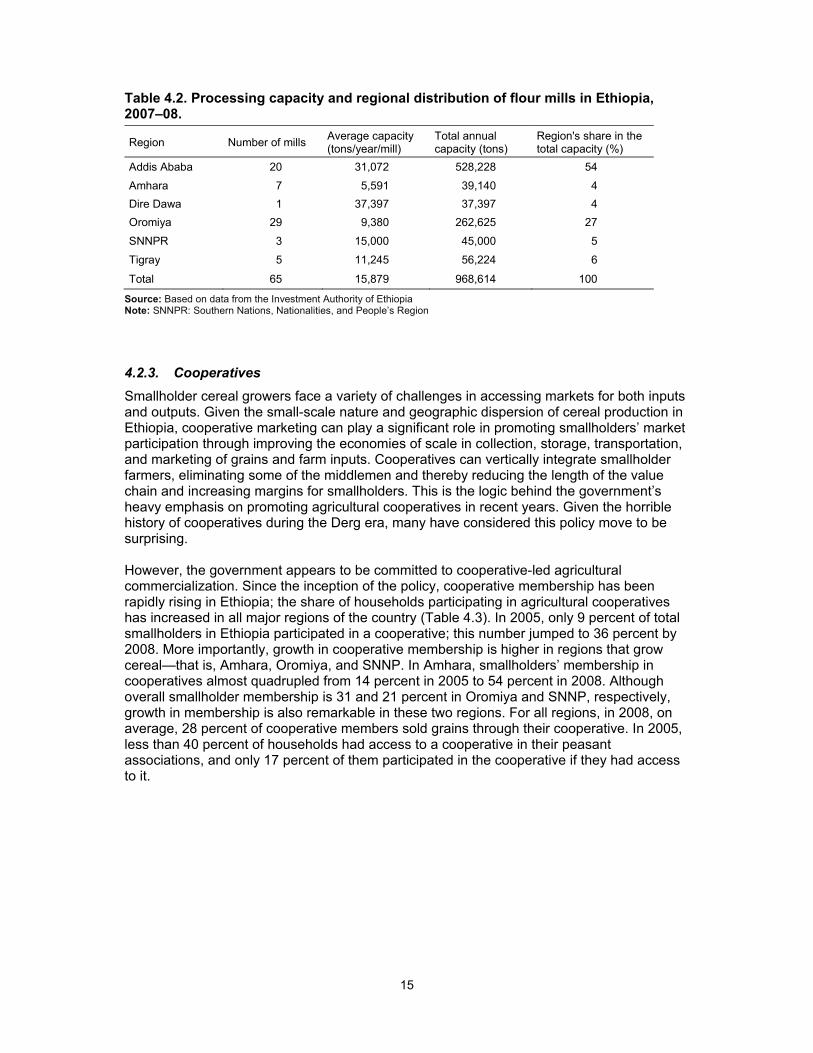
In Ethiopia, a significant proportion of grain produced is consumed on-farm. In extremely remote rural areas of Ethiopia, cereals are still processed manually using mortar and pestle or grinding stones or both. In relatively accessible rural areas, small-scale water mills, diesel flour mills, and small-scale flour mills are used to process cereals. Rural households bring their grain to the mills to be processed and pay the processing fee based on the weight of grain processed. As manual flour processing is time-consuming, access to reasonably priced flour mills in rural areas represents a great labor savings opportunity for farms, particularly during peak agricultural seasons. Given that cereals take up a large share in rural households’ food budgets, and that improved processing can provide cost savings for rural households, the development of processing will not only change the market structure but also has the potential for large welfare gains for many rural households. Fortunately, growth in cereal processing has already begun in the country. Until the early 1990s, the government owned all commercial flour mills. There were no private sector-owned flour mills until the mid-1990s. This started changing rapidly in the early 2000s. In 2008, there were 65 large commercial flour mills in the country with annual processing capacity of 968,000 tons, which is roughly equivalent to about 30 percent of the market surplus in the country (Table 4.2). While the processing sector has shown significant growth in a short period of time, the growth in flour mills appears to be highly concentrated. For example, 76 percent of mills are located in Oromiya and Addis Ababa; these two regions account for more than 80 percent of total processing capacity. This regional concentration might reflect the taste patterns of households where processed foods are preferred. Therefore, it would be useful to investigate how consumer preference has changed to favor commercial flour meals over custom-made flour meals.
15
Table 4.2. Processing capacity and regional distribution of flour mills in Ethiopia, 2007–08.
Region Number of mills Average capacity (tons/year/mill)
Total annual capacity (tons)
Region's share in the total capacity (%)
Addis Ababa 20 31,072 528,228 54
Amhara 7 5,591 39,140 4
Dire Dawa 1 37,397 37,397 4
Oromiya 29 9,380 262,625 27
SNNPR 3 15,000 45,000 5
Tigray 5 11,245 56,224 6
Total 65 15,879 968,614 100
Source: Based on data from the Investment Authority of Ethiopia Note: SNNPR: Southern Nations, Nationalities, and People’s Region
4.2.3. Cooperatives
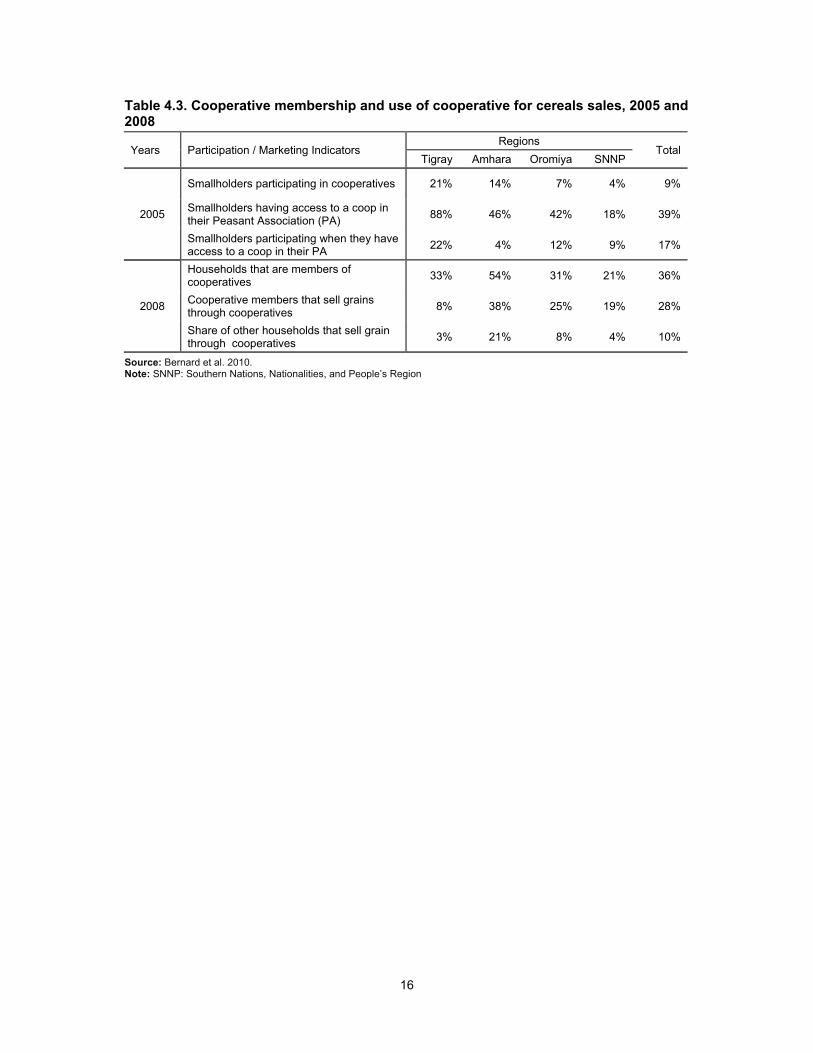
Smallholder cereal growers face a variety of challenges in accessing markets for both inputs and outputs. Given the small-scale nature and geographic dispersion of cereal production in Ethiopia, cooperative marketing can play a significant role in promoting smallholders’ market participation through improving the economies of scale in collection, storage, transportation, and marketing of grains and farm inputs. Cooperatives can vertically integrate smallholder farmers, eliminating some of the middlemen and thereby reducing the length of the value chain and increasing margins for smallholders. This is the logic behind the government’s heavy emphasis on promoting agricultural cooperatives in recent years. Given the horrible history of cooperatives during the Derg era, many have considered this policy move to be surprising. However, the government appears to be committed to cooperative-led agricultural commercialization. Since the inception of the policy, cooperative membership has been rapidly rising in Ethiopia; the share of households participating in agricultural cooperatives has increased in all major regions of the country (Table 4.3). In 2005, only 9 percent of total smallholders in Ethiopia participated in a cooperative; this number jumped to 36 percent by 2008. More importantly, growth in cooperative membership is higher in regions that grow cereal—that is, Amhara, Oromiya, and SNNP. In Amhara, smallholders’ membership in cooperatives almost quadrupled from 14 percent in 2005 to 54 percent in 2008. Although overall smallholder membership is 31 and 21 percent in Oromiya and SNNP, respectively, growth in membership is also remarkable in these two regions. For all regions, in 2008, on average, 28 percent of cooperative members sold grains through their cooperative. In 2005, less than 40 percent of households had access to a cooperative in their peasant associations, and only 17 percent of them participated in the cooperative if they had access to it.
16
Table 4.3. Cooperative membership and use of cooperative for cereals sales, 2005 and 2008
Years Participation / Marketing Indicators Regions
Total Tigray Amhara Oromiya SNNP
2005
Smallholders participating in cooperatives 21% 14% 7% 4% 9%
Smallholders having access to a coop in their Peasant Association (PA)
88% 46% 42% 18% 39%
Smallholders participating when they have access to a coop in their PA
22% 4% 12% 9% 17%
2008
Households that are members of cooperatives
33% 54% 31% 21% 36%
Cooperative members that sell grains through cooperatives
8% 38% 25% 19% 28%
Share of other households that sell grain through cooperatives
3% 21% 8% 4% 10%
Source: Bernard et al. 2010. Note: SNNP: Southern Nations, Nationalities, and People’s Region
17
5. Performance of cereal markets
Assessment of market performance requires analyses of prices (over time and space) and the process that influences price formation. This follows from the simple fact that the price of a commodity is the outcome of an exchange process, which we call the market. In the absence of public interventions, three important determinants of an efficient exchange process (market fundamentals) are infrastructure, institutions, and information.17 If there are inadequacies/incompleteness in these fundamentals, it will be reflected in the prices. For instance, if the markets are not connected with adequate infrastructure and efficient information flow, price shocks in one market location may not get transmitted to the other, which can be detected through spatial integration of market locations. Similarly, if farmers do not have access to credit or risk-mitigating institutions, they are compelled to sell immediately after harvest when prices are low. The presence of such institutional incompleteness can be detected though analysis of price seasonality. However, price analysis over time and space does not provide direct information about market fundamentals and hence misses some critical aspects of market performance. For example, prices between two locations can be integrated even when transaction costs are high due to high search costs (finding buyers and sellers) or high transport costs due to poor infrastructure. This can be detected by estimating the costs and margins of trade between two locations. Thus, we present analyses of both prices, and costs and margins in this section.
5.1. Price analyses
5.1.1. Review of available market integration studies
Under the assumption of competitive markets, spatial market equilibrium requires that the price differentials between two market locations is equal to transfer costs, including the opportunity costs of capital, labor, and risk. Empirical analyses of market integration can explain the extent and degree of market integration across various market locations. However, when the market is controlled by the government, as was the case during the socialist regime, such analysis is essentially meaningless. This is the reason why policy analysts never embarked on such analyses in Ethiopia when the AMC controlled grain markets. With the advent of structural adjustment programs and the dismantling of marketing boards, policy analysts had an increased interest in market integration analyses; as such, analyses provided evidence of the evolution of markets following liberalization. Growing interest in the topic led to substantial improvements in the methods of analyzing market integration as well, with more recent applications relying on variants of Parity Bound Models (PBM) and multivariate co-integration methods. However, neither method is free from criticism. For instance, PBMs are criticized as bi-variate analyses of variables that emerge from a multi-variate context (Gonzalez-Rivera and Helfand 2001; Fackler 2004), as sensitive to underlying distributional assumptions (Fackler 1996; Barrett and Li 2002), and for assuming
17 Two examples can help make the point clear. First, the results of the “getting-prices-right” campaign of the 1980s, which involved dismantling marketing boards and allowing market forces to determine prices, varied widely across countries. Whereas liberalization led to higher price variability (Barrett 1997) and subsequent policy reversals in some African countries (Jayne et al. 2002), it was remarkably successful in Vietnam (Goletti and Minot 1998)—arguably because this country had superior infrastructure and institutions. Second, famines and acute food insecurity have historically been localized phenomena; in fact, many are named after a specific region of a country. The classic example is the Bengal Famine of 1943, which tragically demonstrated how a small decline in food production can trigger a massive food security crisis in the absence of infrastructure, information, and risk-mitigating institutions (Drèze and Sen 1989).
18
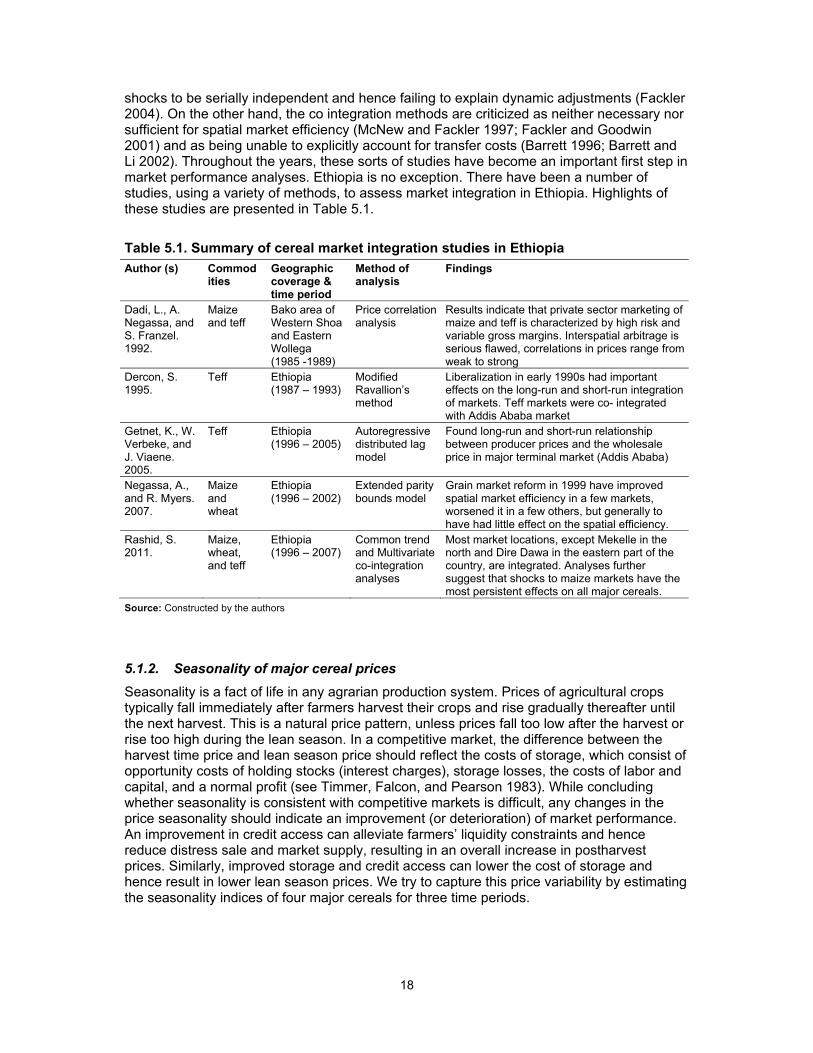
shocks to be serially independent and hence failing to explain dynamic adjustments (Fackler 2004). On the other hand, the co integration methods are criticized as neither necessary nor sufficient for spatial market efficiency (McNew and Fackler 1997; Fackler and Goodwin 2001) and as being unable to explicitly account for transfer costs (Barrett 1996; Barrett and Li 2002). Throughout the years, these sorts of studies have become an important first step in market performance analyses. Ethiopia is no exception. There have been a number of studies, using a variety of methods, to assess market integration in Ethiopia. Highlights of these studies are presented in Table 5.1.
Table 5.1. Summary of cereal market integration studies in Ethiopia
Author (s) Commodities
Geographic coverage & time period
Method of analysis
Findings
Dadi, L., A. Negassa, and S. Franzel. 1992.
Maize and teff
Bako area of Western Shoa and Eastern Wollega (1985 -1989)
Price correlation analysis
Results indicate that private sector marketing of maize and teff is characterized by high risk and variable gross margins. Interspatial arbitrage is serious flawed, correlations in prices range from weak to strong
Dercon, S. 1995.
Teff Ethiopia (1987 – 1993)
Modified Ravallion’s method
Liberalization in early 1990s had important effects on the long-run and short-run integration of markets. Teff markets were co- integrated with Addis Ababa market
Getnet, K., W. Verbeke, and J. Viaene. 2005.
Teff Ethiopia (1996 – 2005)
Autoregressive distributed lag model
Found long-run and short-run relationship between producer prices and the wholesale price in major terminal market (Addis Ababa)
Negassa, A., and R. Myers. 2007.
Maize and wheat
Ethiopia (1996 – 2002)
Extended parity bounds model
Grain market reform in 1999 have improved spatial market efficiency in a few markets, worsened it in a few others, but generally to have had little effect on the spatial efficiency.
Rashid, S. 2011.
Maize, wheat, and teff
Ethiopia (1996 – 2007)
Common trend and Multivariate co-integration analyses
Most market locations, except Mekelle in the north and Dire Dawa in the eastern part of the country, are integrated. Analyses further suggest that shocks to maize markets have the most persistent effects on all major cereals.
Source: Constructed by the authors
5.1.2. Seasonality of major cereal prices
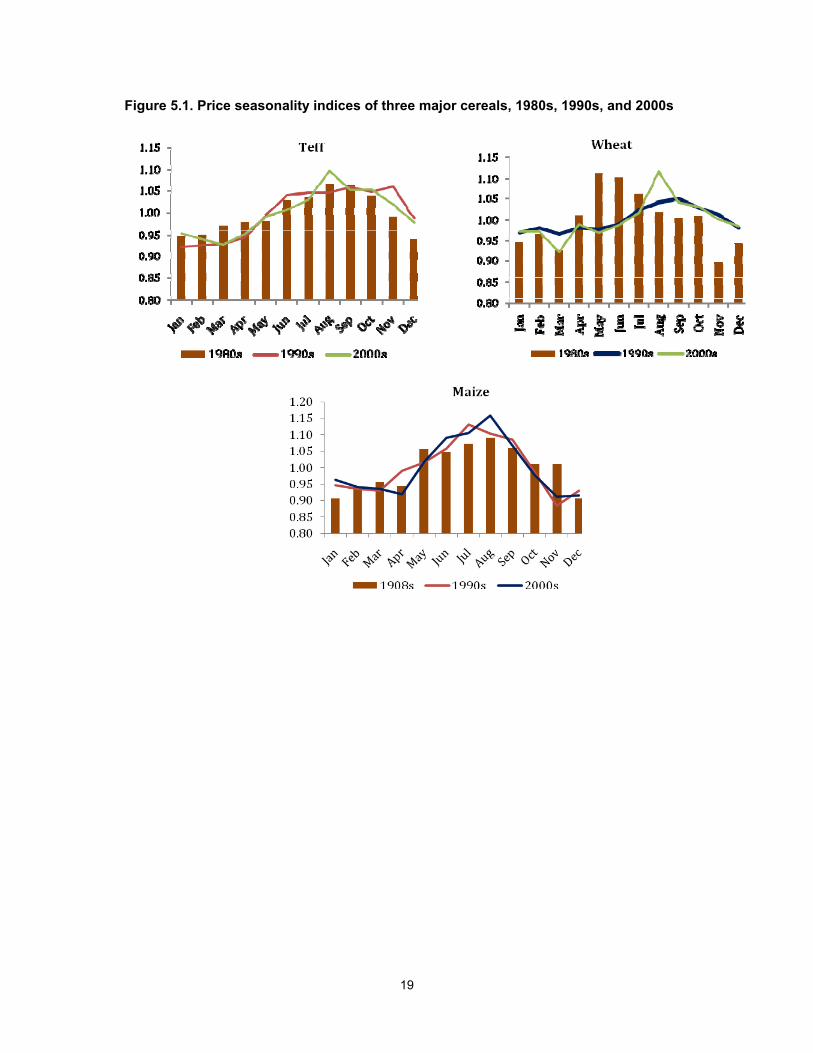
Seasonality is a fact of life in any agrarian production system. Prices of agricultural crops typically fall immediately after farmers harvest their crops and rise gradually thereafter until the next harvest. This is a natural price pattern, unless prices fall too low after the harvest or rise too high during the lean season. In a competitive market, the difference between the harvest time price and lean season price should reflect the costs of storage, which consist of opportunity costs of holding stocks (interest charges), storage losses, the costs of labor and capital, and a normal profit (see Timmer, Falcon, and Pearson 1983). While concluding whether seasonality is consistent with competitive markets is difficult, any changes in the price seasonality should indicate an improvement (or deterioration) of market performance. An improvement in credit access can alleviate farmers’ liquidity constraints and hence reduce distress sale and market supply, resulting in an overall increase in postharvest prices. Similarly, improved storage and credit access can lower the cost of storage and hence result in lower lean season prices. We try to capture this price variability by estimating the seasonality indices of four major cereals for three time periods.
19
Figure 5.1. Price seasonality indices of three major cereals, 1980s, 1990s, and 2000s
The results for teff, maize, and wheat are presented in Figure 5.1. Note that the seasonality of maize and teff are consistent with the cropping season in the country, falling after the harvest and gradually rising thereafter. However, although seasonality of the wheat price is consistent with that of maize and teff for the 1990s and 2000s, it shows an unusual pattern in the 1980s. Unlike other periods, prices in the 1980s rose during the postharvest season (from March onward) and fell during the lean season. This might reflect the timing of food aid distribution and the low level of wheat production in the country. The other important issue to investigate is whether or not there has been a change in seasonality over time. As discussed earlier, changes in seasonality would imply either (1) a change in the mean value (such as lower distress sales and hence higher postharvest prices) or (2) a change in the variance of the indices (such as reduced difference between the lean and peak season indices). These are tested using non-parametric tests for equality of variance and means across three time periods. The hypotheses that means and variance or seasonality indices remained the same could not be rejected at a conventional level of significance, implying that there has been no statistically significant change in the seasonality of major cereal prices. This is also evident in Table 5.2, which shows minimum and maximum indices and the ratio between the two.
20
Table 5.2. Summary of wholesale prices seasonality indices of staple cereals, 1980s, 1990s, and 2000s
Time Periods Indices
indicators Commodities
Teff Wheat Maize Sorghum Barley
1980's
Maximum 1.07 1.11 1.09 1.10 1.07
Minimum 0.94 0.90 0.91 0.91 0.92
Max-Min 0.13 0.22 0.18 0.19 0.15
Max/Min 1.14 1.24 1.20 1.21 1.16
1990's
Maximum 1.06 1.05 1.13 1.04 1.04
Minimum 0.92 0.97 0.88 0.96 0.98
Max-Min 0.14 0.08 0.25 0.08 0.06
Max/Min 1.15 1.09 1.28 1.08 1.06
2000's
Maximum 1.10 1.12 1.16 1.11 1.09
Minimum 0.93 0.92 0.91 0.90 0.92
Max-Min 0.17 0.19 0.25 0.21 0.17
Max/Min 1.18 1.21 1.27 1.23 1.18
Source: Authors’ calculations based on Ethiopian Grain Trade Enter (EGTE) data
5.1.3. Variability in grain prices
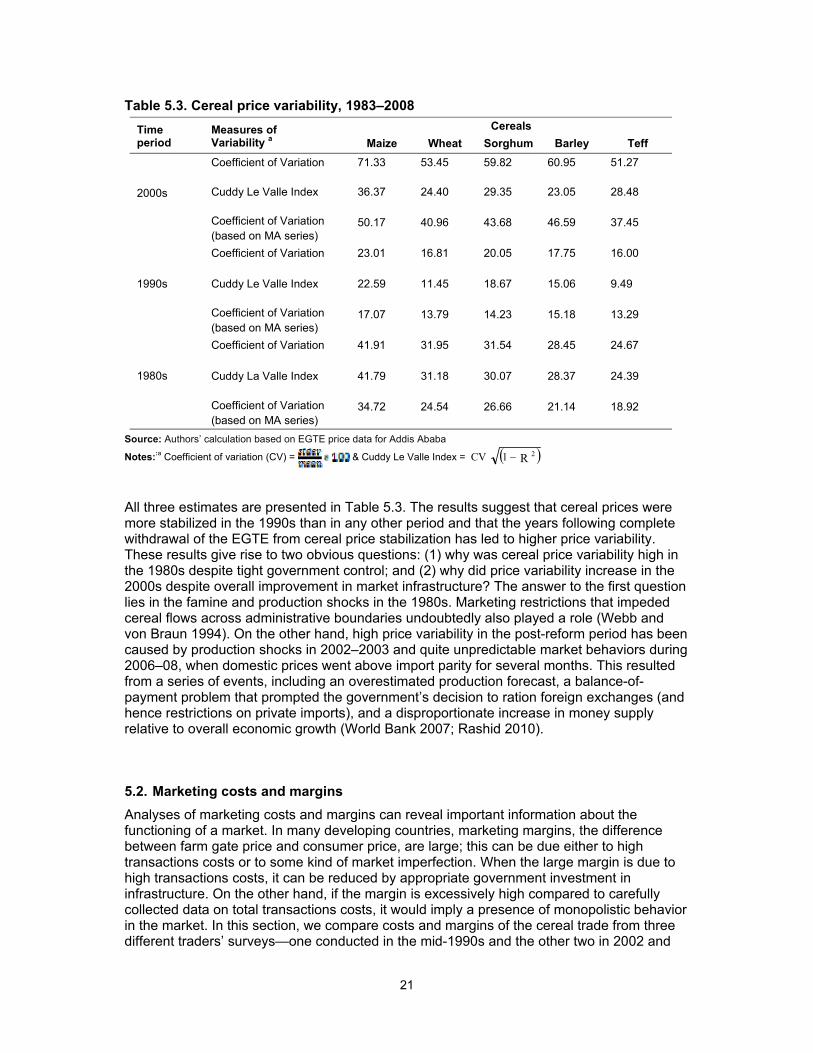
Because of its inherent economic and political implications, managing food price instability has attracted the attention of almost all actors in the food policymaking world over the past few decades. Politicians want food price stability irrespective of their ideology, public administrators have struggled to make food price policies work, and researchers have debated the ways and means of ensuring food price stability. However, all actors agree on the fact that food price instability can have detrimental consequences on consumers, producers, and overall economic growth.18 This is perhaps the reason why governments across developing countries have repeatedly reverted back to some form of price stabilization. Despite officially withdrawing from market intervention, the Ethiopian government had to intervene twice in its grain markets under extraordinary situations in recent years: once in 2002–03 when cereal prices collapsed and again in 2007–08 when prices sky-rocketed. There is no quantitative guideline as to what level of price stability is desirable for a given country. It is essentially a political decision that generally depends on country-specific realities. In this section, we examine how domestic grain price variability in Ethiopia changed over time by comparing various measures of price variability. The simplest measure of variability is the coefficient of variation, which expresses standard deviation as a percentage of means. This measure is not appropriate when there is a trend in the price data or when the data contains high seasonal or irregular fluctuations. The trend component of the data can be eliminated from the coefficient of variation (CV) by using so called Cuddy La Valle index (CLVI).19 While CLVI accounts for the trend, it fails to account for the seasonality. Therefore, a moving average is used to calculate the coefficient of variation.
18 For further details, see Newbery and Stiglitz (1981), Timmer (1989), William and Wright (1991), and Fafchamps (1992). 19 The Cuddy La Valle Index (CLVI) is expressed as CLVI= R 21CV
, where R2 is obtained by regressing log of prices on a time trend.
21
Table 5.3. Cereal price variability, 1983–2008
Time period
Measures of Variability a
Cereals
Maize Wheat Sorghum Barley Teff
2000s
Coefficient of Variation 71.33 53.45 59.82 60.95 51.27
Cuddy Le Valle Index 36.37 24.40 29.35 23.05 28.48
Coefficient of Variation (based on MA series)
50.17 40.96 43.68 46.59 37.45
1990s
Coefficient of Variation 23.01 16.81 20.05 17.75 16.00
Cuddy Le Valle Index 22.59 11.45 18.67 15.06 9.49
Coefficient of Variation (based on MA series)
17.07 13.79 14.23 15.18 13.29
1980s
Coefficient of Variation 41.91 31.95 31.54 28.45 24.67
Cuddy La Valle Index 41.79 31.18 30.07 28.37 24.39
Coefficient of Variation (based on MA series)
34.72 24.54 26.66 21.14 18.92
Source: Authors’ calculation based on EGTE price data for Addis Ababa
Notes::a Coefficient of variation (CV) = & Cuddy Le Valle Index = R 21CV
All three estimates are presented in Table 5.3. The results suggest that cereal prices were more stabilized in the 1990s than in any other period and that the years following complete withdrawal of the EGTE from cereal price stabilization has led to higher price variability. These results give rise to two obvious questions: (1) why was cereal price variability high in the 1980s despite tight government control; and (2) why did price variability increase in the 2000s despite overall improvement in market infrastructure? The answer to the first question lies in the famine and production shocks in the 1980s. Marketing restrictions that impeded cereal flows across administrative boundaries undoubtedly also played a role (Webb and von Braun 1994). On the other hand, high price variability in the post-reform period has been caused by production shocks in 2002–2003 and quite unpredictable market behaviors during 2006–08, when domestic prices went above import parity for several months. This resulted from a series of events, including an overestimated production forecast, a balance-of-payment problem that prompted the government’s decision to ration foreign exchanges (and hence restrictions on private imports), and a disproportionate increase in money supply relative to overall economic growth (World Bank 2007; Rashid 2010).
5.2. Marketing costs and margins
Analyses of marketing costs and margins can reveal important information about the functioning of a market. In many developing countries, marketing margins, the difference between farm gate price and consumer price, are large; this can be due either to high transactions costs or to some kind of market imperfection. When the large margin is due to high transactions costs, it can be reduced by appropriate government investment in infrastructure. On the other hand, if the margin is excessively high compared to carefully collected data on total transactions costs, it would imply a presence of monopolistic behavior in the market. In this section, we compare costs and margins of the cereal trade from three different traders’ surveys—one conducted in the mid-1990s and the other two in 2002 and
22
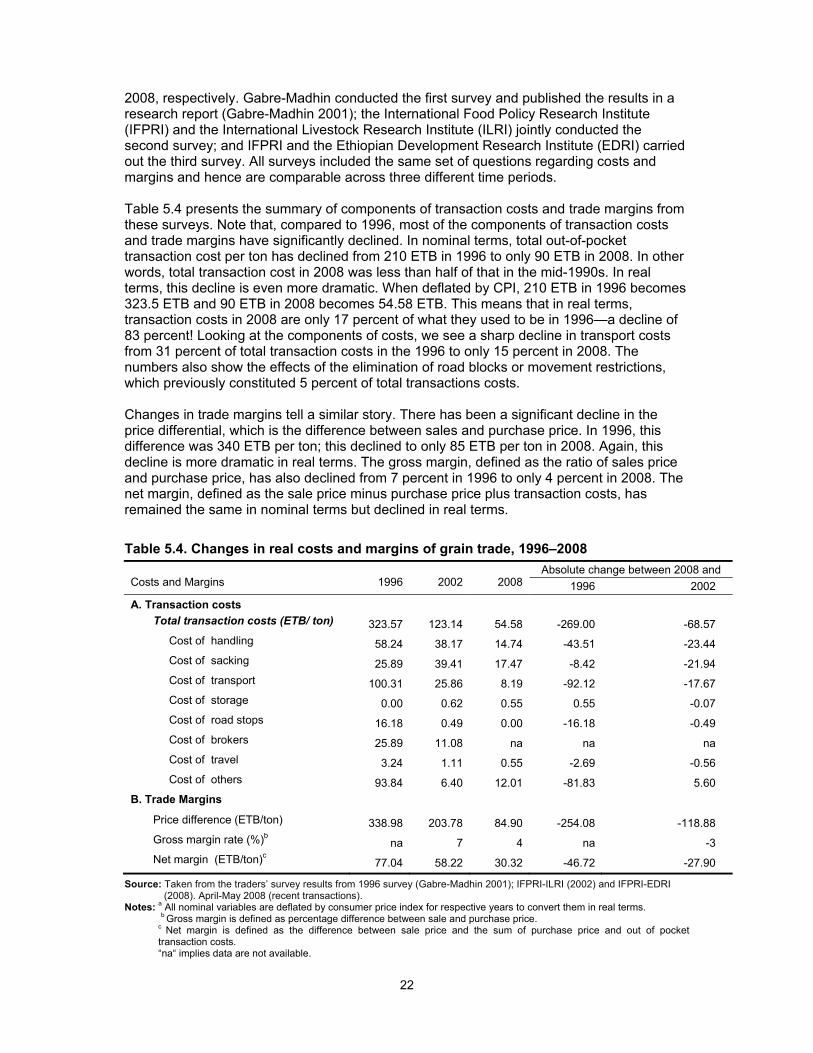
2008, respectively. Gabre-Madhin conducted the first survey and published the results in a research report (Gabre-Madhin 2001); the International Food Policy Research Institute (IFPRI) and the International Livestock Research Institute (ILRI) jointly conducted the second survey; and IFPRI and the Ethiopian Development Research Institute (EDRI) carried out the third survey. All surveys included the same set of questions regarding costs and margins and hence are comparable across three different time periods. Table 5.4 presents the summary of components of transaction costs and trade margins from these surveys. Note that, compared to 1996, most of the components of transaction costs and trade margins have significantly declined. In nominal terms, total out-of-pocket transaction cost per ton has declined from 210 ETB in 1996 to only 90 ETB in 2008. In other words, total transaction cost in 2008 was less than half of that in the mid-1990s. In real terms, this decline is even more dramatic. When deflated by CPI, 210 ETB in 1996 becomes 323.5 ETB and 90 ETB in 2008 becomes 54.58 ETB. This means that in real terms, transaction costs in 2008 are only 17 percent of what they used to be in 1996—a decline of 83 percent! Looking at the components of costs, we see a sharp decline in transport costs from 31 percent of total transaction costs in the 1996 to only 15 percent in 2008. The numbers also show the effects of the elimination of road blocks or movement restrictions, which previously constituted 5 percent of total transactions costs. Changes in trade margins tell a similar story. There has been a significant decline in the price differential, which is the difference between sales and purchase price. In 1996, this difference was 340 ETB per ton; this declined to only 85 ETB per ton in 2008. Again, this decline is more dramatic in real terms. The gross margin, defined as the ratio of sales price and purchase price, has also declined from 7 percent in 1996 to only 4 percent in 2008. The net margin, defined as the sale price minus purchase price plus transaction costs, has remained the same in nominal terms but declined in real terms.
Table 5.4. Changes in real costs and margins of grain trade, 1996–2008
Costs and Margins 1996 2002 2008 Absolute change between 2008 and
1996 2002
A. Transaction costs
Total transaction costs (ETB/ ton) 323.57 123.14 54.58 -269.00 -68.57
Cost of handling 58.24 38.17 14.74 -43.51 -23.44
Cost of sacking 25.89 39.41 17.47 -8.42 -21.94
Cost of transport 100.31 25.86 8.19 -92.12 -17.67
Cost of storage 0.00 0.62 0.55 0.55 -0.07
Cost of road stops 16.18 0.49 0.00 -16.18 -0.49
Cost of brokers 25.89 11.08 na na na
Cost of travel 3.24 1.11 0.55 -2.69 -0.56
Cost of others 93.84 6.40 12.01 -81.83 5.60
B. Trade Margins
Price difference (ETB/ton) 338.98 203.78 84.90 -254.08 -118.88
Gross margin rate (%)b na 7 4 na -3
Net margin (ETB/ton)c 77.04 58.22 30.32 -46.72 -27.90
Source: Taken from the traders’ survey results from 1996 survey (Gabre-Madhin 2001); IFPRI-ILRI (2002) and IFPRI-EDRI (2008). April-May 2008 (recent transactions).
Notes: a All nominal variables are deflated by consumer price index for respective years to convert them in real terms. b Gross margin is defined as percentage difference between sale and purchase price. c Net margin is defined as the difference between sale price and the sum of purchase price and out of pocket transaction costs. “na“ implies data are not available.
23
The impacts of these changes on grain prices are substantial. To demonstrate, consider the share of transaction costs in maize prices. In 1996, wholesale price of maize was 750 ETB per ton and the transaction cost was 210 ETB or 28.0 percent of the price. In 2008, the wholesale price of maize was 4,170 ETB per ton, while the transaction cost was 90 ETB or about 2.2 percent. Now, if the transaction costs had remained at the 1996 level, prices would have been more than 25 percent higher. In other words, wholesale price of maize would have been 5,213 ETB per ton, and market conditions would have been far worse than what actually happened in 2009. Thus, one can conclude from these numbers that improved infrastructure has resulted in substantial improvements in market efficiency.
24
6. Summary and implications
Cereal production and marketing plays a vital role in Ethiopia’s economy. Major changes in the ideology of the Ethiopian government have contributed to several key shifts in Ethiopian cereal markets and policy structure. The Imperial regime under Emperor Haile Selassie was characterized by limited government interventions and minimal rural infrastructure. The state-controlled markets under the Derg regime introduced a period of significant government involvement, setting prices through the Agricultural Marketing Corporation. The recent period has been characterized by a series of reforms and investments in improving market fundamentals, which have triggered increasing competition in the country’s cereal market. Since the early 1990s, the government has gradually withdrawn from the market by limiting the roles and responsibilities of the Ethiopian Grain Trade Enterprise (EGTE), the national food logistics agency. These policy reforms have resulted in major changes in the structure of Ethiopian cereal markets, including an increase in the number of all types of market actors, the emergence of cooperatives in both production and marketing, and growth of the grain processing sector. However, the EGTE has continued ad hoc market interventions in recent years, including domestic procurement in 2003 and international procurement and domestic distribution in 2007–2008. The paper argues that, in order to avoid market actors’ loss of policy credibility, it is important to make EGTE interventions rule-based, transparent, and predictable. Great strides have been made in terms of improving market fundamentals such as roads, telecommunications, and market institutions (including commodity exchanges and warehouse receipts systems) in the past 10 years. These improvements have contributed to reducing transaction costs and improving market efficiency. However, this paper argues that two issues need further policy attention. First, Ethiopia still lags far behind its neighbors in terms of cellular phone ownership. Only 2 percent of people in Ethiopia owned a cell phone in 2008, compared with more than 40 percent in Kenya and more than 30 percent in Uganda. This is quite surprising given that all three countries were at the same level of cell phone ownership only about eight years ago. Second, while there was much hope and optimism during its inception and launch, the ECX has not lived up to expectations in terms of promoting cereal market development. In fact, given the size of the country’s cereal markets, the cereal trade volume at ECX has to increase many-fold for it to influence price and to pass on other anticipated benefits to the market actors. Performance of the market has greatly improved, particularly in terms of increased market integration and dramatically lower costs and margins of trade. However, price variability remained high, especially during the drought in 2003 and just before and after the cereal price spike in 2007 and 2008. Almost all existing studies find cereal markets to be spatially integrated, suggesting no abnormalities in price transmission. Furthermore, contrary to common perception that the seasonality of grain markets are changing, this study finds that seasonal variations in prices tend to follow the country’s production cycles. Price stability has varied in both the 1980s and in the 2000s, most likely stemming from famine conditions in the 1980s and the recent food price crisis. Overall, there is substantial evidence that cereal markets in Ethiopia have matured over the years. Continued progress is not automatic, however, and will depend substantially on government policy and investments in market infrastructure.
25
References
Amha, W. 1999. Maize Marketing in Ethiopia: Liberalization and Price Integration Issues. Ethiopian Journal of Development Research 21 (1): 79-120.
Barrett, C. B. 1996. Market Analysis Methods: Are Our Enriched Toolkits Well Suited to Enlivened Markets? American Journal of Agricultural Economics 78: 825-829.
Barrett, C. B., and J.R. Li. 2002. Distinguishing Between Equilibrium and Integration in Spatial Price Analysis. American Journal of Agricultural Economics 84: 292-307.
Barrett, C. B. 1997. Food marketing liberalization and trader entry: Evidence from Madagascar. World Development 25 (5): 763-777.
Bekele, G. 2002. The Role of the Ethiopian Grain Trade Enterprise in Price Policy. In Agriculture Technology Diffusion and Price Policy in Addis Ababa, ed. T. Bonger, E. Gabre-Madhin, and S. Babu. Proceedings of a Policy Forum in Addis Ababa: 2020 Vision Network for East Africa Report 1. Addis Ababa: Ethiopian Development Research Institute and Washington, D.C.: International Food Policy Research Institute.
Bernard, T., and D.J. Spielman. 2009. Reaching the Rural Poor through Producer Organizations? A study of Agricultural Marketing Cooperatives in Ethiopia. Food Policy 34 (1): 60-69.
Bernard, T., D.J. Spielman, A.S. Taffesse, and E.Z. Gabre-Madhin. 2010. Cooperatives for Staple Crop Marketing. Research Monograph 164. Washington, D.C.: International Food Policy Research Institute.
Central Statistical Agency (CSA). 1998. Revised Report on the 1995/96 Household Income, Consumption and Expenditure Survey. Statistical Bulletin 204. Addis Ababa: Government of Ethiopia.
__________. 2001. Report on the 1999/2000 Household Income, Consumption and Expenditure Survey. Statistical Bulletin 258. Addis Ababa: Government of Ethiopia.
__________. 2003. Statistical Report on Socioeconomic Characteristics of the Population in Agricultural Households, Land Use, and Area and Production of Crops: Part I. Addis Ababa: Government of Ethiopia.
__________. 2007. Report on the 2004/2005 Household Income, Consumption and Expenditure Survey. Volume II Statistical Report 394. Addis Ababa: Government of Ethiopia.
Dadi, L., A. Negassa, and S. Franzel. 1992. Marketing of Maize and Teff in Western Ethiopia: Implications for Policy Following Market Liberalization. Food Policy 17: 201-213.
Dercon, S. 1995. On Market Integration and Liberalization: Method and Application to Ethiopia. Journal of Development Studies 32: 112-143.
Diao, X., and N., Alejandro. 2007. Growth options and poverty reduction in Ethiopia – An economic wide model analysis. Food Policy 32 (7): 205-228.
Drèze, J., and A. Sen. 1989. Hunger and Public Action. WIDER Studies in Development Economics. Oxford: Oxford University Press.
Fackler, P. 1996. Spatial Price Analysis: A Methodological Review. Mimeo, North Carolina State University.
Fackler, P. 2004. Estimating the Degree of Market Integration. Unpublished manuscript, North Carolina State University.
26
Fackler, P.L., and B.K. Goodwin. 2001. Spatial price transmission. In Handbook of Agricultural Economics, ed. B. Gardner and G. Rausser. Volume 1, Chapter 17. Elsevier Science.
Fafchamps, M. 1992. Cash crop production, food price volatility, and rural market integration in the third world. American Journal of Agricultural Economics 74 (1): 90–99.
Federal Democratic Republic of Ethiopia (FDRE).1999. Ethiopian Grain Trade Enterprise Re-establishment: Council of Ministers Regulations No. 58/1999. Negarit Gazeta, Addis Ababa.
Federal Democratic Republic of Ethiopia (FDRE). 2006. National Transport Master Plan Study: Existing road infrastructure plans. Working Paper 9 and 15. Addis Ababa: Government of Ethiopia.
Franzel, S., F. Colburn, and G. Degu. 1989. Grain marketing regulations: Impact on peasant production in Ethiopia. Food Policy 14: 347-358.
Gabre-Madhin, E.Z. 2001. Market Institutions, Transaction Costs, and Social Capital in the Ethiopian Grain Market. Research Report 124. Washington, D.C.: International Food Policy Research Institute.
Getnet, K., W. Verbeke, and J. Viaene. 2005. Modeling Price Transmission in the Grain Markets of Ethiopia with Application of ARDL Approach to White Teff. Agricultural Economics 33 (3): 493–501.
Ghose, A. K. 1985. Transforming Feudal Agriculture: Agrarian Change in Ethiopia since 1974. Journal of Development Studies 23 (1): 127-149.
Goletti, F., and N. Minot. 1998. Export liberalization and household welfare: the case of rice in Vietnam. American Journal of Agricultural Economics 80 (40): 738-749.
Gonzalez-Rivera, G., and S.M. Helfand. 2001. The Extent, Pattern, and Degree of Market Integration: A Multivariate Approach for the Brazilian Rice Market. American Journal of Agricultural Economics 83 (3): 576-592.
Gutema, D. 1988. Grain Marketing and Distribution Status and Future Direction. Paper Presented at the “19th National Crop Improvement Conference”, April 22-26, 1987. Addis Ababa; Institute of Agricultural Research.
Holmbeg, J. 1977. Grain Marketing and Land Reform in Ethiopia: An Analysis of the Marketing and Pricing of Food Grains in 1976 after the Land Reform. Research Report 41. The Scandinavian Institute of African Studies.
Imperial Ethiopian Government. 1950. Ethiopian Grain Board Proclamation No. 113/1950. Negarit Gazeta, Addis Ababa.
Imperial Ethiopian Government. 1960. General Notice No. 267/1960. Negarit Gazeta, Addis Ababa.
Jayne, T.S., A. Chapoto, J. Nyoro, A. Mwanaumo, and J. Govereh. 2001. False Promise or False Premise? The Experience of Food and Input Market Reform in Eastern and Southern Africa. World Development 30 (11): 1967-1985.
Lemma, S. 1996. State Agrarian Policies and Periodic Markets in Ethiopia. Journal of Ethiopian Studies 29 (1): 78-105.
Lirenso, A. 1987. Grain Marketing and Pricing in Ethiopia. Research Report 28. Addis Ababa: Institute of Development Research, Addis Ababa University.
_______. 1994. Liberalizing Ethiopian Grain Markets. In Papers of the 12th International Conference of Ethiopian Studies, ed. H. Marcus, and G. Hudson. East Lansing: Michigan State University.
McNew, K., and P.L. Fackler. 1997. Testing Market Equilibrium: Is Co-integration Informative? Journal of Agricultural Resource Economics 22:191-207.
27
Negassa, A., R. Myers, and T.S. Jayne. 1997. The Response of Ethiopian Grain Markets to Liberalization. Grain Market Research Project. Working Paper 6. Addis Ababa: Ministry of Economic Development and Cooperation.
Negassa, A. and R. Myers, 2007. Estimating Policy Effects on Spatial Market Efficiency: An Extension to the Parity Bound Model. American Journal of Agricultural Economics 89 (2): 338-352.
Newbery, D.M.G., and J. E. Stiglitz. 1981. Optimal Commodity Stock-piling Rules. Oxford Economic Papers 34 (3): 403-27. Oxford: Oxford University Press.
Rashid, S. 2010. Staple Food Markets in Ethiopia. Paper prepared for the for the COMESA policy workshop on food price variability, January 25-26, Maputo. Available at: http://www.aec.msu.edu/fs2/aamp/seminar_3/AAMP_Maputo_27_Ethiopia_ppr.pdf
Rashid, S. 2011. Inter-commodity Price Transmission and Food Price Policies: An Analysis of Ethiopian Cereals Markets. IFPRI Discussion paper 1079. Washington, D.C.: International Food Policy Research Institute.
Rashid, S., and M. Assefa. 2006. Cereal Price Instability in Ethiopia: An Analysis of Sources and Policy Options. Paper prepared for the Agricultural Economics Association for Africa, Accra, Ghana.
Rashid, S., and S. Lemma. 2010. Strategic Grain Reserve in Ethiopia: Institutional Design and Operational Performance. IFPRI Discussion Paper 1054. Washington, D.C.: International Food Policy Research Institute.
Taffesse, A. S. 1997. Government Policy and Dynamic Supply Response: A Study of the Compulsory Grain Delivery System. MPRA Paper 18674. Munich: University Library of Munich.
The Provisional Military Administration Council of Ethiopia. 1976. Agricultural Marketing Corporation Establishment Proclamation No. 105/1976. Negarit Gazeta, Addis Ababa.
The Provisional Military Administration Council of Ethiopia. 1987. Regulations to Provide for the Re-establishment of the Agricultural Marketing Corporation: Legal Notice No. 103/1987. Negarit Gazeta, Addis Ababa.
Timmer, C. P. 1989. Agricultural Prices and Stabilization Policies. Development Discussion Paper 290. Massachusetts: Harvard Institute of International Development.
Timmer, C.P, W.P. Falcon, and S.R. Pearson. 1983. Food Policy Analysis. Washington, D.C.: World Bank.
Transitional Government of Ethiopia. 1992a. Proclamations on Public Enterprise, Proclamation No. 25/1992. Negarit Gazeta, Addis Ababa.
Transitional Government of Ethiopia. 1992b. Council of Ministers Regulations to Provide for the Establishment of Ethiopian Grain Trade Enterprise: Council of Ministers Regulations No. 104/1992. Negarit Gazeta, Addis Ababa.
Webb, P., and J. von Braun. 1994. Famine and Food Security in Ethiopia: Lessons for Africa. International Food Policy Research Institute. West Sussex: John Wiley & Sons Ltd.
William, J.C., and B. D. Wright. 1991 Storage and Commodity Markets. New York: Cambridge University Press.
World Bank. 2007. Explaining Sources of Food Price Inflation in Ethiopia: A Just in Time Policy Note. World Bank (draft).
World Food Programme (WFP). 1989. Mid-term Evaluation by a WFP/FAO/ILO/UN Mission of Project Ethiopia 2488/(Exp. II): Rehabilitation of Forest, Grazing, and Agricultural Lands, Vol. 1. Addis Ababa: World Food Programme.
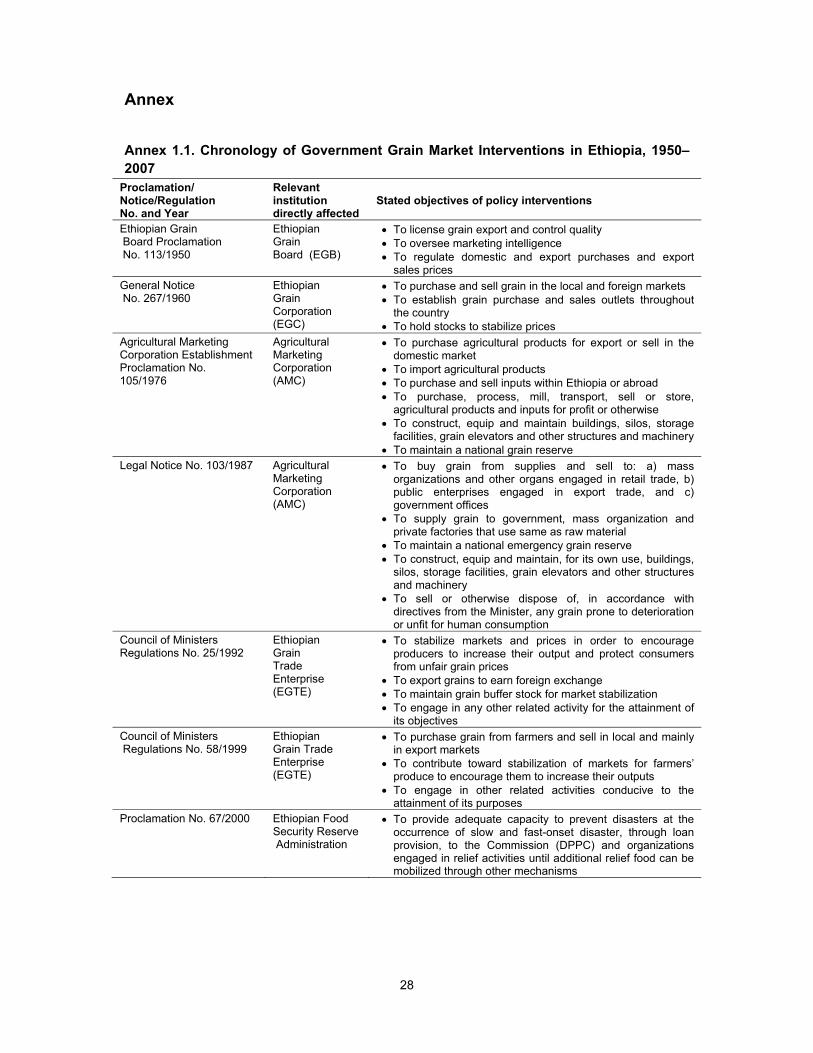
28
Annex
Annex 1.1. Chronology of Government Grain Market Interventions in Ethiopia, 1950–2007
Proclamation/ Notice/Regulation No. and Year
Relevant institution directly affected
Stated objectives of policy interventions
Ethiopian Grain Board Proclamation No. 113/1950
Ethiopian Grain Board (EGB)
To license grain export and control quality To oversee marketing intelligence To regulate domestic and export purchases and export
sales prices General Notice No. 267/1960
Ethiopian Grain Corporation (EGC)
To purchase and sell grain in the local and foreign markets To establish grain purchase and sales outlets throughout
the country To hold stocks to stabilize prices
Agricultural Marketing Corporation Establishment Proclamation No. 105/1976
Agricultural Marketing Corporation (AMC)
To purchase agricultural products for export or sell in the domestic market
To import agricultural products To purchase and sell inputs within Ethiopia or abroad To purchase, process, mill, transport, sell or store,
agricultural products and inputs for profit or otherwise To construct, equip and maintain buildings, silos, storage
facilities, grain elevators and other structures and machinery To maintain a national grain reserve
Legal Notice No. 103/1987 Agricultural Marketing Corporation (AMC)
To buy grain from supplies and sell to: a) mass organizations and other organs engaged in retail trade, b) public enterprises engaged in export trade, and c) government offices
To supply grain to government, mass organization and private factories that use same as raw material
To maintain a national emergency grain reserve To construct, equip and maintain, for its own use, buildings,
silos, storage facilities, grain elevators and other structures and machinery
To sell or otherwise dispose of, in accordance with directives from the Minister, any grain prone to deterioration or unfit for human consumption
Council of Ministers Regulations No. 25/1992
Ethiopian Grain Trade Enterprise (EGTE)
To stabilize markets and prices in order to encourage producers to increase their output and protect consumers from unfair grain prices
To export grains to earn foreign exchange To maintain grain buffer stock for market stabilization To engage in any other related activity for the attainment of
its objectives Council of Ministers Regulations No. 58/1999
Ethiopian Grain Trade Enterprise (EGTE)
To purchase grain from farmers and sell in local and mainly in export markets
To contribute toward stabilization of markets for farmers’ produce to encourage them to increase their outputs
To engage in other related activities conducive to the attainment of its purposes
Proclamation No. 67/2000 Ethiopian Food Security Reserve Administration
To provide adequate capacity to prevent disasters at the occurrence of slow and fast-onset disaster, through loan provision, to the Commission (DPPC) and organizations engaged in relief activities until additional relief food can be mobilized through other mechanisms
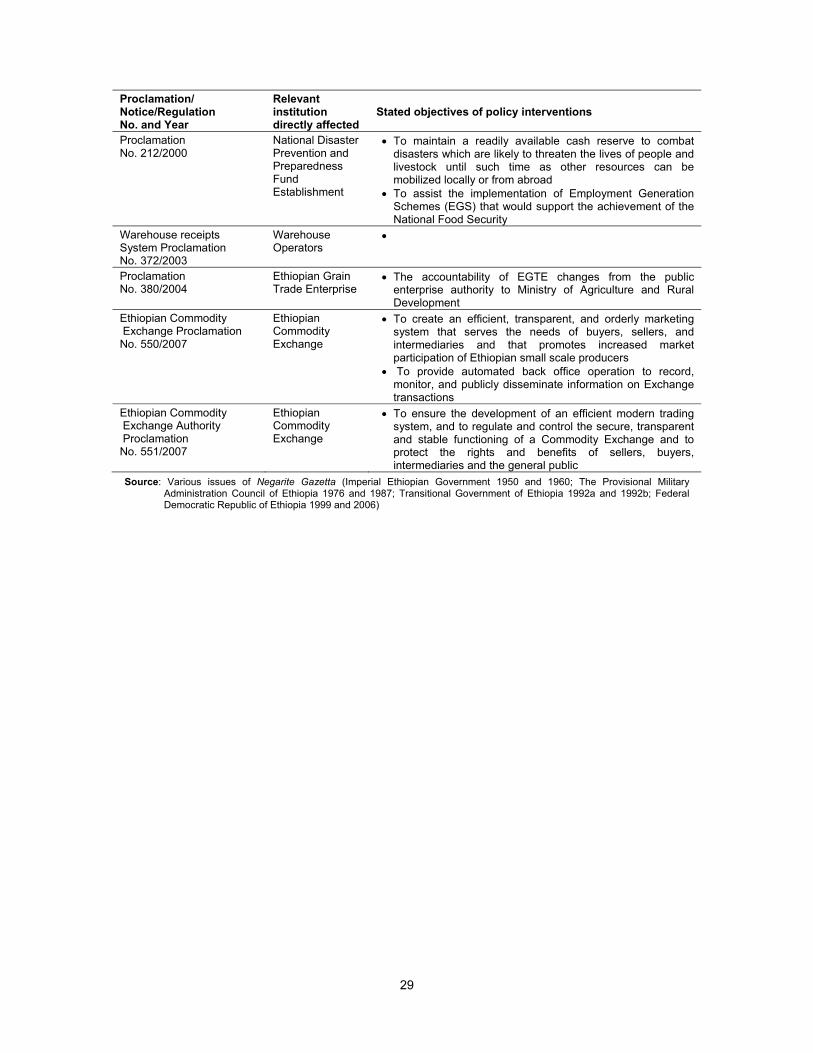
29
Proclamation/ Notice/Regulation No. and Year
Relevant institution directly affected
Stated objectives of policy interventions
Proclamation No. 212/2000
National Disaster Prevention and Preparedness Fund Establishment
To maintain a readily available cash reserve to combat disasters which are likely to threaten the lives of people and livestock until such time as other resources can be mobilized locally or from abroad
To assist the implementation of Employment Generation Schemes (EGS) that would support the achievement of the National Food Security
Warehouse receipts System Proclamation No. 372/2003
Warehouse Operators
Proclamation No. 380/2004
Ethiopian Grain Trade Enterprise
The accountability of EGTE changes from the public enterprise authority to Ministry of Agriculture and Rural Development
Ethiopian Commodity Exchange Proclamation No. 550/2007
Ethiopian Commodity Exchange
To create an efficient, transparent, and orderly marketing system that serves the needs of buyers, sellers, and intermediaries and that promotes increased market participation of Ethiopian small scale producers
To provide automated back office operation to record, monitor, and publicly disseminate information on Exchange transactions
Ethiopian Commodity Exchange Authority Proclamation No. 551/2007
Ethiopian Commodity Exchange
To ensure the development of an efficient modern trading system, and to regulate and control the secure, transparent and stable functioning of a Commodity Exchange and to protect the rights and benefits of sellers, buyers, intermediaries and the general public
Source: Various issues of Negarite Gazetta (Imperial Ethiopian Government 1950 and 1960; The Provisional Military Administration Council of Ethiopia 1976 and 1987; Transitional Government of Ethiopia 1992a and 1992b; Federal Democratic Republic of Ethiopia 1999 and 2006)


![Cereal Food, Cereals and Cereal Products Processing IndustryNIIR]_Books-Cereal... · Profitable Agro Based Projects with Project Profiles (Cereal Food Technology) ... use. Cereals](https://img.pdfslide.net/doc/110x75/5ab66a817f8b9ab47e8dc8d4/cereal-food-cereals-and-cereal-products-processing-industry-niirbooks-cerealprofitable.jpg)