Embed Size (px)
Citation preview
pg. 1
Policies, Institutional Framework and International Development Interventions in Policies, Institutional Framework and International Development Interventions in Policies, Institutional Framework and International Development Interventions in Policies, Institutional Framework and International Development Interventions in Eastern African CommunityEastern African CommunityEastern African CommunityEastern African Community
J.J. Mbonigaba Muhinda1 and Alfred R. Bizoza2 1 Rwanda Agriculture Board (RAB)
2University Rwanda (UR)
Paper presented for the Symposium on Agricultural Development in the East African Community (EAC):
lessons from the past 50 years and prospects for the next 50 years
Kampala Uganda on 05 – 07 November, 2013
AbstractAbstractAbstractAbstract
During the last 50 years, agriculture remained the most dominant sector in the economies of the
five East African Countries namely Kenya, Uganda, Rwanda, Tanzania and Burundi. Several
policies and institutional frameworks have accelerated or hindered agricultural development in
those countries. However, such data is limited and few studies had been conducted in this area.
This paper builds on the existing data to explore the policies, institutions and agricultural
development interventions in Africa with a particular attention to the EAC sub-region. It provides
preliminary contribution to the debate on agricultural policy processes by focusing on lessons
learnt from the independence period to date. From a historical perspective, the article unpacks the
role of the state and the extent to which the private sector, civil society organizations and
community are involved in policy design and implementation. Furthermore, it shows the
limitations of the public sector investment in agriculture development and the potentials for the
private sector involvement. Other findings of the analysis show that so far the institutional
integration has enabled economic integration in the EAC region, which in turn is evidenced by
improved trade openness, real GDP per capita, inflation and exchange rates. The analysis of
export and import statistics have showed positive trends of exports and imports in praise of the
regional and economic integration. The paper demonstrates the disconnection between policy
papers (many and well elaborated) and their respective implementation processes. It also identifies
that policy design in the EAC countries draws less on evidence-based analysis which affects
investment and policy targeting. Similarly, the analysis of the bilateral Official Development
Assistance (ODA) commitments in the most recent period show that agriculture received much
attention (an average of 82.5 %) in the production sector than industry, mining, construction, trade
and tourism. From the Rwandan experience on policy processes and the on-going agricultural
transformation, the paper demonstrates how effective agricultural policies can reduce poverty and
ensure food security. Finally, specific lessons and prospects for the next 50 years were drawn from
the discussions to guide future agriculture development in EAC region.
Key wordsKey wordsKey wordsKey words: Policies and institutions, Agricultural Development, EAC Countries.
pg. 2
1. 1. 1. 1. BackgroundBackgroundBackgroundBackground
After decades of decline of per capita food production, the current era is looking optimistic about
the prospects for Africa and for African agriculture in particular. For Africa as a whole, economic
growth was well above 5% until 2008, whereas for sub-Saharan Africa (SSA) it was above 5.5% and
5.8% for the East Africa in 2011. Estimate of the African Development Bank (AfDB, 2012) shows
that the real GDP growth is generally declining in Africa as well as in East Africa, indicating
unstable economic growth (table 1). The agricultural growth in sub-Saharan Africa has been above
3.5% and 4.0 % in the East African Community (EAC), well above the population growth rate of
about 2% (FAO, 2009; Africa Progress Report, 2012).
TTTTableableableable 1111. . . . Real GDP growth by Region (%)Real GDP growth by Region (%)Real GDP growth by Region (%)Real GDP growth by Region (%)
RegionRegionRegionRegion 2010201020102010 2011201120112011 2012201220122012 2013201320132013
Africa 5.0 3.4 4.5 4.8
Central Africa 5.7 5.1 4.9 4.8
Eastern Africa 7.1 6.0 5.1 5.6
Northern Africa 4.1 0.5 3.1 4.0
Southern Africa 3.5 3.5 4.0 4.4
Western Africa 6.9 6.3 6.9 6.4
Oil-exporting countries 5.3 2.9 4.7 5.0
Oil-importing countries 4.5 4.1 4.2 4.7
Source:Source:Source:Source: Adapted from African Development Bank, 2012
In the EAC, policies, institutional frameworks, support and prescriptions of donors, and the public
sector investments influenced positively or negatively the progress during the last five decades.
EAC is a regional intergovernmental organisation of the Republics of Burundi, Kenya, Rwanda,
Tanzania, and Uganda. During the colonial era and after independance, each of these countries
tried to develop but in an isolate manner. However, Kenya, Uganda and the United Republic of
Tanzania have enjoyed close historical, commercial, industrial, cultural and other ties for many
years due to their common British colonial background among others. The same applies to
Burundi and Rwanda which shares a common background as Belgian colonies. Efforts to initiate
an East African Community were progressively made with plenty pitfalls. In 1967, Uganda, Kenya
and Tanzania signed a Treaty for East African Cooperation and established respectively the East
Africa High Commission, the East African Common Services Organisation and the East African
Community as successive joint organisations of the said countries. In 1977 the Treaty establishing
the East African Community was officially dissolved due to several reasons including lack of strong
political will, lack of strong participation of the private sector and civil society in the cooperation
activities, continued disproportionate sharing of benefits of the Community among the Partner
States due to their development differentials and lack of adequate policies to accommodate each
one's interest. Other mediation agreements followed in the 1980s without much successes. In
pg. 3
1994, provision was made by the protocol on the establishment of a Secretariat of the Permanent
Tripartite Commission.
The Treaty for establishment the East African Community was signed on 30 November 1999 and
entered into force on 7 July 2000 following its ratification by the original three Partner States –
Kenya, Tanzania and Uganda. Rwanda and Burundi, the two tiny landlocked East African
countries joined the EAC on 1 July 2007. The five countries agreed to cooperate at the sub-
regional and regional levels in all fields of human endeavours to raise the standards of living of East
African peoples. To this extent the EAC countries established a Customs Union in 2005 and a
Common Market in 2010. The regional integration process is at a high pitch at the moment
(Richard Ndereyahaga, 2010). The next phase of the integration will see the bloc enter into a
Monetary Union and ultimately become a Political Federation of the East African States.
The purpose of the Treaty is to deepen and accelerate integration, have one nation, one people
and one destiny. The Mission is to “widen and deepen Economic, Political, Social and Culture
integration in order to improve the quality of life of the people of East Africa through increased
competitiveness, value added production, trade and investments”(EAC, 2007). Hence, the treaty
aims at realising a fast and balanced regional development with a particular focus on agriculture
sector. In fact, food production, processing and marketing remain the most important in the
development areas of EAC economies. For example, it is estimated that 70% to 80% of the labour
force of the EAC is employed in the food sector in one way or another. On average, the agriculture
sector contributes to around 36% of the GDP (EAC Secretariat, 2010). Agriculture constitutes the
backbone of the EAC economies by contributing to foreign exchange earnings, employment and
provides raw material for agro-based industries. Furthermore, about 80% of the population of the
EAC Partner States live in the rural areas and depend largely on agriculture for their livelihood.
About 40-46% of them remain under the poverty line, making poverty predominantly a rural
phenomenon (Kakande 2010). Since agriculture employs over 75% of the rural population,
development of the sector presents a great opportunity for poverty reduction in a sustainable
manner. In addition to agriculture, artisanal activities, tourism, mining, forestry, fishing and small-
scale manifacturing contribute substancially to the rural economy of EAC countries.
The economies of the EAC Partner countries depend heavily on agriculture for growth and
development as largely explained above. It is in this line that the East African Community
Agriculture and Rural Development Policy (EAC- ARDP) has been developped to implement the
provisions of the EAC Treaty as set out in 18 Articles 105-110 (EAC, 2006). The development of
the EAC Agriculture and Rural Development is therefore a deliberate move by the Partner States
to achieve the goals and aspirations set out by the Treaty. It also provides a pillar for development
of a shared regional vision for sustainable development and takes advantages of the opportunities
arising from globalisation and regional integration. The Policy highlights the performance of
agricultural sector and Policy reforms undertaken in the Partner States. Out of goals and
pg. 4
objectives, it provides details on policy statements and gives provision for implementation, financial
arrangements, roles of stakeholders, monitoring, coordination and evaluation.
Currently, the overall objectives of the EAC under agricultural sector as set in the Treaty are to
achieve food security and rational agricultural production (EAC, 2006). The EAC Policies target
the Rural development and Food security in the five African countries through various agricultural
institutions such as EAC-ARDP and EAC-FSAP.
The EAC Agriculture and Rural Development Policy (EAC ARDP) aims at attaining food security
through increased agricultural production, processing, storage and marketing. The EAC-ARDP
recognizes the importance of eliminating hunger and ensuring sustainable food security within the
region as a necessary first step towards poverty reducation and consequently a stimulus for rational
agricultural development and realization of the aspirations of the EAC Treaty. The EAC is aware of
the potential regional agricultural value chains supported by agribusiness and agro-processing as a
basis for linking especially the smallholder producers to markets for food and other agricultural
products. Therefore, the East African Common Market (EACM) provides the best opportunity for
building such value chains, because it provides a framework for exploiting options of economies of
scale in the production and supply of food. The realisation of a large regional economic bloc
encompassing five countries leading to a combined population of more than 130 million people,
land area of 1.82 million sq kilometres and a combined Gross Domestic Product of $74.5 billion,
bears great strategic and geopolitical significance (EAC, 2010). It is an opportunity for enhancing
food security that should be used with all the priority it deserves.
However, before and since the signing of the Treaty, the ability of the Partner States to achieve
individual and collective durable food security status has been elusive. This has been further
hampered by the negative impacts of Climate Change. In this connection EAC Head of States
directed that the EAC Food Security Action plan and EAC Climate Change Policy be developed
to address food insecurity and adverse effects of climate change in the all region.
The EAC Food Security Action Plan (2010-2015) grounds its assumption that the ‘EAC region is
frequently affected by food shortages and pockets of hunger although the region as a whole has a
huge potential and capacity to produce enough food for regional consumption and a large surplus for
export to the world market’. There are many factors explaining this situation and the most critical
are: (i) inadequate food exchange/trade between times and/or places of abundant harvest on one
hand, and those with deficit on the other hand; and (ii) high variability in production caused by high
variability of weather which is becoming worse due to climate change (EAC, 2010). Hence, the East
African Community Food Security Action Plan has been developed to address food insecurity and
climate change. It forms the initial step of implementing the provisions of the EAC Treaty as set out
in Chapter 18 Articles 105 -110.
pg. 5
Driven by achieving food securty and ensuring rational agriculture production, the EAC- Food
Security Action Plan will guide coordination and implementation of the joint programmes and
projects emanating from this plan over a period of 5 years (2010 to 2015). The Sectoral Council
of Ministers Responsible for Agriculture and Food Security will guide its implementation. For its
effective and efficient implementation, this calls for strengthened capacities of the EAC Secretariat
to coordinate the implementation of the joint programmes and projects emanating from this plan.
The EAC Secretariat in collaboration with Partner States has drawn up a detailed annual work plan
indicating financial requirements based on objectives identified in the Action Plan. The
implementation of the plan was phased starting with the crucial strategic interventions. The plans
are financed by the Community, Development Partners and Investors.
In view of the above, this 2013 International Symposium on Agriculture Development in East
Africa is designed to facilitate deeper regional integration needed to accelerate agricultural
development through harnessing of the increased opportunities made possible by the East African
Common Market. The International Symposium will put together different actors from EAC
countries who will share past experiences and strategise for the future of the Community. This
paper comes in as a contribution to the central theme "Agricultural development in the East
African Community – lessons from the 50 years and prospects for the next 50 years".
The remained part of the article is organized as follows: the second section provides the overall
objective and research materials of the paper. Section three discusses some of key policies,
institutions, and agricultural strategies in Africa with focus to Eastern African Countries. The paper
materializes some of the lessons learnt in the past through a case study of Rwanda in section four,
followed with some policy recommendations.
2. 2. 2. 2. Overall OOverall OOverall OOverall Objective bjective bjective bjective and Research Materials and Research Materials and Research Materials and Research Materials
The overall objective of this study is to investigate the way policies, institutional frameworks,
support and prescriptions of donors, and the public sector investments have changed, been
changed, accelerated progress and positive results, or have hindered or reversed progress towards
economic development, with focus to the agriculture sector in the EAC region.
Materials of this study were collected from existing secondary data about the agriculture
development in Africa and particularly in the EAC sub-region. The agricultural and related policies
in EAC were identified from key documents including strategic plans, annual reports, program
plans and implementation progress reviews. Sources of these documents include websites of EAC
secretariat, relevant ministries and line institutions of particpating countries and development
partner organizations. Rwanda is given some particular attention to contextualize some of the
lessons learnt and see ways to upscale some in the region. Methods of analysis are mainly
qualitative and include content analysis....
pg. 6
3.3.3.3. Discussion on Policies, Discussion on Policies, Discussion on Policies, Discussion on Policies, InstitutionInstitutionInstitutionInstitutionssss and International and International and International and International Development IDevelopment IDevelopment IDevelopment Interventions nterventions nterventions nterventions in the EACin the EACin the EACin the EAC
The economic, social and political development for the EAC Partner States is supported by their
strategic visions and implementation strategies prepared independently. Those strategies are in line
with the objectives of the Community which is meant to develop policies and programmes aimed
at widening and deepening economic, political, social and cultural integration at regional and global
levels (EAC, 2011). All the Partner States share in the dream of achieving a middle income status
by 2030. The emphasis in this section is on policies and institutions pertaining agricultural
development, state and markets relations, effect of globalization and liberalized economies, puplic-
private partnerships and intra-trade within the EAC.
3.1.3.1.3.1.3.1. InstitutionsInstitutionsInstitutionsInstitutions, Policies, Policies, Policies, Policies and the Agricultural Development Challengeand the Agricultural Development Challengeand the Agricultural Development Challengeand the Agricultural Development Challengessss in in in in the EACthe EACthe EACthe EAC
This sub-section entails the relevancy of institutional environment and policies in the agriculture
sector. It indicates how these have evolved over time and what benefits and enablers obtained from
the development of institutions, with particular attention to EAC countries.
Agricultural policies and frameworks are normally pushed by different actors in the policy process.
What kind of Ministry of Agriculture is envisaged, either implicitly or explicitly? Three schools of
sought emerge from the discussion about the role of the Ministry of Agriculture. One sees the
sectoral ministry with capacity and policy clout – to address the major constraints of agriculture. It
is argued, what is required is a strong, well-funded line ministry, and the challenge today is to
rebuild such an organisation. A second – at the other extreme – sees such sectoral ministry taking
on a minimal role, focused on oversight and regulation, as the private sector takes on a more
substantive role in a ‘free-market’ environment. A third- sees an important role for the state and
the Ministry of Agriculture, together with other state agencies in addressing the coordination and
intermediation roles of getting markets to work effectively, while ensuring at the same time public
efforts are targeted to poverty reduction.
The current status of agricultural institutional development in the EAC partner states is somewhat
close to the first and the third options where the Ministry of Agriculture and the State are more
responsible for agriculture development. Yet, the FAO report on challenges and opportunities for
African agriculture and food security (2010) show that sector institutions specifically associated with
agriculture and natural resources have often performed particularly badly and were not able to
address the challenges of the rural development. For example, agricultural credit institutions not
only achieved little for small farmers, they also were fiscal black holes benefiting primarily the
better off farmers, decentralized institutions that are ineffective and poor providers of small farmer
services. However, there is an increasing willingness by the states to delegate some roles to the
private sector in the agriculture development.
pg. 7
With respect to agriculture policies, EAC policies have evolved over time similar to other African
nations. During the post-colonial period till 1980s, he policy design was much informed by the
colonial believe attributing much space to the state in policy formulation as well as implementation.
During the period 1980 to 2000, the policy development started to acknowledge the role of the
private sector, civil society and local government in shaping the growth and development of the
agriculture due to improvement in macro-economic and sector policies. The current agriculture
development is driven by the majority of policies developed during the last decade (2003 to
2013) of which some commons in the design can be observed accross the five partner states ( see
annex 1). However, there is evidence of disconnect between policy papers and their
implementation which reflect to some extent the failure to address the agriculture development
challenges in an effective and efficient manner.
Furthermore, the policy design is more or less based on particular actors and networks with
particular interests. Grindle and Thomas (1991) argue that 'different groups of institutions and
actors– academics, think-tanks, donors, government agencies and others- therefore promote a
particular policy framing, and in doing so link different groups together in networks. Such
networks may represent particular interests, and be associated with particular political positions.
Policies are thus inevitably political and the policy process is less of a linear, technical sequence,
but more a political process, driven by particular actors and networks associated with different
interests. These actors therefore interact to create (or decrease) ‘policy space’ and so the options
for policy change.
The framing of policies in EAC countries draws less on evidence-based analysis. This calls for
relevant, timely, and quality of evidences or evaluations that feed into the policy design and policy
targeting (Holland and Mertz, 2012). Basing policy on evidences allows policy makers and the
general public to understand the issue, identify the most appropriate policy direction and influence
policy thinking and giving policy makers the necessary tools to communicate and defend their
policy decisions (GSR, 2007). Types of information needed for this purpose include raw data,
numbers of trends, evaluation evidences with qualitative and quantitative outcomes, and academic
research. Yet, there is also a general consensus seeking how to improve the methodology that
provides timely and accurate agricultural data on a regular basis. In addition, the linkage between
research outputs and the policy reform process is not easy to appreciate, especially in the
agriculture sector. There is no better mechanism that enables tracking how research outputs
influence the policy reform; hence an area that needs ample consideration. Finally, looking at this
policy-evidence, this brings the notion of the role that the socio-economic research could play to
support the policy design and how this role can be strengthening in the future (Burruss and Bizoza,
2013).
Although it's difficult to measure the differential contribution of institutions and policies in
agricultural growth due to inadequate data, but benefits of these can be captured through their
pg. 8
facilitation effect, such as creating an enabling environment for the private sector and civil society
involvement, more participation of rural communities, capitalizing on social capital (collective
actions), land reforms and decentralization of certain agriculture services.
3.23.23.23.2.... Overview of Overview of Overview of Overview of ConstraintsConstraintsConstraintsConstraints of of of of SSSSmallmallmallmall----holder holder holder holder FFFFarmers armers armers armers in the EACin the EACin the EACin the EAC
Agricultural production in developing countries takes place largely in small farms, with land
holding size declining and becoming more and more fragmented (Lipton, 2005). Smallholder
agriculture in the East African countries is common and has been facing numerous constraints.
While some are unique to each of the countries, most are of a similar nature, implying that
harmonized policies would address them across countries. Consistent with the AfDB report
(2010), key constraints that shape the policy and institutions development in agriculture include- (i)
land tenure, access rights and management, (ii) agricultural financing and access to credits, (iii)
access to input and output markets, (iv) poor infrastructure, (v) limited agricultural extension
services and innovations, (vi) low agriculture productivity, (vii) enfant agriculture-based enterprises
and cooperatives, and (viii) high transaction costs within the sector). However, looking at these
constraints, many are not new, but rather long-standing and perhaps even chronic. Although we do
not intend to give a detailed description of each of these constraints, we provide an overview of
how they impend on the overall agriculture development.
In the Eastern Africa, 90 percent of farms are smaller than five hectares (two thirds of which having
less than 1.5 hectares) and account for 80 percent of agricultural production (Molua and Rajab,
2002). Smallholder households are typically food-insecure, farming low productivity lands, with
weak access to input and output markets and high exposure to production and price fluctuations.
Land holdings are commonly not formalised and tenure arrangements are still often determined
by customary rules and practices in most countries, despite on-going land registration and
regularization efforts. The small scale of production and the high levels of risk exposure, together
with low-input agricultural production and market underdevelopment, produce very high costs of
transaction which constrain the expansion of agricultural supply chains.
Financial markets fail to develop because of demand scarcity (small scale, high risk exposure and
lack of collateral constrain farmers’ access to financial services) and farmers’ productive investment
in land is inhibited by lack of financial capital to purchase agricultural inputs. Investment
coordination along the supply chain in poor rural areas is therefore particularly difficult to strike.
The investment decision of an agricultural input supplier is likely to be constrained by the
availability of financial services which allow farmers to access financial capital to purchase
agricultural inputs. This is partly explained by the fact that most of commercial banks and micro-
finance institutions have products that have limitations to accommodate the investments risks in
the agriculture sector. Thus, agricultural financing will remain a constraining factor if policies and
pg. 9
regulations are not tailored to it. The insurance of agricultural loans that is being introduced in the
agriculture financing sector may be necessary but needs extra measures to sustain it.
The investment in marketing systems is determined by the existence of input markets supporting
the production activity. When transaction risks and costs are high, markets are unable to produce
an efficient allocation of resources, and agricultural activity can get caught in a ‘low level
equilibrium trap’ (Poulton et al., 2004). High costs lead to underinvestment which depresses the
level of economic activity, increasing further the risks and costs of transaction and generating a
vicious circle of underdevelopment. This ‘low level equilibrium’ is argued to be particularly
significant in food crop production – given the marketing characteristics of food crops there are no
incentives for the private sector to provide the required coordination of investment, making it very
difficult to break out of the trap.
It is under these circumstances that markets (i.e. private sector operators) fail to provide an
efficient outcome and therefore an exogenous push is required to set market mechanisms in
motion. But the recognition of a market failure and the identification of correcting measures are
far from straightforward. Wiggins (2005) notes that, beyond the provision of public goods and
regulation of externalities, we know too little of how much failure there is and how to go about
correcting it. Are these failures a justification for direct state provision of inputs to small farmers,
for example? Or would this further undermine the development of a market for agricultural
inputs, while carrying the costs of an ineffective and inefficient government intervention? As Petit
(1995) noted defining what policies we should recommend is very often a matter of judgement
between the conflicting pressures arising from the existence of market failures and government
failures. In the context of debates about agriculture in Africa, such judgements most likely emerge
from deep-seated ideological and political commitments dominating particular policy positions by
different groups.
3.3. 3.3. 3.3. 3.3. Impact of the GlobalizationImpact of the GlobalizationImpact of the GlobalizationImpact of the Globalization: Institutional and Economic: Institutional and Economic: Institutional and Economic: Institutional and Economic integration integration integration integration
Agricultural activity in the East African countries has been greatly influenced by those countries’
long relationship with the rest of the world. Many of the structures used to assist producers and to
distribute market products have been inherited from the colonial era. The pressure to liberalize
agricultural production and marketing in the African fashion began back in the 1980s.
East African countries have recognized the importance of striving to increase their role in the
international economy and have, over the last two decades, adopted appropriate economic
measures. These measures have resulted in benefits to the EAC countries including the stimulation
of private-sector investment in production and processing, inputs supply, agricultural marketing
and enhance community participation. However, the risks associated with adopting a more
exposed position in a highly competitive global agricultural market have presented these countries
pg. 10
with some serious difficulties (Robbins and Ferris, 2003). The African Economic outlook report of
2012 sustains that Africa´s economic prospects depend on many unpredictable factors. The same
report estimates that a one-percentage point decline of GDP in OECD member countries causes
African GDP to decline by about 0.5% and Africa´s export earnings by about 10% (AfDB at al.,
2012).
The influence of Globalization in most EAC member countries started mid-1980s to 1990s,
starting with market liberalization and privatization fueled by the structural adjustment policy
reforms under the auspices of the Breton Wood Institutions namely WB and IMF. These two
institutions have facilitated of the initiation process of the economic recovery programs across the
EAC countries. Consequently, , substantial structural reforms have taken place in their respective
economies in areas of price liberalization, exchange in payment liberalization, public enterprise
reform and financial sector reform, and civil service reform (Mubiru, 2003).
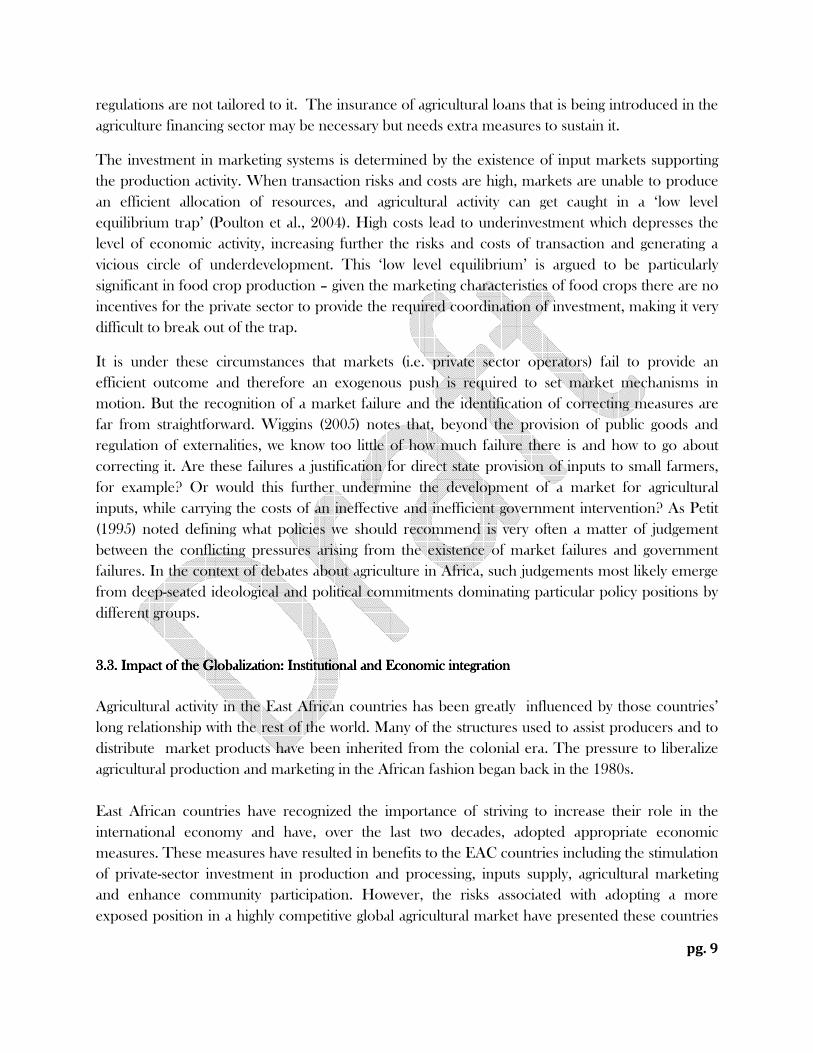
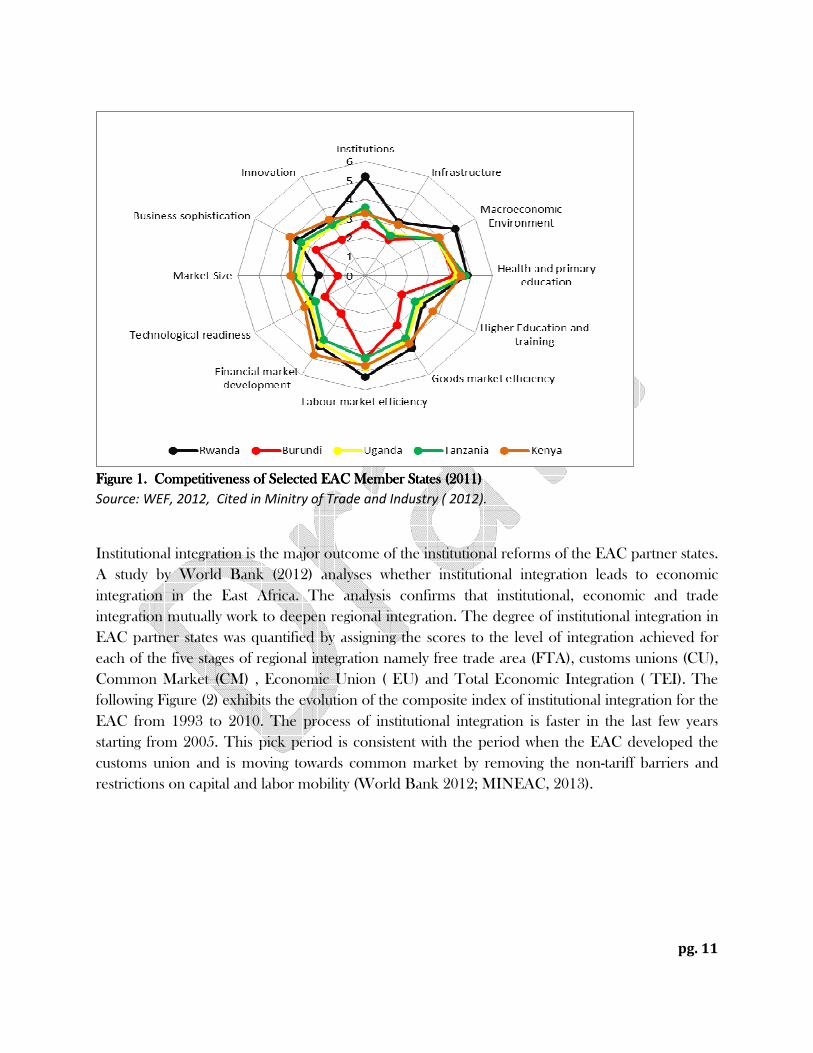
Furthermore, more policy reforms were crafted in tune of trade liberalization, increasing and
changing patterns of financial flows, cheap and quicker transport, the growth in size and power of
corporations and advances in Information and Communication Technologies. The following
Figure (1) shows competitive scores of the EAC member states in some of the above areas.
Rwanda is ranked relatively the first with well-functioning institutions, low levels of corruption, and
relatively high personal security which combine to build confidence in investors (Ministry of Trade
and Industry, 2012). Accordingly, these areas form the most interest of EAC governments to see
how to get policy and institutional reforms right, seeing the role of the state creating base
conditions for market development, and enhancing institutional and regional integration in the
name of Eastern African Community Secretariat.
pg. 11
FigureFigureFigureFigure 1.1.1.1. Competitiveness of Selected EAC Member States (2011)Competitiveness of Selected EAC Member States (2011)Competitiveness of Selected EAC Member States (2011)Competitiveness of Selected EAC Member States (2011)
Source: WEF, 2012, Cited in Minitry of Trade and Industry ( 2012).
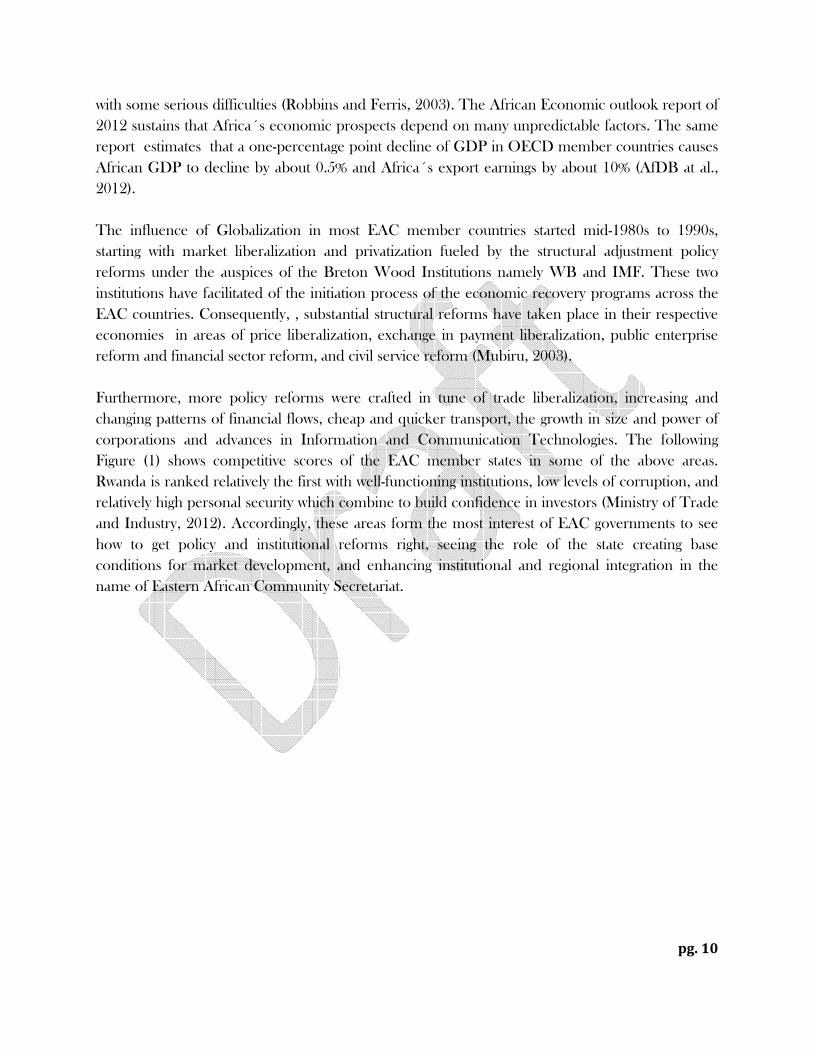
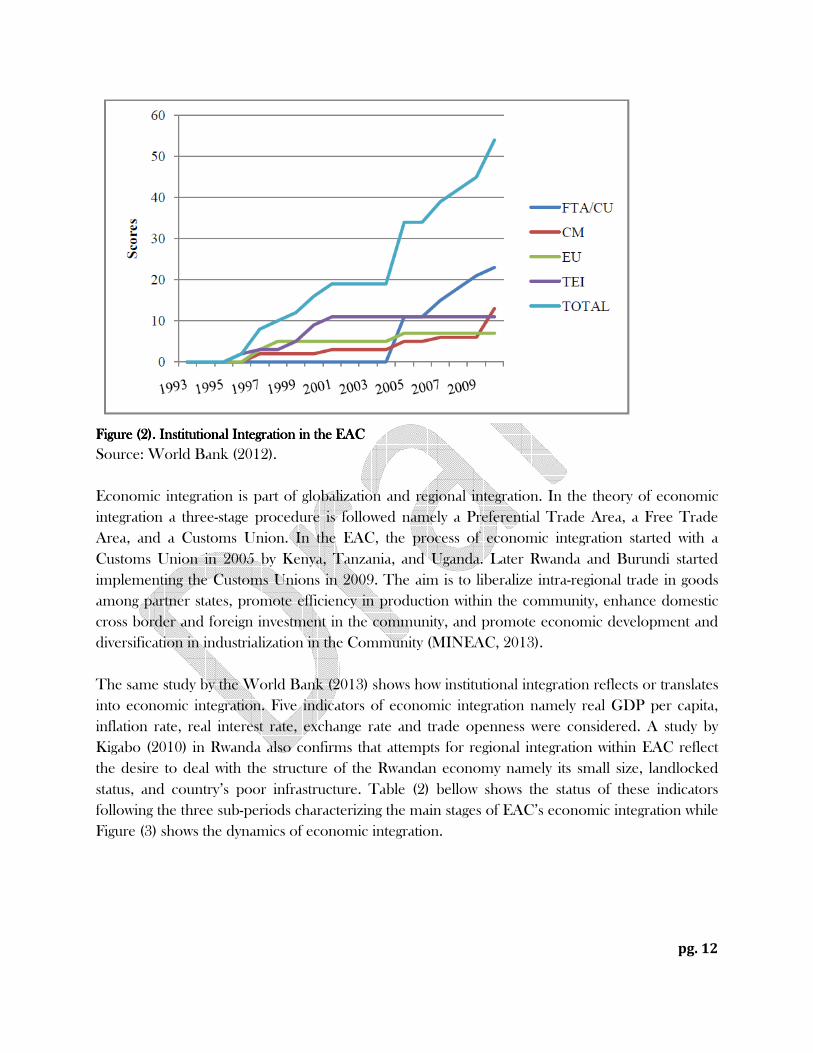
Institutional integration is the major outcome of the institutional reforms of the EAC partner states.
A study by World Bank (2012) analyses whether institutional integration leads to economic
integration in the East Africa. The analysis confirms that institutional, economic and trade
integration mutually work to deepen regional integration. The degree of institutional integration in
EAC partner states was quantified by assigning the scores to the level of integration achieved for
each of the five stages of regional integration namely free trade area (FTA), customs unions (CU),
Common Market (CM) , Economic Union ( EU) and Total Economic Integration ( TEI). The
following Figure (2) exhibits the evolution of the composite index of institutional integration for the
EAC from 1993 to 2010. The process of institutional integration is faster in the last few years
starting from 2005. This pick period is consistent with the period when the EAC developed the
customs union and is moving towards common market by removing the non-tariff barriers and
restrictions on capital and labor mobility (World Bank 2012; MINEAC, 2013).
pg. 12
Figure (2).Figure (2).Figure (2).Figure (2). Institutional Integration in the EAC Institutional Integration in the EAC Institutional Integration in the EAC Institutional Integration in the EAC
Source: World Bank (2012).
Economic integration is part of globalization and regional integration. In the theory of economic
integration a three-stage procedure is followed namely a Preferential Trade Area, a Free Trade
Area, and a Customs Union. In the EAC, the process of economic integration started with a
Customs Union in 2005 by Kenya, Tanzania, and Uganda. Later Rwanda and Burundi started
implementing the Customs Unions in 2009. The aim is to liberalize intra-regional trade in goods
among partner states, promote efficiency in production within the community, enhance domestic
cross border and foreign investment in the community, and promote economic development and
diversification in industrialization in the Community (MINEAC, 2013).
The same study by the World Bank (2013) shows how institutional integration reflects or translates
into economic integration. Five indicators of economic integration namely real GDP per capita,
inflation rate, real interest rate, exchange rate and trade openness were considered. A study by
Kigabo (2010) in Rwanda also confirms that attempts for regional integration within EAC reflect
the desire to deal with the structure of the Rwandan economy namely its small size, landlocked
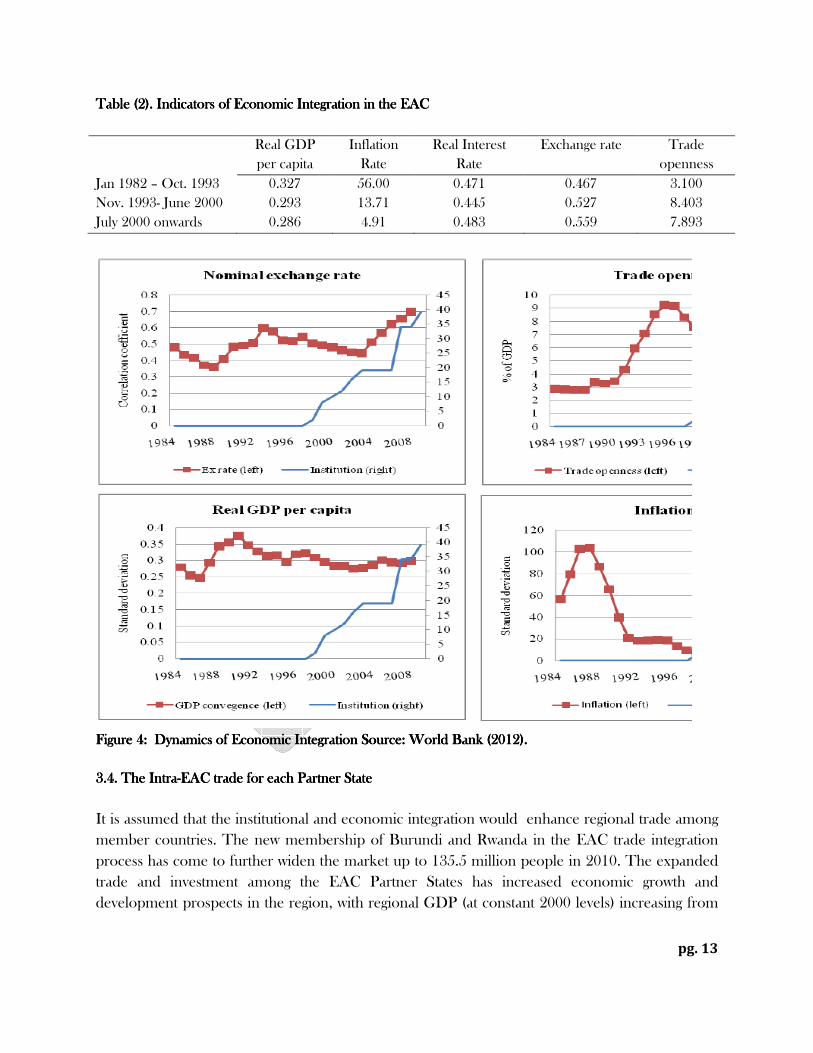
status, and country’s poor infrastructure. Table (2) bellow shows the status of these indicators
following the three sub-periods characterizing the main stages of EAC’s economic integration while
Figure (3) shows the dynamics of economic integration.
pg. 13
Table (Table (Table (Table (2222)))).... Indicators of Economic Integration in the EAC Indicators of Economic Integration in the EAC Indicators of Economic Integration in the EAC Indicators of Economic Integration in the EAC
Real GDP
per capita
Inflation
Rate
Real Interest
Rate
Exchange rate Trade
openness
Jan 1982 – Oct. 1993 0.327 56.00 0.471 0.467 3.100
Nov. 1993- June 2000 0.293 13.71 0.445 0.527 8.403
July 2000 onwards 0.286 4.91 0.483 0.559 7.893
Figure 4:Figure 4:Figure 4:Figure 4: Dynamics of Economic Integration Dynamics of Economic Integration Dynamics of Economic Integration Dynamics of Economic Integration SouSouSouSource: World Bank (2012). rce: World Bank (2012). rce: World Bank (2012). rce: World Bank (2012).
3.43.43.43.4. The Intra. The Intra. The Intra. The Intra----EAC trade for each Partner StateEAC trade for each Partner StateEAC trade for each Partner StateEAC trade for each Partner State
It is assumed that the institutional and economic integration would enhance regional trade among
member countries. The new membership of Burundi and Rwanda in the EAC trade integration
process has come to further widen the market up to 135.5 million people in 2010. The expanded
trade and investment among the EAC Partner States has increased economic growth and
development prospects in the region, with regional GDP (at constant 2000 levels) increasing from
pg. 14
US$42.4 billion in 2006 to 74.5 billion in 2009 and is expected to reach $ 80 billion in 2012.
Uganda, Rwanda and Tanzania sustained incremental growth trends between 2006 and 2008.
The decline in 2009 was in part caused by the effects of the global financial crisis, high fuel prices,
draught among others. The Kenyan economy in addition suffered from the effects of the 2007
post election crisis. Burundi despite her political challenges continues to experience positive
growth rates. The projections for 2010 generally indicate the economies are on re-bound. Kenya’s
economy remains relatively large at about 35.7% compared to that of the other EAC partner states.
The prospects are high for all partner states to achieve an economic growth rates averaging over 7
per cent that can ensure realization of economic and human development in the long term. The
per capita incomes, though generally low, depict steady increase over time but way below the
benchmark of US$ 3,000 of a middle income status. The per capita levels of the EAC partner
states are consistent with low income.
Burundi’s leading exports include gold, tea and mate, sugar, coffee, hides and skin. Kenya is a
leading importer of Burundi’s commodities except sugar, molasses and honey which Rwanda is
a leading importer. Further, Burundi’s coffee exports are destined to all the EAC partner states,
but Tanzania and Uganda are leading recipients. Kenya’s trade with the rest of the EAC partner
states is based on petroleum products, articles of apparel, construction materials (lime and
cement), steel and soaps, cleansers and polishes.
The leading market destination in EAC is Uganda. However, all the EAC partner states are
leading recipients of Kenya’s exports particularly on petroleum products. Rwanda’s trading
commodities include tea, coffee, ores and concentrates, hides and skins and petroleum
products. From 2010, it is evident that Rwanda’s exports destinations are Kenya, Tanzania and
Uganda. Burundi’s leading imports from Rwanda is petroleum products.
Fish, tea, cotton, halogen salt, maize and textile products are Tanzania’s leading trade
commodities in EAC. Most of Tanzania’s exports are destined to Kenya, then to the rest of the
EAC member states. Kenya is a leading importer of Tanzania’s trade commodities except
elements/oxides/halogen salt to which Burundi is a leading importer. Of all Tanzania’s trade
commodities, Kenya imports mostly tea, fish and cotton which constitute over 90 per cent of
total Tanzania’s exports each. Uganda’s leading trading commodities are destined to all the
EAC partner states with vegetables, steel, maize and tobacco being imported by all the countries
in EAC. Most of Uganda’s tea exports are destined to Kenya and while electric current is
supplied to Kenya, Rwanda and Tanzania. The following Table (…) generally positive trends for
all EAC countries in terms of exports and imports as also depicted in Figure (4) bellow.
pg. 15
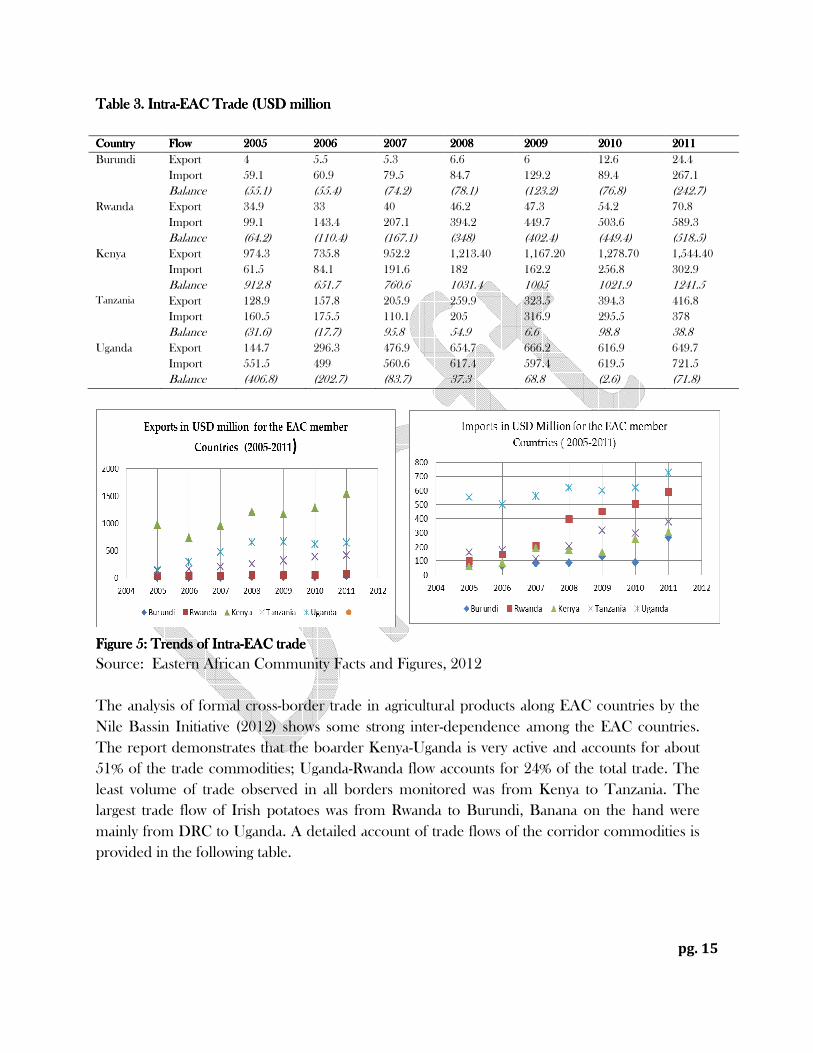
Table Table Table Table 3333.... IntraIntraIntraIntra----EAC EAC EAC EAC Trade (Trade (Trade (Trade (USD millionUSD millionUSD millionUSD million
Country Country Country Country Flow Flow Flow Flow 2005200520052005 2006200620062006 2007200720072007 2008200820082008 2009200920092009 2010201020102010 2011201120112011
Burundi Export 4 5.5 5.3 6.6 6 12.6 24.4
Import 59.1 60.9 79.5 84.7 129.2 89.4 267.1
Balance (55.1) (55.4) (74.2) (78.1) (123.2) (76.8) (242.7)
Rwanda Export 34.9 33 40 46.2 47.3 54.2 70.8
Import 99.1 143.4 207.1 394.2 449.7 503.6 589.3
Balance (64.2) (110.4) (167.1) (348) (402.4) (449.4) (518.5)
Kenya Export 974.3 735.8 952.2 1,213.40 1,167.20 1,278.70 1,544.40
Import 61.5 84.1 191.6 182 162.2 256.8 302.9
Balance 912.8 651.7 760.6 1031.4 1005 1021.9 1241.5 Tanzania Export 128.9 157.8 205.9 259.9 323.5 394.3 416.8
Import 160.5 175.5 110.1 205 316.9 295.5 378
Balance (31.6) (17.7) 95.8 54.9 6.6 98.8 38.8
Uganda Export 144.7 296.3 476.9 654.7 666.2 616.9 649.7
Import 551.5 499 560.6 617.4 597.4 619.5 721.5
Balance (406.8) (202.7) (83.7) 37.3 68.8 (2.6) (71.8)
Figure 5: Figure 5: Figure 5: Figure 5: Trends of IntraTrends of IntraTrends of IntraTrends of Intra----EAC tradeEAC tradeEAC tradeEAC trade
Source: Eastern African Community Facts and Figures, 2012
The analysis of formal cross-border trade in agricultural products along EAC countries by the
Nile Bassin Initiative (2012) shows some strong inter-dependence among the EAC countries.
The report demonstrates that the boarder Kenya-Uganda is very active and accounts for about
51% of the trade commodities; Uganda-Rwanda flow accounts for 24% of the total trade. The
least volume of trade observed in all borders monitored was from Kenya to Tanzania. The
largest trade flow of Irish potatoes was from Rwanda to Burundi, Banana on the hand were
mainly from DRC to Uganda. A detailed account of trade flows of the corridor commodities is
provided in the following table.
pg. 16
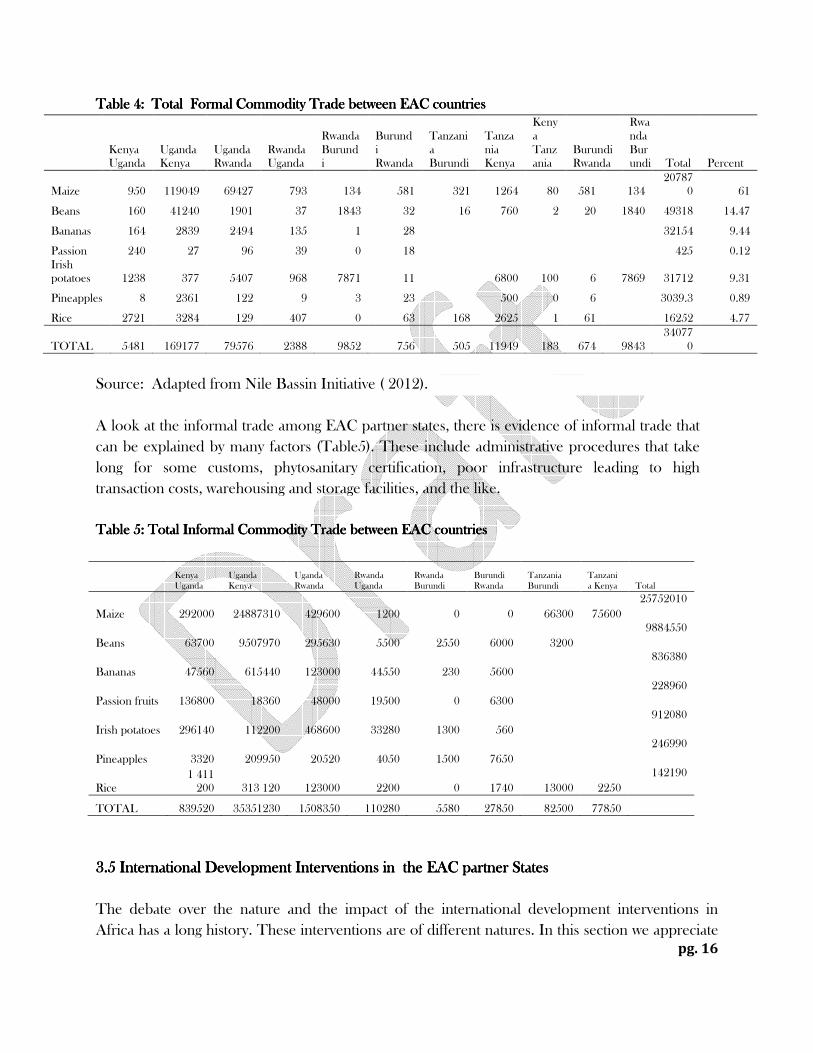
Table Table Table Table 4444: Total : Total : Total : Total Formal Formal Formal Formal Commodity Trade between EAC countries Commodity Trade between EAC countries Commodity Trade between EAC countries Commodity Trade between EAC countries
Kenya Uganda
Uganda Kenya
Uganda Rwanda
Rwanda Uganda
Rwanda Burundi
Burundi Rwanda
Tanzania Burundi
Tanzania Kenya
Kenya Tanzania
Burundi Rwanda
Rwanda Burundi Total Percent
Maize 950 119049 69427 793 134 581 321 1264 80 581 134 20787
0 61
Beans 160 41240 1901 37 1843 32 16 760 2 20 1840 49318 14.47
Bananas 164 2839 2494 135 1 28 32154 9.44
Passion 240 27 96 39 0 18 425 0.12 Irish potatoes 1238 377 5407 968 7871 11 6800 100 6 7869 31712 9.31
Pineapples 8 2361 122 9 3 23 500 0 6 3039.3 0.89
Rice 2721 3284 129 407 0 63 168 2625 1 61 16252 4.77
TOTAL 5481 169177 79576 2388 9852 756 505 11949 183 674 9843 34077
0
Source: Adapted from Nile Bassin Initiative ( 2012).
A look at the informal trade among EAC partner states, there is evidence of informal trade that
can be explained by many factors (Table5). These include administrative procedures that take
long for some customs, phytosanitary certification, poor infrastructure leading to high
transaction costs, warehousing and storage facilities, and the like.
TableTableTableTable 5555:::: Total Informal Commodity Trade between EAC countriesTotal Informal Commodity Trade between EAC countriesTotal Informal Commodity Trade between EAC countriesTotal Informal Commodity Trade between EAC countries
Kenya Uganda
Uganda Kenya
Uganda Rwanda
Rwanda Uganda
Rwanda Burundi
Burundi Rwanda
Tanzania Burundi
Tanzania Kenya Total
Maize 292000 24887310 429600 1200 0 0 66300 75600
25752010
Beans 63700 9507970 295630 5500 2550 6000 3200
9884550
Bananas 47560 615440 123000 44550 230 5600
836380
Passion fruits 136800 18360 48000 19500 0 6300
228960
Irish potatoes 296140 112200 468600 33280 1300 560
912080
Pineapples 3320 209950 20520 4050 1500 7650
246990
Rice 1 411 200 313 120 123000 2200 0 1740 13000 2250
142190
TOTAL 839520 35351230 1508350 110280 5580 27850 82500 77850
3.5 International Dev3.5 International Dev3.5 International Dev3.5 International Development Interventions in the EAC pelopment Interventions in the EAC pelopment Interventions in the EAC pelopment Interventions in the EAC partartartartnernernerner StatesStatesStatesStates
The debate over the nature and the impact of the international development interventions in
Africa has a long history. These interventions are of different natures. In this section we appreciate
pg. 17
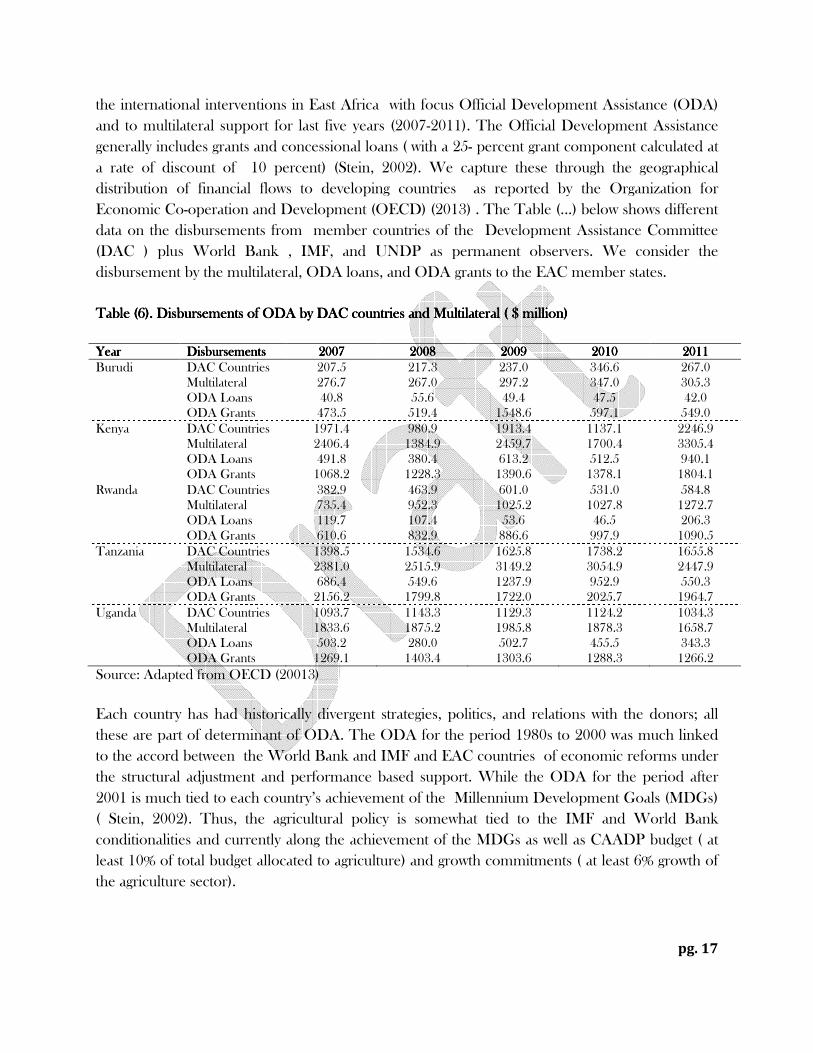
the international interventions in East Africa with focus Official Development Assistance (ODA)
and to multilateral support for last five years (2007-2011). The Official Development Assistance
generally includes grants and concessional loans ( with a 25- percent grant component calculated at
a rate of discount of 10 percent) (Stein, 2002). We capture these through the geographical
distribution of financial flows to developing countries as reported by the Organization for
Economic Co-operation and Development (OECD) (2013) . The Table (...) below shows different
data on the disbursements from member countries of the Development Assistance Committee
(DAC ) plus World Bank , IMF, and UNDP as permanent observers. We consider the
disbursement by the multilateral, ODA loans, and ODA grants to the EAC member states.
Table (Table (Table (Table (6666)))). . . . DisbursementsDisbursementsDisbursementsDisbursements of ODA by DAC countries and Multilateral ( of ODA by DAC countries and Multilateral ( of ODA by DAC countries and Multilateral ( of ODA by DAC countries and Multilateral ( $ million) $ million) $ million) $ million)
YearYearYearYear DisbursementsDisbursementsDisbursementsDisbursements 2007200720072007 2008200820082008 2009200920092009 2010201020102010 2011201120112011
Burudi DAC Countries 207.5 217.3 237.0 346.6 267.0 Multilateral 276.7 267.0 297.2 347.0 305.3 ODA Loans 40.8 55.6 49.4 47.5 42.0 ODA Grants 473.5 519.4 1548.6 597.1 549.0
Kenya DAC Countries 1971.4 980.9 1913.4 1137.1 2246.9 Multilateral 2406.4 1384.9 2459.7 1700.4 3305.4 ODA Loans 491.8 380.4 613.2 512.5 940.1 ODA Grants 1068.2 1228.3 1390.6 1378.1 1804.1
Rwanda DAC Countries 382.9 463.9 601.0 531.0 584.8 Multilateral 735.4 952.3 1025.2 1027.8 1272.7 ODA Loans 119.7 107.4 53.6 46.5 206.3 ODA Grants 610.6 832.9 886.6 997.9 1090.5
Tanzania DAC Countries 1398.5 1534.6 1625.8 1738.2 1655.8 Multilateral 2381.0 2515.9 3149.2 3054.9 2447.9 ODA Loans 686.4 549.6 1237.9 952.9 550.3 ODA Grants 2156.2 1799.8 1722.0 2025.7 1964.7
Uganda DAC Countries 1093.7 1143.3 1129.3 1124.2 1034.3 Multilateral 1833.6 1875.2 1985.8 1878.3 1658.7 ODA Loans 503.2 280.0 502.7 455.5 343.3 ODA Grants 1269.1 1403.4 1303.6 1288.3 1266.2
Source: Adapted from OECD (20013)
Each country has had historically divergent strategies, politics, and relations with the donors; all
these are part of determinant of ODA. The ODA for the period 1980s to 2000 was much linked
to the accord between the World Bank and IMF and EAC countries of economic reforms under
the structural adjustment and performance based support. While the ODA for the period after
2001 is much tied to each country’s achievement of the Millennium Development Goals (MDGs)
( Stein, 2002). Thus, the agricultural policy is somewhat tied to the IMF and World Bank
conditionalities and currently along the achievement of the MDGs as well as CAADP budget ( at
least 10% of total budget allocated to agriculture) and growth commitments ( at least 6% growth of
the agriculture sector).
pg. 18
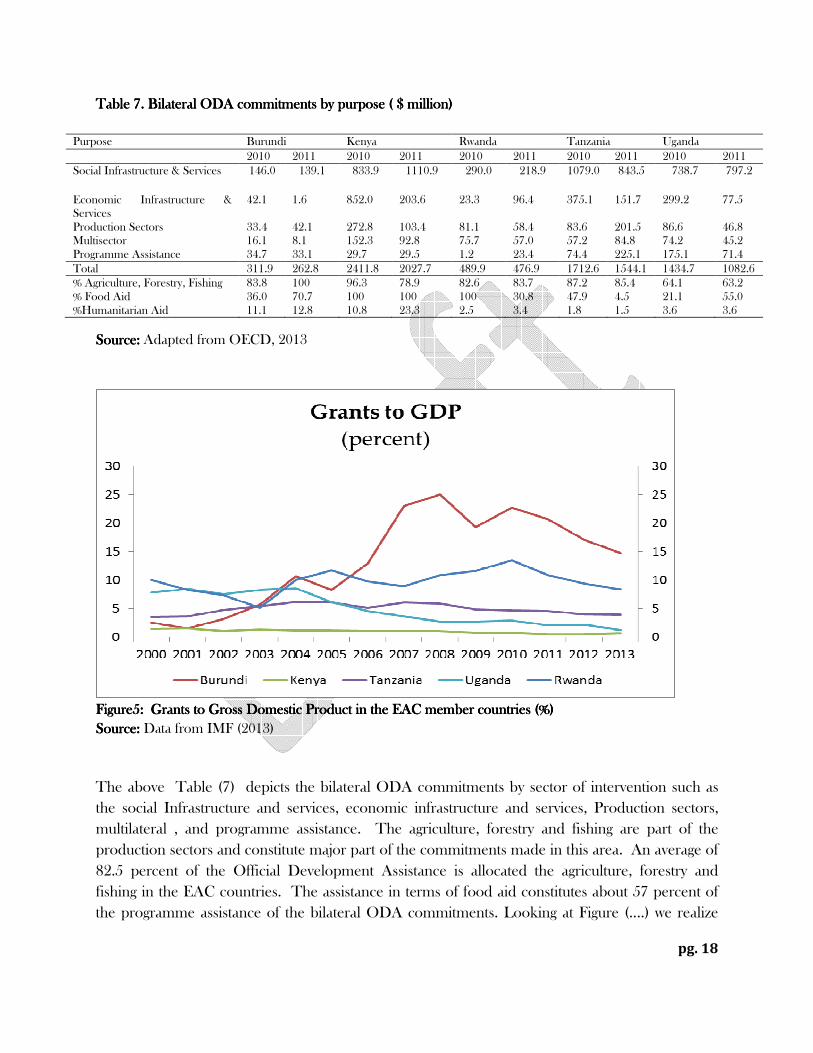
TableTableTableTable 7. 7. 7. 7. Bilateral ODA commiBilateral ODA commiBilateral ODA commiBilateral ODA commitments by purposetments by purposetments by purposetments by purpose ( $ million) ( $ million) ( $ million) ( $ million)
Purpose Burundi Kenya Rwanda Tanzania Uganda
2010 2011 2010 2011 2010 2011 2010 2011 2010 2011
Social Infrastructure & Services 146.0 139.1 833.9 1110.9 290.0 218.9 1079.0 843.5 738.7 797.2
Economic Infrastructure & Services
42.1 1.6 852.0 203.6 23.3 96.4 375.1 151.7 299.2 77.5
Production Sectors 33.4 42.1 272.8 103.4 81.1 58.4 83.6 201.5 86.6 46.8 Multisector 16.1 8.1 152.3 92.8 75.7 57.0 57.2 84.8 74.2 45.2 Programme Assistance 34.7 33.1 29.7 29.5 1.2 23.4 74.4 225.1 175.1 71.4
Total 311.9 262.8 2411.8 2027.7 489.9 476.9 1712.6 1544.1 1434.7 1082.6
% Agriculture, Forestry, Fishing 83.8 100 96.3 78.9 82.6 83.7 87.2 85.4 64.1 63.2 % Food Aid 36.0 70.7 100 100 100 30.8 47.9 4.5 21.1 55.0 %Humanitarian Aid 11.1 12.8 10.8 23.3 2.5 3.4 1.8 1.5 3.6 3.6
Source:Source:Source:Source: Adapted from OECD, 2013
Figure5: Figure5: Figure5: Figure5: Grants to Gross Domestic Product in the EAC member countries (%) Grants to Gross Domestic Product in the EAC member countries (%) Grants to Gross Domestic Product in the EAC member countries (%) Grants to Gross Domestic Product in the EAC member countries (%)
Source: Source: Source: Source: Data from IMF (2013)
The above Table (7) depicts the bilateral ODA commitments by sector of intervention such as
the social Infrastructure and services, economic infrastructure and services, Production sectors,
multilateral , and programme assistance. The agriculture, forestry and fishing are part of the
production sectors and constitute major part of the commitments made in this area. An average of
82.5 percent of the Official Development Assistance is allocated the agriculture, forestry and
fishing in the EAC countries. The assistance in terms of food aid constitutes about 57 percent of
the programme assistance of the bilateral ODA commitments. Looking at Figure (....) we realize
pg. 19
that Burundi and Rwanda have the highest percentage Grant/GDP starting from 2005 onwards.
Kenya has the lowest compared to the rest.
3.3.3.3.6666.... PublicPublicPublicPublic----Private Partnerships and the Agriculture DevelopmentPrivate Partnerships and the Agriculture DevelopmentPrivate Partnerships and the Agriculture DevelopmentPrivate Partnerships and the Agriculture Development
In this sub-section we follow a historical perspective to show how the public private paternerships
(PPPs) have evolved over time in the EAC and what challenges or areas that need future
considerations.
The EAC aims to ensure food security, poverty reduction and improvement of standards of
living. Thus, Agriculture and Food Security are key areas of co-operation by Partner States as
outlined in Chapter 18 of the Treaty. The Partner States are mandated to undertake a scheme for
the rationalisation of agricultural production in the sustainability of National Agricultural
Programmes in order to ensure: (1) a common agricultural policy, (2) food sufficiency within the
community, (3) an increase in the production of crops, livestock, fisheries and forest products for
domestic consumption, exports within and outside the community and as inputs to agro-based
industries within the community, (4) post-harvest preservation and conservation and improved
food processing. The Partner States are already cooperating on a number of areas in agriculture
and rural development such as food security, control of trans-boundary animal diseases,
environnemental management, and sanitary and phytosanitary issues. This policy aims at
strenghtening this co-peration. However, the current state of knowledge shows that states only
cannot achieve much in this area. Private organistions are called on board to help carrying the
heavy load.
The agricultural sector is dominated by smallholder mixed farming of livestock, food crops, cash
crops, fishing and acquaculture. The major food crops are maize, rice, pottatoes, bananas, cassava,
vegetables, wheat, sorghum, millet and pulses. Most of these are also sold and could be regarded as
cash crops. Cash crops include: tea, cotton, coffee, pyrethrum, sugarcane, sisal, horticultural crops,
oil-crops, cloves, tobacco, coconuts and cashew nuts. The livestock sub-sector consists of cattle,
sheep, goats, and camels, mainly for meat and milk production; pigs and poultry for white meat
and eggs respectively, hides and skins for export and industrial processing. Fish and fisheries
products include both fresh water fish from rivers, dams and lakes and marine fish from the indian
Ocean. Forestry products include fruits, honey, herbal medicine, timber and wood for fuel.
pg. 20
4.4.4.4. Policy processes and Conditions for Agricultural transformationPolicy processes and Conditions for Agricultural transformationPolicy processes and Conditions for Agricultural transformationPolicy processes and Conditions for Agricultural transformation–––– A case study A case study A case study A case study
of Rwandaof Rwandaof Rwandaof Rwanda
An Agricultural policy observatory provides a brief and simple guide to the laws and policies in the
Rwandan agricultural sector (Alinda F. and Abbott P., 2012). In view of findings from the above sub-
sections, this sub-section gives key highlights from the Rwandan experience on policy processes
and under what condition the on-going agricultural transformation evolve. We also show how
effective agricultural policies can reduce poverty and ensure food security and nutrition security in
sub-section 4.2..
4444.1. .1. .1. .1. Policies and Programs Relevant to Agricultural Transformation in Policies and Programs Relevant to Agricultural Transformation in Policies and Programs Relevant to Agricultural Transformation in Policies and Programs Relevant to Agricultural Transformation in Rwanda Rwanda Rwanda Rwanda
In this section we present the most recent agricultural policies and related programs that guide
strategic plan for agricultural transformation (PSTA) and economic development ad poverty
reduction strategy (EDPRS. These include
PSTA-II, the 2010 Development Driven Trade Policy Framework, the National Rice Policy, the
Tea and Coffee Strategy for Rwanda, the National Decentralization Policy, the Decentralization
Implementation Programme, the National Agricultural Extension Services Strategy, the 2005 Land
Policy and Gender Equity Laws. The intent here is to give highlights on the description and the
rationale of each of this policy and how they complement the National Agricultural Policy. We
also give some areas of the effectiveness of these policies.
1. The 2010 Development Driven Trade Policy Framework: This policy was prepared by the
United Nations Conference on Trade and Development in collaboration with the Ministry of
Trade and Industry (UNCTD 2010). The policy directs that foreign direct investment should
enable diversified exports and markets development, build local processing industries that add
value to exports especially in agriculture but also in manufacturing and services. These expected
contributions of direct investments are in line with the prospects of the EDPRS2.
2. The National Rice Policy, Rwanda is seeking to attain self-sufficiency and competitiveness in
rice production in the next 10 years. The NRP sets out interventions aimed at enhancing the
productivity levels and raising the standards of post-harvest processing of rice in a bid to improve
volume (quantity) and value (quality) of rice looking forward to create self-sufficiency in the
domestic rice market. The PSTA is the agriculture sector strategy for achieving the above
EDPRS goals and objectives in the domain of agricultural development
3. Coffee Strategy for Rwanda (2009-2012): Coffee is one of Rwanda’s most important export and
cash crop with almost half million coffee growers. Over the last decade, the industry has been
steadily growing; however, it is falling short of targets set for it in 2002. Part of explanation is
insufficient production of coffee cherries, high operating costs, weak management skills, slow
implementation of value-adding processes, and lack of adequate data to monitor and evaluate the
pg. 21
progress. Rwanda’s targets are to move from production of 19,900 tonnes (average from 2005-
2007) to 33,000 tons during this strategy cycle with an estimated revenue of USD 115 million. This
is a comprehensive strategy with OCIR-Café leading the coordination efforts.
4. The National Decentralization Policy (NDP): Policy formulation and implementation relate to
the local governance structures. The nature of planning, alignment and effectiveness of the
structures can influence policy effectiveness or trigger amendment and even dissolution of some
policies. The existence, alignment and effectiveness of governance structures can favour, promote
or discourage agricultural programs implementation. Since 2000 the government of Rwanda has
pursued the National Decentralization Policy (NDP). This policy is reflect the government’s
commitment empower (politically, socially, and technically) local population fight against poverty
(MINLOC, 2004). The NDP is an umbrella of the Decentralization Implementation Program
(DIP) and the Agricultural Extension Strategy (NAES) under which agricultural extension services
are delivered to farmers. The reporting system is from sector to district, from district to province
and from province to the Ministry of Local Government. In the new context of decentralized
extension, the main functions of the Ministry for Agriculture and Animal Resources (MINAGRI)
comprise: (i) coordination and planning of agricultural development programs, (ii) agricultural
sector information function, (iii) monitoring and evaluation function, (iv) regulation and control
function, (v) resources mobilization function. The MINAGRI receives information from districts
to be able to properly plan the development of the agricultural sector, while districts get support
from MINAGRI to ensure coherence and effectiveness in formulating and implementing policies
and agricultural development programs.
5. The Decentralization Improvement Program (2000-2003, 2004-2008): In a bid to improve
governance in local governments, streamlined in the EDPRS and Vision 2020, the Ministry of
Local Government has pursued a three-year Decentralization Implementation Programme (DIP)
since 2003. More specifically, the DIP provides a positive synergy to agricultural programs aiming
to contribute to the PSTA objectives to “improve the production and productivity of rice crop
through production intensification, promote the use of farm mechanization in appropriate forms,
promote development of agro-processing industries, enhance agricultural technology and develop
road infrastructures in a bid to transform its agriculture”.
6. The National Land Policy (NLP) and Gender Equality Laws: Rwanda’s Land Policy has gone
through many transitions since the colonial period. During the colonial period, the Belgian
colonial administration established the decree of 1885 concerning land. Only the colonial public
officer could guarantee the right to occupy land taken. The colonial government also introduced
the written law into the “Codes and Laws of Rwanda”. After independence, the government of the
time recognized the very important role played by the commune in the administration of land. The
commune through the “communal law” of 23/01/1963 held responsibility over conservation of
rights concerning registered land (Rurangwa, 2002). The period post the 1994 Genocide against
pg. 22
Tutsi, the government of Rwanda through the Ministry of lands (MINITERE), remains committed
to clarify the land tenure system and have an appropriate land policy and land law. This
commitment is reflected in the Rwanda’s 2005 Land Policy and the current law governing land in
Rwanda of June 2013.
7. Strategies to Agricultural Transformation (Since 2010): This section presents the most recent
strategies to achieve agricultural transformation as set out in the PSTA II. The PSTA-II is a 5
years strategic plan for agricultural transformation that translates regional and national
development goals in the domain of agriculture development. All activities under this strategy aim
at achieving food security, reduce hunger, and reduce poverty; which is consistent with MDG1. To
operationalize this strategy and make it more inclusive, some coordination mechanisms were put
in place such as the Agriculture Sector Working Group (AGSWG). With reference to the PSTA,
a country agriculture investment plan is in place to guide investments in core sector development
programmes in the agriculture sector, highlighting roles of various contributors (government,
private, and civil societies). It is within this framework that Rwanda was able to access the Global
Agriculture and Food Security Fund (GAFSP). Rwanda has a clear vision, strategy and investment
plan to improve food security in line with CAADP budget and growth commitments.
8. The National Agricultural Extension Strategy (NAES): Rwanda’s NAES is envisioned to “ensure
ideal conditions for the dissemination and exchange of information between producers, farmer
organizations and other partners in order to transform and modernize the agricultural sector so
that it can contribute effectively to achieve the millennium development goals, CAADP goals,
Vision 2020, and the Economic Development and Poverty Reduction Strategy objectives. Fitting in
the objectives of Vision 2020, EDPRS and PSTA, the extension strategy comes under PSTA-II
“Support to the Professionalization of Producers” is well aligned with Rwanda’s development
objectives as well.
9. The Agricultural Mechanization Strategy–AMS (2010-2015): The AMS (MINAGRI, 2010) is
Rwanda’s road map to creating conditions that are conducive to the adoption of appropriate farm
tools, implements and machinery in the most effective and efficient way. Agricultural
mechanization refers to the use of tools, implements and machines for agricultural land
development, crop production, harvesting, and preparation for storage, storage, and on-farm
processing. The strategy responds to agricultural sector challenges such as over-reliance on less
productive and less efficient human labour and seasonal labour and constraints from the rapidly
changing demographic trends such as urban migration, ageing rural population, ageing farmers,
and the HIV/AIDS pandemic that add more concerns on labour availability. It seeks to enhance
the adoption of mechanization looking forward to enhanced crop productivity, increasing the area
being cultivated for food crops and consequently contribute to food security. It borrows from
successful experiences from Asia, Latin America and in some African countries where labour
pg. 23
productivity was greatly enhanced by using alternate farm powers such as motorized engines and
draught animals. The strategy focuses on mechanization in the commodity value chain thereby
enhancing farm produce quality, value, marketability and consequently farm profitability.
10. The National Post-Harvest Staple Crop Strategy (2011-2016): The National Post-Harvest
Strategy (MINAGRI, 2011) is a policy framework to assist with strengthening the harvesting, post-
harvest handling, trade, storage, and marketing within staple crop value chains; strengthening
markets and linkages for farmers; and reducing post-harvest losses. The strategy addresses the
challenges that accrued following successful implementation of the Crop Intensification Program
(CIP). Basically, the CIP resulted in increased crop yields with unanticipated surpluses in key
staple grains and cereals. The strategy therefore responds to the heavy post-harvest losses that
accrue from the lack of capacity in post-harvest handling and storage. The strategy is MINAGRI’s
initiative through the Post-Harvest Task Force that was formed in 2009, essentially to maximize net
profits for small-scale farmers and reduce food insecurity by strengthening staple crop value chains
and reducing post-harvest losses. The 5-year action plan, approved in March 2011 by the
Agriculture Sector Working Group, remains Rwanda’s guiding strategy to address sector-wide post-
harvest loss issues by several ministries and agencies.
11. The Agriculture Gender Strategy (2010):::: The gender strategic goal is to ensure that agricultural
output and incomes increase rapidly under sustainable production systems for all groups of
farmers, and that food security ensured for all the population by 2012. The overall objective of the
gender strategy is to contribute to poverty reduction and sustainable development through
institutionalization of gender responsive programming (planning and budgeting), implementation,
monitoring and reporting systems and improve gender equality in the agriculture sector.
12. Agricultural Programs and Project Initiatives (Since 2008): In this section, we present a brief
highlight of the most recent programs that work towards contributing to the PSTA and the
EDPRS, the national economic and agricultural development agenda. Among these programs are:
the “Girinka program” “One Cow per poor Family”, the Umutara Community Resource and
Infrastructure Development Project (PDRCIU), the Purchase for Progress initiative (P4P), and the
Millennium Village Project.
13. Key Funding Partners in Agricultural Programs:::: In pursuit of PSTA-II, the Government of
Rwanda, under the Ministry of Agriculture and Animal Resources (MINAGRI), attracts
international co-operations. Among the partners include the Belgian Government, World Bank,
FAO, IFAD, BTC, JICA, DFID, EU, WFP, UNDP, and CIDA, among others. The partners are
mainly international development agencies who initiate and fund projects that contribute directly
and indirectly to agricultural productivity and growth.
pg. 24
4.2. 4.2. 4.2. 4.2. EEEEffectiffectiffectiffectiveness of the Current Agricultural Policies: Impact on Agricultural Growth and Povertyveness of the Current Agricultural Policies: Impact on Agricultural Growth and Povertyveness of the Current Agricultural Policies: Impact on Agricultural Growth and Povertyveness of the Current Agricultural Policies: Impact on Agricultural Growth and Poverty
ReductionReductionReductionReduction
In this section we present a highlight on the status of the economy as of 2006, upon which the
EDPRS was built. We provide an overview of Rwanda’s progress towards meeting the EDPRS’
(2008-2011) aspirations with regard to agricultural productivity, growth and poverty reduction and
highlight the current status of the agricultural contribution to economic growth relative to other
sectors. Finally, we acknowledge that the government of Rwanda pursues a development strategy
led by the agricultural sector. We consider the MINAGRI’s agricultural growth and poverty
reduction strategy (PSTA II) and draw an insight into the extent to which the poor can benefit
from PSTA II.
In the period 2000-2005, the government of Rwanda implemented the Poverty Reduction Strategy
(PRS) to manage the transition period of rehabilitation and reconstruction post 1994 war and
Genocide against Tutsi. The strategy registered progress but with insignificant contribution to
poverty reduction. This was attributed to the structural adjustment of the economy and having the
service sector taking a leading role to the economic development. . In this period, GDP increased
at an annual rate of 6.4 per cent while poverty levels stood at 56.7 per cent in 2006 compared to
44.9 percent in 2010/2011. The extreme poverty rate reduced from 35.8 percent to 24.1 percent
during the same period. Poverty remained high (91%) in farming households with land shortage as
key challenge towards agricultural production. The proportion of land protected against soil
erosion was 40 per cent while 15,000 hectares were under irrigation (EICV2). The percentage of
people purchasing chemical fertilizers was 11 % in 2005 compared to 28.9 percent in 2012.
Average fertilizer use was 6 kg per hectare in 2007 against 30 kg per hectare in 20013. In the study
on economic transformation of Rwanda, Malunda (2010) observed a steady increase in both
agricultural labour and land productivity in the period 2000 to 2008. In the same period, there
was a decrease in employment in the agriculture sector and an increase in employment in the
manufacturing sector. The current estimate of farm employment is 72.6%, of which women are the
majority compared, to 27.4 non-farm employment. Despite its declining contribution to GDP, the
agricultural sector remains the most dominant to Rwanda’s economy contributing 32 per cent to
GDP compared to 46% generated by the tertiary sector in 2011. Currently Rwanda is considered
among the fast African growing countries ( Africa progress report, 2012) and the agriculture sector
receives the merits.
The effectiveness of the agricultural policies is partly attributed to the institutional arrangement for
policy implementation. In the paper by Burruss and Bizoza (2013) it is argued that the
Agriculture policy in Rwanda is articulated in line with the overall development policy framework
contained in the Vision 2020, which, in turn, is translated to short-midterm plans and strategies
through the 7 Year government plan articulated in the EDPRS and PSTA. Accordingly, Rwanda’s
are well-elaborated policies and strategies and give clear guidance on the policy implementation.
pg. 25
The leading intent in policy design is to address the prospects of national, regional and
international development goals (such as CAADP, MDGs the G8 Cooperation Framework). In
the same paper by Burruss and Bizoza (2013) it is indicated the GoR takes the lead in the design
and implementation of agricultural policies through the MINAGRI, which in turn, designs and
implements its policies and strategies through its line institutions, RAB and NAEB, and other
development partners in the sector as above indicated. The coordination of all this process is
done through the agriculture sector working group (ASWG) , soliciting input from donors and
stakeholders in an inclusive manner. But, more efforts are being made to improve on the
participation of the private and civil society organizations in the policy design and implementation.
Nevertheless, the role of the private sector is well recognized as main driver of the economic
growth; lading to achievement of national and regional development goals ( Bizimana et al. 2012).
Therefore, the effectiveness of current agricultural policies is justified by both farm-sector
institutional environment and arrangement that the government facilitated and yet to facilitate.
Another similar contributing factor to this effectiveness is the governance and leadership . Kigabo
(2010) in his paper confirms that governance and leadership factors namely charismatic
leadership, rich and positive ideology, strict political will, and lessons from the genocide and
Rwandan history are fundamental causes of the decade’s quick development. Furthermore,
increased growth in the agriculture sector is result of policies and institutions pertaining the sector.
To a larger extent, better policies in agriculture lead to agricultural growth which in turn offers
direct benefits to the poor farmers, such as income and food, contributes to broader food security
objectives, and helps establish forward linkages with higher value added industries (World Bank
and IFPRI , 2005).
pg. 26
5. 5. 5. 5. Conclusions and Conclusions and Conclusions and Conclusions and Recommendations Recommendations Recommendations Recommendations
This paper analyzes policies, institutions and international development interventions in the
agricultural development process in EAC countries. Africa and the EAC region in particular have
gone different phases of policy and institutional transformation in the last 50 years. Policy design
and institutions during the period post colonial till 1980s were much informed by the colonial
believe attributing much space to the state in the policy formulation as well as implementation. The
role of the private sector and civil society as well as local government started to be recognized
during 1980s to 2000. The last decade of 2003-2013 is marked by diversified farm-sector and
other macro-economic policies that are driving the current economies within the EAC region.
However, drawing the maximum potentials in those policies remains an area to consider in the
next 50 years of agricultural development.
The article shows also that, although tremendous effort in policing and creating institutions in the
agriculture sector, smallholder farmers are yet to cope with many challenges such as limited access
to agricultural finances and credits, limited access to inputs and output markets, poor
infrastructure, limited agricultural extension services and innovations, low agriculture productivity,
enfant agriculture-based enterprises and cooperatives, and high transaction costs within the sector.
These farmer based challenges need careful and rational joint interventions between the state and
the private sector as well as civil society organizations in line with the process of regional and
economic integration.
The institutional and economic integration in the EAC started early 2005 has already proved
positive effects in terms of economic integration indicators namely the per capita GDP, inflation
rate, real interest rate, exchange rate, and trade openness. The trade openness has led to improved
intra-trade within the EAC and cross-border trade. The analysis of exports and imports statistics
have showed positive trends of exports and imports in praise of the regional and economic
integration.
The economic development in the EAC region evolved with Official Development Assistance
from the DAC member countries with continuous participation of World Bank, IMF and UNDP
as permanent observers. During the period of 19980s to 2000, the level ODA was much
dependent on each countries divergent strategies, politics and relations with donors; while the
period after 2001 and onwards is being marked by the achievement of MDGs. The analysis of the
bilateral ODA commitment in the most recent period show that agriculture received much
attention (an average of 82.5 %) in the production sector than industry, mining, construction, trade
and tourism.
The case study of Rwanda gives some concrete examples of policies and institutions and how these
have already affected the development process in Rwanda in terms of food security and the role of
pg. 27
agriculture to GDP and job creation. However, similar to other EAC partner states, a lot still to be
done in terms data gathering to inform the measurements of agriculture policy effectiveness vis-a-
vis to other macro-economic policies.
Lessons from the review of the existing materials give light on some improvements made vis-a-vis
to policies, institutions and international development interventions in the EAC for the last 50
years. We have learnt that:
- The state has played major role in policy design, institutions establishment and
implementation, leaving a narrow space for the private sector, civil society organizations
and the community participation. However, there is currently evidence that countries have
started recognizing the need for the private sector and civil society involvement, but
mechanisms to materialize this understanding remain an area for further consideration.
Regional and international initiatives such as CAADP and Grow Africa should receive
much support to allow the private sector lead the agriculture development in the next 50
years.
- The policy design in the EAC countries draws less on evidence-based analysis.
Consequently, investment and the policy targeting fall short of sufficient facts leading to
misallocation of investments and inadequate appreciation of the sector impacts towards
economic development. In addition, this disconnect between policies and research
products or evidences fuels the dilemma between policy makers and researchers. Future
initiatives to address this dilemma could consider strengthening linkages between high
learning agriculture and research institutions, and creating a basket fund for agriculture
research and development for the EAC community.
- The existing policies and institutions as well as development interventions are addressing
challenges of small-holder farmers in a traditional way while the former are dynamic,
calling for institutional adaptation. For instance, the financial institutions need to repackage
their products ( such as crop insurance) to accommodate evolving challenges such as
climate change. Furthermore, international development interventions should also be
flexible and align with each country's strategic development frameworks through.
- Positive trends in terms of exports and imports are observed due to the ongoing
institutional and economic integration in EAC partner states, achieving further steps of the
integration process (FTA, CM, EU and TEI) is likely to induce more intra- EAC trade and
cross-border trade, value added and diversified traded products, more food production
and access to markets, leveraging on potential competitive advantages and labour mobility,
and food security. More regulations creating a conducive environment for the intra- EAC
trade are needed to be established and enforced.

pg. 28
pg. 29
ReferencesReferencesReferencesReferences
AfDB, OECD, Dev Center, UNDP , UNECA (2012). African Economic Outlook 2012. Special
theme on Promoting Youth Employment. Alinda F. and Abbott P. (2012), Agricultural Policy and Institutional framework for
Transformation of Agriculture, Economic Development and Poverty Reduction in Rwanda, Institute of Policy Analysis and Research – Rwanda, April, 2012
Bizimana, C, Hasengumukiza F, and Rwirahira John ( 2012). Trends in Key Agricultural and
Rural Development Indicators in Rwanda. Rwanda Strategic Analysis and Knowledge Support System (SAKSS), Ministry of Agriculture and Animal Resources, Kigali, Rwanda.
Burruss D and Bizoza A (2013). Rwanda Agriculture Sector: Policy and Implementation Review.
Human and Institutional Capacity Development Project in Rwanda. Kigali, Rwanda. Dorward, A., J. Kydd and C. Poulton (2005), ‘Beyond liberalisation: “developmental
coordination” policies for African smallholder agriculture’, IDS Bulletin, 36 (2), pp. 80-85. Brighton: Institute of Development Studies.
EAC (2006), Agriculture and Rural Development Policy, November 2006, Arusha, Tanzania EAC (2007), Treaty for the establishment of the East African Community, 2007, art 5; al.2,
www.eac.int/index.php, visited on 20 sepember 2013. EAC (2011), EAC Development Strategy (2011/12 – 2015/16), Deepeniing and Accelerating
Integration, One People, One Destiny, August 2011. EAC (2012). Eastern African Community Facts and Figures 2011. Arusha, Tanzania. EAC Secretariat (2010), East African Community (EAC) Food Security Action Plan (2010 –
2015), Arusha, Tanzania. Eastern Africa Farmers’ Federation (2011), Database of Agricultural Policies in East Africa: Kenya,
Rwanda, Tanzania and Uganda. Grindle, M. and J. Thomas (1991), Public Choices and Policy Change. Baltimore: Johns Hopkins
University Press. GSR (2007). Analysis for policy: evidence-based policy in practice. Government Social Research
Unit, UK.
pg. 30
Holland and Mertz (2012). USDA Assessment Missions to Rwanda: Assessing Capacity for Agricultural Data Collection and Analysis in Support of Feed the Future. Kigali, Rwanda
Kakande Namirembe (2010). Final Report on the status of achievement of MDGs by the East
African Community. Keeley, J. and I. Scoones (1999), Understanding environmental policy processes: a review, IDS
Working Paper 89. Brighton: Institute of Development Studies. Kigabo R.T ( 2010). Leadership, Policy Making, Quality of Economic Policies, and Their
Inclusiveness: The Case of Rwanda. Krueger, A. (1990), Government failures in development, Journal of Economic Perspectives,
Volume 4, Number 3 – Summer, pp. 9-23. Lidia Cabral and Ian Scoones (2006), Narratives of Agricultural Policy in Africa: What Role for
Ministries of Agriculture? March, 2006 www.future-agricultures.org, Research paper 001. Lipton, (2005). From policy aims and small-farm OECD (2001) ‘Aid to agriculture’, Organisation
for Economic Cooperation and Development. Available at http://www. oecd.org/dataoecd/40/43/2084403.pdf.
MINAGRI (2010). Enhancing Self Sufficiency and Competitiveness of Rwanda Rice. Issues and
Policy Options. Ministry of Agriculture and Animal Resources , Kigali, Rwanda. MINEAC ( 2013). [Internet]: http://www.mineac.gov.rw/index.php?id=35. Ministry of Eastern
African Community, Kigali, Rwanda. Ministry of Trade and Industry (2012). National cross-border trade strategy: A comprehensive
strategy to support Rwanda’s exports to neighbouring countries. Kigali, Rwanda Molua, E. and M. Rajab (2002), The future of agriculture in Sub-Saharan Africa: challenges and
agenda for action, paper presented at the first African Researchers’ Association seminar on Strategies for Improving the Quality of Life in Africa, Clemson University, South Carolina, 20-23 March 2002.
Mubiru E. (2003). The efffect of globalization on trade, a special focus on rural farmers in
Ouganda. World Vision International, East Africa Regional Office. Nile Bassin Initiative (2012). Analysis of Cross-border Trade in Agricultural Products along
Selected Corridors of the Nile Basin Region. Nile Basin Initiative. NELSAP/ Regional Agricultural Trade and Productivity Project Bujumbura-Burundi.
OECD (20013). Geographical Distribution of Financial Flows to Developing Countries:
Disbursements, commitments, country indicators. OECD Publishing.
pg. 31
Petit, M. (1995), Agriculture in liberalizing economies, in D. Umali-Deininger and C. Maguire (eds.) Agriculture in Liberalizing Economies: Changing Roles for Governments, Proceeding of the Fourteenth Agricultural Sector Symposium, World Bank. p.449.
Poulton, C., J. Kydd and A. Dorward (2004), Overcoming market constraints to pro-poor
agricultural growth in Sub-Saharan Africa, paper prepared for the Africa Commission, November 2004.
Richard Ndereyahaga (2010), Accession of Burundi and Rwanda to the East African Community:
Implication for Private Sector Development, Policy Brief, BIEAC no 6/2010 www.allafrica.com/stories/20070618180.html
Stein H (2002). A brief History of AID in East Africa: The Political Economy of Convergence.
University of Michigan State, East Lansing, USA. Wiggins, S. (2005), Innovation in agricultural and rural development: should we return to the
learning process?, paper presented at the IMI workshop, IFAD, November 2005. World Bank (2009), Eastern Africa: A study of the regional maize market and marketing costs.
Report No. 49831 – AFR. World Bank (2012). East African Community: Reshaping Economic Geography of East Africa
from Regional to Global Integration. Poverty Reduction and Economic Management Unit World Bank (2012). East African Community: Reshaping Economic Geography of East Africa
from Regional to Global Integration. Poverty Reduction and Economic Management Unit, Africa Region Document. Washington DC. Report No. 65699-AFR, Volume 2: Technical Annexes.
World Bank and IFPRI, 2005. Agriculture and Achieving the Millennium Development Goals.
Agriculture and Rural Development Department. 1818 H Street, N.W., Washington, D.C. 20433.

pg. 32
AnnexAnnexAnnexAnnex 1. 1. 1. 1. Agricultural Policies Agricultural Policies Agricultural Policies Agricultural Policies in EAC in EAC in EAC in EAC member states in the last decade (2003member states in the last decade (2003member states in the last decade (2003member states in the last decade (2003----2013)2013)2013)2013)
Name of the policyName of the policyName of the policyName of the policy CountCountCountCountries and year of implementationries and year of implementationries and year of implementationries and year of implementation
National Oceans and
Fisheries Policy
Kenya (2008) - - -
Cotton Policy Kenya (1990,
2006)
National Dairy
Development Policy
No. 1
Kenya (2010)
Co-operative
Development Policy
Kenya (2011)
Co-operative
Investment Policy
Kenya (2011)
No policy on sugar Kenya (2011)
Policy on Kenya
Plant Health
Inspectorate Services
(KEPHIS)
Kenya (2008)
National Livestock Policy Kenya(2008)
National Poultry Policy Kenya (2010)
Apiculture Policy Kenya( 2011)
Livestock Feeds Policy Kenya (2011)
Animal Breeding
Policy
Kenya (2011)
Fertilizer Policy Kenya (2011)
National Agricultural
Sector Extension Policy
(NASEP)
Kenya (2011)
Agricultural Sector Gender
Policy
Kenya (2011) Rwanda ()
Seed Policy and Seed and Plant
Varieties Bill
Kenya (2011)
National Horticulture Policy Kenya Rwanda
(2007)
Policy on Bioprospecting Kenya
Biotechnology Policy Kenya (2011) Rwanda
National land Policies Rwanda (2012) Tanzania
2006
Uganda

pg. 33
National Agricultural Extension
Strategy
Rwanda Uganda ()
National seed
Policy
Rwanda (2008)
Inputs fertilizers
Policy
Rwanda (2008)
Livestock policy Rwanda ()
East African Community (EAC)
Policies (Harmonized sanitary
and phytosanitary, mammals,
birds and bees and their
products).
Rwanda,Burun
di
Kenya Uganda Tanzania
Agricultural Policy Tanzania
Sisal Industry Act Tanzania
Cotton Industry Tanzania
Cashew Industry Tanzania
Pyrethrum Industry Tanzania
Coffee Industry Tanzania
Tobacco Industry Tanzania
Sugar Industry Tanzania
Tea Industry Tanzania
Fertiliser Industry Tanzania
Seed act Tanzania
Warehouse Act Tanzania
Cerals and other produces Tanzania 2009
National Irrigation
Development Policy
Tanzania 2002
National land policy Tanzania 2006
National water policy Tanzania 2009
Public Private
Partnership Policy
Tanzania2010
The National Meat Policy Uganda2003
Policy on Delivery of Veterinary
Drugs Policy
Uganda 2011
National Veterinary Drug Policy Uganda 2002
National Coffee Policy Uganda 2010
Development strategy and
Investment Plan (2010/11-
2014/15)
Uganda march
2010

pg. 34
National Agriculture Policy Uganda Rwanda Kenya Tanzania
The Uganda Food and Nutrition
Policy,
Uganda 2003
National Fisheries Policy Uganda Kenya Tanzania
The National Agricultural
Research
Policy
Uganda 2003 Rwanda Kenya Tanzania
The National Agricultural
Advisory
Services
Uganda Act
2001
Kenya Rwanda
The Seeds and Plant Act Uganda 2006
Agricultural Chemicals (Control)
Uganda Act
2006
National Co-operative
Development Policy
Uganda 2010 Rwanda
National Industrial Policy Uganda 2008
National Trade Policy (Trading
out of Poverty into Wealth and
Prosperity)
Uganda 2008
National Sanitary & Phyto-
sanitary
Policy
Uganda 2008
The Uganda Gender Policy Uganda 2007 Rwanda
National Standards Policy Uganda 2011 Rwanda
Rural Communications
Development Policy,
Uganda 2001
National Environment
Management Policy for Uganda
(1994)
Uganda 2011
The Uganda National Forestry
Policy
Uganda 2002
National Land Use Policy Uganda 2011
National Housing Cooperative
Policy
Uganda 2011
Microfinance policy Uganda 2011
Source: Source: Source: Source: Eastern Africa Farmers’ Federation (2011)