Embed Size (px)
Citation preview
1
Policies of Attraction: Colonial Rule, Property Rights and Economic Development in the Philippines
Lakshmi Iyer Harvard Business School
Noel Maurer Harvard Business School
October 2007
EXTREMELY PRELIMINARY AND INCOMPLETE.
PLEASE DO NOT DISTRIBUTE OR CITE.
Abstract: The U.S. implemented several land reforms during its occupation of the Philippines. Using data from the censuses of 1903 and 1918, we consider the im‐pact of two important changes: the redistribution of the friar lands formerly be‐longing to the Catholic Church, and the implementation of a formal land titling program. We find that the land reforms had the unintended consequence of in‐creasing the incidence of squatting; however, the friar lands program was suc‐cessful in reducing land inequality. In addition, we also investigate the impact of these reforms on the doubling of Philippine rice productivity and the decision to switch to commercial crops between 1903 and 1918.
2
1. Introduction
Can institutional change be imposed from the outside? The question is of obvious
relevance. Foreign missions—sometimes through the United Nations, sometimes
alone—are trying to reform institutions in Sierra Leone, Liberia, Iraq, Afghanistan, Kos‐
ovo, Bosnia, East Timor, the Solomon Islands, and Haiti. National and multilateral de‐
velopment agencies routinely recommend legal and institutional changes to national
governments, often with very concrete inducements. The U.S. often demands changes
in the institutions governing investment and investor protections as a condition in free
trade agreements, and the European Union requires accessant countries to adopt tens of
thousands of pages of laws and regulations. Many authors have argued, however, that
externally‐imposed systems are extremely difficult to “transplant” successfully. They
need to be adapted to local conditions, require very long times to take root, and are not
as effective as locally developed institutions.1
We use U.S. colonial rule in the Philippines as a test case of the hypothesis that ex‐
ternally‐imposed institutional reforms are extremely difficult to implement. Specifi‐
cally, we examine the impact of two major reforms to property rights undertaken by the
American colonial administrators. The first was the purchase of the “friar lands” from
the Catholic Church and their subsequent redistribution to Filipino peasants. The sec‐
ond is the implementation the Torrens system of land registration throughout the Phil‐
ippines. The Torrens system involved conducting detailed cadastral surveys and issu‐
ing formal written titles to the landholders. We should note that several developing
countries have undertaken large‐scale land titling programs in recent years,2 and that
1 Daniel Berkowitz, Katharina Pistor, and Jean‐Francois Richard, ʺEconomic Development, Legality, and the Trans‐plant Effect,ʺ European Economic Review 47 (2003): 165‐195; Berkowitz, Daniel, and Karen Clay. 2004. ʺInitial condi‐tions, institutional dynamics and economic performance: Evidence from the American states.ʺ Unpublished. 2 Vietnam issued nearly 11 million land titles to rural households in the 1990s (Do and Iyer, 2008); Thailand distrib‐uted 8.7 million land titles since the early 1980s; Indonesia issued 1.87 million titles between 1996 and 2000 (SMERU, 2002); Peru distributed 1.2 million titles to squatters in several cities (Field, 2003).
3
the existing empirical evidence on the impact of land titling and redistribution on in‐
vestment, productivity and poverty alleviation is mixed.3
The U.S. made very large and prolonged efforts to reform Philippine property rights
institutions. The political economy of the American occupation gave the U.S. admini‐
stration two reasons to follow through on the reforms. First, widespread anti‐imperial
sentiment in the U.S. required Washington to show tangible signs of progress (albeit at
minimal cost to the American taxpayer) in order to retain domestic support. Republi‐
cans put considerable effort into implementing the “policy of attraction.” 4 The policy of
attraction involved reforms of property rights, law enforcement, taxation, public educa‐
tion, and infrastructure designed to demonstrate that U.S. rule benefited the Filipinos.
In the words of the 1912 Republican platform, “We accepted the responsibility of the
Islands as a duty to civilization and the Filipino people. To leave with our task half
done would break our pledges, injure our prestige among nations, and imperil what has
already been accomplished.”5 Conversely, every Democratic platform between 1900
and 1912 called for Philippine independence “as soon as a stable government can be es‐
tablished.”6 The Democrats, however, could not ignore the widespread opinion that
chaos in the Philippines would adversely impact the strategic interests of the United
States. They could not therefore abandon the Philippines at an acceptable political cost
unless they could demonstrate that a stable self‐sufficient government had in fact been
3 For instance, Besley and Burgess (2000) analyze land reforms in India, and find that greater tenant rights leads to substantial reductions in poverty, but no significant increase in output. On the other hand, Banerjee, Gertler and Ghatak (2002) find significant increases in land productivity as a result of a specific reform which increased tenant rights. 4 The official government policy was usually called “benevolent assimilation.” The phrase “policy of attraction” was often used by revolutionaries opposed to U.S. occupation; the phrase originated in a telegram from the U.S. secretar‐ies of war and interior to Emilio Aguinaldo (Philippine Insurgent Records, 1896‐1901, National Archives, Washing‐ton, D.C., no. 849). 5 Republican Party Platform of June 7th, 1916. John T. Woolley and Gerhard Peters, The American Presidency Project [online]. Santa Barbara, CA: University of California (hosted), Gerhard Peters (database). http://www.presidency.ucsb.edu/ws/?pid=29591. 6 Democratic Party Platforms of July 7, 1908, and June 25, 1912. John T. Woolley and Gerhard Peters, The American Presidency Project [online]. Santa Barbara, CA: University of California (hosted), Gerhard Peters (database). http://www.presidency.ucsb.edu/ws/?pid=29591.
4
established.7 Second, the U.S. administration wanted to reduce the likelihood of future
conflict inside the Philippines. The Americans faced a widespread insurrection when
they took control of the Philippines in 1898. A combination of brutal counterinsurgency
and an offer of blanket amnesty to insurgent leaders ended the organized rebellion by
1902, but localized violence continued into the 1910s. Resurgent violence would not
only engage American troops; it would delay the point at which the U.S. could be as‐
sured that a stable government had in fact been created. American policymakers on
both sides of the aisle, therefore, wanted to insure that the population remained satis‐
fied with their material progress in a post‐conflict setting.
One might reasonably conclude that the combination of an occupying power with
strong incentives to generate broadly‐based economic growth and a long time‐horizon
would lead to successful externally‐imposed institutional change. Such a strong con‐
clusion would not be consistent with the province‐level data that we have collected
from the Philippine censuses of 1903 and 1918. We find that the extent of weak rights
increased over the period. The U.S. managed to title only 3 percent of cultivated land in
15 years, despite the establishment of a cadastral survey and special land courts. More
astonishingly, the most precarious form of property right—squatting—grew from less
than 2 percent to almost 10 percent of all farm holdings between 1903 and 1918.
What caused the failure to title more lands? The cause does not seem to have been
tax avoidance. Rather, the cause seems to have been the relatively high cost in time and
money of obtaining formal property rights combined with a generally low level of
property crime. The high cost—compared to Philippine incomes—discouraged families
whom otherwise might have chosen to register their lands under the Torrens system.
At the same time, the law enforcement system set up by the Americans reduced the
chances that unclaimed lands would be seized by a third parties, reducing the most
7 As time went on and the Japanese threat loomed larger, the consensus that the Philippines were a strategic asset for the U.S. faded as military analysts came to regret the American commitment to the islands’ defense.
5
immediate benefit to registering a land claim. We also find that inequality of farm hold‐
ings increased over this period, with a greater increase in areas of more secure titling.
This seems to suggest that the benefits of better property rights might have been cap‐
tured by large landowners to the detriment of small farmers.
Squatting increased because the U.S. simultaneously made it difficult to apply for
homesteads on public lands and failed to prevent its illegal occupation. Increases in
squatting in 1903‐18 occurred primarily in those provinces with large concentrations of
public land. The U.S. received 60,365 and approved 29,435 of them, but only 5.6% of the
approved applications resulted in titles. The glacial pace had two causes. First, the 20
peso (US$10) registration fee proved high for many homesteaders. Second, in 1918
alone (the first year for which there are records) the government received 3,613 protests
accusing homesteaders of occupying private property—twelve times the actual number
of homestead titles issued in that year.8 The U.S. also issued “free patents” to families
that could demonstrate that they had occupied public lands prior to 1902, but very re‐
strictive requirements slowed applications to a crawl.
The United States, it seems, trapped itself in a Catch‐22 of its own making. The U.S.
did not want to establish a precedent that land could be seized, so it negotiated the sale
of the friar lands with the Catholic Church. Since the friars knew that the U.S. needed
to purchase the lands, the resulting price was quite high. The U.S. then established a
system of courts, land surveys, property registers, and police. The expense—when
added to the expense of physical infrastructure and a massive expansion of the primary
schools—left few revenues left over to subsidize access to courts and registries, whereas
farmers without title could not be excluded from the benefits of improved police protec‐
tion. Raising more revenues was made difficult by the move to free trade with the US
in 1909, which deprived the insular government of its single largest source of revenues.
8 Annual Report of the Director of Lands for the year 1918, p. 880.
6
The U.S. was also reluctant to allow the Philippines to increase its bonded debt beyond
strict limits.
The rest of the paper is structured as follows: Section 2 details the historical back‐
ground and the reforms implemented by the US colonial administration, and Section 3
briefly describes our data. Sections 4, 5 and 6 present our main empirical results and
Section 7 concludes.
2. Historical Background
2.1 Spanish Colonial Rule
The first European to arrive in the Philippines was the Portuguese explorer Ferdi‐
nand Magellan in 1521. Spanish colonization of the Philippines began in 1565, when
Spanish troops defeated the king of Cebu. The city of Manila was established in 1571,
and the islands were administered as a colony of New Spain (Mexico). Control moved
directly to the Spanish Crown after Mexico declared its independence in 1821.
Spanish colonial rule brought Catholicism to the islands, though substantial Muslim
populations remained in certain places like the island of Mindanao. Over time, several
different orders of missionaries established their presence in the Philippines. Predomi‐
nant among them were the monastic orders of the Dominicans, the Franciscans, the Au‐
gustinians, and the Augustinian Recollects (Recoletos).9 In 1903, there were 746 regular
parishes, 105 mission parishes and 116 missions in the Philippines.10
The missionary orders were responsible for setting up several educational and
health institutions. Further, in most areas, the friar in his role of parish priest was the
sole representative of the Spanish Government, as well as the only educated person
with knowledge of both Spanish and the native language. As such, he was the de facto
9 The Jesuits, Capuchins, Benedictines and the Paulists had a much smaller presence on the islands. 10 Reports of the Taft Philippine Commission, p 23.
7
administrator of his parish. In this secular capacity, the parish priest inspected schools,
administered labor drafts and the collection of head taxes, oversaw elections to munici‐
pal offices and the police force, and signed off on the municipal budget.11 He was the
president of the health board, the president of the prison board and the chief advisor for
the municipal council.12 As Governor Taft put it, “The friars, priests, and bishops, there‐
fore, constituted a solid, powerful, permanent, well‐organized political force in the is‐
lands which dominated policies.”13
Over time, the Filipino population harbored considerable resentment against the fri‐
ars in their secular role. One major reason for this was the friarsʹ control over large feu‐
dal estates, acquired over time by purchase, legal battles, ecclesiastical privileges, and,
at times, outright usurpation. To their credit, the friars brought innovations such as ir‐
rigation systems to the lands under their control, and introduced cash crops such as
sugarcane, tobacco and coffee. Other innovations were less savory. The friars used
public labor for private purposes throughout the Spanish period. Land usurpations
produced major revolts in 1743, 1872, and 1896. High fees for baptisms, weddings, fu‐
nerals and other sacraments contributed to local resentments, and were the subject of
several Spanish imperial investigations.14 Another major grievance against the friars
was the barriers raised to the advancement of Filipino clergy.
The Cavite uprising of 1872 set the stage for the far more severe 1896 revolt. Over
the subsequent decade, a group of overseas Filipino students emerged to agitate for re‐
form, exemplified by the so‐called Propaganda Movement led by Jose Rizal. Though
Rizal never advocated for independence from Spain, he was arrested by the Spanish au‐
11 The head tax was called the “cédula,” after the identity document that recorded whether it had been paid. The head tax under the Spanish could also be paid in kind, with fifteen days of labor to the Crown. See Vicente Pilapil, “Nineteenth‐Century Philippines and the Friar‐Problem,” The Americas, Vol. 18, No. 2. (Oct., 1961), pp. 127‐148, p. 132. 12 Reports of the Taft Philippine Commission (p 25‐26), based on conversation with the provincial of the Franciscan order. 13 Reports of the Taft Philippine Commission, p 27. 14 LeRoy, 1903, p. 664, 666.
8
thorities in 1892.15 Rizal’s arrest prompted the formation of armed groups like the
Katipunan (led by Andres Bonifacio) which prepared for revolt against Spanish rule.
In 1896, an armed rebellion broke out in several provinces around Manila. After many
months of fighting, the rebels concluded a peace treaty with the Spaniards in December
1897. Emilio Aguinaldo, the leader of the rebel movement, left for Hong Kong. Fight‐
ing continued, however, in the provinces around Manila.
2.2 U.S. Colonial Rule in the Philippines
American intervention ended Spain’s rule in the Philippines. The U.S. fought
Spain over Cuba, but the Philippines were a Spanish possession and the United States
routinely kept a squadron of vessels in the western Pacific. War plans drawn up in 1897
called for the Asiatic Squadron to take the islands in order to deny Spain revenue, pro‐
vide a base of operation, and gain leverage in the subsequent peace settlement.16 When
the U.S. declared war on April 25th, 1898, the Navy sent the Squadron a terse order:
“Proceed at once to the Philippine Islands. Commence operations at once, particularly
against the Spanish fleet. You must capture vessels or destroy. Use utmost endeavors.”17
On May 1st, Admiral George Dewey sailed into Manila Bay and destroyed the Spanish
fleet. Lacking orders to the contrary, Dewey supplied arms to the Philippine guerrillas
operating in nearby Cavite and sent a cruiser to fetch Aguinaldo from his Hong Kong
exile. Washington, however, soon told Dewey to avoid “political alliances with the
insurgents.”18 Dewey complied, and kept Philippine troops from participating in the
final assault on Manila in August.
The U.S.’s main interest in the Philippines was the retention of Manila or Subic
Bay as a base for the Asiatic Squadron. President McKinley initially intended only to
15 The Spanish executed Rizal in 1896. 16 Kramer, Blood of Government, p. 91. 17 Annual Reports of the Navy Department for the Year 1898 (Washington: Government Printing Office, 1898). 18 Kramer, Blood of Government, p. 94.
9
take a sovereign base, along the lines of Guantánamo Bay in Cuba. The Navy, however,
reported that they could not defend a base without control of Luzon. Naval analysts
also worried that Aguinaldo would be unable to establish a stable government, opening
the way for foreign intervention. McKinley debated annexing only Luzon, but rejected
the idea for political reasons—taking one island while leaving the remainder under
Spanish rule (or as a separate republic) smacked too much of craven European‐style
imperialism. As a result, on December 21, 1898 (eleven days after the Treaty of Paris
transferred Cuba, Guam, the Philippines, and Puerto Rico to the U.S.) McKinley de‐
clared that U.S. policy in the Philippines was one of “benevolent assimilation, substitut‐
ing the mild sway of justice and right for arbitrary rule.”19 Unlike in Cuba, the U.S.
made no intimation that the Philippines would receive self‐government anytime soon.
The Philippine rebel leaders soon went into violent opposition. In January 1899,
they set up a government at Malolos. After the U.S. Senate ratified the Treaty of Paris in
February 1899, insurgency resumed in most parts of the Philippines. It took two
years—and an offer of total amnesty for the rebel fighters—to bring the violence under
control. The war in the Philippines became the signature issue of the 1900 presidential
elections, and the insurgents carefully monitored the election returns. When the De‐
mocrats lost under Williams Jennings Bryan, insurgent morale collapsed, and surren‐
ders multiplied. Emilio Aguinaldo himself surrendered in March 1901, and subse‐
quently called on his followers to accept U.S. administration. During the upheaval in
1896‐97 and 1899‐1901, 40 priests were killed and 403 imprisoned. Of the 1124 priests in
1898, by 1903 only 472 priests remained, almost all of them in Manila.20
In 1900, with hostilities winding down, the U.S. sent the Taft Commission to assess
the situation in the Philippines.21 The Taft Commission arrived with a mandate to not
19 Kramer, Blood of Government, p. 110. 20 Reports of the Taft Philippine Commission, p 23. 21 William Howard Taft was a prominent federal judge who later served as President and Chief Justice of the United States.
10
only to study conditions in the islands, but also to establish local government, develop a
career‐oriented civil service, implement tax measures and legislate needed laws. Ar‐
guably the most immediately pressing task of the Commission was to resolve the
“burning political question, discussion of which strongly agitates the people of the Phil‐
ippines,” of whether the friars should return to the parishes they occupied before the
revolution.
2.3 The Friar Lands Policy
In resolving the problem of the friars and their lands, the Taft Commission was rec‐
ommended to keep in mind the principle of just compensation and the provisions of the
Treaty of Paris, which promised to protect the property rights of the Spanish, specifi‐
cally including “ecclesiastical bodies.”22 The Commission conducted detailed inter‐
views with the friars, local elites and American military officers on the twin questions of
whether the friars should be allowed to go back to the parishes, and whether they
should be given back the lands they owned.
On the first question, the Commission concluded that the return of the friars to their
parishes was not advisable due to the continuing resentment against them. The grand‐
son of a Franciscan friar put it very pithily: “All the friars have to do is to go back to
their parishes and sleep one night, and the chances are that they would never
awaken.”23 Taft therefore became “convinced that a return of the friars to their parishes
will lead to lawless violence and murder, and the people will charge the course taken to
22 Article VIII of the Treaty of Paris reads: “In conformity with the provisions of Articles I, II, and III of this treaty, Spain relinquishes in Cuba, and cedes in Porto Rico and other islands in the West Indies, in the island of Guam, and in the Philippine Archipelago, all the buildings, wharves, barracks, forts, structures, public highways and other im‐movable property which, in conformity with law, belong to the public domain, and as such belong to the Crown of Spain And it is hereby declared that the relinquishment or cession, as the case may be, to which the preceding paragraph refers, can not in any respect impair the property or rights which by law belong to the peaceful possession of property of all kinds, of provinces, municipalities, public or private establishments, ecclesiastical or civic bodies, or any other associations having legal capacity to acquire and possess property in the aforesaid territories renounced or ceded, or of private individuals, of what‐soever nationality such individuals may be.” 23 “Testimony of Don Felipe Calderon,” Senate Document 190, p 140.
11
the American government, thus turning against it the resentment felt towards the fri‐
ars.”24 On the second question, Taft concluded, “It would avoid some very troublesome
agrarian disturbances between the friars and their quondam tenants if the insular gov‐
ernment could buy these large haciendas of the friars and sell them out in small hold‐
ings to the present tenants.”25
In 1902, Taft traveled to Rome to meet with Pope Leo XIII. He wanted to use the
Popeʹs influence over the friars to push through the sale of the friar lands, and make
sure that the Spanish friars left the Philippines after the sale. The Pope endorsed the de‐
cision to sell the lands, but he left the negotiations of the specifics to the friars in the
Philippines. The Pope also declared that he supported a voluntary withdrawal and the
gradual introduction into the Philippines of clergy from other countries, especially the
United States.
The negotiations with the friars in Manila were protracted, with most of the dis‐
agreements centering around the valuation of the friar lands. The friars wanted full
compensation for all improvements made on their estates, and the Dominicans went so
far as to sell the sugar mills and the railroads on their haciendas to third parties. The
U.S. Supreme Court finally ruled that the Friar Lands Act covered land improvements,
including railroads and sugar mills. On December 22, 1903, the United States finally
agreed to buy 170,916 hectares (403,000 acres) at a price of just above 12 million pesos.26
The insular government issued special bonds to raise this money. The bonds offered a
4% interest rate and were payable between ten and thirty years, at the option of the
government. In theory, they were not backed by the U.S. Treasury, but by the revenues
of the government of the Philippine Islands.
24 Report of the Taft Commission, p 31. 25 Report of the Taft Commission, p 32. 26 In 1903, one U.S. dollar was worth approximately two pesos.
12
Did the American colonial administrators pay too much for the friar lands? This has
been a subject of considerable debate. Governor Taft had initially estimated the annual
income from the friar lands at not more than 450,000 pesos, implying that the final sale
price represented more than 26 times the annual income. Taft justified the price as fol‐
lows: “It is not thought that the income from the islands for several years will be
enough to meet the actual outgo … It is to be noted, however, that the insular govern‐
ment has not entered upon the purchase of these lands with a view to a profitable in‐
vestment, but that it is knowingly paying a considerable sum of money merely for the
purpose of ridding the administration of the government in the islands of an issue dan‐
gerous to the peace and prosperity of the people of the islands.”27 In other words, the
U.S. was willing to pay a premium to get the friars out of the Philippines. In this goal,
they largely succeeded: by the end of 1904, the remaining Spanish bishops in the Phil‐
ippines had been replaced by American bishops. The problem now was to decide what
to do with the lands acquired by the Philippine government.
The US Congress agreed with the Taft Commission that the best course of action
would be to sell the lands to their tenants. The Philippine Organic Act of 1902 and the
Friar Lands Act of 1904 specified that: “Actual settlers and occupants at the time said
lands are acquired by the government shall have the preference over all others to lease,
purchase or acquire their holdings.”28 The government, therefore, immediately began
the process of breaking up the friar estates and selling them to Filipino peasants. Since
the legislation precluded any sales larger than 16 hectares,29 this process involved sur‐
veying the land, subdividing it into parcels and determining an appropriate sale price
for each parcel.30 This process took a number of years, and was not completed before
27 Report of the Philippine Commission 1903, p 44. 28 Philippine Organic Act, Section 65. 29 This provision was violated in many instances, with some American officials and local elites managing to acquire large estates. For instance, Emilio Aguinaldo received 1055 hectares from the Imus estate. 30 Governor Taft strongly felt that this low limit would discourage large‐scale plantation agriculture, and recom‐mended several times that the limit be raised considerably.
13
1908 on any estate.31 The current occupant of the land was then given the first option to
purchase this land. The government chose not to subsidize the administrative costs of
this program, with the result that the purchaser had to pay for the cost of the surveys
and any administrative expenses including attorney’s and registration fees. Further‐
more, in order to recoup the interest expense on the bonds, the government raised the
price of the lands as time went on. For instance, the original purchase price of the Gui‐
guinto estate was 155,567 pesos, but its final selling price was determined in June 1908
to be 200,276 pesos, an increase of nearly 28%.32
2.4 Land Registration
The Taft Commission also reformed the laws governing land titles. “A very large
percentage of the lands are occupied and claimed by individuals without any record
title whatever,” observed the Taft Commission. Many of the titles had been destroyed
during the wars and political instability of the preceding years. Despite the lack of for‐
mal record title, most landholders had a good title of possession, that is, their right to
the land was conceded by the neighbors. However, the government feared that the dis‐
advantages of this informal system would grow over time.
In order to improve the chaotic state of land rights, the insular government passed
the Land Registration Act of 1903. The Act provided for the Torrens system of land reg‐
istration in the Philippines. Under the Torrens system, the government sets up a cen‐
tralized land registry. No document (such as a sales registry or a mortgage) can be con‐
sidered effective unless and until it is recorded at the centralised registry. Purchasers
only need to verify one record, the title in the central registry, and the owner of a prop‐
erty cannot have their title challenged or overturned except in cases of fraud or error.
Registration under the Torrens system, therefore, requires an investigation of the title
31 Rene Escalante, The American Friar Lands Policy, Table 14, p 129. 32 Rene Escalante, The American Friar Lands Policy, Table 15, p 130.
14
and all possible liens on the property in order to work. The government therefore cre‐
ated an “assurance fund” for landowners to draw upon in case they lost their land by
reason of a title investigation under the Land Registration Act. In addition, the Land
Registration Act created a Court of Land Registration with nationwide jurisdiction to
administer the new system. Once Torrens titles made it through the court, they would
legally unassailable, completely transparent, and fully transferable. It should be noted
that the old system of registration was not discontinued, and that registration of titles
under the new act was left optional with landowners.33
Land registration under the new system was not cheap, especially since the insular
government chose not to subsidize it. In addition to an application fee of $20, registra‐
tion costs included a charge worth 0.1% of the property valuation to pay for the exami‐
nation of title and a levy worth 1% percent of the property’s value for the assurance
fund. The applicant also had to pay for the cost of any new survey which might be re‐
quired. A shortage of registers of deeds and examiners of title in the provinces (where
such functions were under the purview of provincial treasurers who had many other
responsibilities) further added to the transaction cost of seeking a Torrens title.
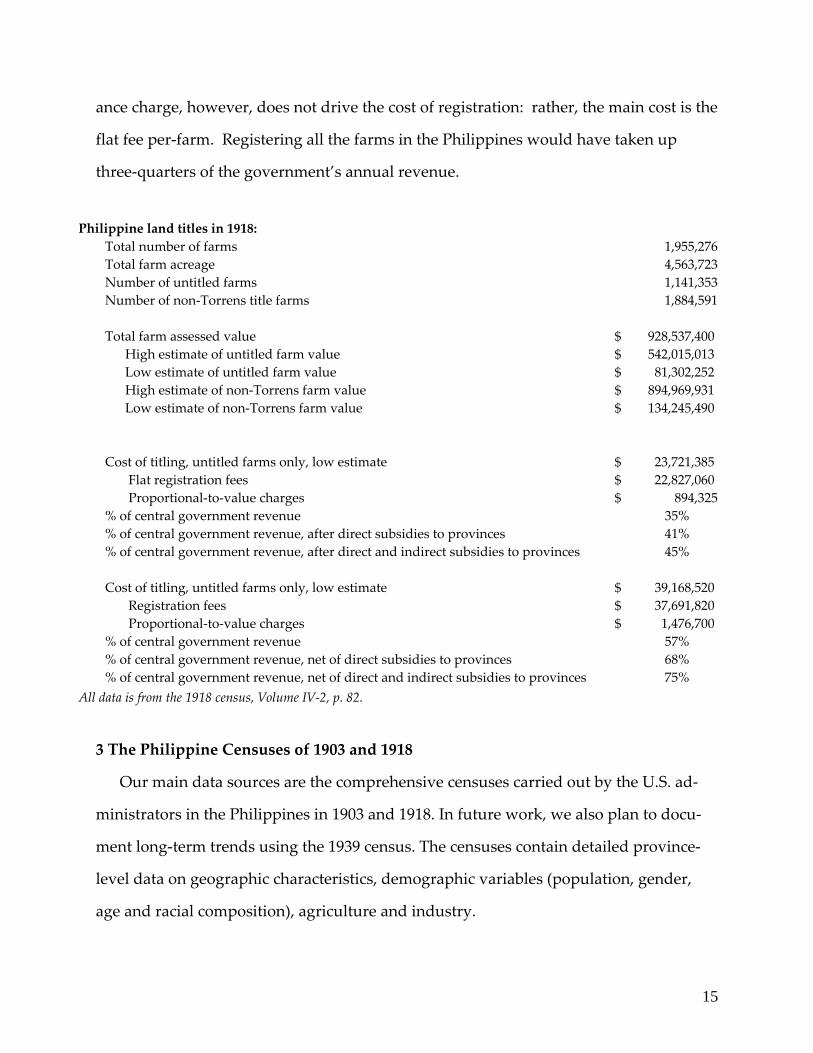
The Philippine government could not have afforded to subsidize land titling with‐
out substantial new tax revenues or transfers from the U.S. mainland. The Payne‐
Aldrich Tariff Act of 1909 brought the Philippines under the U.S. tariff wall (with a few
minor exceptions eliminated in 1913), which had the problematic side‐effect of depriv‐
ing the insular government of most of its tariff revenues. It is possible to calculate how
much a subsidized land‐titling program would have cost the insular government. The
following table assumes that the average untitled farm was the same size of the median
farm plot—that is, roughly 15 percent of the size of the average farm—and that the av‐
erage value‐per‐acre of such farms were about the same as ordinary farms. The assur‐
33 Report of the Court of Land Registration, Report of the Philippine Commission 1903, p 322.
15
ance charge, however, does not drive the cost of registration: rather, the main cost is the
flat fee per‐farm. Registering all the farms in the Philippines would have taken up
three‐quarters of the government’s annual revenue.
3 The Philippine Censuses of 1903 and 1918
Our main data sources are the comprehensive censuses carried out by the U.S. ad‐
ministrators in the Philippines in 1903 and 1918. In future work, we also plan to docu‐
ment long‐term trends using the 1939 census. The censuses contain detailed province‐
level data on geographic characteristics, demographic variables (population, gender,
age and racial composition), agriculture and industry.
Philippine land titles in 1918: Total number of farms 1,955,276 Total farm acreage 4,563,723 Number of untitled farms 1,141,353 Number of non‐Torrens title farms 1,884,591 Total farm assessed value $ 928,537,400 High estimate of untitled farm value $ 542,015,013 Low estimate of untitled farm value $ 81,302,252 High estimate of non‐Torrens farm value $ 894,969,931 Low estimate of non‐Torrens farm value $ 134,245,490
Cost of titling, untitled farms only, low estimate $ 23,721,385 Flat registration fees $ 22,827,060 Proportional‐to‐value charges $ 894,325
% of central government revenue 35% % of central government revenue, after direct subsidies to provinces 41% % of central government revenue, after direct and indirect subsidies to provinces 45% Cost of titling, untitled farms only, low estimate $ 39,168,520 Registration fees $ 37,691,820 Proportional‐to‐value charges $ 1,476,700
% of central government revenue 57% % of central government revenue, net of direct subsidies to provinces 68% % of central government revenue, net of direct and indirect subsidies to provinces 75%
All data is from the 1918 census, Volume IV‐2, p. 82.
16
We first document the impact of the U.S.‐led changes in property rights regimes on
land ownership, land concentration and the expansion of cultivation in the Philippines.
We then consider other outcome variables such as agricultural land use, specifically the
choice to grow commercial crops; agricultural investments such as irrigation or greater
capital use; average farm size; agricultural productivity (output per hectare, output per
worker and total factor productivity in agriculture); occupational change or investment
in sectors other than agriculture.
We construct two measures of the extent of friar lands. The first is simply a dummy
for whether the province contained any friar lands at all, and hence would be subject to
this specific reform. The friar lands were concentrated in 8 out of our 42 provinces.
These provinces were Bataan, Bulacan, Cavite, Cebu, Isabela, Laguna, Mindoro and Ri‐
zal. The second is a continuous measure which is computed as the area of friar lands
divided by the total farm area in the province. The average proportion of friar lands
was 42% in the provinces with friar lands, ranging from 7% in Cebu to 94% in Cavite.
To examine the effect of the progress in land titling, we constructed a very simple
measure of the extent of titling: the proportion of farms which had no formal title as of
1918. (This information is not available in the 1903 census.) The 1918 census lists five
kinds of formal documents a landholder could possess: Torrens titles issued under U.S.
rule (3.6% of farms), judicial decrees (1.5%), private deeds issued under the old Spanish
system (22.8%), Royal titles (3.1%), and a possessory titles (7%). A royal title was a
grant directly from the Spanish Crown, whereas, possessory titles were titles claimed
(under Spanish law) by occupying the land for a sufficient period of time. The majority
of farms (58%) in the Philippines possessed no formal title at all in 1918.
4 Land Reform, Land Utilization and Ownership Patterns
Table 1 documents the changes in land utilization and the patterns of land owner‐
ship between 1903 and 1918, using data from the respective censuses. Columns (1) and
17
(2) provide averages for all the provinces, Columns (3) and (4) document these changes
for provinces with no friar lands and Columns (5) and (6) show the results for provinces
where friar lands were present; these are the provinces in which land redistribution
policies were implemented. Columns (7) and (8) document changes in land utilization
and land ownership in provinces which were recorded as having more than 50% of
their farms titled in 1918. Columns (9) and (10) summarizes data for provinces with low
level of titling i.e. those in which less than half the farms were titled as of 1918. These
comparisons give us a sense of the pre‐existing differences across these different types
of provinces before the reforms were implemented. We can also form preliminary esti‐
mates of the changes brought about time by the reforms.
We note first that land in the Philippines was relatively under‐utilized at the begin‐
ning of this period. Only 17% of the total land area had been claimed as farm land, and
only 47% of the farm land was being cultivated. The reason is that the Philippines was,
in fact, a frontier economy in the early 20th‐century. The country’s overall population
density was only 66 people per square mile in 1903, compared with 108 for Vietnam,
163 for Maharashtra, 312 for Japan, 388 for Punjab, 494 for West Bengal, and 615 for
Java. In fact, the Philippines’ population density was 13 percent lower than Indiana in
1903.34
Over the 15 years after 1903, land utilization increased on both the extensive and the
intensive margins. By 1918, 26% of total area was claimed by farms, and 56% of this in‐
creased area was under cultivation. The net effect was a 67% increase in total cultivated
area. Over this same period, the population of the Philippines expanded by only 32%.
Comparing column (3) with column (5), we find that the intensity of cultivation was
fairly similar across provinces with and without any friar lands. While provinces with
34 Land areas from the CIA World Fact Book. Populations from the Encyclopedia Britannica of 1911, except in the case of India, where estimates normalized for current administrative boundaries can be found at http://www.populstat.info/Asia/indiap.htm.
18
friar lands had more of their area demarcated as farm land (21% versus 16%), provinces
without friar lands cultivated a larger fraction of their farm area (48% compared to
44%).
The distribution of farms, farm area and cultivated area by ownership type reveals a
startling fact: there was a deterioration in the share of the population possessing formal
property rights between 1903 and 1918. In 1903, 81% of farms and 76% of cultivated
area was held by owners. In 1918, the corresponding fractions were 75% and 67%. This
is accompanied by an increase in the fraction of farms and cultivated area being held by
people who have a “no rental” status i.e. are neither the owners nor the tenants. (We
use the term “squatters” to refer to this category of landholders.) The fraction of farms
occupied by squatters increased from 2.7% in 1903 to 9.5% in 1918; the fraction of culti‐
vated area under squatters increased from 2.6% to 9.2%.
Figures 1A and 1B show that this increase in the incidence of squatting is very simi‐
lar across provinces with and without friar lands (corresponding data in columns 3 to
6). In the provinces with no friar lands, the increase in squatting is mostly due to a cor‐
responding decrease in ownership. In the provinces with friar lands, however, the frac‐
tion of cultivated area held by tenants is essentially unchanged between 1903 and 1918,
and the number of farms held by owners actually increased. In these provinces, the in‐
crease in the incidence of squatting is matched by a decrease in the incidence of share‐
cropping. Since one of the goals of the Friar Lands Program was to convert sharecrop‐
pers into landowners, it is somewhat disquieting to see that the decline in sharecrop‐
ping is matched by an increase in squatting rather than landownership. It is even more
disquieting to observe that the increase in squatting is observed in areas with relatively
high levels of land titling; in fact, this increase is very similar to that observed in areas
with lower extent of titling (Figures 1C and 1D; columns 7 to 10 of Table 1).
What might explain the increase in the incidence of squatting? One potential expla‐
nation is the rapid expansion of cultivated area during these years. People holding land
19
which had been newly brought under cultivation may not have had time to register
their land with the authorities (as owners or tenants), in which case they would be re‐
corded as “no rental.” We would then expect a positive correlation between the increase
in squatting and the increase in cultivated area. However, we do not find much evi‐
dence on this. Table 2 shows that there is a strong negative correlation between the in‐
crease in squatting and the increase in the fraction of area cultivated. The positive corre‐
lation between the increase in squatting and the percentage increase in area cultivated is
mainly driven by the presence of a few provinces which were almost completely uncul‐
tivated in 1903;35 this correlation becomes much less in magnitude (0.12) and disappears
in significance if we exclude provinces which had less than 0.05% of their area culti‐
vated in 1903.
What are the costs of squatting? The main risk is being evicted from your land
without any legal recourse. A higher population density on cultivated land implies
greater competition for land—more and closer neighbors with the opportunity to move
in on the land you occupy—and hence a greater risk of arbitrary eviction if you donʹt
have a formal contract. If this risk significantly affected people’s behavior in the Philip‐
pines, then we would expect squatting to be negatively correlated with population den‐
sity. This does indeed turn out to be the case: the provinces which showed the least
decreases in population per hectare of cultivated area are the ones which show the low‐
est increases in the incidence of squatting.
What are the benefits of squatting? One hypothesis might be that squatting is a way
to avoid high land registration costs. The problem with this hypothesis is that squatting
is not the same thing as lacking formal title: in 1918, 58% of farms lacked a formal title,
but only 9.6% were occupied by families with no ownership rights whatsoever.
35 These provinces therefore have extremely high values for percentage changes in cultivated area because of the ex‐tremely low starting point e.g. the province of Sulu displays a 60‐fold increase in cultivated area, even though only 1.3% of total province area was cultivated in 1918.
20
Another possible benefit from squatting is the avoidance of land taxes. The Ameri‐
can occupation introduced property taxes for the first time, empowering both provin‐
cial and municipal governments. If that were the case, then property tax rates should
be positively correlated with squatting. We put together data on province‐level prop‐
erty tax rates from the 1918 census (computed as the ratio of property tax collected to
the assessed value of real property). However, we do not find any significant correla‐
tion between the tax rates in 1918 and the increase in squatting over 1903‐1918.36 One
might argue that assessed value is in fact endogenous, since provinces could vary in the
zeal with which their assessors valued properties. Our results, however, do not vary
when we use alternate measures of property tax rates, such as property taxes per hec‐
tare or property taxes per person.
Table 2, Panel B shows the regression results once we put in all these factors. We
find that the increase in population density per cultivated hectare, the increase in culti‐
vated area overall are significant predictors of the increase in informal land rights. In
other words, squatters settled the Philippine frontier under American rule. As the
population fanned out into lands that had been formerly guarded by the friars or the
Spanish crown, the U.S. failed to enforce property rights. This suggests that the risks of
losing land might have be a significant determinant of Filipino farmers deciding
whether or not to have formal claims to the land. We plan to construct a better measure
of the risk of losing land by putting together data on the incidence of property and vio‐
lent crimes across provinces.
5 Land Reform and the Distribution of Farm Sizes
What effect did the land reforms have on land distribution? One of the desired out‐
comes of the friar lands reform was to break up large feudal estates into smaller plots.
36 The property tax rate is calculated as the ratio of property tax collections to the assessed value of real property. We get similar results if we use property tax collected per hectare or per head.
21
In addition, changes in farm size are likely to be important determinants of agricultural
investments and productivity.37 Table 3 documents the changes in the distribution of
farm sizes between 1903 and 1918.
Both the number of smaller farms and the share of land occupied by such farms
rose. In 1903, the 440,000 farms smaller than one hectare occupied 7.2% of farm area
and 10.5% of cultivated area. (Table 3, Columns 1 and 2). By 1918, the total number of
such small farms had almost tripled to 1.2 million, and they occupied 11.4% of farm
area and 14.6% of lands under cultivation. Over this same period, there was a drop in
the number and share of area held farms of more than 15 hectares. In 1903, nearly 49%
of farm area and 34% of cultivated area was under large farms. In 1918 that had fallen
to 40% and 27%.
In order to determine the effect of these changes on the overall land distribution, we
plotted Lorenz curves based on the data in Table 3. Figures 2A graphs the cumulative
fraction of farm area in different size categories against the cumulative fraction of total
farms in that size category for provinces with no friar lands; Figure 2B documents the
same for provinces with friar lands. A 45 degree line would represent a perfectly equal
distribution of land i.e. small farms which constitute 31% of all farms would also control
31% of cultivated area and so on. We see that the lines drawn for the actual farm size
distributions in both 1903 and 1918 are considerably below this 45 degree line, suggest‐
ing a high degree of inequality in land ownership. In fact, we see that the distribution of
farm sizes has become more unequal in 1918 for provinces in which there were no friar
lands. The Gini coefficient of inequality (measured by the area between the farm size
distribution line and the line of perfect equality) increased from 0.57 to 0.60 for such ar‐
eas.
37 See Binswanger et al (1995) for an overview of the theoretical and empirical literature on the determinants of farm size, as well as the impact of farm size on productivity.
22
In contrast, Figure 2B shows that the friar lands reform was successful in reducing
the inequalities in land ownership, but only at the higher end of the spectrum. The overall
Gini increased from 0.58 to 0.60—a result superficially like the non‐friar provinces—but
the effects varied greatly over the entire land distribution. Equality grew substantially
in the upper quartile of the land distribution, as the reforms broke up the largest estates
and American policy prevented new ones from emerging. Conversely, equality fell in
the rest of the distribution, as some small farmers failed to obtain the capital they
needed to expand their plots—while other small farmers succeeded and expanded.
What was the relationship between titling have on land distribution? Figures 3A
and 3B document the trends in the farm size distribution for areas with greater and
lesser degree of formal land titling. The distribution of farm sizes became more unequal
in the areas with a higher extent of titling (Figure 3A), while the distribution remained
essentially unchanged for the areas with lower levels of titling (Figure 3B). The Gini co‐
efficient increased from 0.59 to 0.65 in the more‐titled provinces, and fell from 0.57 to
0.56 in the less‐titled areas.
Which way did causality run? Did titling cause land inequality to increase, or was it
merely an effect of increasing land inequality? The third specification in Table 2, Panel
B, provides a clue. The coefficient on the proportion of farms with titling is negative
and significant at the 95‐percent level, indicating that titling appears to have discour‐
aged squatting. Since squatting seems to have been one of the cheapest ways for poor
families to acquire or expand their homesteads, titling would be expected to make it
easier for larger farmholdings to defend their land. Conversely, a lack of titles among
poor smallholders would make it easier for large landowners to expand their holdings
at the smallholders’ expense.
Table 4 documents the correlations of these changes in the farm size distribution
with other changes happening during this time, similar to the relationships documented
in Table 2. Land inequality (and the area under large farms) is positively correlated
23
with the increases in farm area and cultivated area over this period, suggesting that
most of the increase in cultivation is coming as a result of the actions of large landhold‐
ers. The increase in inequality is also correlated with the increase in informal tenure,
which might mean that while large landholders increased their area of operations,
smaller landholders were not able to expand their property rights in a similar way.
However, these correlations are not statistically significant, and more careful analysis
(such as multiple regression models) is needed to examine these relationships in detail.
6 Property Rights and Agricultural Outcomes
In this section, we document trends in agricultural choices and agricultural produc‐
tivity, and see whether there was differential progress in these measures across areas
which saw different changes in the property rights institutions.
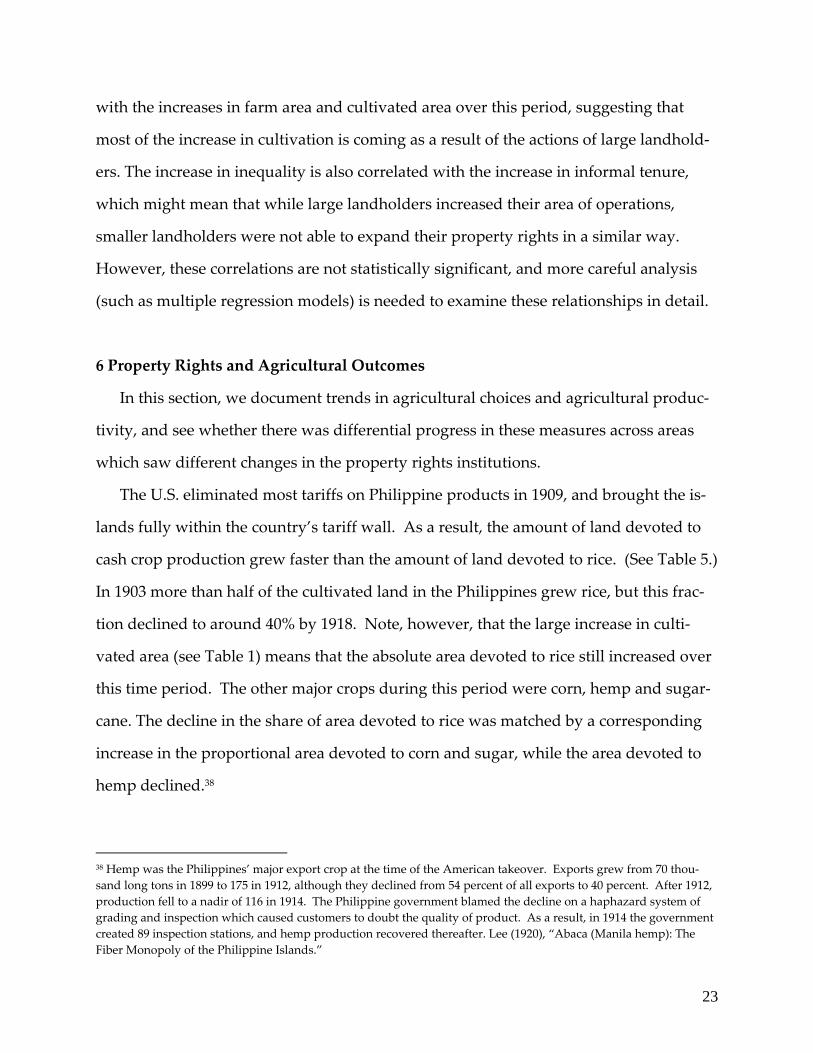
The U.S. eliminated most tariffs on Philippine products in 1909, and brought the is‐
lands fully within the country’s tariff wall. As a result, the amount of land devoted to
cash crop production grew faster than the amount of land devoted to rice. (See Table 5.)
In 1903 more than half of the cultivated land in the Philippines grew rice, but this frac‐
tion declined to around 40% by 1918. Note, however, that the large increase in culti‐
vated area (see Table 1) means that the absolute area devoted to rice still increased over
this time period. The other major crops during this period were corn, hemp and sugar‐
cane. The decline in the share of area devoted to rice was matched by a corresponding
increase in the proportional area devoted to corn and sugar, while the area devoted to
hemp declined.38
38 Hemp was the Philippines’ major export crop at the time of the American takeover. Exports grew from 70 thou‐sand long tons in 1899 to 175 in 1912, although they declined from 54 percent of all exports to 40 percent. After 1912, production fell to a nadir of 116 in 1914. The Philippine government blamed the decline on a haphazard system of grading and inspection which caused customers to doubt the quality of product. As a result, in 1914 the government created 89 inspection stations, and hemp production recovered thereafter. Lee (1920), “Abaca (Manila hemp): The Fiber Monopoly of the Philippine Islands.”
24
We see a few differences in the crop composition across areas with and without friar
lands. Provinces with friar lands devoted proportionately more area to corn and sugar‐
cane and considerably less area to growing hemp. Areas with less titling devoted a lot
more area to corn rather than rice, compared to areas with higher levels of titling. (We
intend to check if this is due to geographical differences in future versions.)
We also find a large increase in the intensive margin of agriculture. Rice yields al‐
most doubled from 13 kilograms per hectare (kg/h) to 24 kg/h over this period. Table 7
controls for yields in 1903, irrigation, formal credit, and the growth in cultivated land.
Puzzlingly, titling variables appear to have very little to do with the increase in rice
production. Rather, what appears to have happened was the spread of “best practice”
across the islands, as areas with low yields converged on higher‐yielding places.
We observe increases in per hectare productivity for corn, hemp and sugar as well.39
Provinces with friar lands show particularly large increases in sugarcane and hemp
production, while areas with high levels of titling show a five‐fold increase in hemp
yields. In future analysis, we intend to see if titling affected the crop mix. We are now
attempting to see if titling affected productivity in cash crops or the choice of crop mix.
7 Conclusion
We examined the impact of two major features of the property rights in the Philip‐
pines introduced during the U.S. colonial occupation. The record is mixed. The U.S. did
finance the purchase and redistribution of the friar lands. It also implemented a major
property rights reform, including the introduction of the Torrens system and special
land courts. The U.S. also established a national police force—the Constabulary—and
strengthened local governments capable of protecting property rights. Yet despite all
this, most landholdings remained without title. Even more dramatically, the percent‐
39 (We have double‐checked the national census totals for 1918 against the national production totals in the Philippine Statistical Bulletin: 1918 does not appear to have been an outlier.)
25
age of squatters—those lacking any property rights over their lands whatsoever—rose
precipitously.
The U.S. failure seems rooted not in an inability to enforce private property rights,
but a failure to enforce public ones. Squatting grew because the Philippines was, in ef‐
fect, a frontier economy during the first few decades of the American occupation, and
moving into new lands without claim or title was easiest way to bring new lands under
cultivation. American policy made formal land titles very expensive to obtain; locking
squatters off public lands would have only served to keep the poorest people in the
country from have access to the Philippines’ large supplies of empty land at a time of
rapid population growth.
The failure of land policy appears to have contributed to increasing land inequality.
Where the U.S. made a concerted effort to prevent the emergence of large estates, such
as on the friar lands, it succeeded. Where it did not, disparities in formal titling trans‐
lated into disparities in access to land. In short, the U.S. created effective institutions to
enforce property rights but failed to provide them as a true public good—access went to
those who could pay. As a safety valve, the U.S. allowed squatters to move into the
frontier, but this was a poor substitute for a concerted public effort to provide land ti‐
tles. Such an effort, however, would have been quite expensive.
The next steps in this project will be to investigate the links between land titling and
violence and land titling and agricultural productivity. We are in the process of coding
and analyzing the necessary data from the census and statistical bulletins.
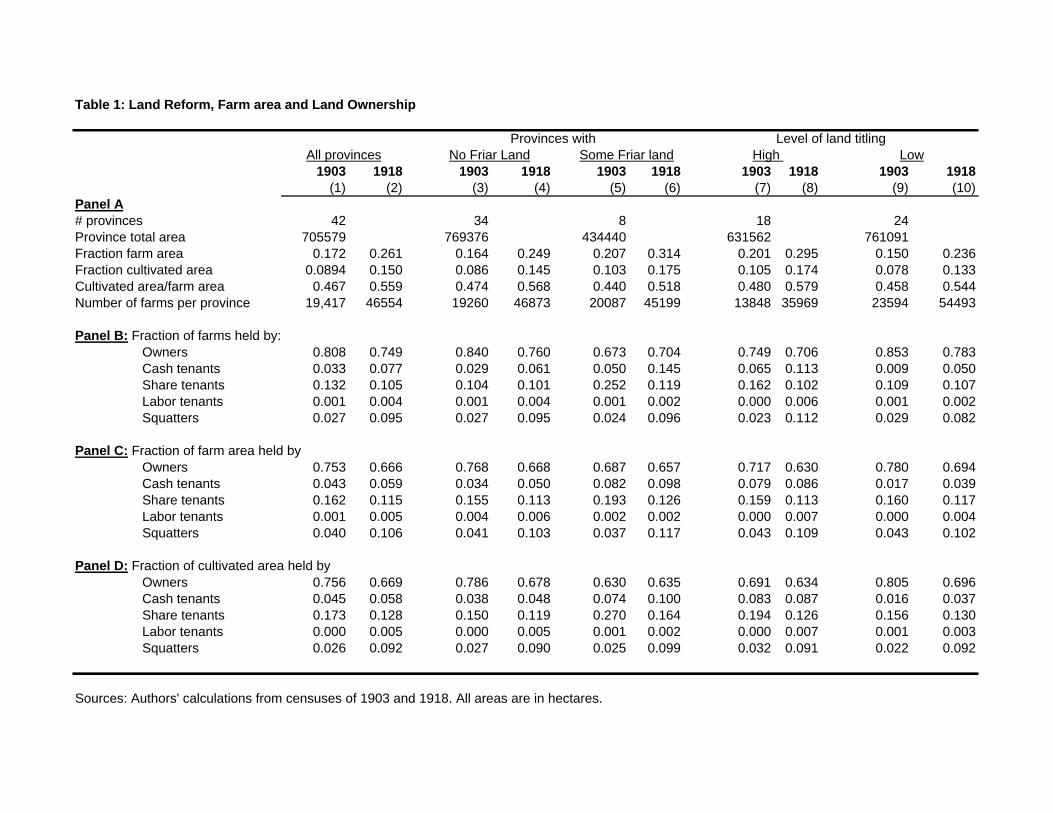
Table 1: Land Reform, Farm area and Land Ownership
Level of land titling
1903 1918 1903 1918 1903 1918 1903 1918 1903 1918(1) (2) (3) (4) (5) (6) (7) (8) (9) (10)
Panel A# provinces 42 34 8 18 24Province total area 705579 769376 434440 631562 761091Fraction farm area 0.172 0.261 0.164 0.249 0.207 0.314 0.201 0.295 0.150 0.236Fraction cultivated area 0.0894 0.150 0.086 0.145 0.103 0.175 0.105 0.174 0.078 0.133Cultivated area/farm area 0.467 0.559 0.474 0.568 0.440 0.518 0.480 0.579 0.458 0.544Number of farms per province 19,417 46554 19260 46873 20087 45199 13848 35969 23594 54493
Panel B: Fraction of farms held by:Owners 0.808 0.749 0.840 0.760 0.673 0.704 0.749 0.706 0.853 0.783Cash tenants 0.033 0.077 0.029 0.061 0.050 0.145 0.065 0.113 0.009 0.050Share tenants 0.132 0.105 0.104 0.101 0.252 0.119 0.162 0.102 0.109 0.107Labor tenants 0.001 0.004 0.001 0.004 0.001 0.002 0.000 0.006 0.001 0.002Squatters 0.027 0.095 0.027 0.095 0.024 0.096 0.023 0.112 0.029 0.082
Panel C: Fraction of farm area held byOwners 0.753 0.666 0.768 0.668 0.687 0.657 0.717 0.630 0.780 0.694Cash tenants 0.043 0.059 0.034 0.050 0.082 0.098 0.079 0.086 0.017 0.039Share tenants 0.162 0.115 0.155 0.113 0.193 0.126 0.159 0.113 0.160 0.117Labor tenants 0.001 0.005 0.004 0.006 0.002 0.002 0.000 0.007 0.000 0.004Squatters 0.040 0.106 0.041 0.103 0.037 0.117 0.043 0.109 0.043 0.102
Panel D: Fraction of cultivated area held byOwners 0.756 0.669 0.786 0.678 0.630 0.635 0.691 0.634 0.805 0.696Cash tenants 0.045 0.058 0.038 0.048 0.074 0.100 0.083 0.087 0.016 0.037Share tenants 0.173 0.128 0.150 0.119 0.270 0.164 0.194 0.126 0.156 0.130Labor tenants 0.000 0.005 0.000 0.005 0.001 0.002 0.000 0.007 0.001 0.003Squatters 0.026 0.092 0.027 0.090 0.025 0.099 0.032 0.091 0.022 0.092
Sources: Authors' calculations from censuses of 1903 and 1918. All areas are in hectares.
High LowAll provincesProvinces with
No Friar Land Some Friar land
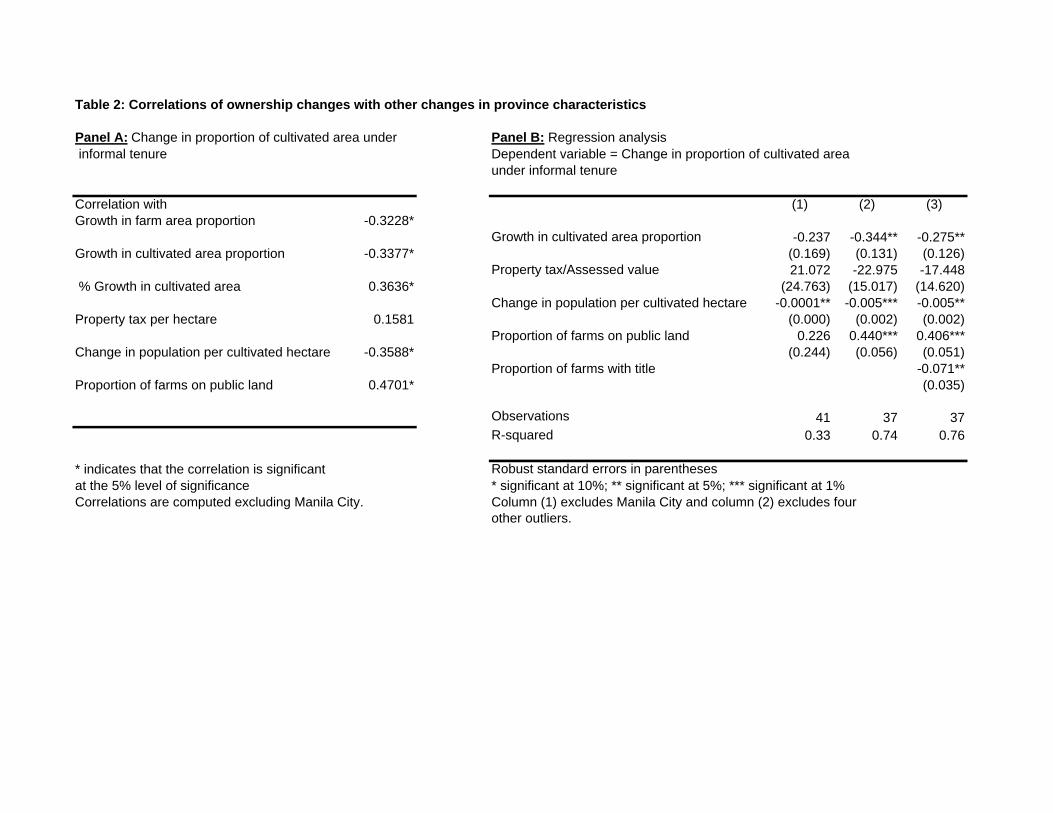
Table 2: Correlations of ownership changes with other changes in province characteristics
Panel A: Change in proportion of cultivated area under Panel B: Regression analysis informal tenure Dependent variable = Change in proportion of cultivated area
under informal tenure
Correlation with (1) (2) (3)Growth in farm area proportion -0.3228*
Growth in cultivated area proportion -0.237 -0.344** -0.275**Growth in cultivated area proportion -0.3377* (0.169) (0.131) (0.126)
Property tax/Assessed value 21.072 -22.975 -17.448 % Growth in cultivated area 0.3636* (24.763) (15.017) (14.620)
Change in population per cultivated hectare -0.0001** -0.005*** -0.005**Property tax per hectare 0.1581 (0.000) (0.002) (0.002)
Proportion of farms on public land 0.226 0.440*** 0.406***Change in population per cultivated hectare -0.3588* (0.244) (0.056) (0.051)
Proportion of farms with title -0.071**Proportion of farms on public land 0.4701* (0.035)
Observations 41 37 37R-squared 0.33 0.74 0.76
* indicates that the correlation is significant Robust standard errors in parenthesesat the 5% level of significance * significant at 10%; ** significant at 5%; *** significant at 1%Correlations are computed excluding Manila City.
other outliers.Column (1) excludes Manila City and column (2) excludes four
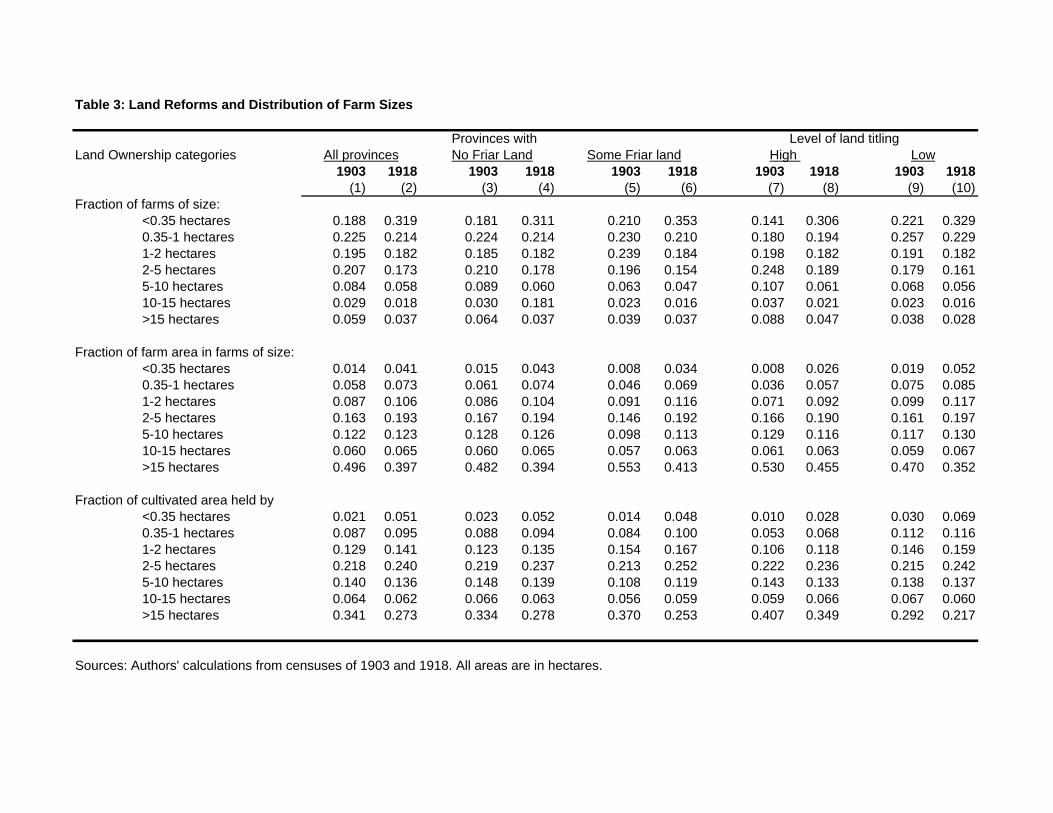
Table 3: Land Reforms and Distribution of Farm Sizes
Provinces with Level of land titlingLand Ownership categories No Friar Land Some Friar land
1903 1918 1903 1918 1903 1918 1903 1918 1903 1918(1) (2) (3) (4) (5) (6) (7) (8) (9) (10)
Fraction of farms of size:<0.35 hectares 0.188 0.319 0.181 0.311 0.210 0.353 0.141 0.306 0.221 0.3290.35-1 hectares 0.225 0.214 0.224 0.214 0.230 0.210 0.180 0.194 0.257 0.2291-2 hectares 0.195 0.182 0.185 0.182 0.239 0.184 0.198 0.182 0.191 0.1822-5 hectares 0.207 0.173 0.210 0.178 0.196 0.154 0.248 0.189 0.179 0.1615-10 hectares 0.084 0.058 0.089 0.060 0.063 0.047 0.107 0.061 0.068 0.05610-15 hectares 0.029 0.018 0.030 0.181 0.023 0.016 0.037 0.021 0.023 0.016>15 hectares 0.059 0.037 0.064 0.037 0.039 0.037 0.088 0.047 0.038 0.028
Fraction of farm area in farms of size:<0.35 hectares 0.014 0.041 0.015 0.043 0.008 0.034 0.008 0.026 0.019 0.0520.35-1 hectares 0.058 0.073 0.061 0.074 0.046 0.069 0.036 0.057 0.075 0.0851-2 hectares 0.087 0.106 0.086 0.104 0.091 0.116 0.071 0.092 0.099 0.1172-5 hectares 0.163 0.193 0.167 0.194 0.146 0.192 0.166 0.190 0.161 0.1975-10 hectares 0.122 0.123 0.128 0.126 0.098 0.113 0.129 0.116 0.117 0.13010-15 hectares 0.060 0.065 0.060 0.065 0.057 0.063 0.061 0.063 0.059 0.067>15 hectares 0.496 0.397 0.482 0.394 0.553 0.413 0.530 0.455 0.470 0.352
Fraction of cultivated area held by<0.35 hectares 0.021 0.051 0.023 0.052 0.014 0.048 0.010 0.028 0.030 0.0690.35-1 hectares 0.087 0.095 0.088 0.094 0.084 0.100 0.053 0.068 0.112 0.1161-2 hectares 0.129 0.141 0.123 0.135 0.154 0.167 0.106 0.118 0.146 0.1592-5 hectares 0.218 0.240 0.219 0.237 0.213 0.252 0.222 0.236 0.215 0.2425-10 hectares 0.140 0.136 0.148 0.139 0.108 0.119 0.143 0.133 0.138 0.13710-15 hectares 0.064 0.062 0.066 0.063 0.056 0.059 0.059 0.066 0.067 0.060>15 hectares 0.341 0.273 0.334 0.278 0.370 0.253 0.407 0.349 0.292 0.217
Sources: Authors' calculations from censuses of 1903 and 1918. All areas are in hectares.
High LowAll provinces
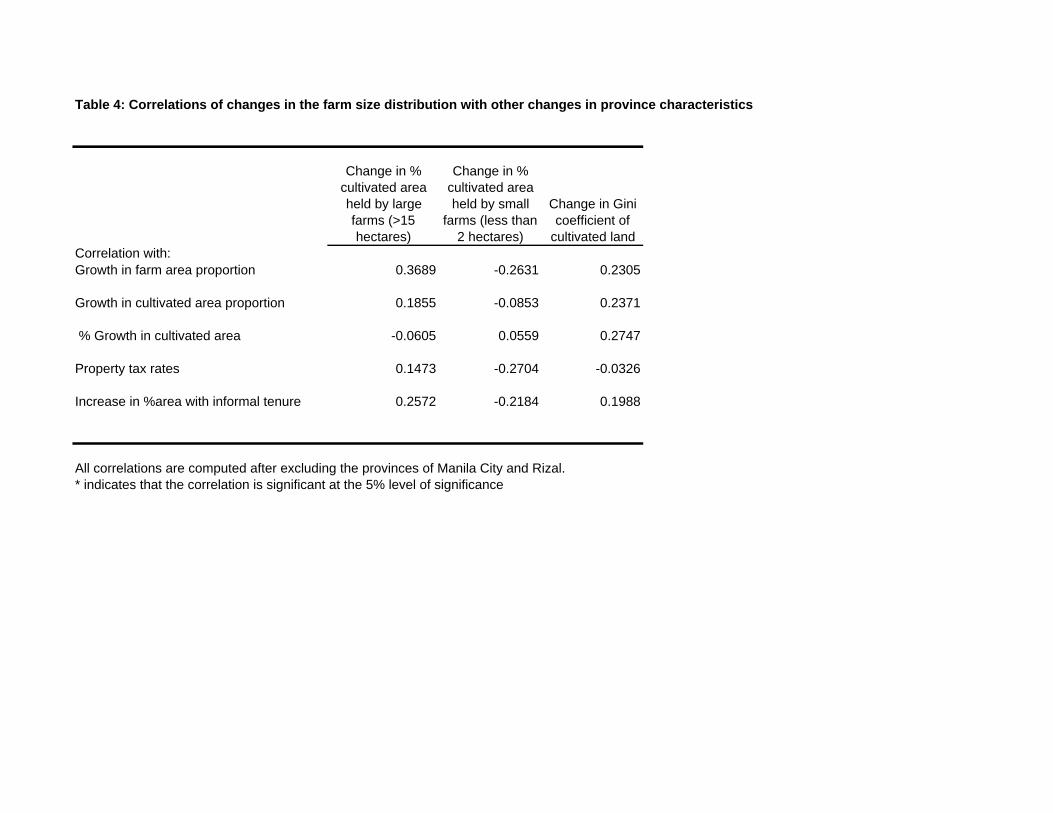
Table 4: Correlations of changes in the farm size distribution with other changes in province characteristics
Change in % cultivated area held by large farms (>15 hectares)
Change in % cultivated area held by small
farms (less than 2 hectares)
Change in Gini coefficient of
cultivated landCorrelation with:Growth in farm area proportion 0.3689 -0.2631 0.2305
Growth in cultivated area proportion 0.1855 -0.0853 0.2371
% Growth in cultivated area -0.0605 0.0559 0.2747
Property tax rates 0.1473 -0.2704 -0.0326
Increase in %area with informal tenure 0.2572 -0.2184 0.1988
All correlations are computed after excluding the provinces of Manila City and Rizal.* indicates that the correlation is significant at the 5% level of significance
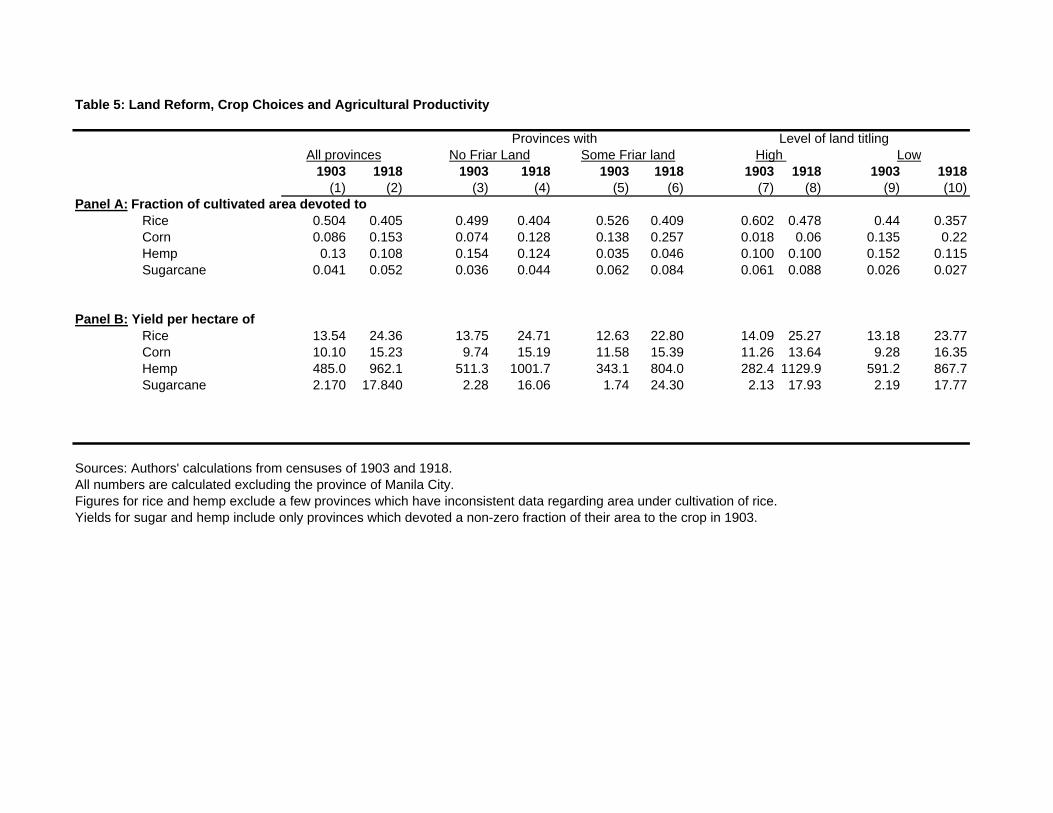
Table 5: Land Reform, Crop Choices and Agricultural Productivity
Level of land titling
1903 1918 1903 1918 1903 1918 1903 1918 1903 1918(1) (2) (3) (4) (5) (6) (7) (8) (9) (10)
Panel A: Fraction of cultivated area devoted toRice 0.504 0.405 0.499 0.404 0.526 0.409 0.602 0.478 0.44 0.357Corn 0.086 0.153 0.074 0.128 0.138 0.257 0.018 0.06 0.135 0.22Hemp 0.13 0.108 0.154 0.124 0.035 0.046 0.100 0.100 0.152 0.115Sugarcane 0.041 0.052 0.036 0.044 0.062 0.084 0.061 0.088 0.026 0.027
Panel B: Yield per hectare ofRice 13.54 24.36 13.75 24.71 12.63 22.80 14.09 25.27 13.18 23.77Corn 10.10 15.23 9.74 15.19 11.58 15.39 11.26 13.64 9.28 16.35Hemp 485.0 962.1 511.3 1001.7 343.1 804.0 282.4 1129.9 591.2 867.7Sugarcane 2.170 17.840 2.28 16.06 1.74 24.30 2.13 17.93 2.19 17.77
Sources: Authors' calculations from censuses of 1903 and 1918. All numbers are calculated excluding the province of Manila City.Figures for rice and hemp exclude a few provinces which have inconsistent data regarding area under cultivation of rice.Yields for sugar and hemp include only provinces which devoted a non-zero fraction of their area to the crop in 1903.
All provinces High LowProvinces with
No Friar Land Some Friar land
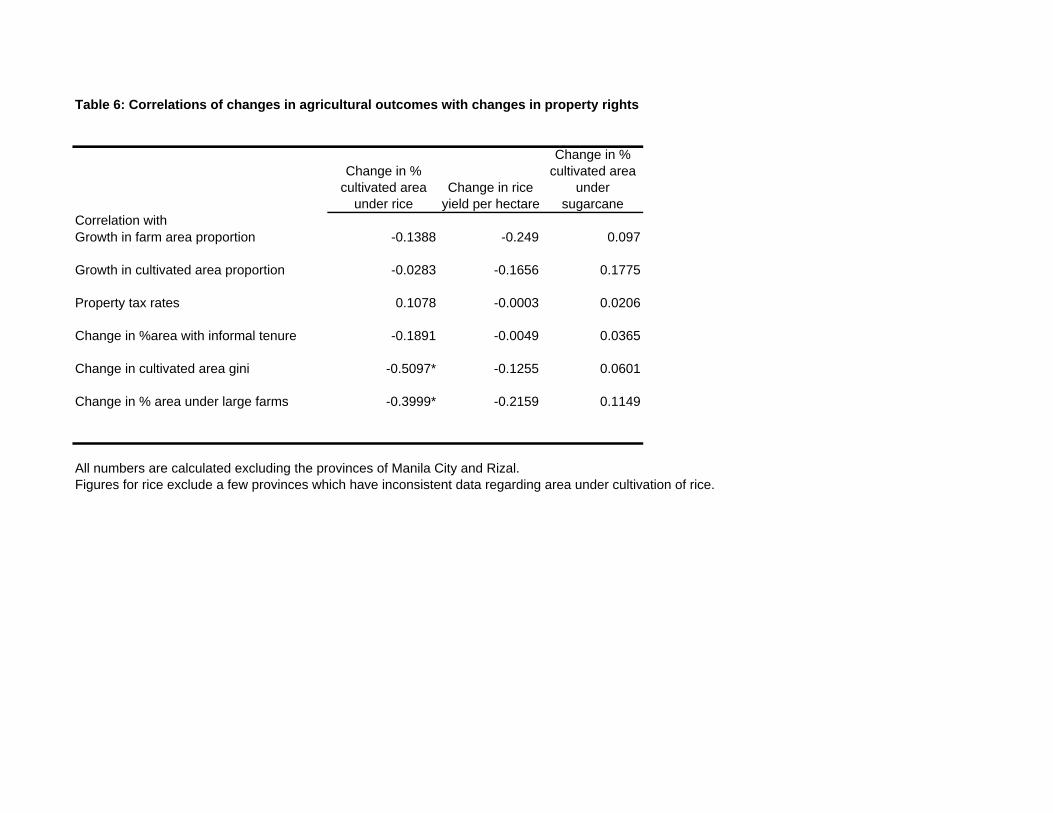
Table 6: Correlations of changes in agricultural outcomes with changes in property rights
Change in % cultivated area
under riceChange in rice
yield per hectare
Change in % cultivated area
under sugarcane
Correlation withGrowth in farm area proportion -0.1388 -0.249 0.097
Growth in cultivated area proportion -0.0283 -0.1656 0.1775
Property tax rates 0.1078 -0.0003 0.0206
Change in %area with informal tenure -0.1891 -0.0049 0.0365
Change in cultivated area gini -0.5097* -0.1255 0.0601
Change in % area under large farms -0.3999* -0.2159 0.1149
All numbers are calculated excluding the provinces of Manila City and Rizal.Figures for rice exclude a few provinces which have inconsistent data regarding area under cultivation of rice.
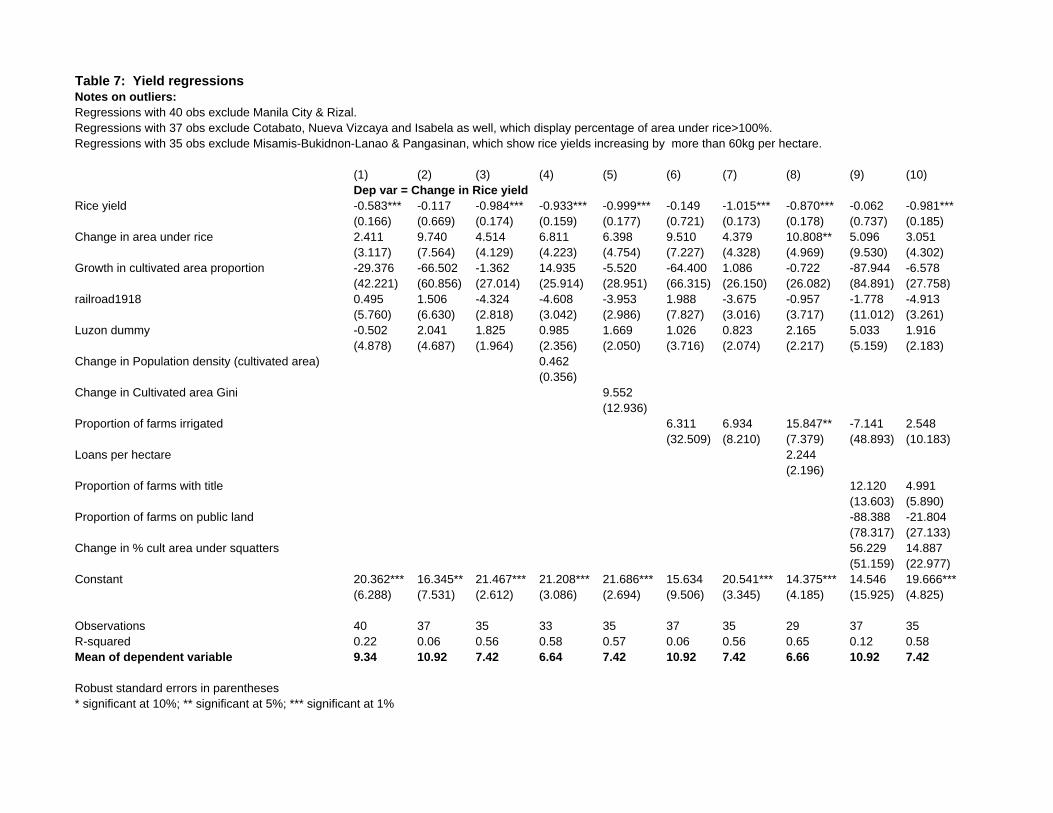
Table 7: Yield regressionsNotes on outliers:Regressions with 40 obs exclude Manila City & Rizal.Regressions with 37 obs exclude Cotabato, Nueva Vizcaya and Isabela as well, which display percentage of area under rice>100%.Regressions with 35 obs exclude Misamis-Bukidnon-Lanao & Pangasinan, which show rice yields increasing by more than 60kg per hectare.
(1) (2) (3) (4) (5) (6) (7) (8) (9) (10)Dep var = Change in Rice yield
Rice yield -0.583*** -0.117 -0.984*** -0.933*** -0.999*** -0.149 -1.015*** -0.870*** -0.062 -0.981***(0.166) (0.669) (0.174) (0.159) (0.177) (0.721) (0.173) (0.178) (0.737) (0.185)
Change in area under rice 2.411 9.740 4.514 6.811 6.398 9.510 4.379 10.808** 5.096 3.051(3.117) (7.564) (4.129) (4.223) (4.754) (7.227) (4.328) (4.969) (9.530) (4.302)
Growth in cultivated area proportion -29.376 -66.502 -1.362 14.935 -5.520 -64.400 1.086 -0.722 -87.944 -6.578(42.221) (60.856) (27.014) (25.914) (28.951) (66.315) (26.150) (26.082) (84.891) (27.758)
railroad1918 0.495 1.506 -4.324 -4.608 -3.953 1.988 -3.675 -0.957 -1.778 -4.913(5.760) (6.630) (2.818) (3.042) (2.986) (7.827) (3.016) (3.717) (11.012) (3.261)
Luzon dummy -0.502 2.041 1.825 0.985 1.669 1.026 0.823 2.165 5.033 1.916(4.878) (4.687) (1.964) (2.356) (2.050) (3.716) (2.074) (2.217) (5.159) (2.183)
Change in Population density (cultivated area) 0.462(0.356)
Change in Cultivated area Gini 9.552(12.936)
Proportion of farms irrigated 6.311 6.934 15.847** -7.141 2.548(32.509) (8.210) (7.379) (48.893) (10.183)
Loans per hectare 2.244(2.196)
Proportion of farms with title 12.120 4.991(13.603) (5.890)
Proportion of farms on public land -88.388 -21.804(78.317) (27.133)
Change in % cult area under squatters 56.229 14.887(51.159) (22.977)
Constant 20.362*** 16.345** 21.467*** 21.208*** 21.686*** 15.634 20.541*** 14.375*** 14.546 19.666***(6.288) (7.531) (2.612) (3.086) (2.694) (9.506) (3.345) (4.185) (15.925) (4.825)
Observations 40 37 35 33 35 37 35 29 37 35R-squared 0.22 0.06 0.56 0.58 0.57 0.06 0.56 0.65 0.12 0.58Mean of dependent variable 9.34 10.92 7.42 6.64 7.42 10.92 7.42 6.66 10.92 7.42
Robust standard errors in parentheses* significant at 10%; ** significant at 5%; *** significant at 1%
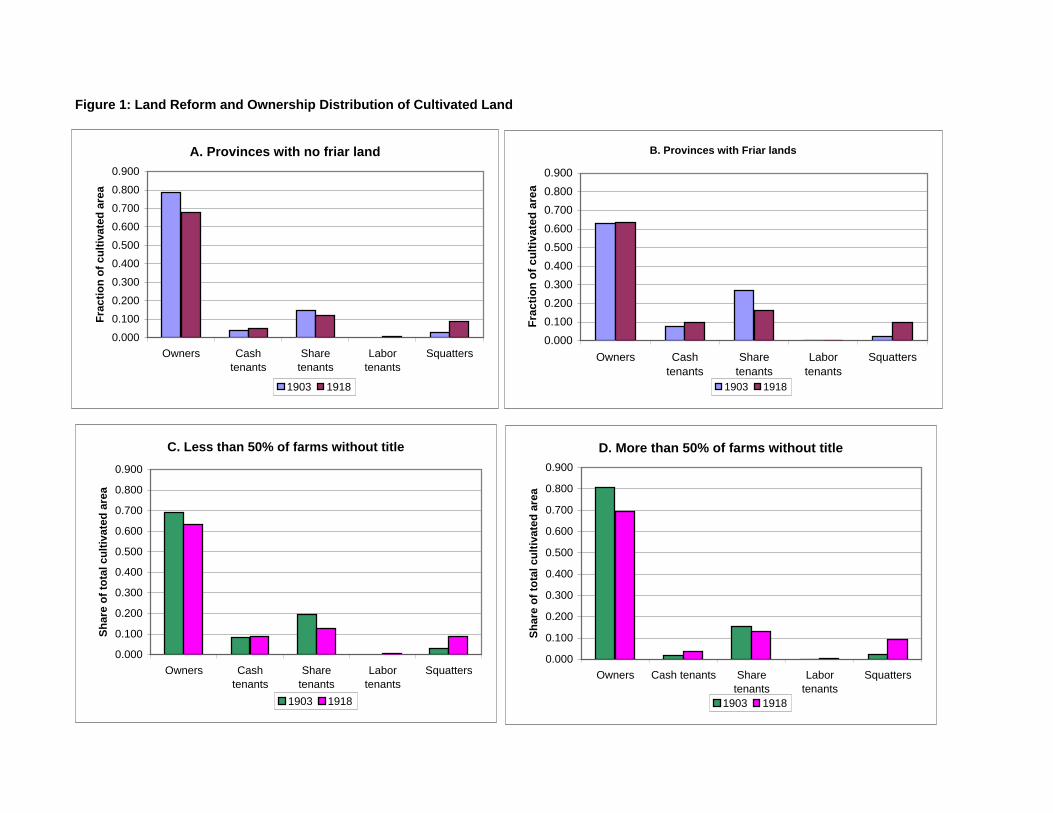
Figure 1: Land Reform and Ownership Distribution of Cultivated Land
A. Provinces with no friar land
0.000
0.100
0.200
0.300
0.400
0.500
0.600
0.700
0.800
0.900
Owners Cashtenants
Sharetenants
Labortenants
Squatters
Frac
tion
of c
ultiv
ated
are
a
1903 1918
B. Provinces with Friar lands
0.0000.1000.2000.3000.4000.5000.6000.7000.8000.900
Owners Cashtenants
Sharetenants
Labortenants
Squatters
Frac
tion
of c
ultiv
ated
are
a
1903 1918
C. Less than 50% of farms without title
0.000
0.100
0.200
0.300
0.400
0.500
0.600
0.700
0.800
0.900
Owners Cashtenants
Sharetenants
Labortenants
Squatters
Shar
e of
tota
l cul
tivat
ed a
rea
1903 1918
D. More than 50% of farms without title
0.000
0.100
0.200
0.300
0.400
0.500
0.600
0.700
0.800
0.900
Owners Cash tenants Sharetenants
Labortenants
Squatters
Shar
e of
tota
l cul
tivat
ed a
rea
1903 1918
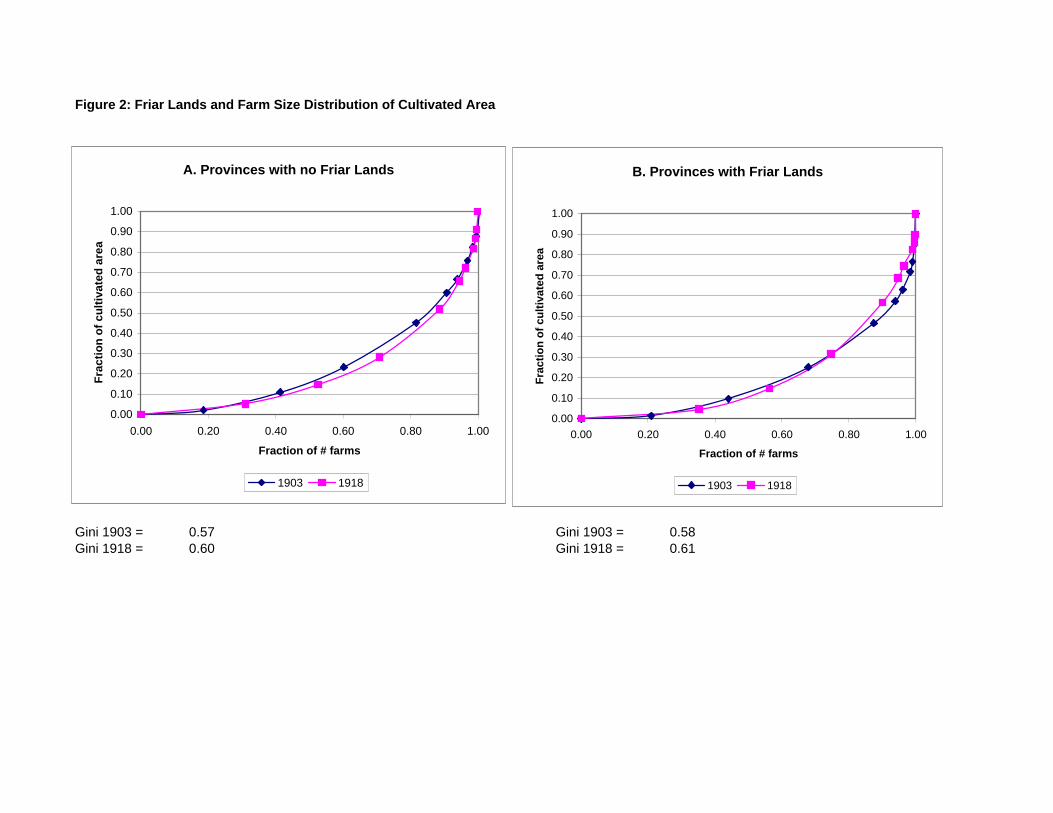
Figure 2: Friar Lands and Farm Size Distribution of Cultivated Area
Gini 1903 = 0.57 Gini 1903 = 0.58Gini 1918 = 0.60 Gini 1918 = 0.61
A. Provinces with no Friar Lands
0.00
0.10
0.20
0.30
0.40
0.50
0.60
0.70
0.80
0.90
1.00
0.00 0.20 0.40 0.60 0.80 1.00
Fraction of # farms
Frac
tion
of c
ultiv
ated
are
a
1903 1918
B. Provinces with Friar Lands
0.00
0.10
0.20
0.30
0.40
0.50
0.60
0.70
0.80
0.90
1.00
0.00 0.20 0.40 0.60 0.80 1.00
Fraction of # farms
Frac
tion
of c
ultiv
ated
are
a
1903 1918
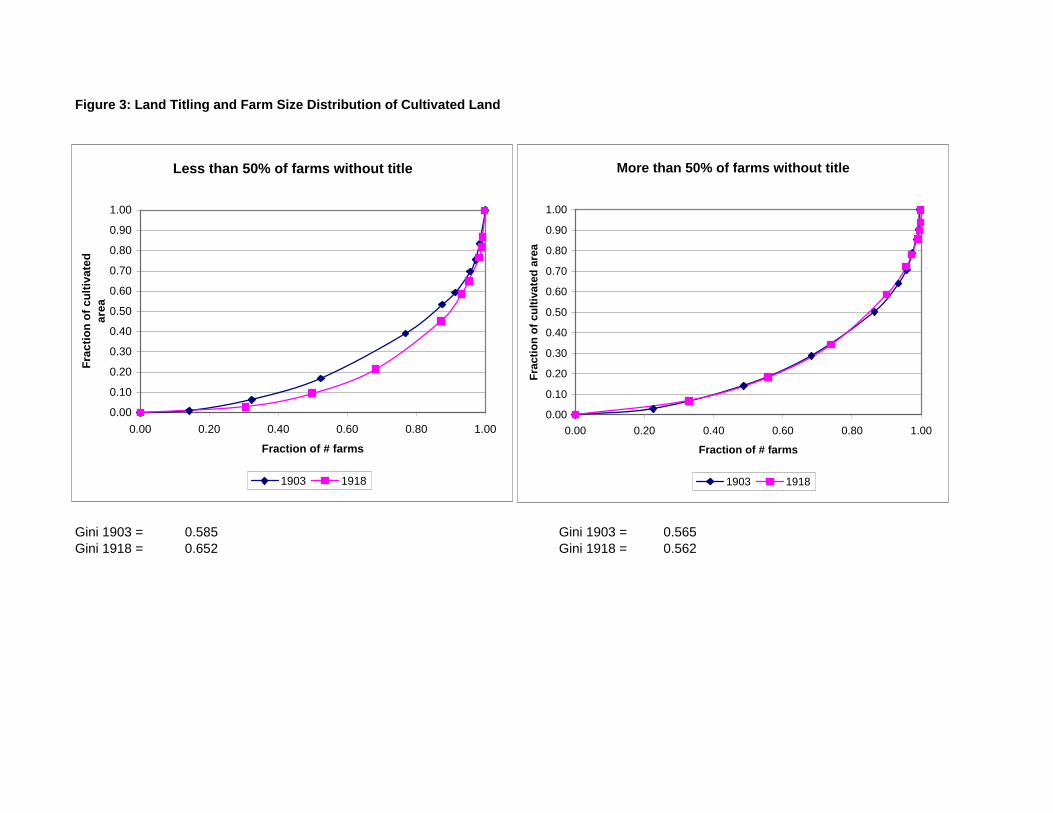
Figure 3: Land Titling and Farm Size Distribution of Cultivated Land
Gini 1903 = 0.585 Gini 1903 = 0.565Gini 1918 = 0.652 Gini 1918 = 0.562
Less than 50% of farms without title
0.00
0.10
0.20
0.30
0.40
0.50
0.60
0.70
0.80
0.90
1.00
0.00 0.20 0.40 0.60 0.80 1.00
Fraction of # farms
Frac
tion
of c
ultiv
ated
ar
ea
1903 1918
More than 50% of farms without title
0.00
0.10
0.20
0.30
0.40
0.50
0.60
0.70
0.80
0.90
1.00
0.00 0.20 0.40 0.60 0.80 1.00
Fraction of # farms
Frac
tion
of c
ultiv
ated
are
a
1903 1918