Embed Size (px)
Citation preview
Policies of Change GUIDING PRINCIPLES THAT MAY HELP SHAPE THE GLOBAL ECONOMY
November 2017
Policies of Change
2
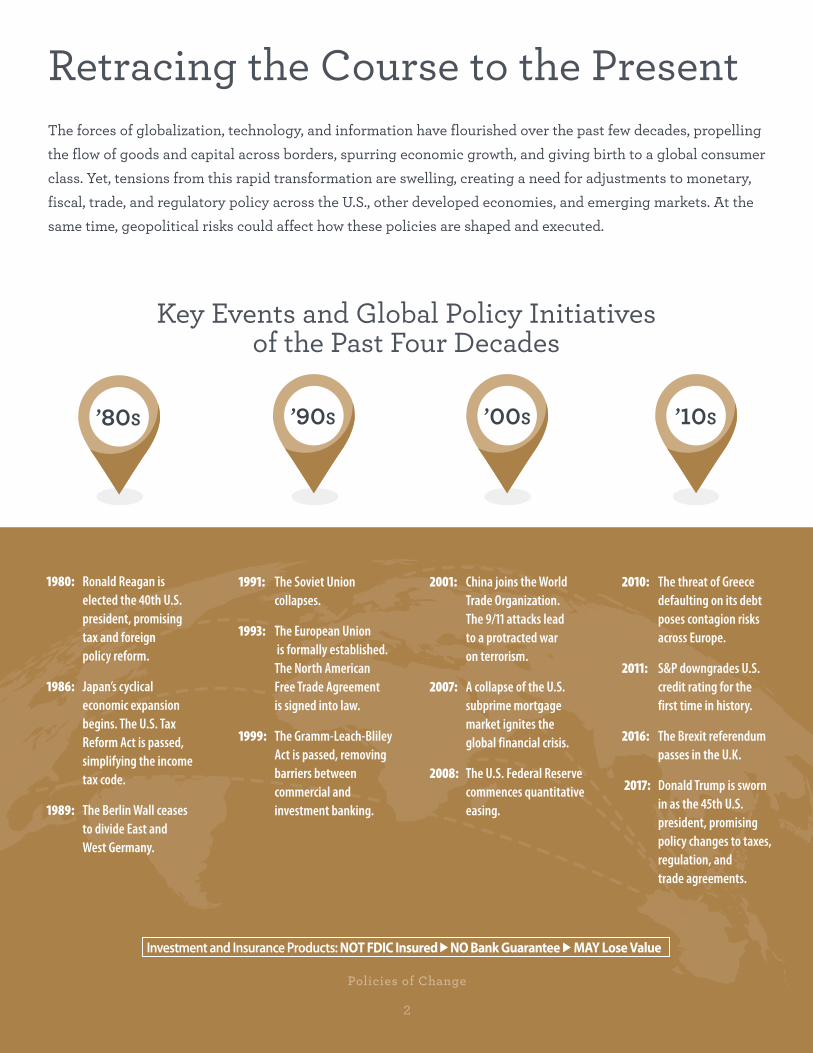
Retracing the Course to the Present The forces of globalization, technology, and information have flourished over the past few decades, propelling
the flow of goods and capital across borders, spurring economic growth, and giving birth to a global consumer
class. Yet, tensions from this rapid transformation are swelling, creating a need for adjustments to monetary,
fiscal, trade, and regulatory policy across the U.S., other developed economies, and emerging markets. At the
same time, geopolitical risks could affect how these policies are shaped and executed.
Key Events and Global Policy Initiatives of the Past Four Decades
’80S
1980: Ronald Reagan is elected the 40th U.S. president, promising tax and foreign policy reform.
1986: Japan’s cyclical economic expansion begins. The U.S. Tax Reform Act is passed, simplifying the income tax code.
1989: The Berlin Wall ceases to divide East and West Germany.
’90S
1991: The Soviet Union collapses.
1993: The European Union is formally established. The North American Free Trade Agreement is signed into law.
1999: The Gramm-Leach-Bliley Act is passed, removing barriers between commercial and investment banking.
’00S
2001: China joins the World Trade Organization. The 9/11 attacks lead to a protracted war on terrorism.
2007: A collapse of the U.S. subprime mortgage market ignites the global financial crisis.
2008: The U.S. Federal Reserve commences quantitative easing.
’10S
2010: The threat of Greece defaulting on its debt poses contagion risks across Europe.
2011: S&P downgrades U.S. credit rating for the first time in history.
2016: The Brexit referendum passes in the U.K.
2017: Donald Trump is sworn in as the 45th U.S. president, promising policy changes to taxes, regulation, and trade agreements.
Investment and Insurance Products: NOT FDIC Insured ► NO Bank Guarantee ► MAY Lose Value
Policies of Change
3
►
►
►
►
Austr
New Zealand
Singapore
United States
Canada
United Kingdom
Hong Kong
Australia
Japan
Germany
Russia
China
WHAT’S INSIDE
How Fiscal, Monetary, Regulatory, and Trade Policies Affect Investors . . . 4
Policy Trends in the U.S. . . . 6
Policy Trends Across Developed Markets . . . . . . 10
Policy Trends Across Emerging Markets . . . . . . . 12
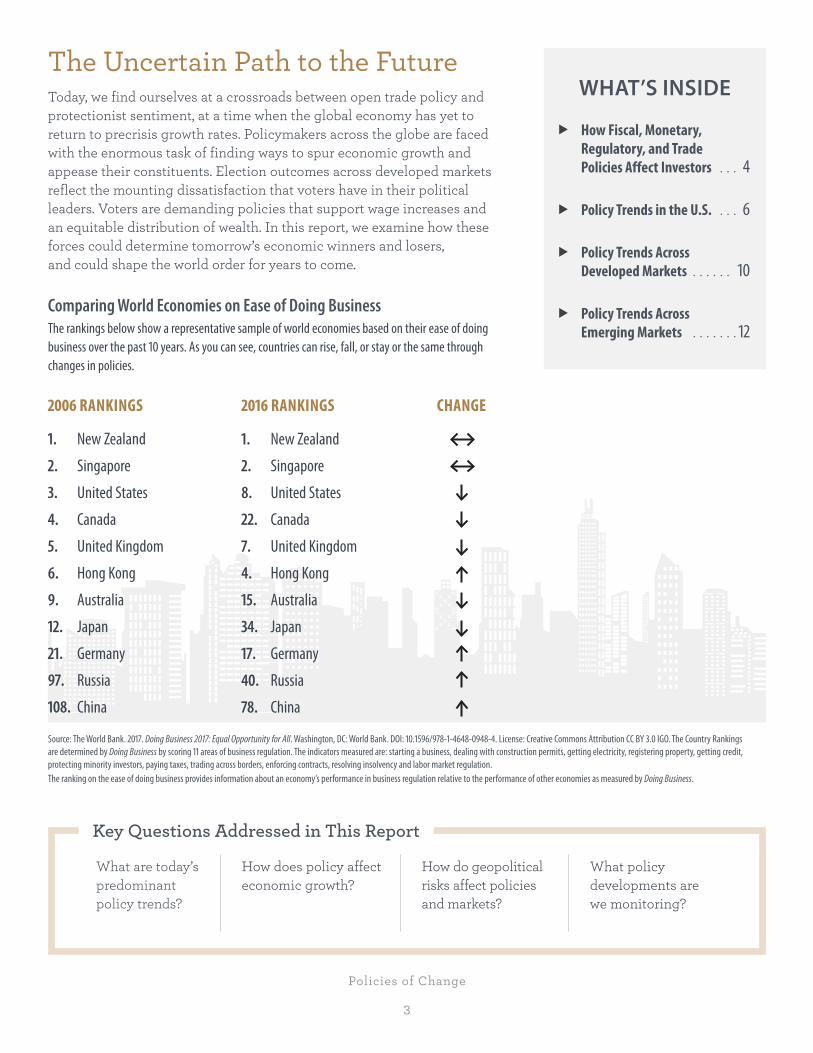
The Uncertain Path to the Future Today, we find ourselves at a crossroads between open trade policy and protectionist sentiment, at a time when the global economy has yet to return to precrisis growth rates. Policymakers across the globe are faced with the enormous task of finding ways to spur economic growth and appease their constituents. Election outcomes across developed markets reflect the mounting dissatisfaction that voters have in their political leaders. Voters are demanding policies that support wage increases and an equitable distribution of wealth. In this report, we examine how these forces could determine tomorrow’s economic winners and losers, and could shape the world order for years to come.
Comparing World Economies on Ease of Doing Business The rankings below show a representative sample of world economies based on their ease of doing business over the past 10 years. As you can see, countries can rise, fall, or stay or the same through changes in policies.
2006 RANKINGS 2016 RANKINGS CHANGE
New Zealand1. 1.
Singapore2. 2.
United States3. 8.
Canada4. 22.
United Kingdom5. 7.
Hong Kong6. 4.
Australia9. 15.
Japan12. 34.
Germany21. 17.
Russia97. 40.
China108. 78.
Source: The World Bank. 2017. Doing Business 217: Equal Opportunity for All. Washington, DC: World Bank. DOI: 10.1596/978-1-4648-0948-4. License: Creative Commons Attribution CC BY 3.0 IGO. The Country Rankings are determined by Doing Business by scoring 11 areas of business regulation. The indicators measured are: starting a business, dealing with construction permits, getting electricity, registering property, getting credit, protecting minority investors, paying taxes, trading across borders, enforcing contracts, resolving insolvency and labor market regulation. The ranking on the ease of doing business provides information about an economy’s performance in business regulation relative to the performance of other economies as measured by Doing Business.
Key Questions Addressed in This Report
What are today’s predominant policy trends?
How does policy affect economic growth?
How do geopolitical risks affect policies and markets?
What policy developments are we monitoring?
Policies of Change
4
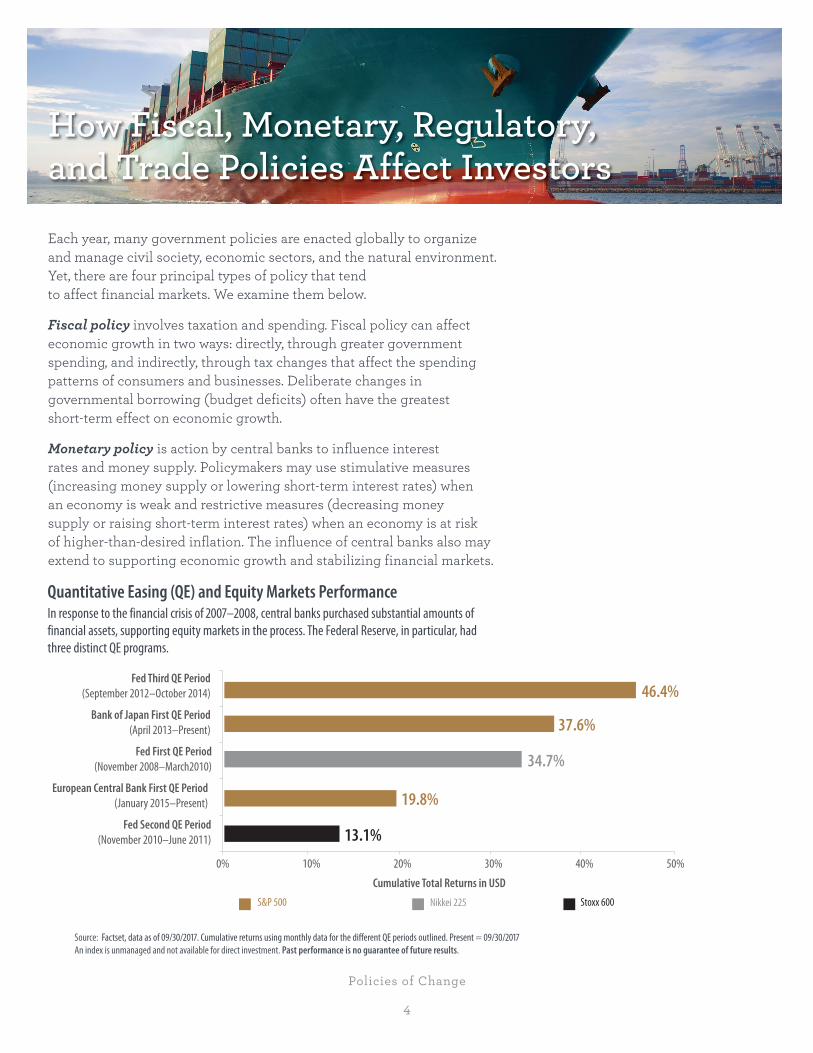
How Fiscal, Monetary, Regulatory, and Trade Policies Affect Investors
Each year, many government policies are enacted globally to organize and manage civil society, economic sectors, and the natural environment. Yet, there are four principal types of policy that tend to affect financial markets. We examine them below.
Fiscal policy involves taxation and spending. Fiscal policy can affect economic growth in two ways: directly, through greater government spending, and indirectly, through tax changes that affect the spending patterns of consumers and businesses. Deliberate changes in governmental borrowing (budget deficits) often have the greatest short-term effect on economic growth.
Monetary policy is action by central banks to influence interest rates and money supply. Policymakers may use stimulative measures (increasing money supply or lowering short-term interest rates) when an economy is weak and restrictive measures (decreasing money supply or raising short-term interest rates) when an economy is at risk of higher-than-desired inflation. The influence of central banks also may extend to supporting economic growth and stabilizing financial markets.
Quantitative Easing (QE) and Equity Markets Performance In response to the financial crisis of 2007–2008, central banks purchased substantial amounts of financial assets, supporting equity markets in the process. The Federal Reserve, in particular, had three distinct QE programs.
Source: Factset, data as of 09/30/2017. Cumulative returns using monthly data for the different QE periods outlined. Present = 09/30/2017 An index is unmanaged and not available for direct investment. Past performance is no guarantee of future results.
Fed First QE Period(November 2008–March2010)
Fed Third QE Period(September 2012–October 2014)
Bank of Japan First QE Period(April 2013–Present)
Fed Second QE Period(November 2010–June 2011)
European Central Bank First QE Period(January 2015–Present)
0% 10% 20% 30% 40% 50%
46.4%
37.6%
19.8%
13.1%
34.7%
S&P 500 Nikkei 225 Stoxx 600
Cumulative Total Returns in USD
Policies of Change
5
Regulatory policy influences the economy by mandating what is permitted in the marketplace. Typically, governments have a set of regulations for a variety of areas, such as labor, banking and insurance, and environmental safety. Regulatory policies often pose risks for economic growth through increased costs and losses in productivity.
Trade policy sets the rules and regulations that apply to trade relations between countries. These policies are either country-specific or set by a trading bloc such as the European Union (EU). Often, these policies are formulated to boost a nation’s international trade and grow its economy. A trade policy typically includes import and export taxes, inspection rules, and tariffs and quotas.
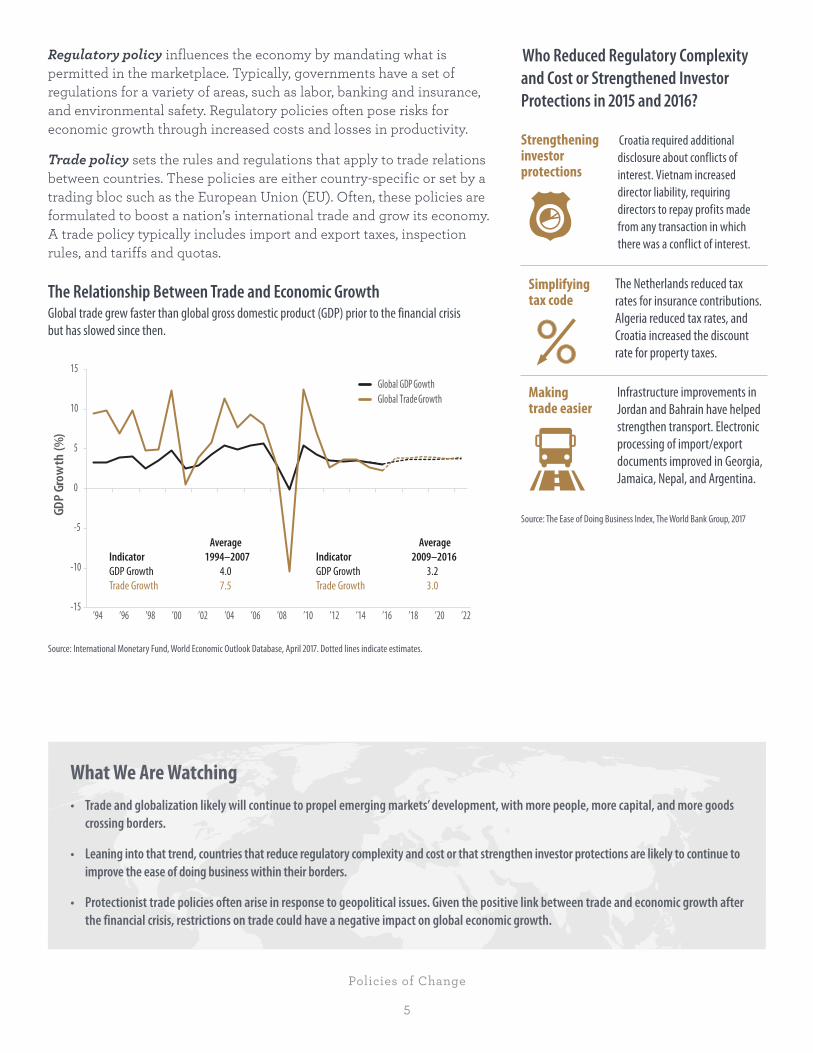
The Relationship Between Trade and Economic Growth Global trade grew faster than global gross domestic product (GDP) prior to the financial crisis but has slowed since then.
Source: International Monetary Fund, World Economic Outlook Database, April 2017. Dotted lines indicate estimates.
Who Reduced Regulatory Complexity and Cost or Strengthened Investor Protections in 2015 and 2016?
Strengthening investor protections
Croatia required additional disclosure about conflicts of interest. Vietnam increased director liability, requiring directors to repay profits made from any transaction in which there was a conflict of interest.
Simplifying tax code
The Netherlands reduced tax rates for insurance contributions. Algeria reduced tax rates, and Croatia increased the discount rate for property taxes.
Making trade easier
Infrastructure improvements in Jordan and Bahrain have helped strengthen transport. Electronic processing of import/export documents improved in Georgia, Jamaica, Nepal, and Argentina.
Source: The Ease of Doing Business Index, The World Bank Group, 2017
What We Are Watching • Trade and globalization likely will continue to propel emerging markets’ development, with more people, more capital, and more goods
crossing borders.
• Leaning into that trend, countries that reduce regulatory complexity and cost or that strengthen investor protections are likely to continue to improve the ease of doing business within their borders.
• Protectionist trade policies often arise in response to geopolitical issues. Given the positive link between trade and economic growth after the financial crisis, restrictions on trade could have a negative impact on global economic growth.
-15
-10
-5
0
5
10
15
’94 ’96 ’98 ’00 ’02 ’04 ’06 ’08 ’10 ’12 ’14 ’16 ’18 ’20 ’22
GDP
Grow
th (%
)
Global GDP GowthGlobal Trade Growth
AverageIndicator 1994–2007GDP Growth 4.0Trade Growth 7.5
AverageIndicator 2009–2016GDP Growth 3.2Trade Growth 3.0
Policies of Change
6
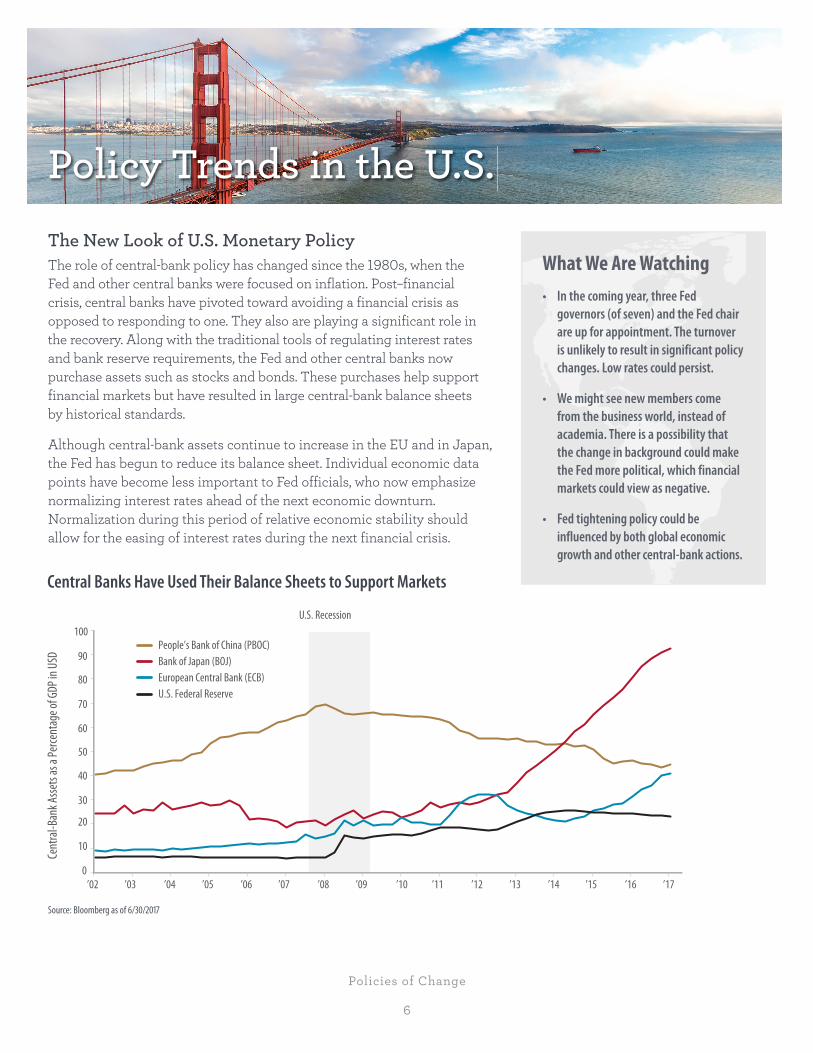
Policy Trends in the U.S. The New Look of U.S. Monetary Policy The role of central-bank policy has changed since the 1980s, when the Fed and other central banks were focused on inflation. Post–financial crisis, central banks have pivoted toward avoiding a financial crisis as opposed to responding to one. They also are playing a significant role in the recovery. Along with the traditional tools of regulating interest rates and bank reserve requirements, the Fed and other central banks now purchase assets such as stocks and bonds. These purchases help support financial markets but have resulted in large central-bank balance sheets by historical standards.
Although central-bank assets continue to increase in the EU and in Japan, the Fed has begun to reduce its balance sheet. Individual economic data points have become less important to Fed officials, who now emphasize normalizing interest rates ahead of the next economic downturn. Normalization during this period of relative economic stability should allow for the easing of interest rates during the next financial crisis.
Central Banks Have Used Their Balance Sheets to Support Markets
Source: Bloomberg as of 6/30/2017
What We Are Watching • In the coming year, three Fed
governors (of seven) and the Fed chair are up for appointment. The turnover is unlikely to result in significant policy changes. Low rates could persist.
• We might see new members come from the business world, instead of academia. There is a possibility that the change in background could make the Fed more political, which financial markets could view as negative.
• Fed tightening policy could be influenced by both global economic growth and other central-bank actions.
Cent
ral-B
ank A
ssets
as a
Perce
ntag
e of G
DP in
USD
People’s Bank of China (PBOC)Bank of Japan (BOJ)European Central Bank (ECB)U.S. Federal Reserve
U.S. Recession
0’02 ’03 ’04 ’05 ’06 ’07 ’08 ’09 ’10 ’11 ’12 ’13 ’14 ’15 ’16 ’17
10
20
30
40
50
60
70
80
90
100
Policies of Change
7
U.S. Tax Policy Takes Center Stage Individual Taxes: The goals of the Trump administration’s proposed tax reforms echo those of the Reagan tax reforms of 1986—simplify the tax code by reducing the number of brackets and allowable deductions while lowering overall tax rates. We do not believe that individual tax rates will be lowered dramatically, mainly because significant tax cuts could expand the deficit. It is likely that some households will see a lower tax bill while others may see higher taxes, prompting a reconsideration of tax planning.
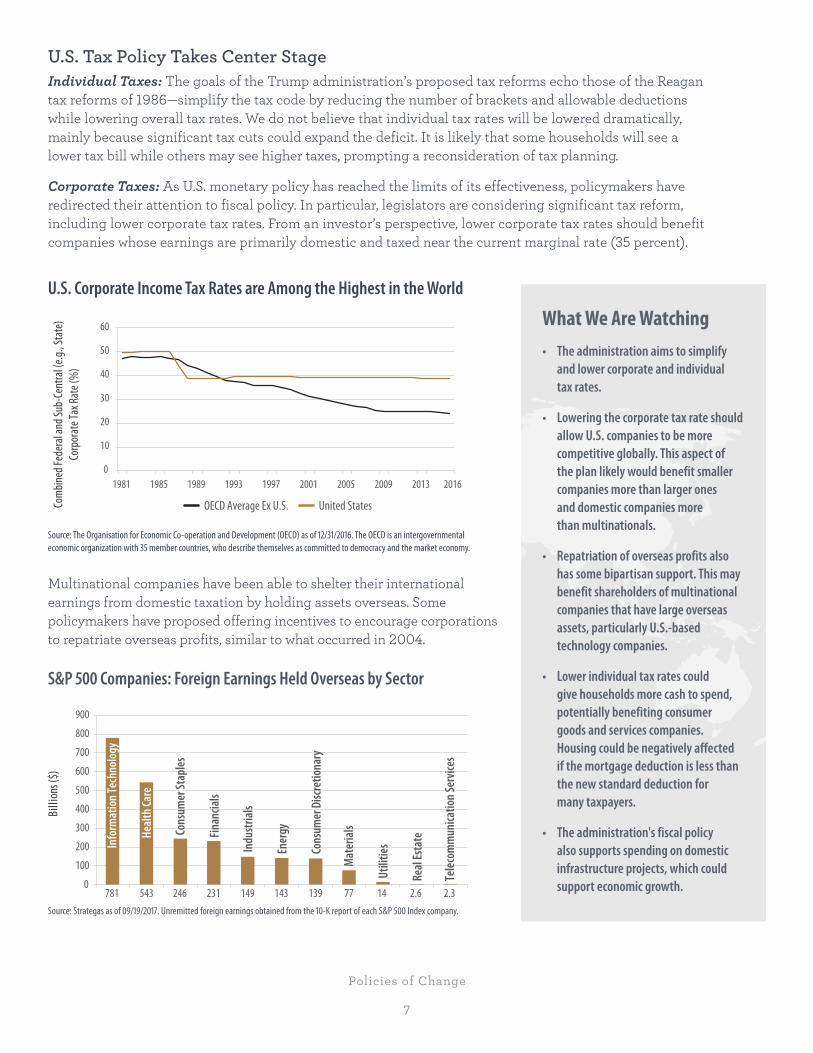
Corporate Taxes: As U.S. monetary policy has reached the limits of its effectiveness, policymakers have redirected their attention to fiscal policy. In particular, legislators are considering significant tax reform, including lower corporate tax rates. From an investor’s perspective, lower corporate tax rates should benefit companies whose earnings are primarily domestic and taxed near the current marginal rate (35 percent).
U.S. Corporate Income Tax Rates are Among the Highest in the World
Source: The Organisation for Economic Co-operation and Development (OECD) as of 12/31/2016. The OECD is an intergovernmental economic organization with 35 member countries, who describe themselves as committed to democracy and the market economy.
Multinational companies have been able to shelter their international earnings from domestic taxation by holding assets overseas. Some policymakers have proposed offering incentives to encourage corporations to repatriate overseas profits, similar to what occurred in 2004.
S&P 500 Companies: Foreign Earnings Held Overseas by Sector
Source: Strategas as of 09/19/2017. Unremitted foreign earnings obtained from the 10-K report of each S&P 500 Index company.
What We Are Watching • The administration aims to simplify
and lower corporate and individual tax rates.
• Lowering the corporate tax rate should allow U.S. companies to be more competitive globally. This aspect of the plan likely would benefit smaller companies more than larger ones and domestic companies more than multinationals.
• Repatriation of overseas profits also has some bipartisan support. This may benefit shareholders of multinational companies that have large overseas assets, particularly U.S.-based technology companies.
• Lower individual tax rates could give households more cash to spend, potentially benefiting consumer goods and services companies. Housing could be negatively affected if the mortgage deduction is less than the new standard deduction for many taxpayers.
• The administration's fiscal policy also supports spending on domestic infrastructure projects, which could support economic growth.
C
0
10
20
30
40
50
60
1981 1985 1989 1993 1997 2001 2005 2009 2013 2016
ombin
ed Fe
dera
l and
Sub-
Cent
ral (
e.g., S
tate
)Co
rpor
ate T
ax Ra
te (%
)
OECD Average Ex U.S. United States
0
100
200
300
400
500
600
700
800
900
Billi
ons (
$)
Info
rmat
ion T
echn
olog
y
Heal
th Ca
re
Cons
umer
Stap
les
Finan
cials
Indu
stria
ls
Ener
gy
Cons
umer
Disc
retio
nary
Mat
eria
ls
Utili
ties
Real
Esta
te
Tele
com
mun
icatio
n Ser
vices
781 543 246 231 149 143 139 77 14 2.6 2.3
Policies of Change
8
Rethinking U.S. Regulatory Policies In the aftermath of the financial crisis, policymakers passed legislation designed to avert a similar financial crisis in the future. This legislation included financial industry reforms and increased consumer protection regulations. Additionally, health care reform was enacted during this period with effects that reached far beyond the health care industry. The Affordable Care Act meant significant changes throughout the business community and insurance sector.
Now, nearly a decade after the crisis, some policymakers favor deregulation to promote employment and enhance economic growth. President Trump has promised to eliminate two regulations for every new one enacted going forward. Regulatory policies that have been the subject of congressional focus include health care, environmental, and financial regulation.
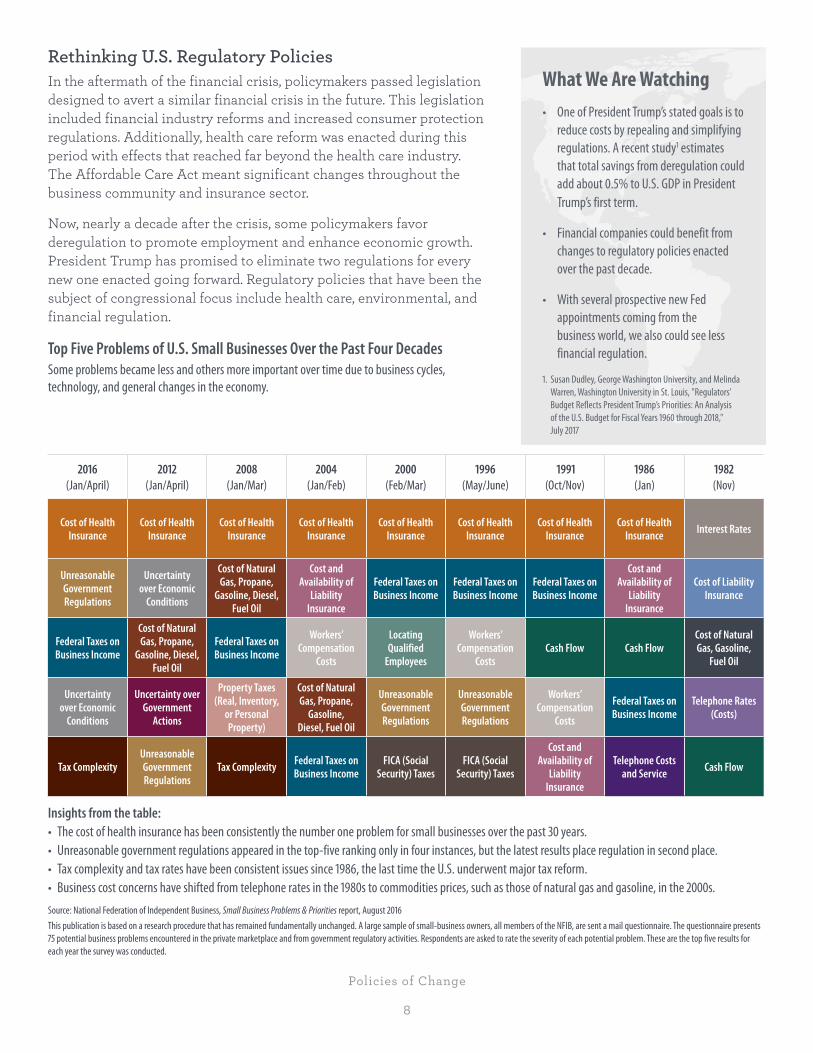
Top Five Problems of U.S. Small Businesses Over the Past Four Decades Some problems became less and others more important over time due to business cycles, technology, and general changes in the economy.
2016 (Jan/April)
2012 (Jan/April)
2008 (Jan/Mar)
2004 (Jan/Feb)
2000 (Feb/Mar)
1996 (May/June)
1991 (Oct/Nov)
1986 (Jan)
1982 (Nov)
Cost of Health Insurance
Cost of Health Insurance
Cost of Health Insurance
Cost of Health Insurance
Cost of Health Insurance
Cost of Health Insurance
Cost of Health Insurance
Cost of Health Insurance Interest Rates
Unreasonable Government Regulations
Uncertainty over Economic
Conditions
Cost of Natural Gas, Propane,
Gasoline, Diesel, Fuel Oil
Cost and Availability of
Liability Insurance
Federal Taxes on Business Income
Federal Taxes on Business Income
Federal Taxes on Business Income
Cost and Availability of
Liability Insurance
Cost of Liability Insurance
Federal Taxes on Business Income
Cost of Natural Gas, Propane,
Gasoline, Diesel, Fuel Oil
Federal Taxes on Business Income
Workers’ Compensation
Costs
Locating Qualified
Employees
Workers’ Compensation
Costs Cash Flow Cash Flow
Cost of Natural Gas, Gasoline,
Fuel Oil
Uncertainty over Economic
Conditions
Uncertainty over Government
Actions
Property Taxes (Real, Inventory,
or Personal Property)
Cost of Natural Gas, Propane,
Gasoline, Diesel, Fuel Oil
Unreasonable Government Regulations
Unreasonable Government Regulations
Workers’ Compensation
Costs
Federal Taxes on Business Income
Telephone Rates (Costs)
Tax ComplexityUnreasonable Government Regulations
Tax Complexity Federal Taxes on Business Income
FICA (Social Security) Taxes
FICA (Social Security) Taxes
Cost and Availability of
Liability Insurance
Telephone Costs and Service Cash Flow
Insights from the table: • The cost of health insurance has been consistently the number one problem for small businesses over the past 30 years. • Unreasonable government regulations appeared in the top-five ranking only in four instances, but the latest results place regulation in second place. • Tax complexity and tax rates have been consistent issues since 1986, the last time the U.S. underwent major tax reform. • Business cost concerns have shifted from telephone rates in the 1980s to commodities prices, such as those of natural gas and gasoline, in the 2000s. Source: National Federation of Independent Business, Small Business Problems & Priorities report, August 2016 This publication is based on a research procedure that has remained fundamentally unchanged. A large sample of small-business owners, all members of the NFIB, are sent a mail questionnaire. The questionnaire presents 75 potential business problems encountered in the private marketplace and from government regulatory activities. Respondents are asked to rate the severity of each potential problem. These are the top five results for each year the survey was conducted.
What We Are Watching • One of President Trump’s stated goals is to
reduce costs by repealing and simplifying regulations. A recent study1 estimates that total savings from deregulation could add about 0.5% to U.S. GDP in President Trump’s first term.
• Financial companies could benefit from changes to regulatory policies enacted over the past decade.
• With several prospective new Fed appointments coming from the business world, we also could see less financial regulation.
1. Susan Dudley, George Washington University, and Melinda Warren, Washington University in St. Louis, "Regulators’ Budget Reflects President Trump’s Priorities: An Analysis of the U.S. Budget for Fiscal Years 1960 through 2018," July 2017
Policies of Change
9
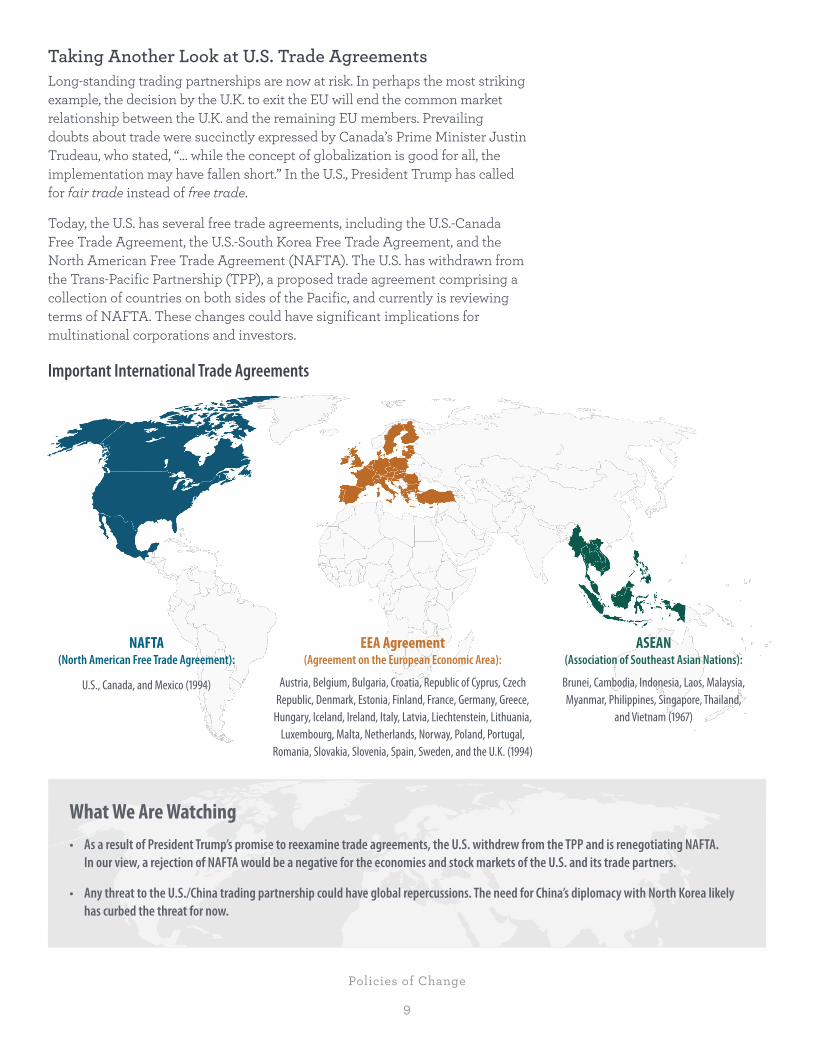
Taking Another Look at U.S. Trade Agreements Long-standing trading partnerships are now at risk. In perhaps the most striking example, the decision by the U.K. to exit the EU will end the common market relationship between the U.K. and the remaining EU members. Prevailing doubts about trade were succinctly expressed by Canada’s Prime Minister Justin Trudeau, who stated, “… while the concept of globalization is good for all, the implementation may have fallen short.” In the U.S., President Trump has called for fair trade instead of free trade.
Today, the U.S. has several free trade agreements, including the U.S.-Canada Free Trade Agreement, the U.S.-South Korea Free Trade Agreement, and the North American Free Trade Agreement (NAFTA). The U.S. has withdrawn from the Trans-Pacific Partnership (TPP), a proposed trade agreement comprising a collection of countries on both sides of the Pacific, and currently is reviewing terms of NAFTA. These changes could have significant implications for multinational corporations and investors.
Important International Trade Agreements
NAFTA (North American Free Trade Agreement):
U.S., Canada, and Mexico (1994)
EEA Agreement (Agreement on the European Economic Area):
Austria, Belgium, Bulgaria, Croatia, Republic of Cyprus, Czech Republic, Denmark, Estonia, Finland, France, Germany, Greece,
Hungary, Iceland, Ireland, Italy, Latvia, Liechtenstein, Lithuania, Luxembourg, Malta, Netherlands, Norway, Poland, Portugal,
Romania, Slovakia, Slovenia, Spain, Sweden, and the U.K. (1994)
ASEAN (Association of Southeast Asian Nations):
Brunei, Cambodia, Indonesia, Laos, Malaysia, Myanmar, Philippines, Singapore, Thailand,
and Vietnam (1967)
What We Are Watching • As a result of President Trump’s promise to reexamine trade agreements, the U.S. withdrew from the TPP and is renegotiating NAFTA.
In our view, a rejection of NAFTA would be a negative for the economies and stock markets of the U.S. and its trade partners.
• Any threat to the U.S./China trading partnership could have global repercussions. The need for China’s diplomacy with North Korea likely has curbed the threat for now.
Policies of Change
10
Policy Trends Across Developed Markets Like the U.S., many European countries have witnessed a rise in populist sentiment over the past few years, fueled by high unemployment rates and a general sense of discontent among voters. Recently, however, European labor and financial markets have improved as economic growth has recovered and political concerns have dissipated. Meanwhile, in Japan, economic growth has risen during each of the last five quarters—the longest positive stretch in more than a decade.
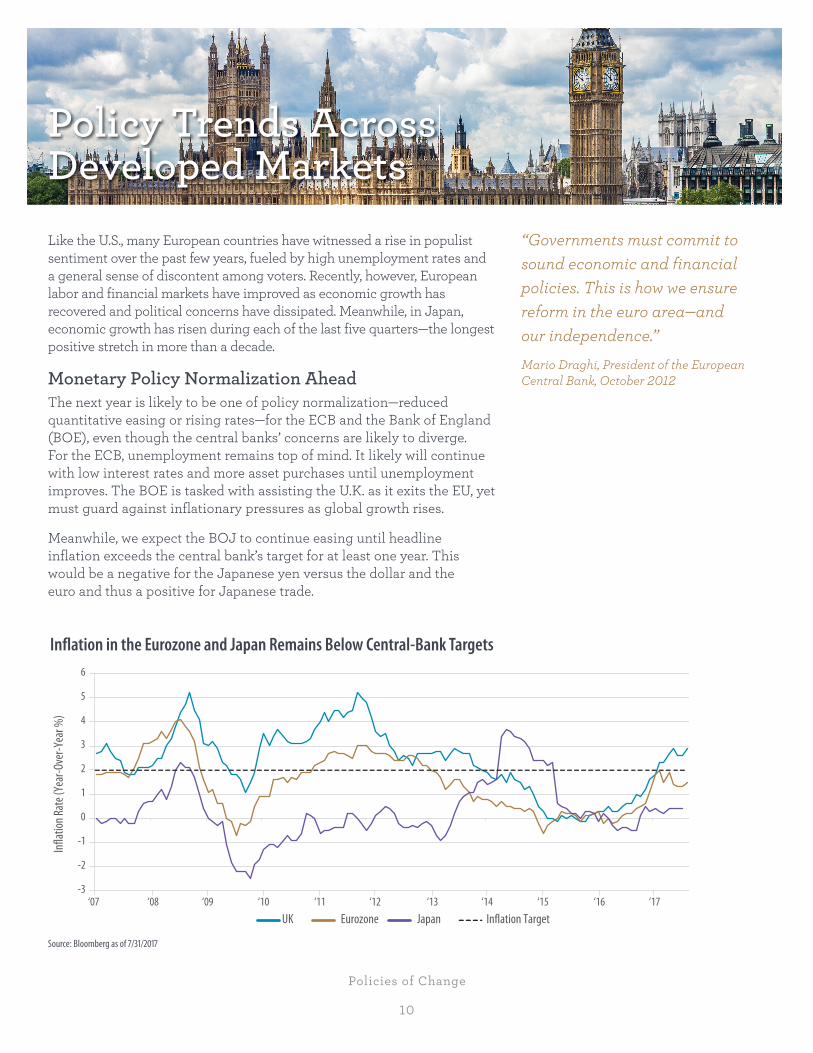
Monetary Policy Normalization Ahead The next year is likely to be one of policy normalization—reduced quantitative easing or rising rates—for the ECB and the Bank of England (BOE), even though the central banks’ concerns are likely to diverge. For the ECB, unemployment remains top of mind. It likely will continue with low interest rates and more asset purchases until unemployment improves. The BOE is tasked with assisting the U.K. as it exits the EU, yet must guard against inflationary pressures as global growth rises.
Meanwhile, we expect the BOJ to continue easing until headline inflation exceeds the central bank’s target for at least one year. This would be a negative for the Japanese yen versus the dollar and the euro and thus a positive for Japanese trade.
Inflation in the Eurozone and Japan Remains Below Central-Bank Targets
Source: Bloomberg as of 7/31/2017
“Governments must commit to sound economic and financial policies. This is how we ensure reform in the euro area—and our independence.” Mario Draghi, President of the European Central Bank, October 2012
-3
-2
-1
0
1
2
3
4
5
6
‘07 ‘08 ‘09 ‘10 ‘11 ‘12 ‘13 ‘14 ‘15 ‘16 ‘17UK Eurozone Japan Inflation Target
Infla
tion R
ate (
Year
-Ove
r-Yea
r %)
Policies of Change
11
Enhanced Fiscal Spending in the U.K. and Japan The lack of coordinated governmental spending in the Eurozone is a headwind to growth for the currency bloc. By contrast, U.K. government spending could increase ahead of its EU exit date of March 2019. Infrastructure spending, in particular, could provide a buffer against Brexit-related shocks.
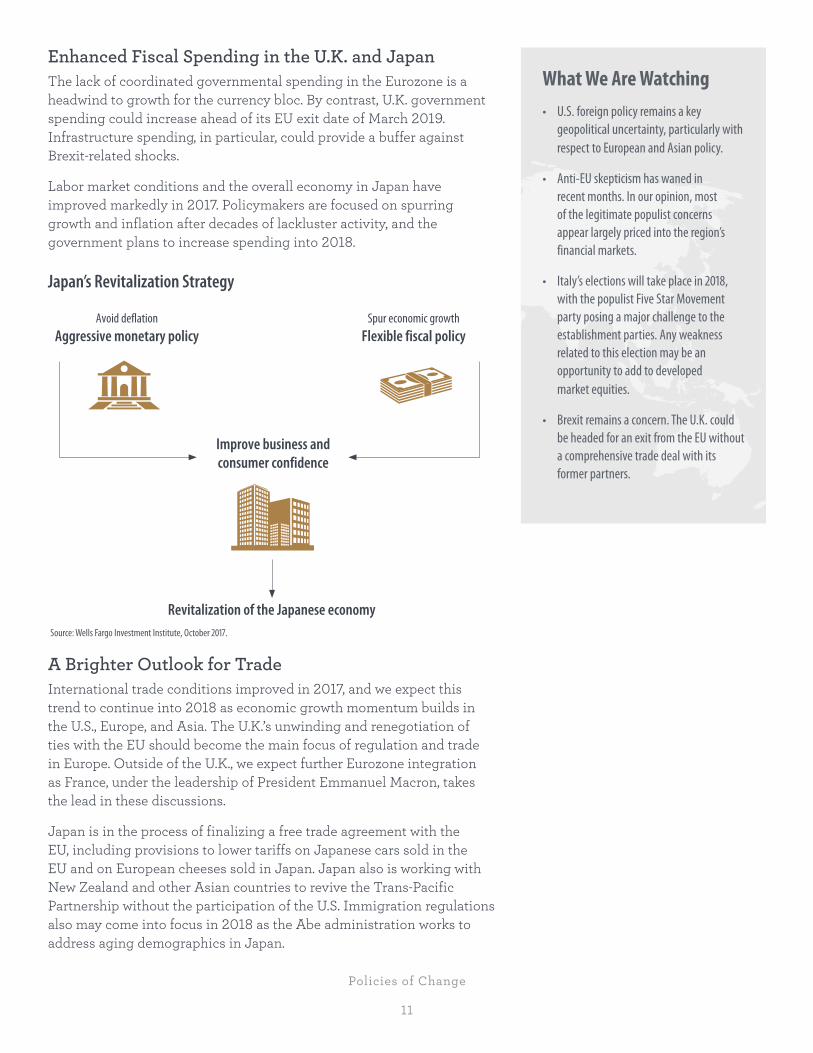
Labor market conditions and the overall economy in Japan have improved markedly in 2017. Policymakers are focused on spurring growth and inflation after decades of lackluster activity, and the government plans to increase spending into 2018.
Japan’s Revitalization Strategy
Avoid deflation Aggressive monetary policy
Spur economic growth Flexible fiscal policy
Improve business and consumer confidence
Revitalization of the Japanese economy Source: Wells Fargo Investment Institute, October 2017.
A Brighter Outlook for Trade International trade conditions improved in 2017, and we expect this trend to continue into 2018 as economic growth momentum builds in the U.S., Europe, and Asia. The U.K.’s unwinding and renegotiation of ties with the EU should become the main focus of regulation and trade in Europe. Outside of the U.K., we expect further Eurozone integration as France, under the leadership of President Emmanuel Macron, takes the lead in these discussions.
Japan is in the process of finalizing a free trade agreement with the EU, including provisions to lower tariffs on Japanese cars sold in the EU and on European cheeses sold in Japan. Japan also is working with New Zealand and other Asian countries to revive the Trans-Pacific Partnership without the participation of the U.S. Immigration regulations also may come into focus in 2018 as the Abe administration works to address aging demographics in Japan.
What We Are Watching • U.S. foreign policy remains a key
geopolitical uncertainty, particularly with respect to European and Asian policy.
• Anti-EU skepticism has waned in recent months. In our opinion, most of the legitimate populist concerns appear largely priced into the region’s financial markets.
• Italy’s elections will take place in 2018, with the populist Five Star Movement party posing a major challenge to the establishment parties. Any weakness related to this election may be an opportunity to add to developed market equities.
• Brexit remains a concern. The U.K. could be headed for an exit from the EU without a comprehensive trade deal with its former partners.
Policies of Change
12
*PPP = Purchasing Power Parity: the rate at which the currency of one country would have to be converted into that of another country to buy the same amount of goods and services in each country
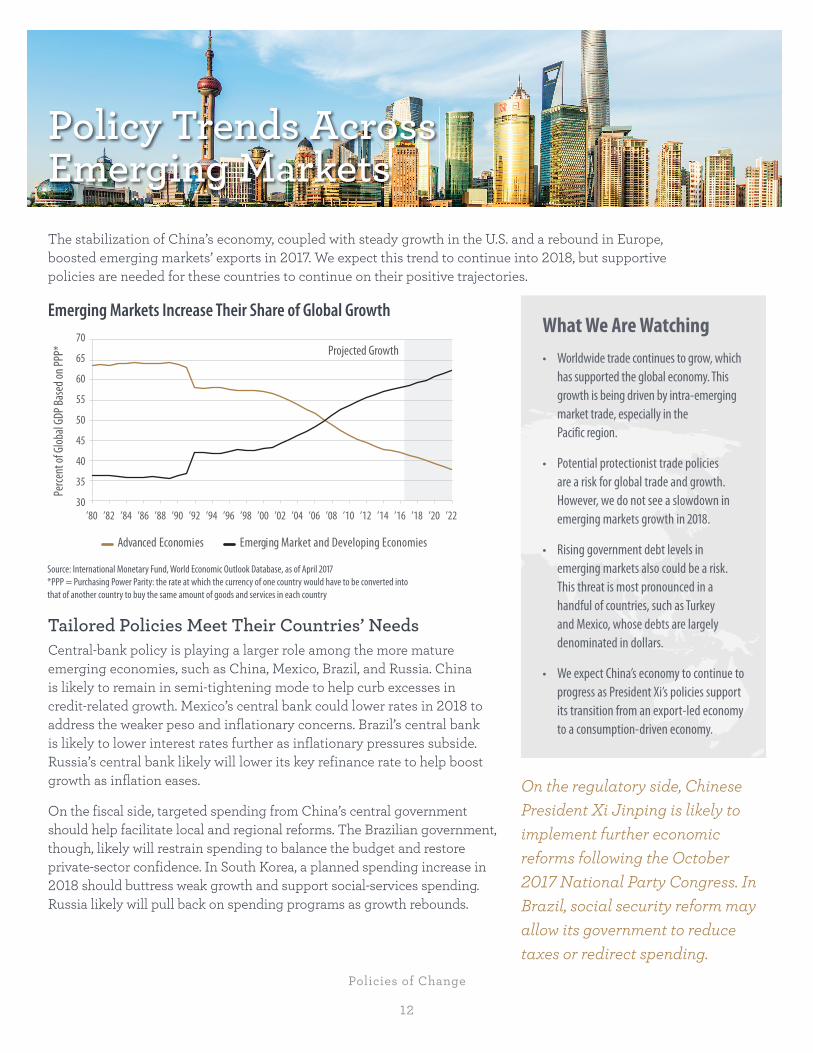
Policy Trends Across Emerging Markets The stabilization of China’s economy, coupled with steady growth in the U.S. and a rebound in Europe, boosted emerging markets’ exports in 2017. We expect this trend to continue into 2018, but supportive policies are needed for these countries to continue on their positive trajectories.
Emerging Markets Increase Their Share of Global Growth
Source: International Monetary Fund, World Economic Outlook Database, as of April 2017
Tailored Policies Meet Their Countries’ Needs Central-bank policy is playing a larger role among the more mature emerging economies, such as China, Mexico, Brazil, and Russia. China is likely to remain in semi-tightening mode to help curb excesses in credit-related growth. Mexico’s central bank could lower rates in 2018 to address the weaker peso and inflationary concerns. Brazil’s central bank is likely to lower interest rates further as inflationary pressures subside. Russia’s central bank likely will lower its key refinance rate to help boost growth as inflation eases.
On the fiscal side, targeted spending from China’s central government should help facilitate local and regional reforms. The Brazilian government, though, likely will restrain spending to balance the budget and restore private-sector confidence. In South Korea, a planned spending increase in 2018 should buttress weak growth and support social-services spending. Russia likely will pull back on spending programs as growth rebounds.
What We Are Watching • Worldwide trade continues to grow, which
has supported the global economy. This growth is being driven by intra-emerging market trade, especially in the Pacific region.
• Potential protectionist trade policies are a risk for global trade and growth. However, we do not see a slowdown in emerging markets growth in 2018.
• Rising government debt levels in emerging markets also could be a risk. This threat is most pronounced in a handful of countries, such as Turkey and Mexico, whose debts are largely denominated in dollars.
• We expect China’s economy to continue to progress as President Xi’s policies support its transition from an export-led economy to a consumption-driven economy.
On the regulatory side, Chinese President Xi Jinping is likely to implement further economic reforms following the October 2017 National Party Congress. In Brazil, social security reform may allow its government to reduce taxes or redirect spending.
30
35
40
45
50
55
60
65
70
’80 ’82 ’84 ’86 ’88 ’90 ’92 ’94 ’96 ’98 ’00 ’02 ’04 ’06 ’08 ’10 ’12 ’14 ’16 ’18 ’20 ’22
Perce
nt of
Glob
al GD
P Bas
ed on
PPP*
Advanced Economies Emerging Market and Developing Economies
Projected Growth
Policies of Change
13
How Singapore Transformed From Emerging to Developed: A Blueprint for Development
Singapore gained independence from
Malaysia in 1965.
Trade Singapore embraced foreign trade and was one of the co-founders of the ASEAN trade agreement in 1967.
Investment In the 1960s and 1970s, Singapore established a manufacturing industry, developed large public housing estates, and invested heavily in public education.
Regulations Singapore has maintained a strong stance against corruption. Singapore ranked 7th in the 2016 Corruption Perceptions Index (where 1 is the lowest corruption, and 176 is the highest corruption).
Geopolitical Concerns and Investment Implications Although emerging markets provide investors with some of the greatest opportunities for growth, many also are at the center of some notable geopolitical conflicts, along with certain frontier markets such as North Korea and Iran. Below, we take a look at some of the most pressing conflicts and their potential effects on global markets.
Country/Region Uncertainty Market Effect
North Korea North Korea continues to antagonize the world with weapons tests. Rocket launches over Japan represent an existential threat to a key U.S. ally.
The repetitive nature of the weapons tests has diminished market reaction, but markets may be vulnerable should either side escalates its action or reaction. For example, if the U.S. were to sanction Chinese companies, or place tactical nuclear weapons in South Korea or Japan, then North Korea could escalate and cause a more significant market reaction.
Russia Russia supports an independent Eastern Ukraine. Should Eastern Ukraine achieves independence, Moscow likely would push to annex the breakaway region.
There is a risk that pressure from Russia to divide Ukraine will trigger additional NATO sanctions on Russia. Past retaliatory sanctions from Moscow have had negative spillover effects on Eastern Europe and especially on Poland, a key supplier of raw materials for Russia.
China The U.S. administration has threatened trade action against China based on perceived currency valuation and trade deficit issues.
As the U.S. seeks to convince China to place further pressure on North Korea, tariffs may be used as bargaining chips. China may retaliate in various ways, including by reducing purchases of Treasuries, potentially forcing U.S. interest rates higher.
Middle East The region has unresolved conflicts in Syria, Iraq, Iran, and Afghanistan.
Syria is not affecting financial markets for now, but we see a low-probability, high-risk situation with Iran. A widening conflict in Iraq, involvement by Turkey, or any event that brought the U.S. and Russian forces into conflict likely would drive up oil prices and drive demand for investment-grade bonds and gold.
Looking Ahead Countries have the opportunity to improve economic growth and enhance productivity through policies such as tax reform and infrastructure spending. For many, however, geopolitical conflicts could prove to be an impediment. We suggest investors stay broadly diversified and exercise caution as policies of change develop.
Policies of Change
14
About the Authors
Luis Alvarado Investment Strategy Analyst
Mr. Alvarado researches and analyzes economic and market trends for the investment strategy team. He joined the team in 2012 from Wells Fargo Advisors, where he served as a client service associate. Prior to joining Wells Fargo Advisors, Mr. Alvarado worked as a personal banker in Los Angeles.
Mr. Alvarado earned a bachelor’s degree in business administration from the Universidad de Costa Rica and a master’s degree in financial analysis from the University of San Francisco. He is located in San Francisco.
Paul Christopher, CFA Head Global Market Strategist
Mr. Christopher focuses on the global investment environment and coordinates Wells Fargo Investment Institute’s market guidance. Prior to joining Wells Fargo, he developed economic strategies to trade in global financial and commodity futures markets for Eclipse Capital Management, supplied international economic perspectives for Wells Fargo predecessor A.G. Edwards, and advised institutional clients of Istanbul-based Global Securities.
Mr. Christopher earned a bachelor's degree in economics and Spanish from Saint Louis University and a master's degree in economics from the University of Rochester. He is based in St. Louis.
Peter Donisanu Investment Strategy Analyst
Mr. Donisanu follows international trends in economics and politics and writes about their implications for international financial markets. His work has been quoted in print media, and he has been featured in television and radio interviews. Mr. Donisanu also presents his views via speaking engagements. He has worked in the financial services industry since 2001.
Mr. Donisanu earned a bachelor's degree in business in Business from Western Governors University and a master's degree in business administration with an emphasis in finance from City University of Seattle. He is located in St. Louis.
Craig Holke Investment Strategy Analyst
Mr. Holke covers the global investment environment with specific emphasis on how the global macroeconomic environment affects various asset classes. Prior to his current position, he covered fixed-income investments in Global Manager Research and worked in the fixed-income department of the Capital Markets Trading group at Wells Fargo Advisors.
Mr. Holke earned a bachelor's degree in business administration from St. Louis University and a master's degree in business administration from Washington University in St. Louis. He is located in St. Louis
Tracie McMillion, CFA Head of Global Asset Allocation Strategy
Ms. McMillion leads the development of global investment strategy. She oversees the creation of asset allocation recommendations and writes economic and market commentary and analysis. Prior to her current role, she served as an asset allocation strategist and a senior investment research analyst for Wells Fargo and predecessor firms.
Ms. McMillion earned a bachelor’s degree in economics and a master’s degree in business administration from the College of William & Mary in Virginia. She is located in Winston-Salem, North Carolina.
Brian Rehling, CFA Co-Head of Global Fixed Income Strategy
Mr. Rehling focuses on global fixed-income asset allocation, strategy guidance, and the interest-rate outlook. He is frequently quoted in national media and has extensive investment strategy experience, having spent more than 17 years in leadership roles at Wells Fargo Advisors and predecessor firms working with retail, high-net-worth, ultra-high-net-worth, and institutional clients.
Mr. Rehling earned a bachelor's degree in business administration with a focus in finance from the University of Missouri. He is based in St. Louis.
Michael Taylor, CFA Investment Strategy Analyst
Mr. Taylor focuses on global asset allocation strategy and economic and market analysis. He has more than 17 years of experience in financial services and has spent the past 13 years at Wells Fargo.
Mr. Taylor earned a bachelor’s degree in chemistry from the University of Minnesota Institute of Technology, a bachelor’s degree in Chinese and Russian from the University of Minnesota College of Liberal Arts, and a master’s degree in business administration from the University of Minnesota Carlson School of Management. He is based in Minneapolis.
Veronica Willis Investment Strategy Analyst
Ms. Willis is an investment strategy analyst for Wells Fargo Investment Institute. She assists in research and development of asset allocation recommendations and analysis of the economy and financial markets.
Prior to her current role, she served as a research analyst for strategy around developed and emerging countries, commodities, and currencies. She began her career at Wells Fargo in 2012 and is an active member of several Team Member Networks, including the Wells Fargo New Professionals Network, Women’s Team Member Network, and Black/African American Connection. She is based in St. Louis.

Policies of Change
15
Definitions: The Nikkei 225 Index is the leading and most-respected index of Japanese stocks. It is a price-weighted index composed of Japan's top 225 blue-chip companies on the Tokyo Stock Exchange. The Nikkei is equivalent to the Dow Jones Industrial Average Index in the U.S.
The S&P 500 Index is a market-capitalization-weighted index composed of 500 widely held common stocks that are generally considered representative of the U.S. stock market.
The STOXX Europe 600 Index is derived from the STOXX Europe Total Market Index (TMI) and is a subset of the STOXX Global 1800 Index. With a fixed number of 600 components, the STOXX Europe 600 Index represents large-, mid-, and small-capitalization companies across 18 countries of the European region: Austria, Belgium, Czech Republic, Denmark, Finland, France, Germany, Greece, Ireland, Italy, Luxembourg, the Netherlands, Norway, Portugal, Spain, Sweden, Switzerland, and the United Kingdom.

Investment Expertise and Advice to Help You Succeed Financially Wells Fargo Investment Institute is home to more than 100 investment professionals focused on investment strategy, asset allocation, portfolio management, manager reviews, and alternative investments. Its mission is to deliver timely, actionable advice that can help investors achieve their financial goals.
For assistance with your investment planning or to discuss the points in this report, please talk to your investment professional.
Global Investment Strategy and Global Manager Research are divisions of Wells Fargo Investment Institute, Inc. (WFII). WFII is a registered investment adviser and wholly owned subsidiary of Wells Fargo Bank, N.A., a bank affiliate of Wells Fargo & Company.
The information in this report was prepared by the Global Investment Strategy (GIS) division of WFII. Opinions represent GIS’ opinion as of the date of this report; are for general informational purposes only; and are not intended to predict or guarantee the future performance of any individual security, market sector, or the markets generally. GIS does not undertake to advise you of any change in its opinions or the information contained in this report. Wells Fargo & Company affiliates may issue reports or have opinions that are inconsistent with, and reach different conclusions from, this report.
The information contained herein constitutes general information and is not directed to, designed for, or individually tailored to any particular investor or potential investor. This report is not intended to be a client-specific suitability analysis or recommendation; an offer to participate in any investment; or a recommendation to buy, hold, or sell securities. Do not use this report as the sole basis for investment decisions. Do not select an asset class or investment product based on performance alone. Consider all relevant information, including your existing portfolio, investment objectives, risk tolerance, liquidity needs, and investment time horizon.
Wells Fargo Advisors is registered with the U.S. Securities and Exchange Commission and the Financial Industry Regulatory Authority but is not licensed or registered with any financial services regulatory authority outside of the U.S. Non-U.S. residents who maintain U.S.-based financial services accounts with Wells Fargo Advisors may not be afforded certain protections conferred by legislation and regulations in their country of residence in respect of any investments, investment transactions, or communications made with Wells Fargo Advisors.
Wells Fargo Advisors is a trade name used by Wells Fargo Clearing Services, LLC, and Wells Fargo Advisors Financial Network, LLC, Members SIPC, separate registered broker/dealers and nonbank affiliates of Wells Fargo & Company. © 2017 Wells Fargo Investment Institute. All rights reserved.
1017-04593 IHA-4972801 0000594375 (Rev 00, 1 ea)