Embed Size (px)
Citation preview

Slide 1
Policy and Environmental Influences on Physical Activity in Preschool Children
Stewart G. Trost, PhD Department of Nutrition and Exercise Sciences
Oregon State University

Reading
Vocabulary
Math
Self Regulation
Active Play
.431**
.369**
-.565*
-.158
-.223
.595**
.474**
*p < .05 **p < .01

Slide 3
Outline h Center policies and practices
h Outdoor Environment
h Playground Attributes
h Experimental Studies
h Conclusions

Slide 4
Dowda et al. (2009) h 20 early childhood education centers
h Private (11), Religious (6), Head Start (3)
h 299 children (50% boys)
h Aged 3 to 5 years
h 49 % African American
h Mean BMI 16.6 3.8
Dowda et al. Pediatrics 2009;123:e261-e266

Slide 5
Dowda et al. (2004) h OSRAC-P (Brown et al. RQES 2006)
h Structured Interviews w/ Director h Classroom and Playground Audit h Early Childhood Environment Rating
Scale-Revised Edition (ECERS-R)

Slide 6
Dowda et al. Pediatrics 2009;123:e261-e266

Slide 7
FCCH policies and practices that influence PA
Gunter, Rice, Ward, Trost. In Review
Slide 8
Bower et al. (2008) h 20 Child Care Centers in NC
§ Mean enrollment of 81 § 33% African American § 80% participated in CACFP § 20% NAEYC Accredited
h Environment and Policy Assessment and Observation (EPAO)
§ (Ward et al. 2008 Am J Health Behav.)
h OSRAP (OSRAC-P)

Slide 9
Correlation with Mean PA Level EPAO Subscale Correlation Active Opportunities 0.51
Sedentary Opportunities 0.21
Sedentary Environment -0.23
Portable Play Environment 0.33
Fixed Play Environment -0.28
Staff Behaviors 0.35
PA Training and Education 0.40
Physical Activity Policy 0.16
PA Environment Total Score 0.34
Bower JK et al. Am J Prev Med 2008;34:23-29

Slide 10
High vs. Low EPAO Centers
0
10
20
30
40
50
60
70
%MVPA %SED
High EPAOLow EPAO
Bower JK et al. Am J Prev Med 2008;34:23-29
Slide 11
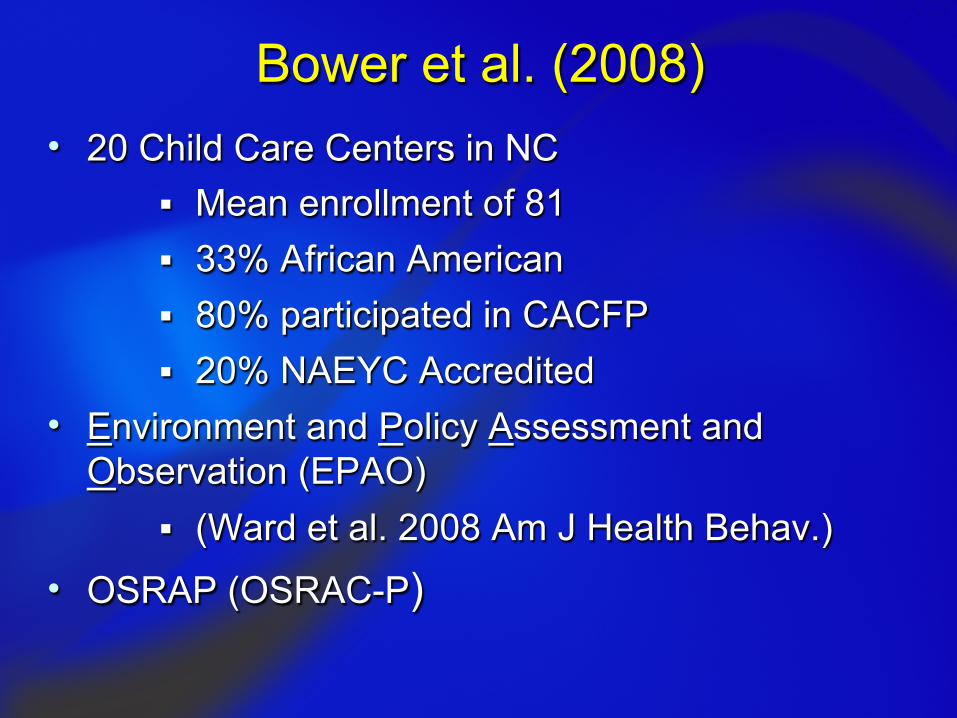
Best Predictors of PA and SED Behavior
Bower JK et al. Am J Prev Med 2008;34:23-29
Predictor %MVPA %SED Mean PA
Active Opportunities 0.47 -0.57 0.61
Sedentary Environment - 0.34 -0.56
Portable Play Environment 0.29 - -
Fixed Play Environment -0.30 - -
PA Training & Education - -0.29 0.39
R-Squared 0.40 0.42 0.60

Slide 12
Boldermann et al. (2006)
h 11 Preschool in Stockholm h 197 children h Aged 4.5 – 6.5 years h Outdoor Environment Assessment
§ Total Outdoor Area § Shrubbery & Broken Ground § Integration of play areas with vegetation
Boldemann et al. Prev Med 2006;42:301-308

Slide 13
High vs. Low Outdoor Environment Scores
Boldemann et al. Prev Med 2006;42:301-308
21.6
17.719.4
16.9
23
18.5
0
5
10
15
20
25
step
s pe
r min
All Girls Boys
High Low

Slide 14
Indoor Space
18.2
19.5
20.4
17
17.5
18
18.5
19
19.5
20
20.5
step
s pe
r min
100-175 260-300 450-600
Indoor Area
Boldemann et al. Prev Med 2006;42:301-308

Slide 15
Cardon et al. (2008) h 39 Preschools in Flanders
§ 415 boys, 368 girls § Mean age 5.3 +/- 0.4 years
h Influence of playground attributes on physical activity during recess
h Playground attributes Coded by research staff and verified by photography
h Physical Activity assessed with Pedometer
Cardon et al. (2008) IJBNPA

Slide 16
Preschool Environmental Factors Factor Boys Girls
Child per m2 - - - Teacher NA - Aiming Equipment NA NA Playing Equipment NA NA Recess Duration - - - - - - Ground Surface - NA Markings NA NA Vegetation NA NA Topography NA NA Toys NA NA
• Single Predictor 2-Level Model (Schools – Student)
• School explained 27% of variance in boys steps & 35% in girls steps
Cardon et al. (2008) IJBNPA

Slide 17
Hannon & Brown (2008)
h Playground Intervention § Hurdles § Hoops § Tunnels § Balance Beams § Target Toss/Throw sets § Playground balls
h 1 Center h 64 3- to 5-year-olds h ActiGraph GT1M h 10 monitoring days h 15-sec Epochs h Sirard 2005 cutpoints h OSRAC-P
Hannon JC, Brown BB. Prev Med 2008

Slide 18
Hannon & Brown (2008)
Hannon JC, Brown BB. Prev Med 2008

Slide 19
Alhassan et al. (2007) h Pilot RCT to determine the effects of
increasing outdoor playing time on PA h 33 Latino children attending 1 Head Start h Actigraph worn Mon A.M to Fri A.M. h After Tues randomized to either Recess
(N=18) or Control Conditions h Recess groups received 60 mins of
additional Recess
Alhassan et al. (2007) Int J Pediatric Obesity

Slide 20
MVPA Levels During Recess
3% 5%
92%
MVPALIGHTSED
2% 5%
93%
MVPALIGHTSED
Control Recess
Alhassan et al. (2007) Int J Pediatric Obesity

Slide 21
RCT on Outdoor Playtime
-1.5
-1
-0.5
0
0.5
1
Cha
nge
in P
A
SED LIGHT MVPA
ControlRecess
Alhassan et al. (2007) Int J Pediatric Obesity

Move and Learn Curriculum • Movement-based curriculum based on Let’s
Move, Learn, and Have Fun! – a teacher and caregiver resource developed by Kansas Nutrition Network and Kansas State University Research and Extension.
• Integrated movement into all learning areas – math, social studies, science, language arts and nutrition education.
• Activities included counting and number recognition games using scarves and balloons and music-based chasing/imagination games addressing concepts in language arts, social studies and nutrition education .
• Teachers were required to include two "move and learn" curriculum activities lasting 10-minutes or longer in each 2.5 h session

Slide 23
Lesson Context % MVPA 1 Odds Ratio 95% C. I.
Circle Time
Intervention 22.8 2.6 2.2 – 3.0 * Control 10.3 1.0 referent
Transitions
Intervention 42.0 0.8 0.7 – 1.0 Control 46.3 1.0 referent
Snack Time
Intervention 2.5 1.3 0.8 – 2.2 Control 3.3 1.0 referent Unstructured Outdoor
Intervention 78.3 1.4 1.2 – 1.8 * Control 71.7 1.0 referent
Unstructured Indoor
Intervention 26.7 1.2 1.1 – 1.3 * Control 23.5 1.0 referent
Trost et al. JPAH 2008;5:88-103

Slide 24
Classroom MVPA
0
2
4
6
8
10
12
14
Pre Post
MVP
A m
ins
InterventionControl #
Trost et al. JPAH 2008;5:88-103

Slide 25
Summary h A number of factors are responsible for the
marked between-center variability in physical activity and sedentary behavior.
h Attributes of play areas § Size of play area (density) § Portable vs. Fixed
h Outdoor time is important, but multiple recess breaks are better than single prolonged breaks
h Staff training and behaviors influence level of physical activity

Slide 26
Thank You !