Embed Size (px)
Citation preview
Policy and Technology for Living in a Greenhouse
Robert SocolowPrinceton University
P8 Summit of trustees of major pension funds
London, UKNovember 5, 2007
Three agents of change
• Public policy, changing the rules
• Consumers, changing preferences
• Owners, changing values
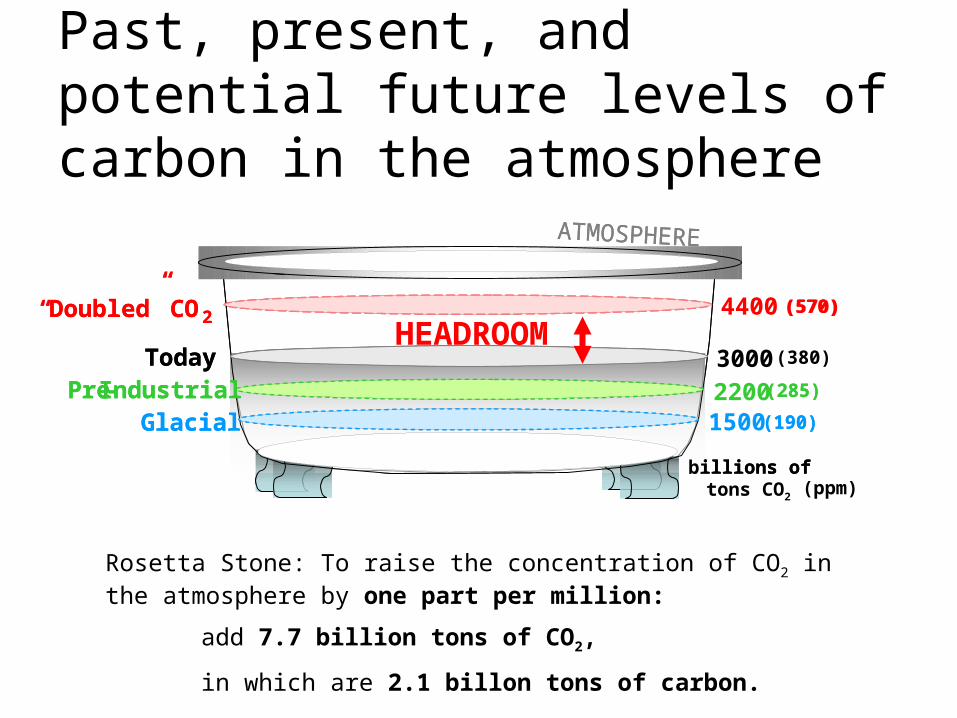
Past, present, and potential future levels of carbon in the atmosphere
Rosetta Stone: To raise the concentration of CO2 in the atmosphere by one part per million:
add 7.7 billion tons of CO2,
in which are 2.1 billon tons of carbon.
Billions of tons of carbon
“Doubled” CO2
TodayPre-Industrial
Glacial
3000
4400
22001500
billions of
ATMOSPHERE
(570)
(285)
(190)
Billions of tons of carbon
“Doubled” CO2
TodayPre-Industrial
Glacial
billions of tons CO2
ATMOSPHERE
(ppm)
(570)
(380)
(285)
(190)
HEADROOM
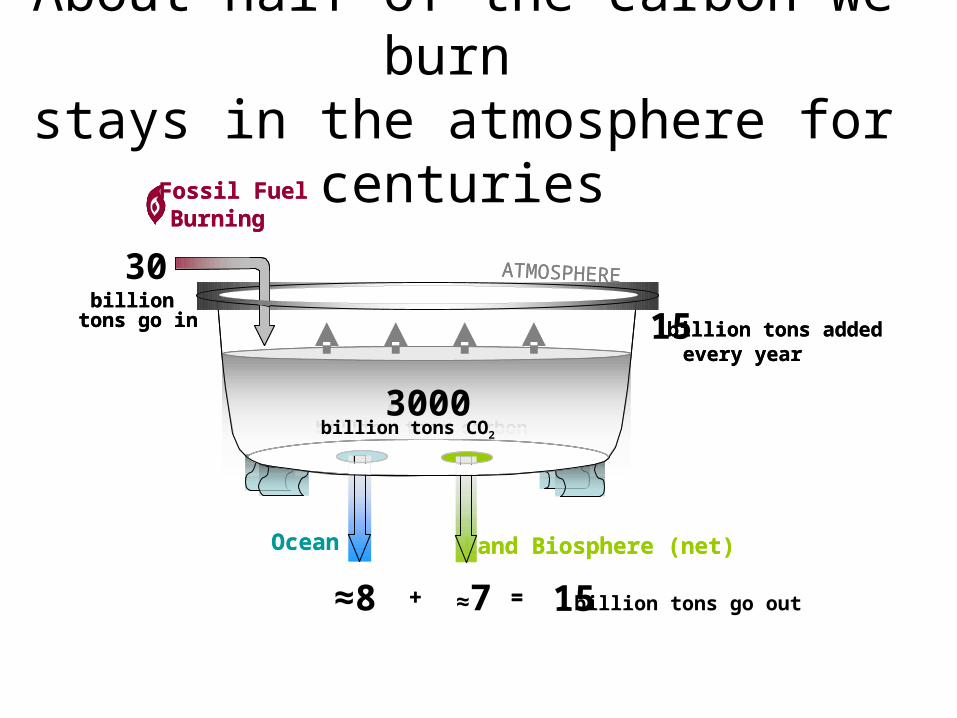
About half of the carbon we burn stays in the atmosphere for centuries
≈8 ≈7 = 15
Ocean Land Biosphere (net)
Fossil FuelBurning
+
30
800billion tons carbon
billion tons go in
ATMOSPHERE
billion tons added every year
= billion tons go out
Ocean Land Biosphere (net)
Fossil FuelBurning
+
3000billion tons CO2
15billion
tons go in
ATMOSPHERE
billion tons added every year

Billions of Tons CO2 Emitted per Year
Historical emissions
0
30
60
1950 2000 2050 2100
Historical Emissions
6
6
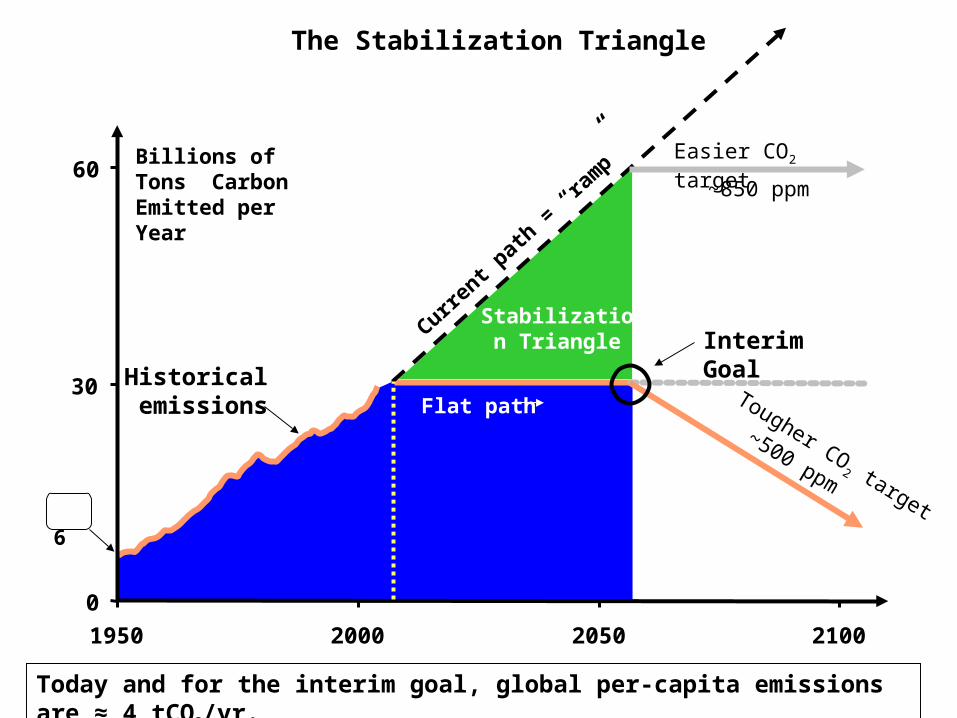
Interim Goal
Billions of Tons Carbon Emitted per Year
Current p
ath =
“ram
p”
Historical emissions Flat path
Stabilization Triangle
0
30
60
1950 2000 2050 2100
The Stabilization Triangle
Tougher CO2 target
~500 ppm
~850 ppm
Easier CO2 target
Today and for the interim goal, global per-capita emissions are ≈ 4 tCO2/yr.
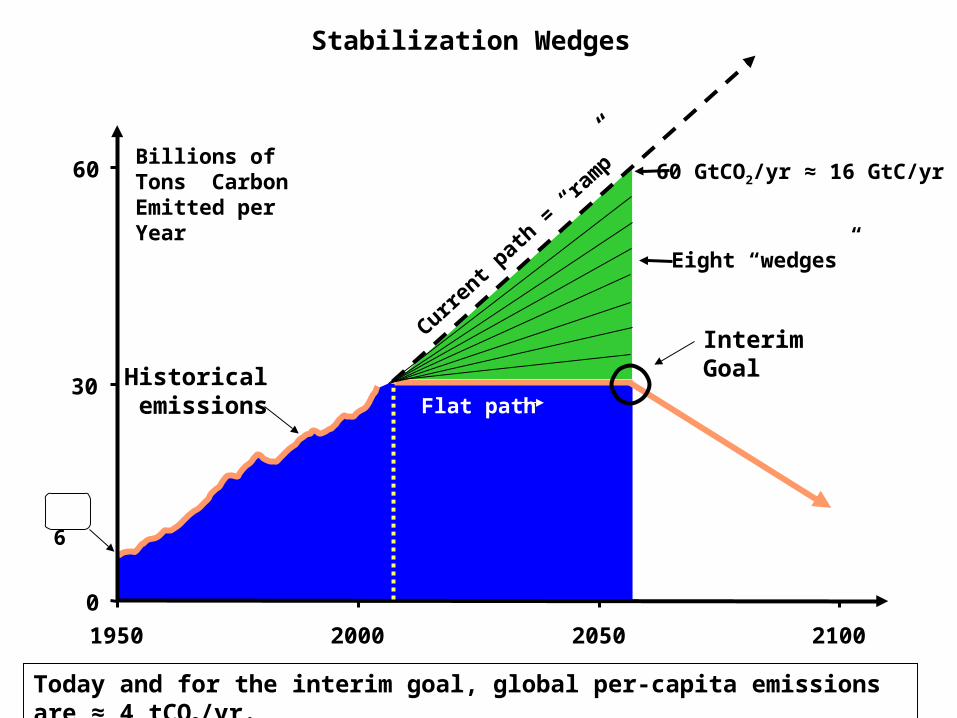
6
Billions of Tons Carbon Emitted per Year
Current p
ath =
“ram
p”
Flat path
0
30
60
1950 2000 2050 2100
Stabilization Wedges
60 GtCO2/yr ≈ 16 GtC/yr
Eight “wedges”
Today and for the interim goal, global per-capita emissions are ≈ 4 tCO2/yr.
Historical emissions
Interim Goal
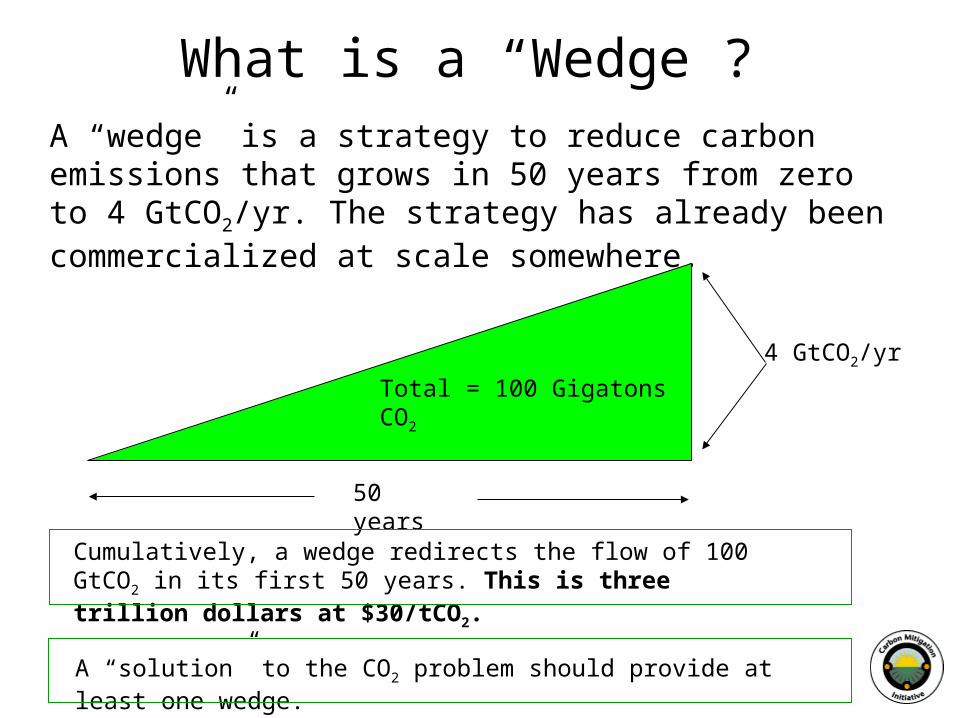
What is a “Wedge”?A “wedge” is a strategy to reduce carbon emissions that grows in 50 years from zero to 4 GtCO2/yr. The strategy has already been commercialized at scale somewhere.
4 GtCO2/yr
50 years
Total = 100 Gigatons CO2
Cumulatively, a wedge redirects the flow of 100 GtCO2 in its first 50 years. This is three trillion dollars at $30/tCO2.
A “solution” to the CO2 problem should provide at least one wedge.
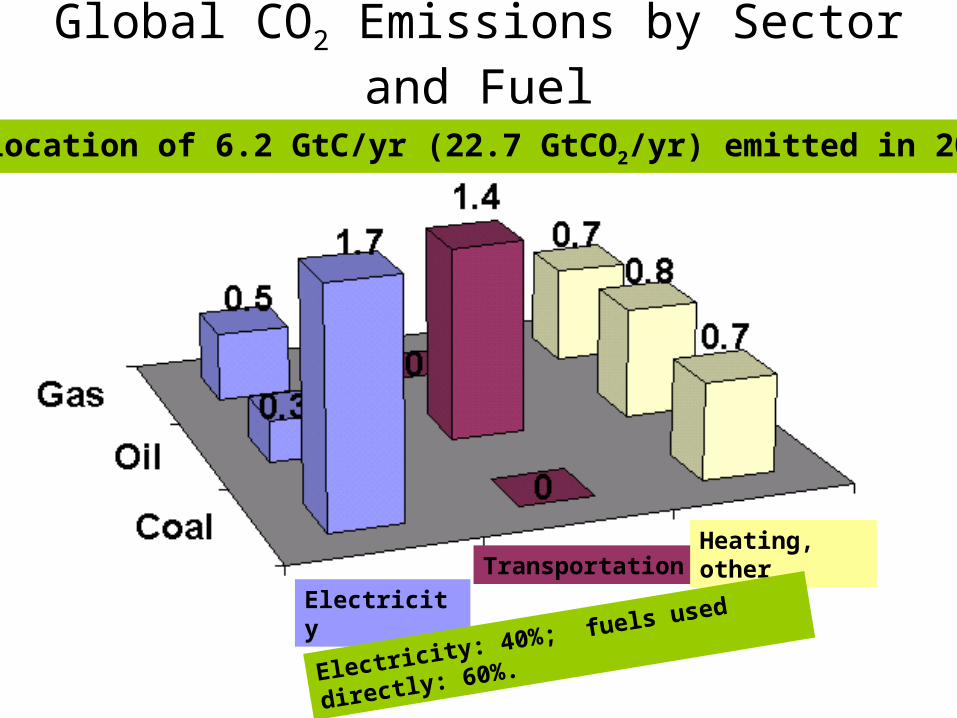
Electricity
TransportationHeating, other
Electricity: 40%; fuels used directly: 60%.
Allocation of 6.2 GtC/yr (22.7 GtCO2/yr) emitted in 2000
Global CO2 Emissions by Sector and Fuel
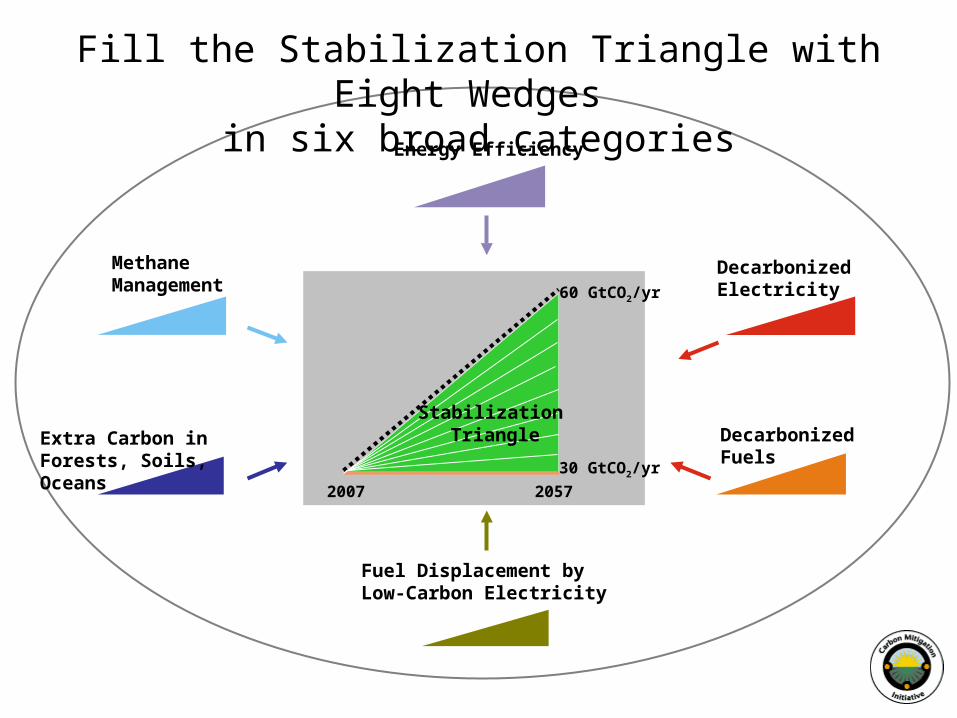
Energy Efficiency
Decarbonized Electricity
Fuel Displacement by Low-Carbon Electricity
Extra Carbon in Forests, Soils, Oceans
DecarbonizedFuels
2007 2057
30 GtCO2/yr
60 GtCO2/yr
MethaneManagement
TriangleStabilization
Fill the Stabilization Triangle with Eight Wedges in six broad categories
“The Wedge Model is the IPOD of climate change: You fill it with your favorite things.”
David Hawkins, NRDC, 2007.
Therefore, prepare to negotiate with others, who have different favorite things.
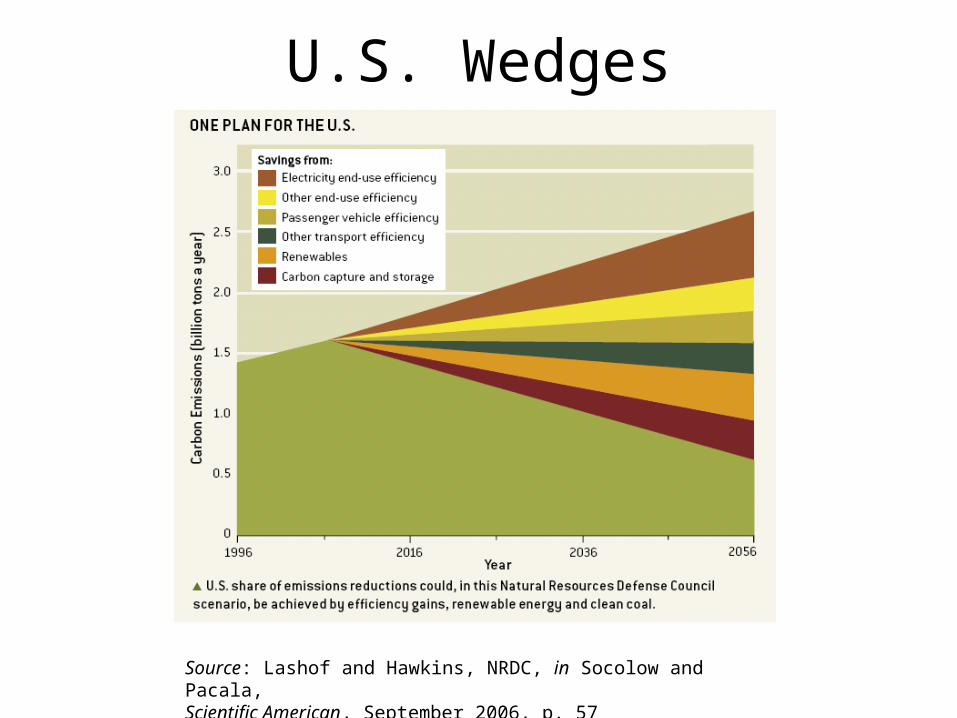
U.S. Wedges
Source: Lashof and Hawkins, NRDC, in Socolow and Pacala, Scientific American, September 2006, p. 57
Now we go on a hunt for wedges
Today:
•Efficiency wedges
•Wedges displacing conventional coal power
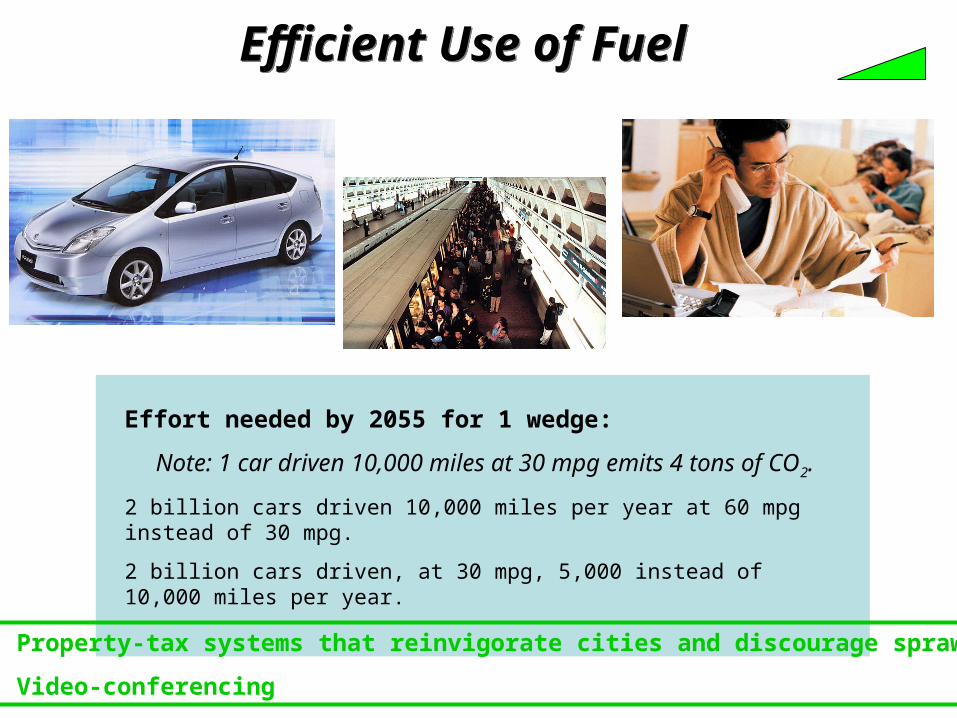
Efficient Use of FuelEfficient Use of Fuel
Effort needed by 2055 for 1 wedge:
Note: 1 car driven 10,000 miles at 30 mpg emits 4 tons of CO2.
2 billion cars driven 10,000 miles per year at 60 mpg instead of 30 mpg.
2 billion cars driven, at 30 mpg, 5,000 instead of 10,000 miles per year.
Property-tax systems that reinvigorate cities and discourage sprawl
Video-conferencing
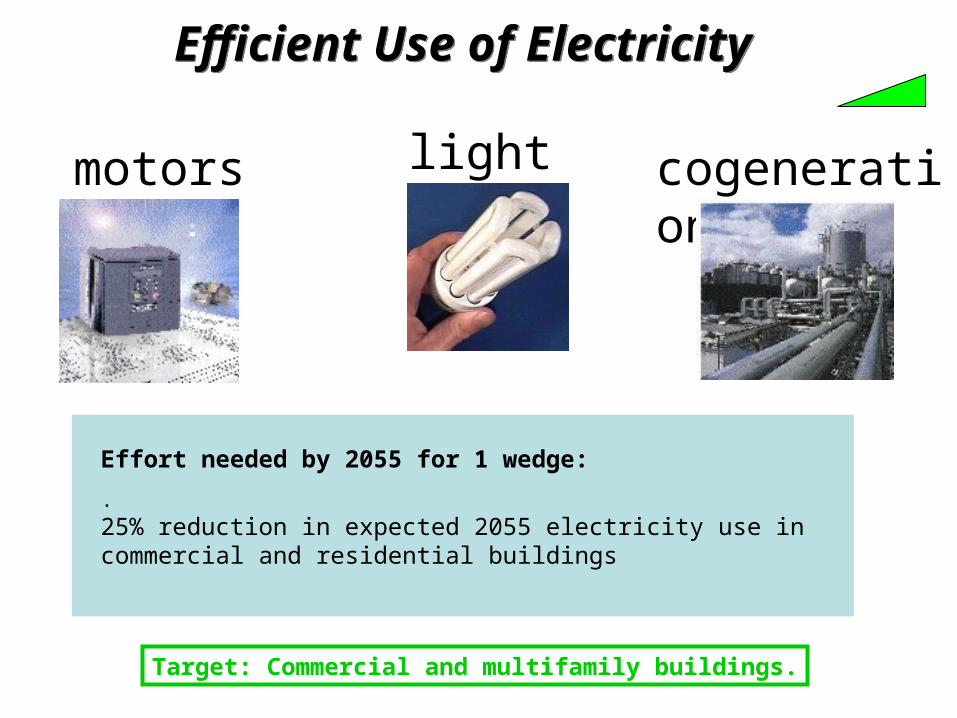
Efficient Use of ElectricityEfficient Use of Electricity
lightingmotors cogeneration
Effort needed by 2055 for 1 wedge:
.25% reduction in expected 2055 electricity use in commercial and residential buildings
Target: Commercial and multifamily buildings.
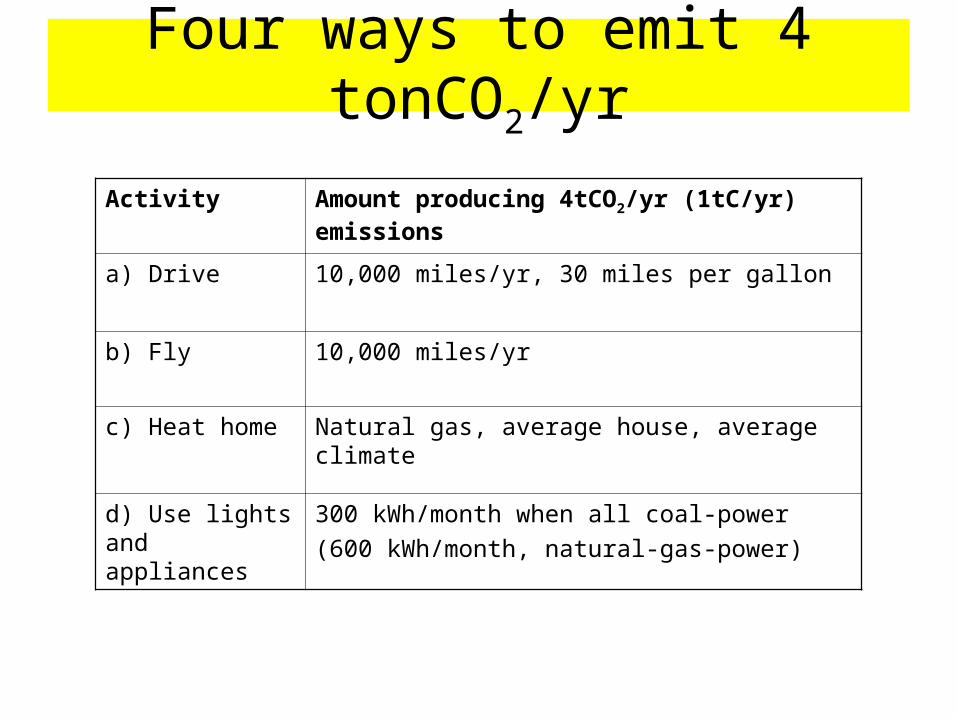
Activity Amount producing 4tCO2/yr (1tC/yr) emissions
a) Drive 10,000 miles/yr, 30 miles per gallon
b) Fly 10,000 miles/yr
c) Heat home Natural gas, average house, average climate
d) Use lights and appliances
300 kWh/month when all coal-power
(600 kWh/month, natural-gas-power)
Four ways to emit 4 tonCO2/yr
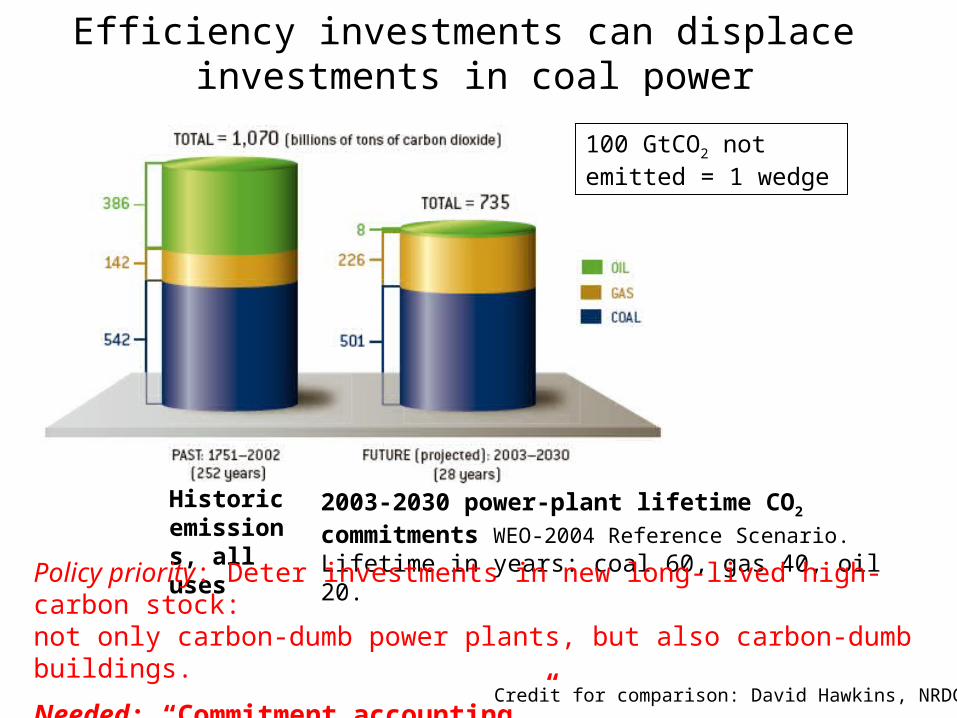
Efficiency investments can displace investments in coal power
Historic emissions, all uses
2003-2030 power-plant lifetime CO2 commitments WEO-2004 Reference Scenario.Lifetime in years: coal 60, gas 40, oil 20.
Policy priority: Deter investments in new long-lived high-carbon stock:not only carbon-dumb power plants, but also carbon-dumb buildings.
Needed: “Commitment accounting.” Credit for comparison: David Hawkins, NRDC
100 GtCO2 not emitted = 1 wedge
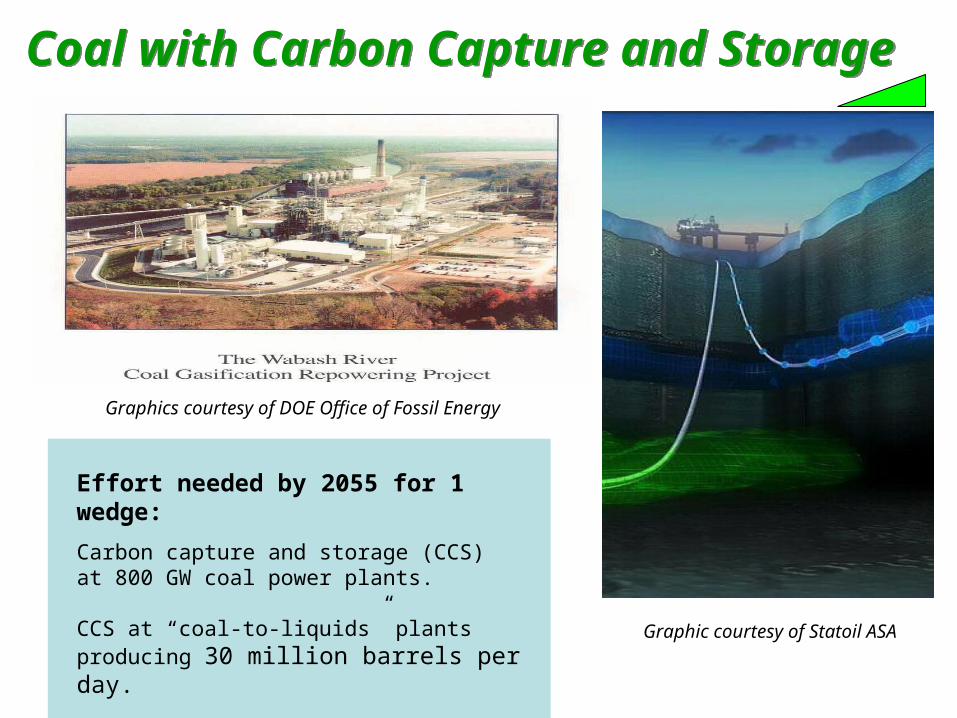
Graphics courtesy of DOE Office of Fossil Energy
Effort needed by 2055 for 1 wedge:
Carbon capture and storage (CCS) at 800 GW coal power plants.
CCS at “coal-to-liquids” plants producing 30 million barrels per day.
Coal with Carbon Capture and StorageCoal with Carbon Capture and Storage
Graphic courtesy of Statoil ASA
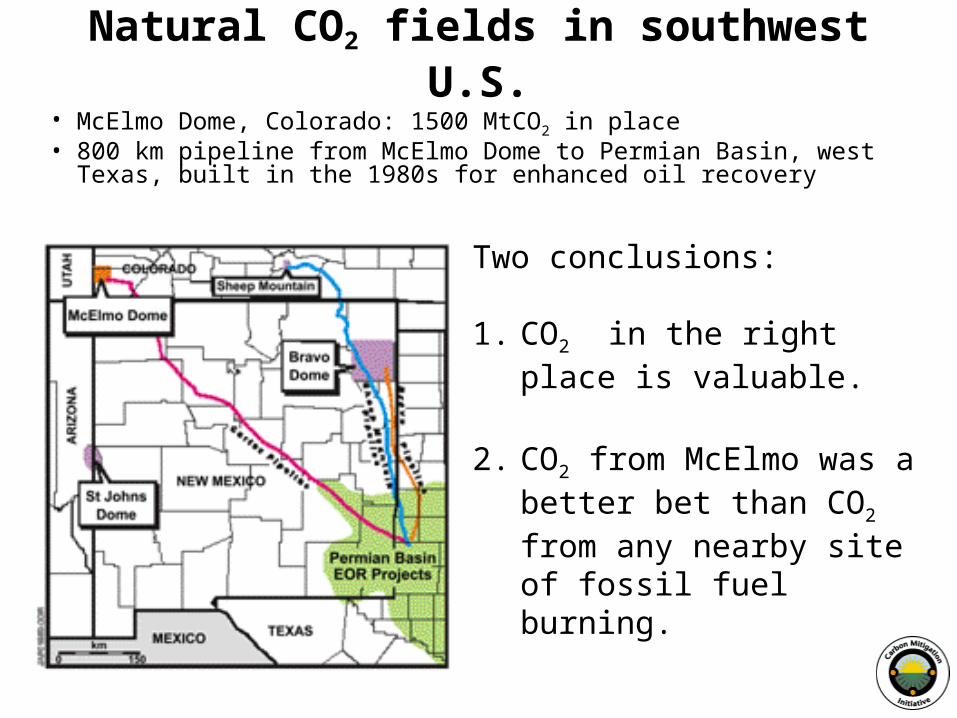
Natural CO2 fields in southwest U.S.
• McElmo Dome, Colorado: 1500 MtCO2 in place• 800 km pipeline from McElmo Dome to Permian Basin,
west Texas, built in the 1980s for enhanced oil recovery
Two conclusions:
1. CO2 in the right place is valuable.
2. CO2 from McElmo was a better bet than CO2 from any nearby site of fossil fuel burning.
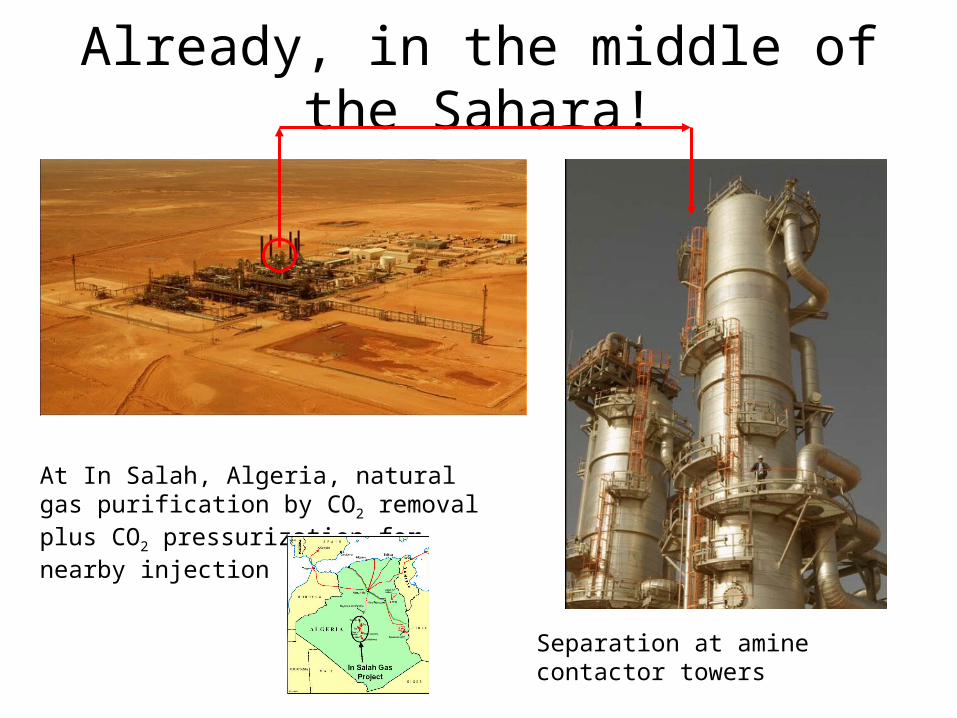
Already, in the middle of the Sahara!
At In Salah, Algeria, natural gas purification by CO2 removal plus CO2 pressurization for nearby injection
Separation at amine contactor towers
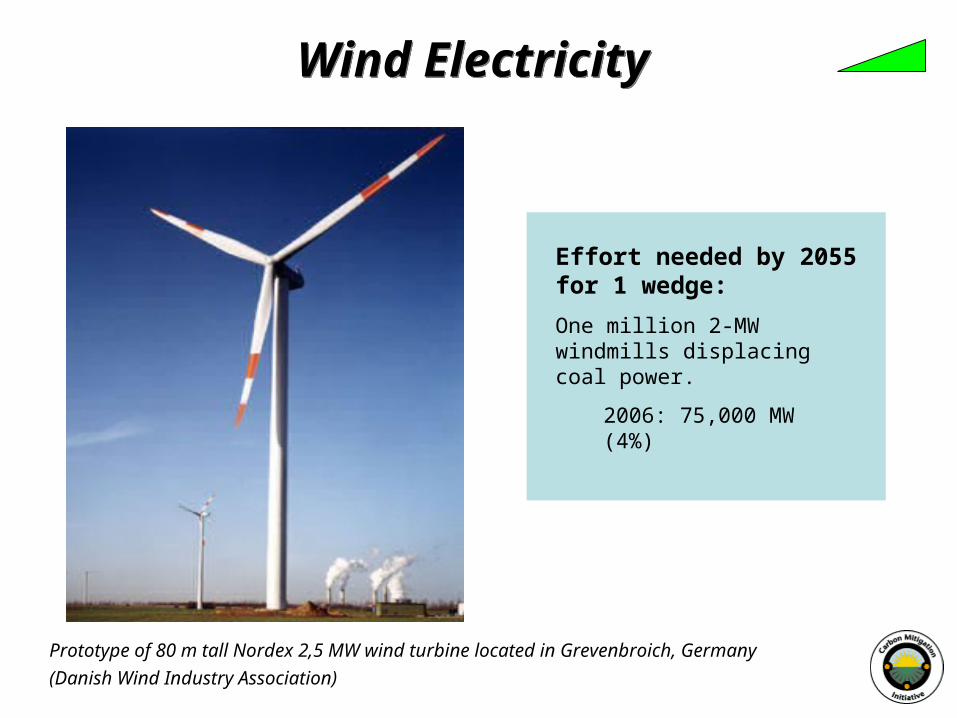
Wind ElectricityWind Electricity
Effort needed by 2055 for 1 wedge:
One million 2-MW windmills displacing coal power.
2006: 75,000 MW (4%)
Prototype of 80 m tall Nordex 2,5 MW wind turbine located in Grevenbroich, Germany
(Danish Wind Industry Association)
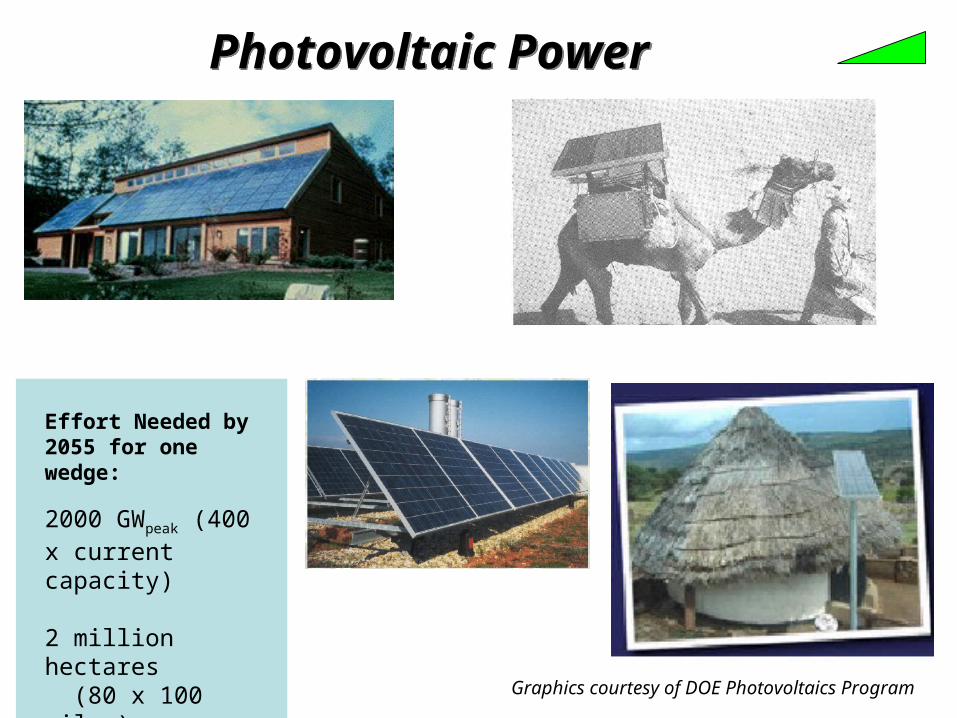
Photovoltaic PowerPhotovoltaic Power
Effort Needed by 2055 for one wedge:
2000 GWpeak (400 x current capacity) 2 million hectares (80 x 100 miles)
Graphics courtesy of DOE Photovoltaics Program
Concentrating Solar Power
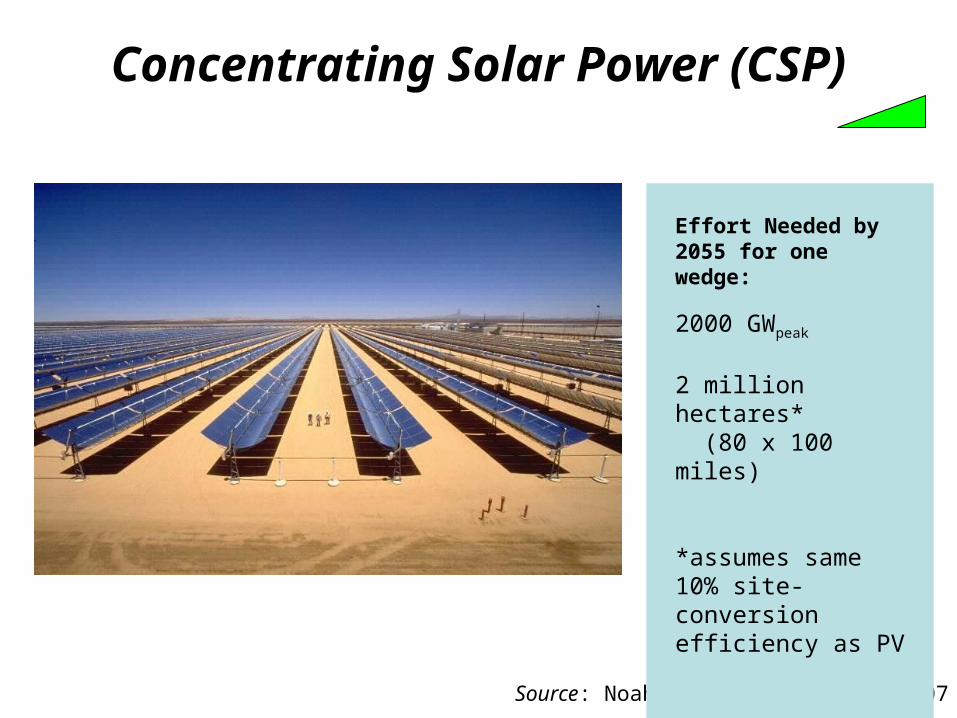
Source: Noah Kaye, SEIA, April 2007
Concentrating Solar Power (CSP)
Effort Needed by 2055 for one wedge:
2000 GWpeak
2 million hectares* (80 x 100 miles)
*assumes same 10% site-conversion efficiency as PV
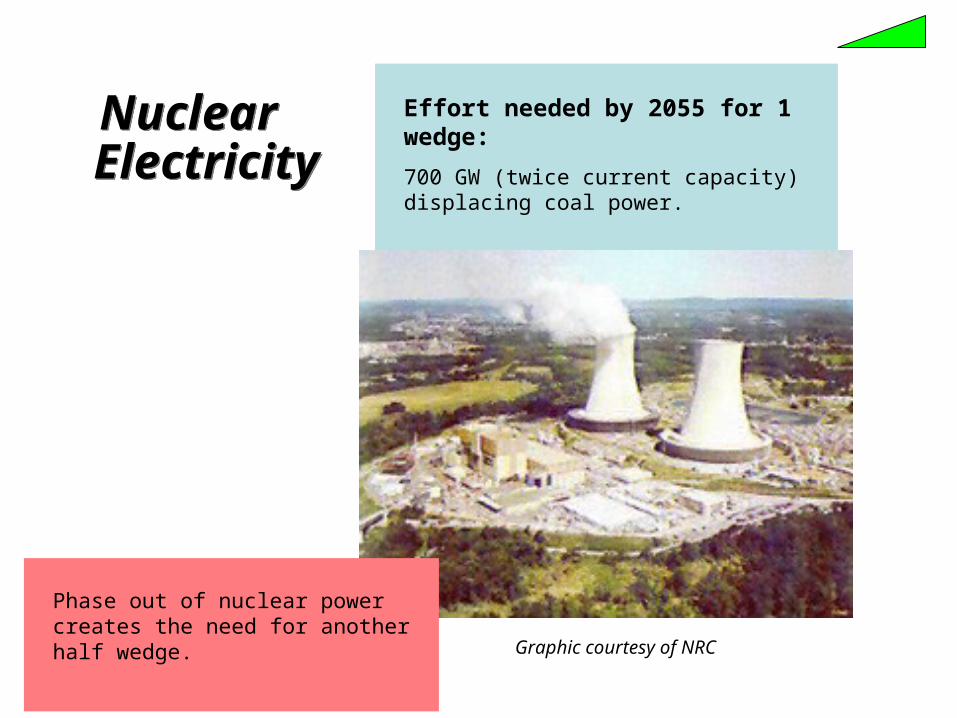
ElectricityElectricityEffort needed by 2055 for 1 wedge:
700 GW (twice current capacity) displacing coal power.
NuclearNuclear
Graphic courtesy of NRC
Phase out of nuclear power creates the need for another half wedge.
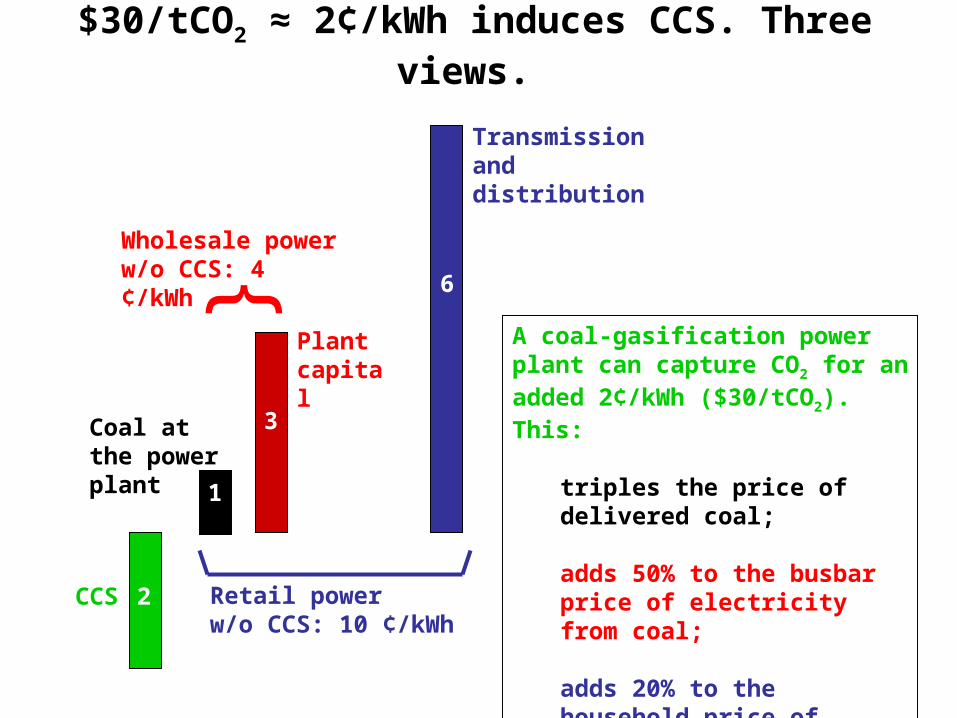
$30/tCO2 ≈ 2¢/kWh induces CCS. Three views.
CCS
Wholesale power w/o CCS: 4 ¢/kWh
Transmission and distribution
A coal-gasification power plant can capture CO2 for an added 2¢/kWh ($30/tCO2). This:
triples the price of delivered coal;
adds 50% to the busbar price of electricity from coal;
adds 20% to the household price of electricity from coal.
Coal at the power plant
2
6
3
1
} 6
Retail power w/o CCS: 10 ¢/kWh
Plant capital
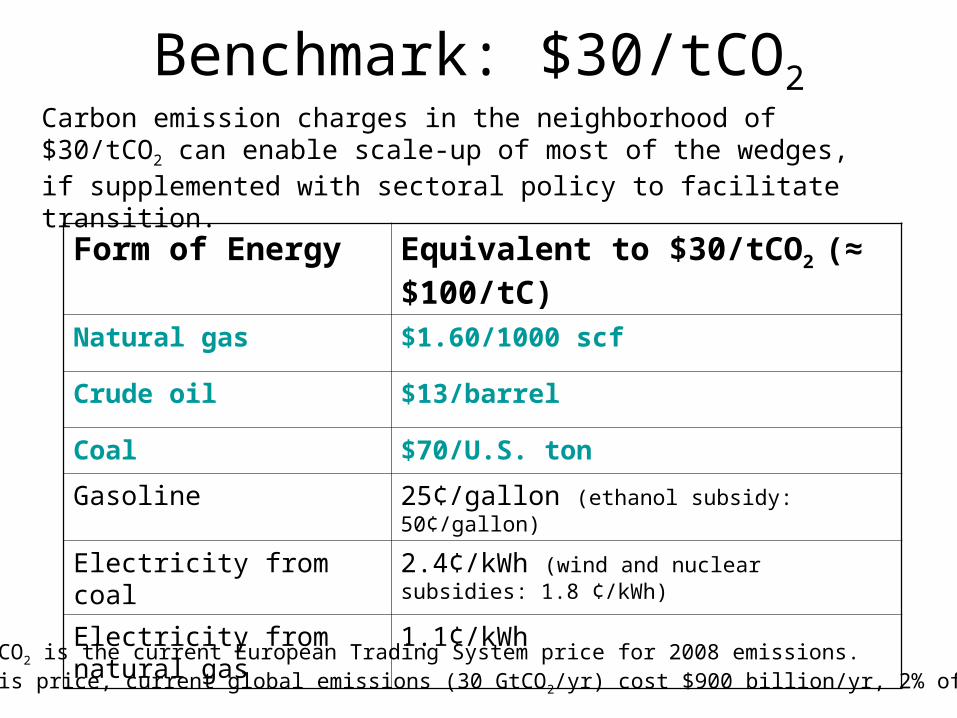
Benchmark: $30/tCO2
Form of Energy Equivalent to $30/tCO2 (≈ $100/tC)
Natural gas $1.60/1000 scf
Crude oil $13/barrel
Coal $70/U.S. ton
Gasoline 25¢/gallon (ethanol subsidy: 50¢/gallon)
Electricity from coal 2.4¢/kWh (wind and nuclear subsidies: 1.8 ¢/kWh)
Electricity from natural gas 1.1¢/kWh
Carbon emission charges in the neighborhood of $30/tCO2 can enable scale-up of most of the wedges, if supplemented with sectoral policy to facilitate transition.
$30/tCO2 is the current European Trading System price for 2008 emissions.At this price, current global emissions (30 GtCO2/yr) cost $900 billion/yr, 2% of GWP.
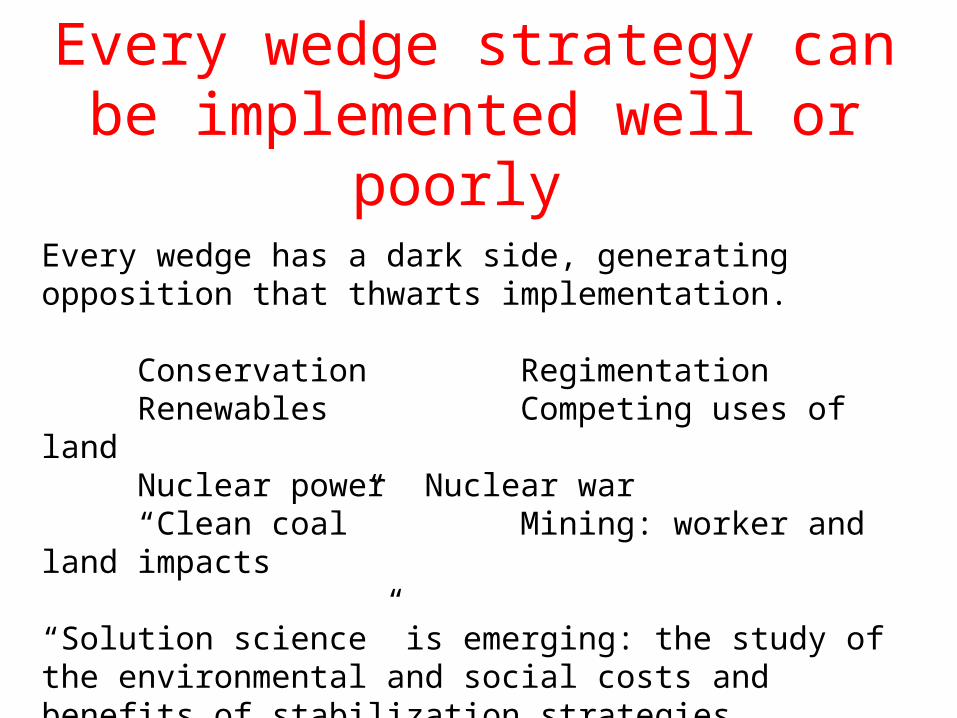
Every wedge strategy can be implemented well or poorly
Every wedge has a dark side, generating opposition that thwarts implementation.
Conservation RegimentationRenewables Competing uses of landNuclear power Nuclear war“Clean coal” Mining: worker and land impacts
“Solution science” is emerging: the study of the environmental and social costs and benefits of stabilization strategies.
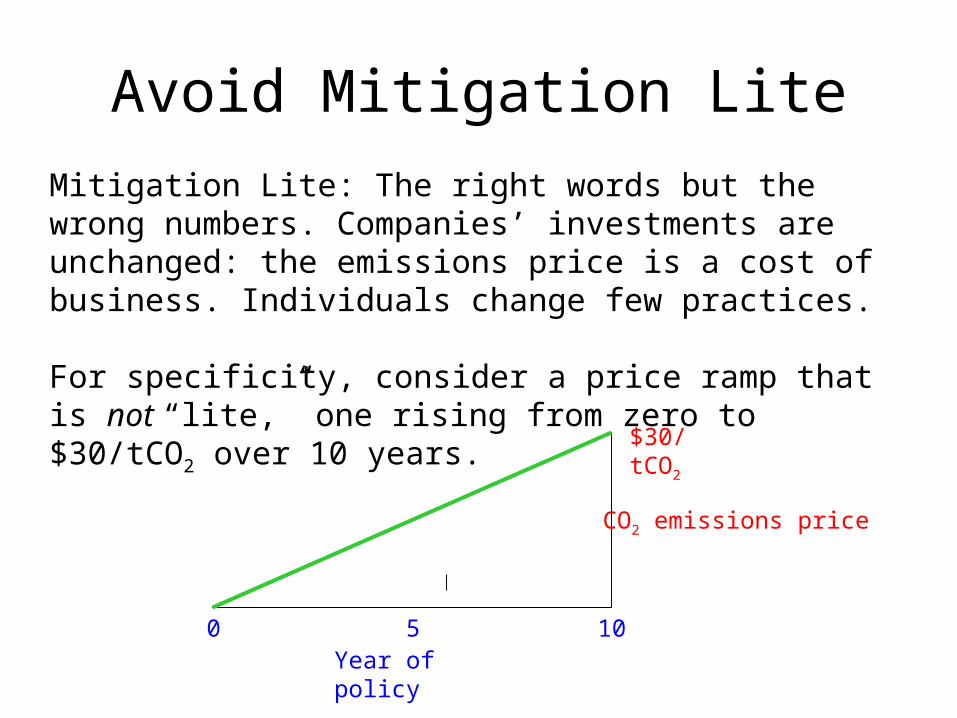
Avoid Mitigation Lite
Mitigation Lite: The right words but the wrong numbers. Companies’ investments are unchanged: the emissions price is a cost of business. Individuals change few practices.
For specificity, consider a price ramp that is not “lite,” one rising from zero to $30/tCO2 over 10 years.
0 5 10Year of policy
$30/tCO2
CO2 emissions price
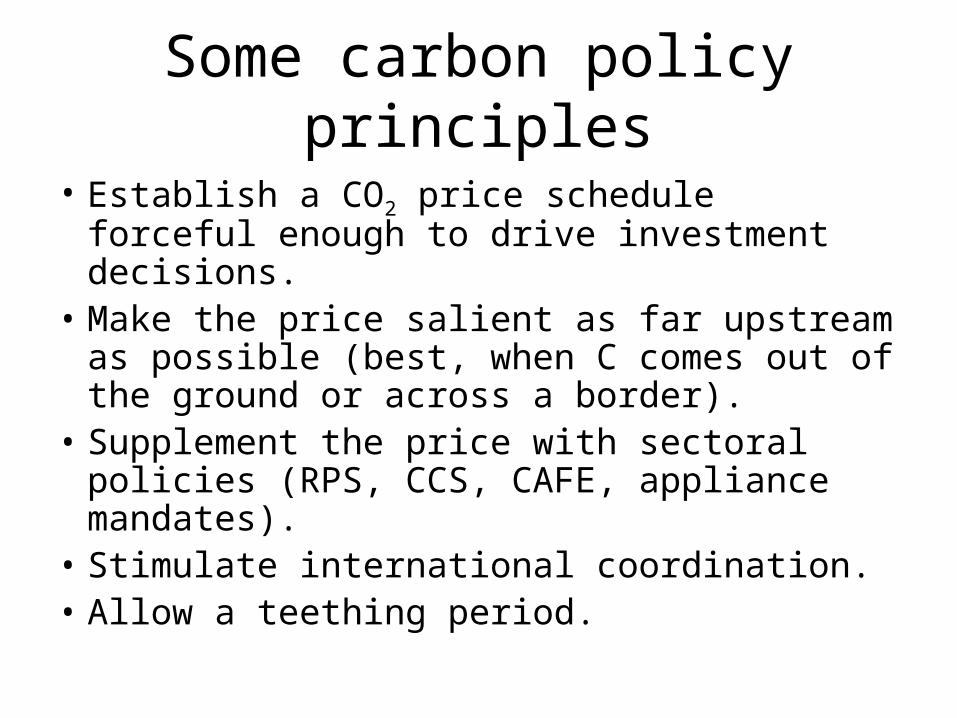
Some carbon policy principles
• Establish a CO2 price schedule forceful enough to drive investment decisions.
• Make the price salient as far upstream as possible (best, when C comes out of the ground or across a border).
• Supplement the price with sectoral policies (RPS, CCS, CAFE, appliance mandates).
• Stimulate international coordination.• Allow a teething period.
Source: Adrian Ross
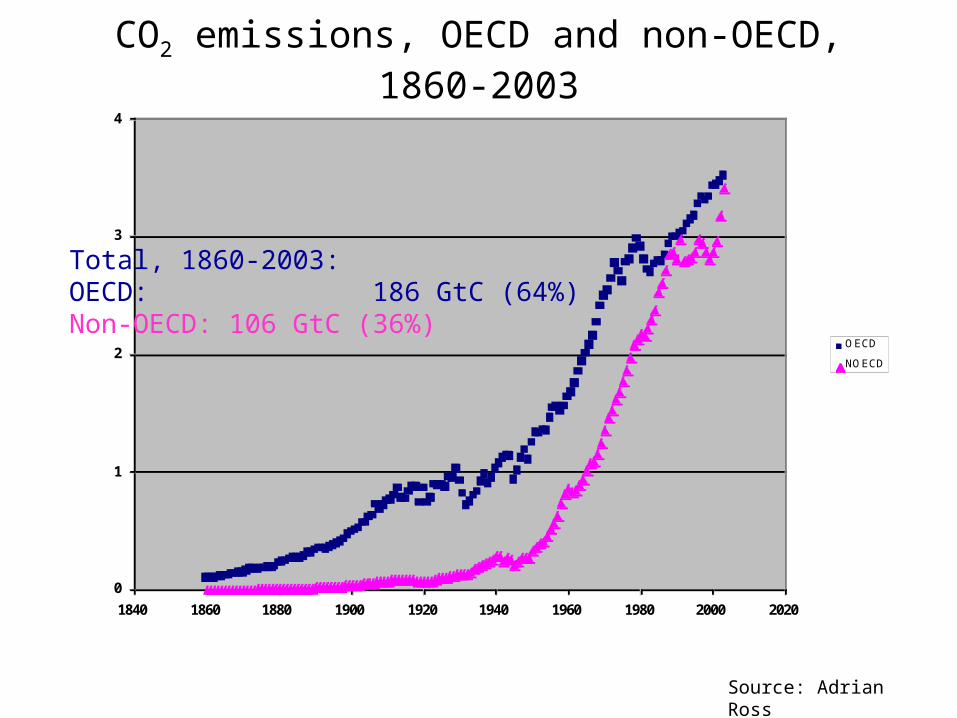
CO2 emissions, OECD and non-OECD, 1860-2003
0
1
2
3
4
1840 1860 1880 1900 1920 1940 1960 1980 2000 2020
Annual CO2 emissions from fossil-fuels (GTonC)
OECD
NOECD
Total, 1860-2003:OECD: 186 GtC (64%)Non-OECD: 106 GtC (36%)
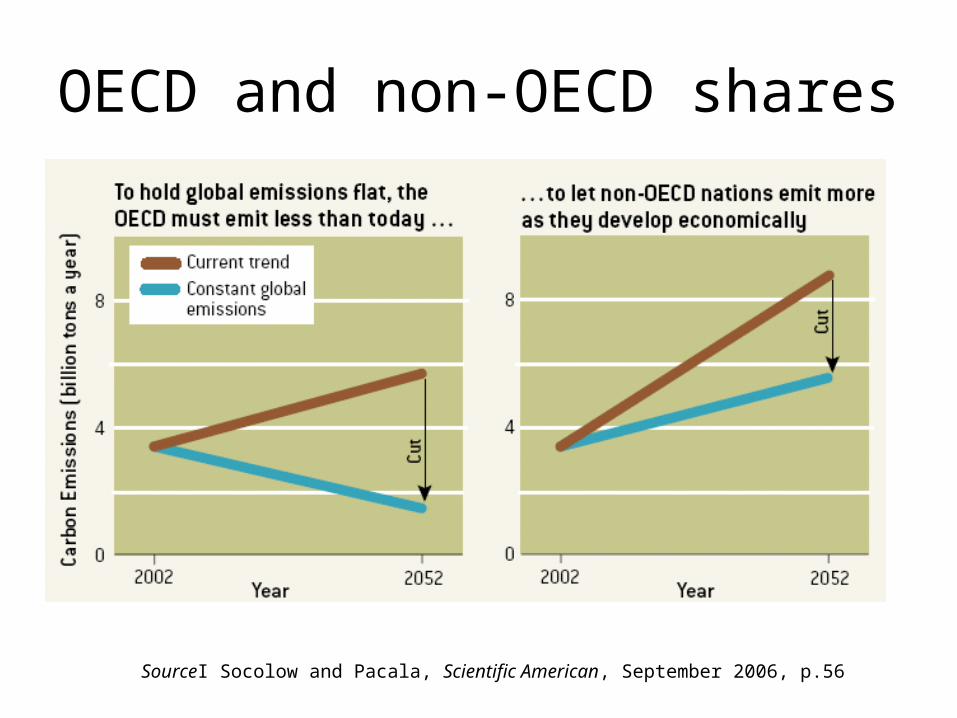
OECD and non-OECD shares
SourceI Socolow and Pacala, Scientific American, September 2006, p.56
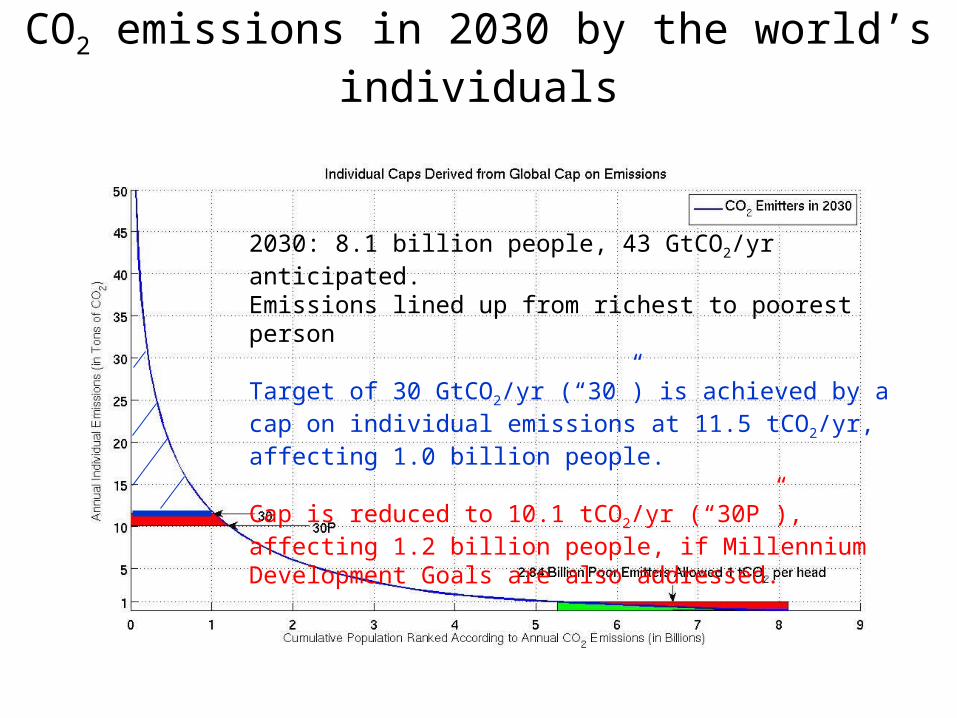
CO2 emissions in 2030 by the world’s individuals
2030: 8.1 billion people, 43 GtCO2/yr anticipated.Emissions lined up from richest to poorest person
Target of 30 GtCO2/yr (“30”) is achieved by a cap on individual emissions at 11.5 tCO2/yr, affecting 1.0 billion people.
Cap is reduced to 10.1 tCO2/yr (“30P”), affecting 1.2 billion people, if Millennium Development Goals are also addressed.
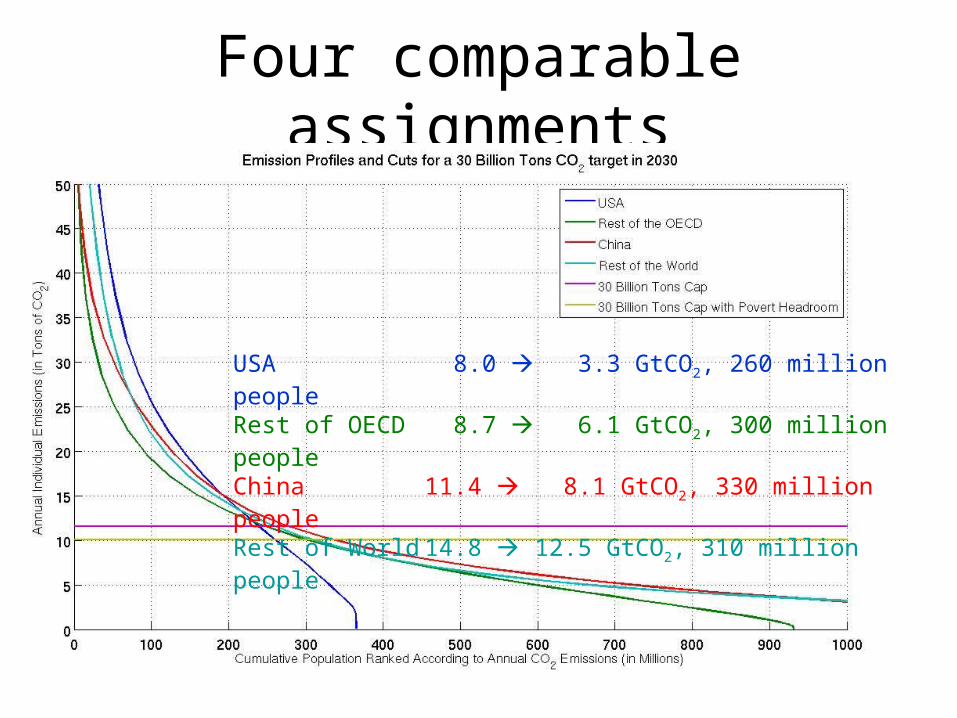
Four comparable assignments
USA 8.0 3.3 GtCO2, 260 million peopleRest of OECD 8.7 6.1 GtCO2, 300 million peopleChina 11.4 8.1 GtCO2, 330 million peopleRest of World 14.8 12.5 GtCO2, 310 million people
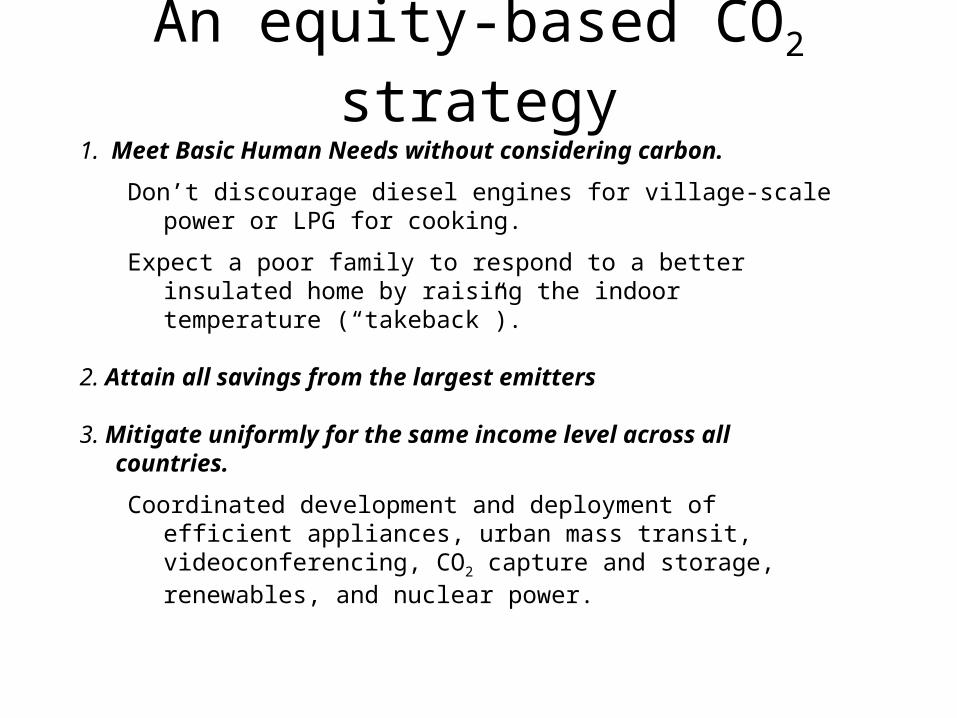
An equity-based CO2 strategy
1. Meet Basic Human Needs without considering carbon.
Don’t discourage diesel engines for village-scale power or LPG for cooking.
Expect a poor family to respond to a better insulated home by raising the indoor temperature (“takeback”).
2. Attain all savings from the largest emitters
3. Mitigate uniformly for the same income level across all countries.
Coordinated development and deployment of efficient appliances, urban mass transit, videoconferencing, CO2 capture and storage, renewables, and nuclear power.
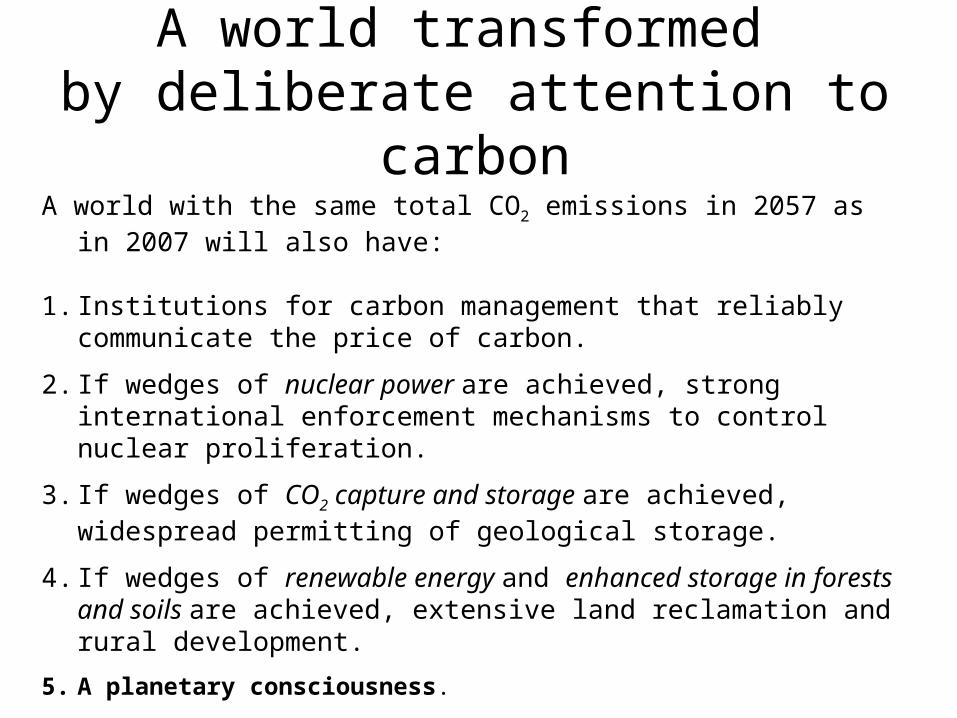
A world transformed by deliberate attention to carbon
A world with the same total CO2 emissions in 2057 as in 2007 will also have:
1. Institutions for carbon management that reliably communicate the price of carbon.
2. If wedges of nuclear power are achieved, strong international enforcement mechanisms to control nuclear proliferation.
3. If wedges of CO2 capture and storage are achieved, widespread permitting of geological storage.
4. If wedges of renewable energy and enhanced storage in forests and soils are achieved, extensive land reclamation and rural development.
5. A planetary consciousness.
Not an unhappy prospect!