Embed Size (px)
Citation preview
Policy Baseline Survey
ELLEMBELLE Report
August 2012

Page2
Introduction and Purpose The Gender Centre for Empowering Development (GenCED) undertook a baseline survey in the district of Ellembele primarily to promote and enhance the understanding of women and first-time voters on policy issues. The survey is part of a broader project goal to empower citizens to be politically active and also to influence local decision making. The survey data has been analysed based on a number of thematic areas, namely; electoral participation and civic responsibility, party affiliation and political activity, transparency and inclusivity in local governance, women in local governance, and policy literacy. The survey data was collected in 5 days and was based on a randomly selected district sample of 200 respondents representing a cross-section of the district population aged 18 years and above. All interviews were conducted one-on-one/face-to-face by trained field officers in the language of the respondent’s choice. The survey respondents were randomly selected to reflect the different constituents of people living in the rural (34.9 percent), semi-urban (32.5 percent) and urban areas (32.5 percent).
Brief Background
The Ellembele district which is one of the Seventeen (17) districts in the Western Region of Ghana is located on the southern end of the region between longitudes 2º05’ and 2º35’ West and latitude 4º40 and 5º20 North. The Ellembele district is one of the newly created districts in the Western Region of Ghana. It was carved out of the Nzema East district in 2008 under Legislative Instrument (LI 1918). Its district capital is Nkroful, the original birth place of Osagyefo Dr Kwame Nkrumah, the first president of the Republic of Ghana. The district capital is situated about 4 kilometers off the main trans-West Africa trunk road to Cote d’ Ivoire. It is about 80 kilometers from Takoradi, the regional capital and 305 kilometers to Accra the national capital. It is made up of 115 settlements with the major ones in the south.
The district lies within the wet semi-equatorial climate zone of the West African Sub-region. Rainfall is throughout the year with the highest monthly mean occurring around May and June. The average temperature in the district is about 29.4 degrees Celsius with variation in mean monthly temperatures ranging between 4 – 5 degrees Celsius throughout a year.
The vegetation of the district is made up of moist semi-deciduous rain forest in the northern part, but turns into secondary forest as one move southwards mainly due to human activities like tree felling and farming. There is about 70km coastline which is mainly of savanna vegetation. The district has several timber species and other non-timber forest products like rattan, bamboo. It also abounds in game and wildlife of all kinds which offer opportunities to generate resources for development.

Page3
The district is bounded in the south by the Gulf of Guinea, north by part of the north eastern part of the Axim municipality and the Wassa Amefi West district, west by the Jomorro district and the east by the River Ankobra (a major river in western region which separates the Ellembelle district from its mother district, now called Axim Municipality). It covers a total area of about 1,468 (square kilometers) which constitute about 6.8 percent of the total land mass of the region. The current population of the district based on the 2010 Ghana Population and Housing Census is 87,501 – just about 2.6 percent of the total population in the region (about 2.3 million). Women make up 51.6 percent of the district population with the men constituting 48.4 percent.
Cocoa is now the predominant tree crop grown in the district. It used to be the coconut tree crop until the devastation of the crop by the deadly yellowing disease (Cape Saint Paul’s wilt disease). Other tree crops of economic importance include oil palm, rubber, and citrus. Major food crops are cassava, plantain, rice, vegetables such as garden eggs, pepper, and tomato. Livestock kept include cattle, sheep and goat, pigs, local poultry and ducks. Marine fishing is the major activity along the coastal belt of the district.
Sample population More than half of the interviewees (52.3 percent) were women with 47.7 per cent being men. Nearly 88.1 percent of the population had some form of education. Table 1 presents the different levels of education. Only 3.1 percent of respondents had reached the university level, whereas 11.9 percent had no formal education.
Table 1: Educational level of sample population Educational Level Percentage of
sample population covered
Primary 9.3 JHS/MSL 42.5 SHS 27.5 Technical/Vocational 4.7 Teacher training/nursing 1.0 University 3.1 None 11.9 total 100
Data source: GenCED field data, July 2012 As many as 69.0 percent of respondents had some form of employment. Most were engaged in small income generating self-employment - trading (17.5 percent), commercial driving (11.4 percent) and the rest were engaged in other non-agriculture activities. Only 5.4 percent were farmers whereas 4.2 are involved in illegal mining
Page4
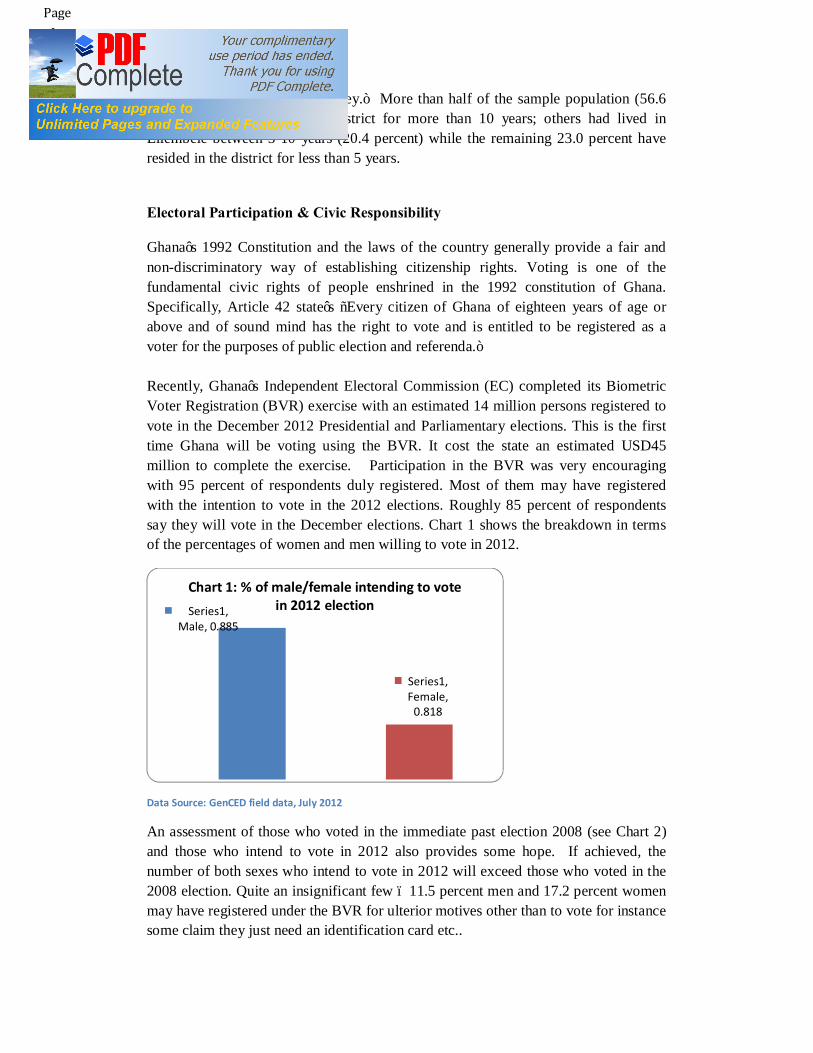
popularly referred to as “galamsey.” More than half of the sample population (56.6 percent) have resided in the district for more than 10 years; others had lived in Ellembele between 5-10 years (20.4 percent) while the remaining 23.0 percent have resided in the district for less than 5 years. Electoral Participation & Civic Responsibility Ghana’s 1992 Constitution and the laws of the country generally provide a fair and non-discriminatory way of establishing citizenship rights. Voting is one of the fundamental civic rights of people enshrined in the 1992 constitution of Ghana. Specifically, Article 42 state’s “Every citizen of Ghana of eighteen years of age or above and of sound mind has the right to vote and is entitled to be registered as a voter for the purposes of public election and referenda.” Recently, Ghana’s Independent Electoral Commission (EC) completed its Biometric Voter Registration (BVR) exercise with an estimated 14 million persons registered to vote in the December 2012 Presidential and Parliamentary elections. This is the first time Ghana will be voting using the BVR. It cost the state an estimated USD45 million to complete the exercise. Participation in the BVR was very encouraging with 95 percent of respondents duly registered. Most of them may have registered with the intention to vote in the 2012 elections. Roughly 85 percent of respondents say they will vote in the December elections. Chart 1 shows the breakdown in terms of the percentages of women and men willing to vote in 2012.
Data Source: GenCED field data, July 2012
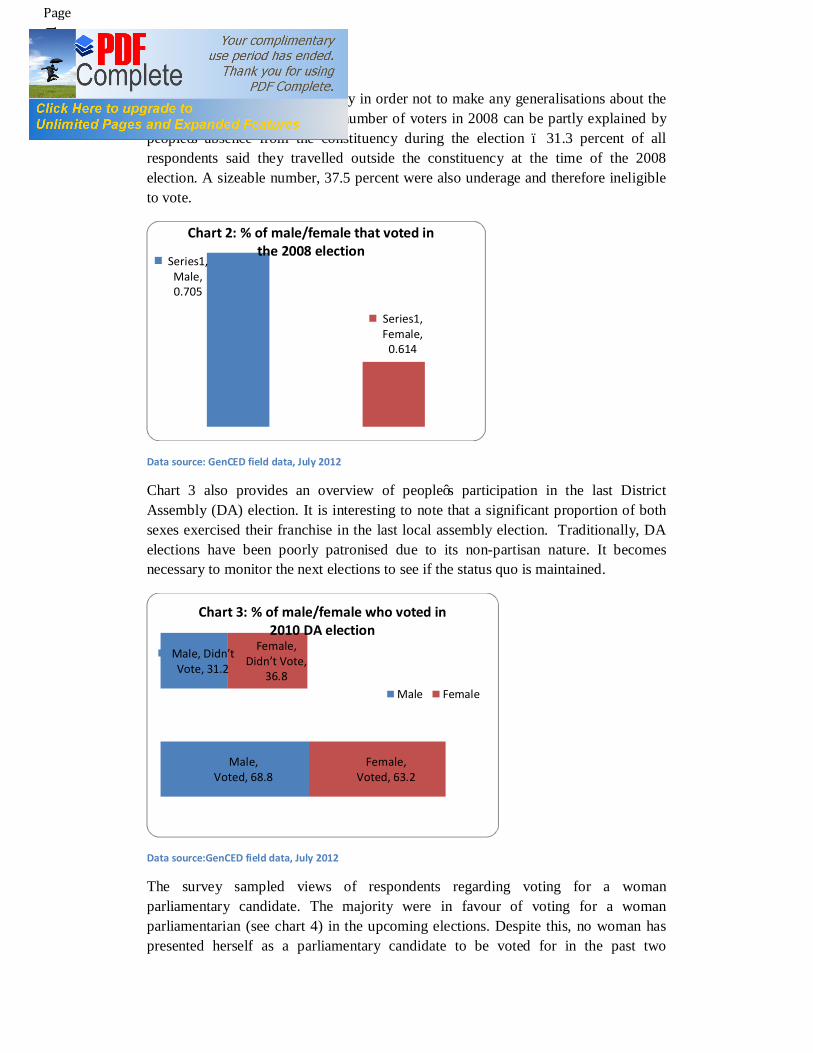
An assessment of those who voted in the immediate past election 2008 (see Chart 2) and those who intend to vote in 2012 also provides some hope. If achieved, the number of both sexes who intend to vote in 2012 will exceed those who voted in the 2008 election. Quite an insignificant few – 11.5 percent men and 17.2 percent women may have registered under the BVR for ulterior motives other than to vote for instance some claim they just need an identification card etc..
Series1, Male, 0.885
Series1, Female,
0.818
Chart 1: % of male/female intending to vote in 2012 election
Page5
Again we need to tread cautiously in order not to make any generalisations about the district’s population as the low number of voters in 2008 can be partly explained by people’s absence from the constituency during the election – 31.3 percent of all respondents said they travelled outside the constituency at the time of the 2008 election. A sizeable number, 37.5 percent were also underage and therefore ineligible to vote.
Data source: GenCED field data, July 2012
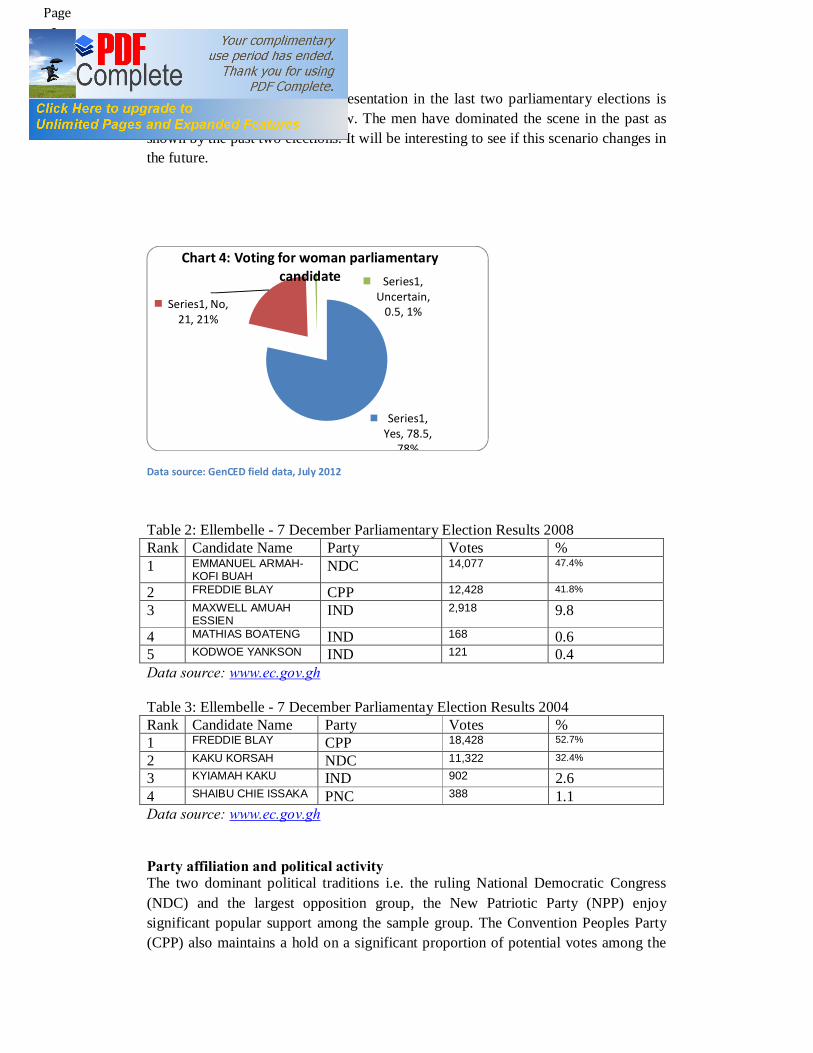
Chart 3 also provides an overview of people’s participation in the last District Assembly (DA) election. It is interesting to note that a significant proportion of both sexes exercised their franchise in the last local assembly election. Traditionally, DA elections have been poorly patronised due to its non-partisan nature. It becomes necessary to monitor the next elections to see if the status quo is maintained.
Data source:GenCED field data, July 2012
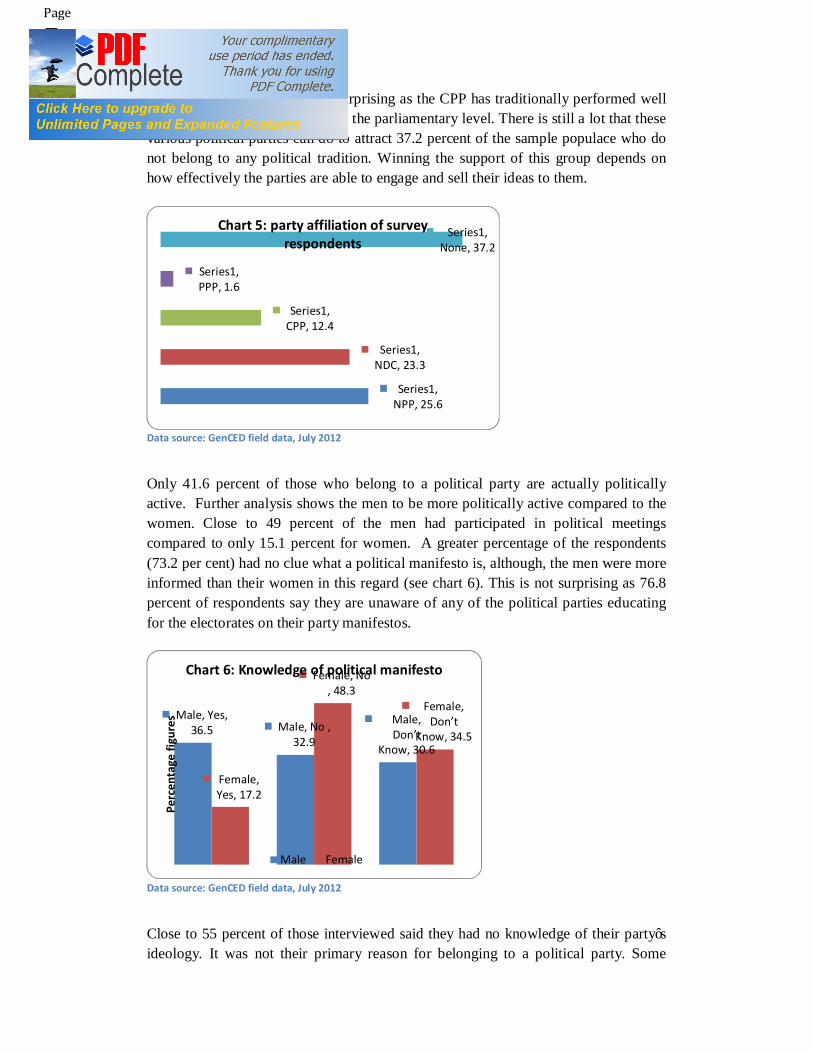
The survey sampled views of respondents regarding voting for a woman parliamentary candidate. The majority were in favour of voting for a woman parliamentarian (see chart 4) in the upcoming elections. Despite this, no woman has presented herself as a parliamentary candidate to be voted for in the past two
Series1, Male, 0.705
Series1, Female,
0.614
Chart 2: % of male/female that voted in the 2008 election
Male, Voted, 68.8
Male, Didn’t Vote, 31.2
Female, Voted, 63.2
Female, Didn’t Vote,
36.8
Chart 3: % of male/female who voted in 2010 DA election
Male Female
Page6
elections. An assessment of representation in the last two parliamentary elections is presented in tables 2 and 3 below. The men have dominated the scene in the past as shown by the past two elections. It will be interesting to see if this scenario changes in the future.
Data source: GenCED field data, July 2012
Table 2: Ellembelle - 7 December Parliamentary Election Results 2008 Rank Candidate Name Party Votes % 1 EMMANUEL ARMAH-
KOFI BUAH NDC 14,077 47.4%
2 FREDDIE BLAY CPP 12,428 41.8%
3 MAXWELL AMUAH ESSIEN
IND 2,918 9.8
4 MATHIAS BOATENG IND 168 0.6 5 KODWOE YANKSON IND 121 0.4 Data source: www.ec.gov.gh Table 3: Ellembelle - 7 December Parliamentay Election Results 2004 Rank Candidate Name Party Votes % 1 FREDDIE BLAY CPP 18,428 52.7%
2 KAKU KORSAH NDC 11,322 32.4%
3 KYIAMAH KAKU IND 902 2.6 4 SHAIBU CHIE ISSAKA PNC 388 1.1 Data source: www.ec.gov.gh Party affiliation and political activity The two dominant political traditions i.e. the ruling National Democratic Congress (NDC) and the largest opposition group, the New Patriotic Party (NPP) enjoy significant popular support among the sample group. The Convention Peoples Party (CPP) also maintains a hold on a significant proportion of potential votes among the
Series1, Yes, 78.5,
78%
Series1, No, 21, 21%
Series1, Uncertain,
0.5, 1%
Chart 4: Voting for woman parliamentary candidate
Page7
sample population. This is not surprising as the CPP has traditionally performed well in the constituency particularly at the parliamentary level. There is still a lot that these various political parties can do to attract 37.2 percent of the sample populace who do not belong to any political tradition. Winning the support of this group depends on how effectively the parties are able to engage and sell their ideas to them.
Data source: GenCED field data, July 2012
Only 41.6 percent of those who belong to a political party are actually politically active. Further analysis shows the men to be more politically active compared to the women. Close to 49 percent of the men had participated in political meetings compared to only 15.1 percent for women. A greater percentage of the respondents (73.2 per cent) had no clue what a political manifesto is, although, the men were more informed than their women in this regard (see chart 6). This is not surprising as 76.8 percent of respondents say they are unaware of any of the political parties educating for the electorates on their party manifestos.
Data source: GenCED field data, July 2012
Close to 55 percent of those interviewed said they had no knowledge of their party’s ideology. It was not their primary reason for belonging to a political party. Some
Series1, NPP, 25.6
Series1, NDC, 23.3
Series1, CPP, 12.4
Series1, PPP, 1.6
Series1, None, 37.2
Chart 5: party affiliation of survey respondents
Male, Yes, 36.5 Male, No ,
32.9
Male, Don’t
Know, 30.6
Female, Yes, 17.2
Female, No , 48.3
Female, Don’t
Know, 34.5
Perc
enta
ge fi
gure
s
Chart 6: Knowledge of political manifesto
Male Female

Page8
belonged to or liked a party for no specific reason (35 percent); some were influenced because other members of their family belonged to a particular party (35 percent); while the rest espoused different reasons. Only a few (12.5 percent) said their decision to belong to a political party was influenced by political philosophy/ideology. The engagement of both sexes by the political parties in the district has generally been poor, although the women seem a little worse off with more than 40 percent having little or no engagement with the political parties (see chart 7). This may partly explain their lack of knowledge when it comes to ideologies and manifestos.
Data source: GenCED field data, July 2012
Transparency & inclusivity in local governance The survey set out to ascertain the extent to which women generally participate in political activity in the district. Ghana has taken important steps towards achieving greater gender equality and promoting women’s participation in politics, in line with the UN Convention for the Elimination of all forms of Discrimination against Women (CEDAW). As a practical demonstration of this commitment, in 1998 cabinet adopted an affirmative action policy which established a 40 per cent quota for women’s representation on all government boards, commissions, committees and other official bodies. In 2001, the government followed this with the creation of a Ministry of Women and Children’s Affairs (MOWAC). Despite these interventions at the national and international levels, women’s participation in local governance and representation at the DA level remains at a dismally low level. A little more than half of the respondents (50.3 percent) say women in the constituency are encouraged to contest public offices. A sizable proportion of the female sample population (42.9 percent) also affirmed this position. Even though this is a positive development, it is not certain which groups encourage the women. A significant proportion of survey respondents (66.3 percent) say there are no women
Male, High, 16.9
Male, Moderate,
48.3
Male, Low, 25.8
Male, No Engagement, 9 Female, High,
5.3
Female, Moderate,
40.4 Female, Low,
40.4
Female, No Engagement,
13.9
Percentage figures
Chart 7: Parties engagement with the sexes

Page9
advocacy groups in Ellembelle that support or build capacity of other women to contest for public offices. Ghana’s local government system is premised on the element of participatory democracy. The decentralisation reforms were also intended to foster transparency, responsiveness, and accountability. By law, members of the Metropolitan, Municipal and District Assemblies (MMDAs) are supposed to meet electorates before every meeting of the assembly. They are also enjoined to consult the electorate on issues to be discussed in the assembly, and collate their views, opinions, and proposals for submission to the assembly. In addition MMDAs must provide their constituents with feedback on the general decisions of the assembly and the actions taken to address the problems of concern. Indeed, the local government Act (Act 462) mandates local government bodies to involve local people in development planning, implementation and monitoring at the grassroots level. But what is the popular experience here in the context of Ellembele?
Data source: GenCED field data, July 2012
The survey indicates weak levels of citizen engagement with the assemblies. Participation in local governance is generally weak. Majority of respondents seem reluctant or unable to take advantage of whatever opportunities decentralisation reforms have created for popular participation. The local government actors do not report back to the communities frequently to explain the outcome of decisions taken regarding development/local governance. More than half of the respondents blamed key actors - Unit Committee members, DA employees, the Member of Parliament (MP) and political parties for not reporting back to them regarding development and issues of local governance. This is highlighted in chart 8 above. Meanwhile, the Assembly man/woman is rated highest as the first point of contact for respondents whenever they have specific concerns to do with the capitation grant,
Perc
enta
ge fi
gure
s
Chart 8: Report back to communities on development/local governance
Page10
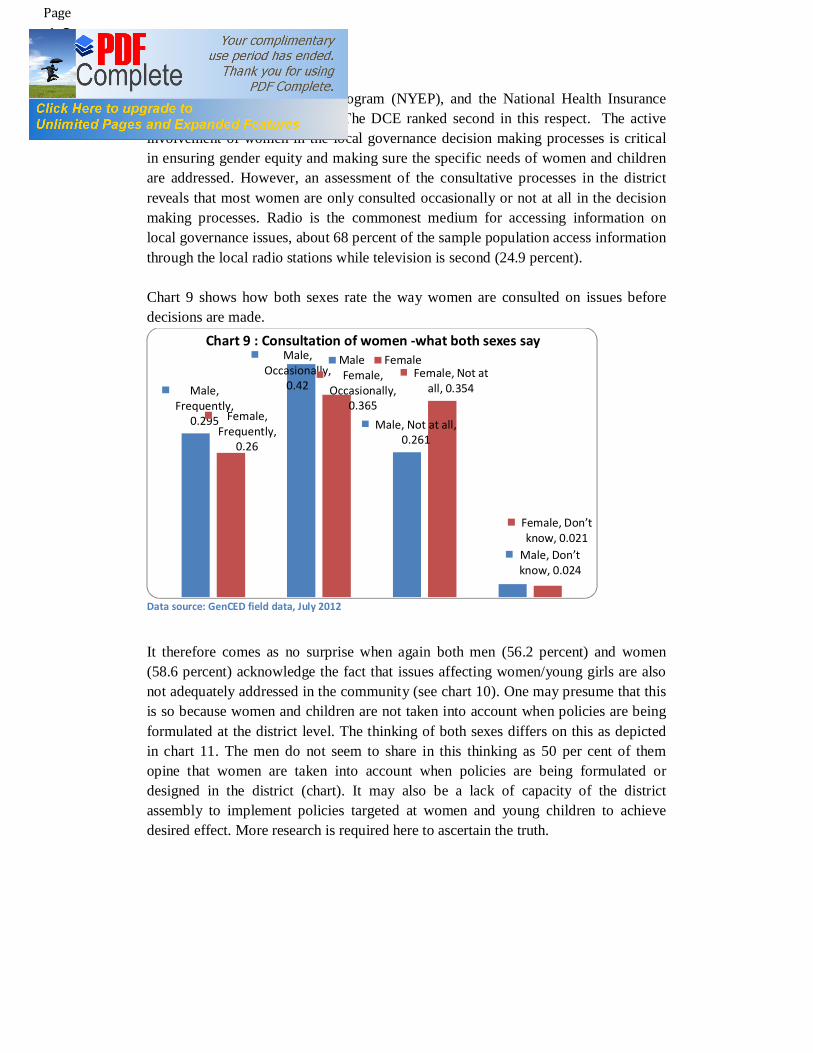
National Youth Employment Program (NYEP), and the National Health Insurance Scheme (NHIS) among others. The DCE ranked second in this respect. The active involvement of women in the local governance decision making processes is critical in ensuring gender equity and making sure the specific needs of women and children are addressed. However, an assessment of the consultative processes in the district reveals that most women are only consulted occasionally or not at all in the decision making processes. Radio is the commonest medium for accessing information on local governance issues, about 68 percent of the sample population access information through the local radio stations while television is second (24.9 percent). Chart 9 shows how both sexes rate the way women are consulted on issues before decisions are made.
Data source: GenCED field data, July 2012
It therefore comes as no surprise when again both men (56.2 percent) and women (58.6 percent) acknowledge the fact that issues affecting women/young girls are also not adequately addressed in the community (see chart 10). One may presume that this is so because women and children are not taken into account when policies are being formulated at the district level. The thinking of both sexes differs on this as depicted in chart 11. The men do not seem to share in this thinking as 50 per cent of them opine that women are taken into account when policies are being formulated or designed in the district (chart). It may also be a lack of capacity of the district assembly to implement policies targeted at women and young children to achieve desired effect. More research is required here to ascertain the truth.
Male, Frequently,
0.295
Male, Occasionally,
0.42
Male, Not at all, 0.261
Male, Don’t know, 0.024
Female, Frequently,
0.26
Female, Occasionally,
0.365
Female, Not at all, 0.354
Female, Don’t know, 0.021
Chart 9 : Consultation of women -what both sexes say Male Female

Page11
Data source: GenCED field data, July 2012
Data source: GenCED field data, July 2012
Policy Literacy The survey reveals a paucity of knowledge when it comes to the policy issues. Most respondents had no knowledge or poor knowledge on major policy issues such as climate change and its effects, oil and gas policy, the NHIS, and Capitation Grant interventions and the Medium Term Agriculture Sector Investment Plan to mention but a few (see charts 12, 13, 14 & 15). The lack of knowledge means most respondents are not well informed to influence policies in these key thematic areas.
Male, Yes, 21.3
Male, No, 56.2
Male, Don’t
know, 22.5
Female, Yes, 22.2
Female, No, 58.6
Female, Don’t
know, 19.2
Percentage figures
Chart 10: Are issues concerning women/girls adequately addressed?
Female Male
Male, Yes, 50
Male, No, 34.4
Male, Don’t know, 15.6
Female, Yes, 36.5
Female, No, 45.8
Female, Don’t
know, 17.7
Percentage Figures
Chart 11: Women's issues factored into policy formulation
Female Male

Page12
Data source: GenCED field data, July 2012
Data source: GenCED field data, July 2012
Data source: GenCED field data, July 2012
Male, High, 7.6
Male, Moderate,
19.6
Male, Low, 25
Male, Don’t Know, 47.8
Female, High, 5.2
Female, Moderate,
11.5
Female, Low, 27.1
Female, Don’t Know,
56.3
Percentage figures
Chart 12: Understanding on climate change
Female Male
Male, High, 3.3
Male, Moderate,
19.6
Male, Low, 26.1
Male, Don’t Know, 51.1
Female, High, 3
Female, Moderate,
8.1
Female, Low, 22.2
Female, Don’t Know,
66.7
Percentage figures
Chart 13: Understanding of oil & gas
Female Male
Male, High, 29.3
Male, Moderate,
19.6 Male, Low,
15.2
Male, Don’t Know, 35.9
Female, High, 19.2 Female,
Moderate, 13.1
Female, Low, 11.1
Female, Don’t
Know, 56.6
Percentage figures
Chart 14: Understanding of NHIS Male Female

Page13
Meanwhile, progress on other targets such as reducing the maternal mortality ratio by three quarters by 2015 is off track. Maternal mortality ratio reduced from 451 per 100,000 live births in 2008 and is estimated to be further reduced to about only 340 per 100,000 by 2015, instead of the MDG target of 185 per 100,000 by 2015. The district data also shows clearly, it is unlikely also that the 2015 target of reducing the child mortality rates will be easily met. The slow progress has been of great concern to policy decision makers to the extent that Maternal Mortality has been declared a national emergency. These issues are well known and overly emphasised at the national level but lack visibility at the decentralised local levels. Chart 14 shows that quite a significant percentage of women and women had no knowledge of the NHIS and the capitation grant intervention that had been introduced by government to enhance access to health and education across board. Yet again, significant numbers had no clue what the policy on girl child education was as depicted in chart 15 below.
Data source: GenCED field data, July 2012
A review and assessment of the Millennium Development Goals (MDGs) in Ghana highlights some of these policy issues. With barely three years to reach the United Nations MDGs timeline, it is evident that Ghana’s progress in achieving the MDGs is mixed. The country is largely on track to achieve the MDG 1 target of reducing by half the proportion of the population living in extreme poverty and also to achieve universal primary education.
GenCED must embark on an outreach policy literacy project that will enable community members particularly women and the youth, effectively understand these policy issues to enhance their proactive engagement to influence political decisions and the policy making processes in general. For instance, equipping communities with knowledge and skills to enable them adopt good health practices and better health-seeking behaviour and to recognize the danger
Male, High , 18.5
Male, Moderate,
21.7 Male, Low,
13
Male, Don’t know, 46.8
Female, High , 6.1
Female, Moderate,
21.2 Female,
Low, 16.2
Female, Don’t know,
56.5
perc
enta
ge fi
gure
s Chart 15: Understanding of girl child edu policy
Male Female
Page14
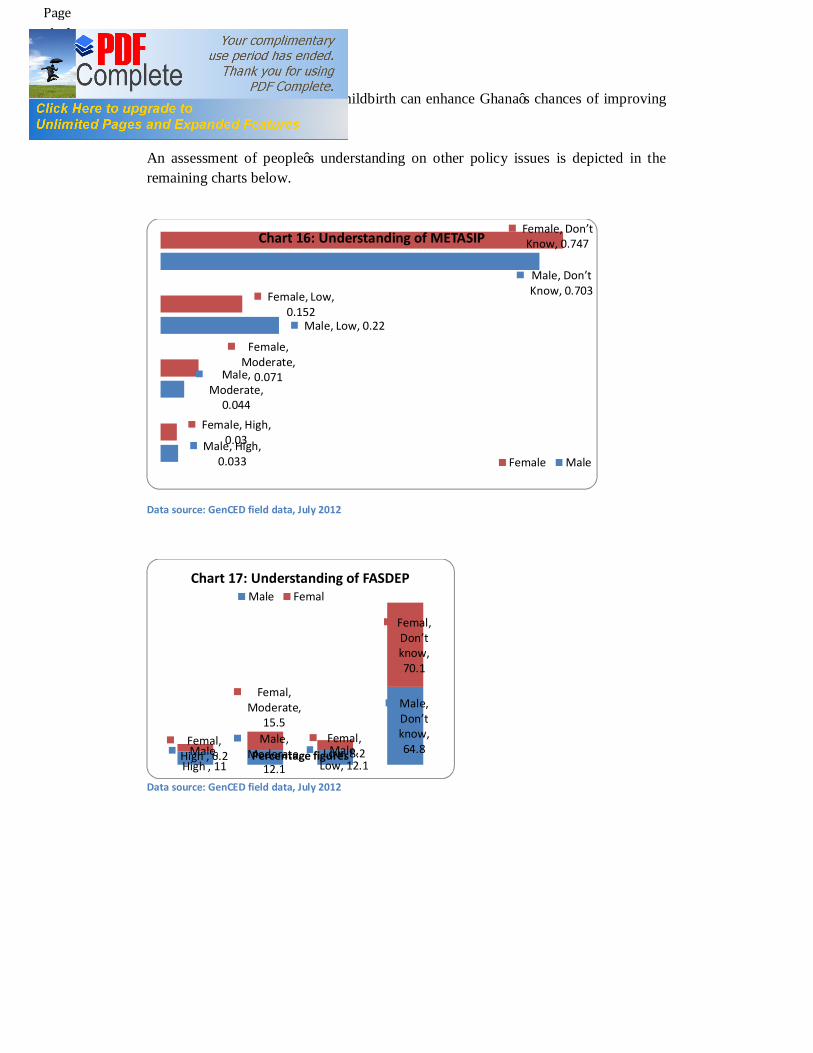
signs related to pregnancy and childbirth can enhance Ghana’s chances of improving on MDG3. An assessment of people’s understanding on other policy issues is depicted in the remaining charts below.
Data source: GenCED field data, July 2012
Data source: GenCED field data, July 2012
Male, High, 0.033
Male, Moderate,
0.044
Male, Low, 0.22
Male, Don’t Know, 0.703
Female, High, 0.03
Female, Moderate,
0.071
Female, Low, 0.152
Female, Don’t Know, 0.747 Chart 16: Understanding of METASIP
Female Male
Male, High , 11
Male, Moderate,
12.1 Male,
Low, 12.1
Male, Don’t know, 64.8
Femal, High , 6.2
Femal, Moderate,
15.5 Femal,
Low, 8.2
Femal, Don’t know, 70.1
Percentage figures
Chart 17: Understanding of FASDEP Male Femal

Page15
Data source: GenCED field data, July 2012
Data source: GenCED field data, July 2012
Male, Yes, 1.1, 1%
Male, No, 52.8, 53%
Male, Don’t know,
46.1, 46%
Chart 18: % of men who are aware of DA medium term plan
Yes No Don’t know
Female, Yes, 2, 2%
Female, No, 57.1,
57%
Female, Don’t know,
40.9, 41%
Chart 19: % of women who are aware of DA medium term plan
Yes No Don’t know