Embed Size (px)
Citation preview

Policy Change andEconomic Growth:
A Case Study of South Africa
David FaulknerChristopher Loewald
WORKING PAPER NO.41
www.growthcommission.org
Commission on Growth and Development Montek AhluwaliaEdmar BachaDr. BoedionoLord John Browne Kemal DervisAlejandro FoxleyGoh Chok TongHan Duck-sooDanuta HübnerCarin JämtinPedro-Pablo KuczynskiDanny Leipziger, Vice ChairTrevor ManuelMahmoud MohieldinNgozi N. Okonjo-IwealaRobert RubinRobert SolowMichael Spence, ChairSir K. Dwight VennerErnesto ZedilloZhou Xiaochuan
The mandate of the Commission on Growth and Development is to gather the best understanding there is about the policies and strategies that underlie rapid economic growth and poverty reduction.
The Commission’s audience is the leaders of developing countries. The Commission is supported by the governments of Australia, Sweden, the Netherlands, and United Kingdom, The William and Flora Hewlett Foundation, and The World Bank Group.
South Africa’s growth experience shows how contrasting growth trends—long-term decline followed by improved growth—pivot around political change,
in this case a transition to democracy. In the decade prior to 1994, South Africa experienced the worst period of economic growth since the end of the Second World War. The proximate causes of slowing growth were trade and fi nancial sanctions in opposition to the Apartheid government, political instability and macroeconomic policy decisions that resulted in higher infl ation, increased uncertainty, and declining investment. Democracy has proved critical for creating the possibility of a peaceful and more stable future and reversing investor sentiment. Political and economic leadership have been essential for improving the country’s growth performance because of the effect on policy formulation, institutional development, regulatory design, and economic vision. Prudent fi scal policy and sound macroeconomic management have been critical factors in creating an environment conducive to growth by stabilizing economic conditions, lowering the user cost of capital, and putting downward pressure on the real exchange rate. This case study provides some insight into a more general perspective on political and economic transition and some of the key macro- and microeconomic policy shifts that help realize a more rapid and sustained growth path.
David Faulkner, ODI fellow; Senior Economist, National Treasury of the Republic of South AfricaChristopher Loewald, Deputy Director-General for Economic Policy, National Treasury of the Republic of South Africa
Cover_WP041.indd 1 12/9/2008 4:03:34 PM


WORKING PAPER NO. 41
Policy Change and
Economic Growth:
A Case Study of South Africa
David Faulkner
Christopher Loewald

© 2008 The International Bank for Reconstruction and Development / The World Bank
On behalf of the Commission on Growth and Development
1818 H Street NW
Washington, DC 20433
Telephone: 202‐473‐1000
Internet: www.worldbank.org
www.growthcommission.org
E‐mail: [email protected]
All rights reserved
1 2 3 4 5 11 10 09 08
This working paper is a product of the Commission on Growth and Development, which is sponsored by
the following organizations:
Australian Agency for International Development (AusAID)
Dutch Ministry of Foreign Affairs
Swedish International Development Cooperation Agency (SIDA)
U.K. Department of International Development (DFID)
The William and Flora Hewlett Foundation
The World Bank Group
The findings, interpretations, and conclusions expressed herein do not necessarily reflect the views of the
sponsoring organizations or the governments they represent.
The sponsoring organizations do not guarantee the accuracy of the data included in this work. The
boundaries, colors, denominations, and other information shown on any map in this work do not imply
any judgment on the part of the sponsoring organizations concerning the legal status of any territory or
the endorsement or acceptance of such boundaries.
All queries on rights and licenses, including subsidiary rights, should be addressed to the
Office of the Publisher, The World Bank, 1818 H Street NW, Washington, DC 20433, USA;
fax: 202‐522‐2422; e‐mail: [email protected].
Cover design: Naylor Design
Policy Change and Economic Growth: A Case Study of South Africa iii
About the Series
The Commission on Growth and Development led by Nobel Laureate Mike
Spence was established in April 2006 as a response to two insights. First, poverty
cannot be reduced in isolation from economic growth—an observation that has
been overlooked in the thinking and strategies of many practitioners. Second,
there is growing awareness that knowledge about economic growth is much less
definitive than commonly thought. Consequently, the Commission’s mandate is
to “take stock of the state of theoretical and empirical knowledge on economic
growth with a view to drawing implications for policy for the current and next
generation of policy makers.”
To help explore the state of knowledge, the Commission invited leading
academics and policy makers from developing and industrialized countries to
explore and discuss economic issues it thought relevant for growth and
development, including controversial ideas. Thematic papers assessed
knowledge and highlighted ongoing debates in areas such as monetary and fiscal
policies, climate change, and equity and growth. Additionally, 25 country case
studies were commissioned to explore the dynamics of growth and change in the
context of specific countries.
Working papers in this series were presented and reviewed at Commission
workshops, which were held in 2007–08 in Washington, D.C., New York City,
and New Haven, Connecticut. Each paper benefited from comments by
workshop participants, including academics, policy makers, development
practitioners, representatives of bilateral and multilateral institutions, and
Commission members.
The working papers, and all thematic papers and case studies written as
contributions to the work of the Commission, were made possible by support
from the Australian Agency for International Development (AusAID), the Dutch
Ministry of Foreign Affairs, the Swedish International Development Cooperation
Agency (SIDA), the U.K. Department of International Development (DFID), the
William and Flora Hewlett Foundation, and the World Bank Group.
The working paper series was produced under the general guidance of Mike
Spence and Danny Leipziger, Chair and Vice Chair of the Commission, and the
Commission’s Secretariat, which is based in the Poverty Reduction and
Economic Management Network of the World Bank. Papers in this series
represent the independent view of the authors.

iv David Faulkner and Christopher Loewald
Acknowledgments
We thank Marisa Fassler, Johann Fedderke, Homi Kharas, Natalie Labuschagne,
Theo Janse Van Rensburg, Roberto Zagha, and an anonymous referee from
Economic Research South Africa (ERSA) for helpful comments and suggestions
on earlier drafts of this paper.

Policy Change and Economic Growth: A Case Study of South Africa v
Abstract
South Africa’s growth experience provides an example of how contrasting
growth trends—long‐term decline followed by improved growth—pivot around
political change, in this case a transition to democracy. In the decade prior to
1994, South Africa experienced the worst period of economic growth since the
end of the Second World War, with growth variable and declining. The
proximate causes of slowing growth were trade and financial sanctions in
opposition to the Apartheid government, political instability and macroeconomic
policy decisions that resulted in higher inflation, increased uncertainty, and
declining investment. Democracy has proved critical for, among other factors,
creating the possibility of a peaceful and more stable future and reversing
investor sentiment at a basic level. Political and economic leadership have been
essential for improving the country’s growth performance because of the effect
on policy formulation, institutional development, regulatory design, and
economic vision. Prudent fiscal policy and sound macroeconomic management
have been critical factors in creating an environment conducive to growth by
stabilizing economic conditions, lowering the user cost of capital, and putting
downward pressure on the real exchange rate. This case study provides some
insight into a more general perspective on political and economic transition and
some of the key macro‐ and microeconomic policy shifts that need to occur to
realize a more rapid and sustained growth path.


Policy Change and Economic Growth: A Case Study of South Africa vii
Contents
About the Series ............................................................................................................. iii Acknowledgments ..........................................................................................................iv Abstract .............................................................................................................................v 1. Introduction ..................................................................................................................9 2. Overview of South Africa’s Growth Trends ..........................................................11 3. Potential Output and the Decomposition of South Africa’s
Economic Growth....................................................................................................17 4. 1970–94: Falling Growth and the Demise of the Apartheid Economy ...............20 5. 1994 to Present: Democracy, Macroeconomic Stability, and Growth.................27 6. Conclusion ..................................................................................................................51 References .......................................................................................................................54


Policy Change and Economic Growth: A Case Study of South Africa 9
Policy Change and
Economic Growth:
A Case Study of South Africa
David Faulkner
Christopher Loewald 1
1. Introduction
An economy’s growth rate is determined by the rate of increase in the use of
capital, labor, and other factors of production, and the efficiency with which
these factors are used. Economic growth is complex because of the vast range of
subsidiary factors that influence these fundamental variables. The subsidiary
factors include labor productivity, market structures, regulations, and other
microeconomic policies; economic growth in trading partners; and the
macroeconomic management of the economy through the business cycle.
Political factors ranging from institutional governance to the construction of
political coalitions in support of good policies play an especially important role
in economic growth.
South Africa’s growth experience provides an example of where contrasting
growth trends—long‐term decline followed by improved growth—have pivoted
around political change, in this case a transition to democracy. Democracy has
proved critical to, among other factors, creating the possibility of a peaceful and
more stable future and reversing investor sentiment at a basic level. Political and
economic leadership have been essential to improving the country’s growth
performance, because of the effect on policy formulation, institutional
development, regulatory design, and economic vision. Economic vision was
critical and reflected the need and desire to integrate previously disadvantaged
groups, from an Apartheid state of informality and exclusion, within the formal
economy. From an economy‐wide perspective, this was expected to expand
domestic supply and demand and more generally reinvigorate an economy that
was slowly recovering from the stagflationary malaise of the late 1980s and early
1990s. Of the range of possible ways of extending the economic franchise of the
1 David Faulkner is an Overseas Development Institute (ODI) fellow and Senior Economist in the
National Treasury of the Republic of South Africa (email: [email protected]) and
Christopher Loewald is the Deputy Director‐General for Economic Policy in the National Treasury
of the Republic of South Africa (email: [email protected]). This paper reflects
our personal views and not those of the National Treasury or of the Government of the Republic of
South Africa.

10 David Faulkner and Christopher Loewald
country, policy was largely directed towards putting in place the basics for
sustainable economic growth and securing the means for the long‐term financing
of social wages, transfers, public services, and infrastructure.
Another political economy factor in South Africa’s improved growth
performance since 1994 has been the policy response to reintegration with the
world economy and globalization. A central objective of macroeconomic policy
decisions has been to garner net economic benefits from globalization, including
increasing foreign demand for South African exports and enabling an inward
flow of capital. These decisions were made in the context of a fluid global
environment during the 1990s characterized by burgeoning international
financial markets and successive international financial crises.
From a macroeconomic perspective, two quite distinct phases have been
evident for South Africa. In both phases, the macroeconomic stance has largely
been to lean against the wind. In the first phase, from 1994 to 2002, South African
policy adjusted to the high probabilities of sudden reversals of capital inflows
and difficulties in attracting foreign direct investment. In the second phase, from
about 2002 to the present, macroeconomic policy reflected the desire to maintain
stability and enhance growth rates on the back of stronger terms of trade gains
while avoiding overheating and real exchange rate appreciation.
Intersecting with and underlying the macroeconomic aspects of addressing
globalization have been a range of microeconomic issues that affected economic
growth, in a more direct manner. Macroeconomic management has taken into
consideration quite explicitly the challenge of maintaining low inflation and its
positive competitiveness effects with a set of preexisting product markets that
discourage new entry and have weak incentives to advance productivity or make
greater use of land, labor, and capital. Some of the central microeconomic
challenges confronting South Africa, in terms of raising the sustainable economic
growth rate above 5 percent per year, include competitiveness, market structure
and competition, productivity, tariffs, and pricing issues. Total factor productivity
(TFP) has become an important source of economic growth, while factor
accumulation slowed. More rapid growth in productivity with a much greater
use of labor remains one of the main growth challenges facing the economy.
The recent findings from the Commission on Growth and Development
highlight the growth experiences of those economies that have enjoyed high and
sustained growth—defined as average growth of 7 percent per year over at least
25 years—in the post‐Second World War era. South Africa cannot yet be grouped
with such countries, in part because the country is still in the early years of a
growth trajectory very different from that of its pre‐1994 history. This case study
provides some insight into a more general perspective on political and economic
transition and some of the key policy shifts that need to occur to realize a more rapid
and sustained growth path. In this paper, we provide a summarized and largely
synthetic view of economic growth in South Africa and highlight policy changes that
have contributed to sustainable improvements in growth.

Policy Change and Economic Growth: A Case Study of South Africa 11
The paper is structured as follows. In section 2, we provide a brief overview
of the growth trends in South Africa since 1970 illustrating the long‐term decline
and subsequent reversal since 1994. Section 3 looks at the potential growth rate
of the economy; reviewing work on decomposing growth into the aggregate
factors of production before adopting a more detailed approach to South Africa’s
growth experience. Section 4 considers the growth experience in the final
decades of the Apartheid economy. Section 5 discusses the determinants of South
Africa’s macroeconomic stability and improved economic growth. Combined,
sections 4 and 5 attempt to provide a broad perspective of the drivers of South
Africa’s economic performance.
In the conclusion (section 6), we attempt to identify a few key
microeconomic factors that seem central to the challenge of increasing the rate of
sustainable economic growth to 7 percent or more.
2. Overview of South Africa’s Growth Trends
South Africa’s economic development has been dominated by colonialism and
Apartheid—racially exclusive political and economic systems predicated on
exploitation of natural resources, notably gold and other minerals. Industry was
mostly linked to commodities or to a perceived need for national capacity, and
policy supporting the development of import‐competing products was
pervasive. Major services, such as electricity, telecommunications, and transport
were dominated by public sector corporations (or parastatals). Heavily
subsidized, these parastatals were able to provide relatively cheap inputs to
industrial and mining production. This network of parastatals served the formal
sector, but like the rest of the formal sector, was insulated from competition, and
thus provided poor‐quality service at low subsidized prices.
Economic growth was conditioned on the one hand by changes in
commodity prices and on the other by a low‐productivity and low‐employment
approach to production that took advantage of limited competition from imports
and cheap intermediate inputs (made cheaper by a high real exchange rate). A
large urban African working class developed in the mining and manufacturing
industries, but was subject to high labor supply costs, imposed as a consequence
of Apartheid’s spatial dislocation policies. Separate and vastly unequal public
services, particularly education, contributed to the creation of large, semi‐urban
and urban, geographically isolated communities with low education levels and
little means for self‐generated economic development. Until 1986, unions formed
by black labor were illegal, helping to keep real consumption wages low.
By the 1990s, the supply cost of labor had been driven up by the
geographical distance of these areas and the relatively underdeveloped urban
environments of the main economic centers. Public transport, roads, and housing
were insufficient to absorb migrants from rural or far‐flung industrial areas.

12 David Faulkner and Christopher Loewald
Formal‐sector wage bargaining reflected the complex nature of households split
between rural and urban areas, elevated dependency ratios, and the high costs of
inefficient transport systems.2 The high‐skill, predominantly white labor market
suffered from excess demand and insufficient supply due to the constraints on
the ability for black South Africans to attain higher skills. The lower‐skill labor
markets, both urban and rural, were characterized by massive excess supply, low
productivity, and low pay.
The financial system that developed primarily addressed the needs of
mining, with many of the financial houses started by the one industry capable of
generating large surplus profits. Much of the nascent manufacturing, machine
goods, and technology industries had finance rationed, which meant that close
links were needed to secure sufficient financing. For that reason, South Africa’s
manufacturing industries relied more on self‐generated earnings for investment
rather than bank lending or the capital markets.
The structure of South Africa’s industries was further influenced by the
economic policies implemented under the Apartheid system. Over time, markets
for domestically produced goods had become highly concentrated, with tariffs,
labor market policies, and product, distribution, and licensing regulations
insulating producers of final goods, intermediate goods, and factor markets from
consumption pressures and competition.
Monetary policy became accommodative by the 1980s, resulting in
consistent negative real interest rates. This policy was made possible by rigorous
exchange controls, which prevented capital from crossing the border. In the same
period, public spending rose strongly in an effort to extend social infrastructure
and increase subsidies to industry. This resulted in large budget deficits and
rising debt levels (see figure 1). This combination of policies resulted in steadily
rising inflation; Consumer Price Index (CPI) inflation reached a peak of almost 21
percent in 1986, negating the effect of the decline in the nominal exchange rate on
the real exchange rate and preventing any offsetting rise in exports.
In the decade prior to 1994, South Africa experienced the worst period of
economic growth since the end of the Second World War, with growth variable
and declining. The proximate causes of slowing growth were trade and financial
sanctions in opposition to the Apartheid government, political instability and
macroeconomic policy decisions that attempted to resuscitate the economy but
resulted in higher inflation, increased uncertainty, and declining investment.
Protected by import substitution policies, structural constraints such as high
market concentration and the dominance of key sectors by bloated and inefficient
public sector corporations impeded the productivity‐ and growth‐enhancing
effects of competition. New firm creation in most sectors was low.
2 In addition, there was a gradual shift by unions to bargaining over the real as opposed to the
nominal wage rate induced by high inflation, and increased focus on driving up entry‐level wages
in order to push up wages throughout the skill hierarchy.

Policy Change and Economic Growth: A Case Study of South Africa 13
Figure 1: Debt as a Share of GDP, 1980–95
0
10
20
30
40
50
60
1980 1981 1982 1983 1984 1985 1986 1987 1988 1989 1990 1991 1992 1993 1994 1995
Perc
ent of G
DP
Year
The distributional effects of this particular economic configuration were
especially adverse for those segments of the population outside of the formal
sector of the economy. These segments were growing since the rate of labor
absorption in the economy was low and started to decline in some sectors in 1986
and in the economy as a whole from about 1989. Economic opportunities for
most South Africans were extremely limited, due to racial exclusion, low skills
and education levels, and barriers to entry into markets created by legal
restrictions and high levels of concentration. These same factors also contributed
to low rates of economic growth, generating a vicious cycle whereby new
opportunities were simply not created. The real exchange rate directly benefited
capital‐intensive industries, further limiting employment growth. In terms of
consumption, the real exchange rate enabled those with high incomes to enjoy
strong purchasing power over imported goods.
The downward trend in economic growth rates from the early 1970s was
reversed in 1994. The rapid reestablishment of a basic level of political certainty
was followed by confidence‐building economic announcements, the combination
of which helped to reverse some of the low consumption and investment levels.
Output in the economy abruptly switched from contraction to growth, and since
1994, has accelerated steadily. After averaging a mere 1.0 percent during the final
decade of Apartheid, output growth rose to an average of 3.0 percent over the
period 1994 to 2003. Over the four‐year period since 2004, economic growth has
accelerated to an average level of 5.1 percent (2004–07).

14 David Faulkner and Christopher Loewald
Figure 2: GDP Growth, 1970 to 2007
–3
–2
–1
0
1
2
3
4
5
6
7
8
1970
1972
1974
1976
1978
1980
1982
1984
1986
1988
1990
1992
1994
1996
1998
2000
2002
2004
2006
Perc
enta
ge c
hange y
ear-
on-y
ear
Year
Figure 3: Real GDP per Capita, 1970 to 2007
19,000
20,000
21,000
22,000
23,000
24,000
25,000
26,000
1970
1972
1974
1976
1978
1980
1982
1984
1986
1988
1990
1992
1994
1996
1998
2000
2002
2004
2006
Ra
nd
Year
The downward trend and subsequent reversal is observed in the trend of
real gross domestic product (GDP) growth—as shown in figure 2. Figure 3
illustrates the considerable decline in GDP per capita after 1981 and its post‐1994
recovery. GDP per capita only exceeded its previous peak of R 24,000 in 2006.
The observed improvements in South Africa’s growth performance cannot
compare to the 13 examples of sustained high growth identified by the
Commission on Growth and Development.3 These growth champions succeeded
in sustaining average growth rates of 7 percent per year for over 25 years. South
Africa’s performance is closer to what Hausmann et al. (2004) set out as criteria
3 These countries are Botswana; Brazil; China; Hong Kong, China; Indonesia; Japan; the Republic of
Korea; Malaysia; Malta; Oman; Singapore; Taiwan, China; and Thailand.

Policy Change and Economic Growth: A Case Study of South Africa 15
constituting a “growth acceleration.” Denoting output and growth in period t as
yt and gt respectively, they identify growth accelerations by looking for growth
episodes that satisfy the following conditions:
gt,t+n ≥ 3.5% per year Growth is rapid
∆gt ≥ 2.0% per year Growth accelerates
yt+n ≥ max {yi}, i ≤ t Post‐growth output exceeds pre‐episode peak
where the relevant time horizon for a “growth acceleration” is taken to be 8 years
(that is, n = 7). Since 1994, real GDP growth has averaged 3.6 percent annually
and accelerated by 2.4 percent relative to growth in 1993. In addition, output in
2006 was 60 percent higher than the pre‐1994 peak. These figures suggest
economic recovery in South Africa since 1994 is close to being consistent with the
characteristics of an episode of growth acceleration.4 How did the recovery in the
economy occur?
From 1994, the economy started to grow again as a result of improved
optimism, the new political dispensation, and a series of initial policy reforms.
These were reinforced in the early years of the period with the beginning of a
sustained shift in public spending towards the poor and away from inefficient
subsidies. The macroeconomic and fiscal program announced in 1996 (Growth,
Employment and Redistribution (GEAR)) set out to lower the high inflation (9.7
percent in 1993) and reduce the budget deficit that had reached 7.4 percent. In
subsequent years, the fiscal contraction and lower inflation helped to reduce the
real cost of capital and promoted investment by the private sector. A new
monetary policy framework (inflation targeting) was instituted in 2000, which
helped to anchor inflation at a lower level and to increase the credibility of the
South African Reserve Bank (SARB).
From 2001, low interest rates, achieved via disinflation and a more
sustainable fiscal policy, have contributed to a steady increase in investment
growth rates and heightened activity in key economic sectors, including
construction, financial services, and retail and wholesale trade. Stronger
economic growth supported tax revenue and sustained a consistent rise in public
spending since 2001 on health, education, the built environment, and public
infrastructure. Public sector infrastructure planning and allocations, historically
low inflation and interest rates, and stronger employment and household income
4 While we analyze the growth acceleration in terms of real GDP growth, Hausmann et al. (2004)
determines growth accelerations using growth rates of GDP per capita. Evaluating GDP per capita
growth for South Africa in the post‐1994 era, conditions 2 and 3 are still satisfied since the growth
rate of GDP per capita has increased by 2.6 percent relative to 1993 and GDP per capita exceeds the
pre‐1994 peak of 23,972. However, the first condition is not satisfied since the GDP per capita
growth rate has averaged 1.75 percent since 1994 and would therefore not be considered “rapid.” If
one rather turns to the four‐year acceleration since 2004, we observe that all conditions are satisfied
since GDP per capita growth has averaged 3.7 percent and accelerated by 2.2 percent, and GDP per
capita exceeds the pre‐2004 peak of R 23,972.

16 David Faulkner and Christopher Loewald
prompted a sharp rise in private sector investment and a sense of a sustained rise
in the economy’s long‐term growth prospects. Household consumption has
played an important role in increasing economic growth, as higher incomes,
stronger employment gains, and greater access to credit has both expanded total
income and enabled households to smooth consumption over time.
Strong increases in commodity prices, as part of China’s emergence as an
economic powerhouse and increasing geopolitical risks, further underpinned an
increase in South Africa’s terms of trade. Over the longer term, the real exchange
rate has depreciated by about 20 percent, with considerable volatility during
times of international financial uncertainty such as in 1998 and 2001. The 2001
depreciation of 35 percent was followed by a gradual reversal of the
overshooting. This somewhat stronger currency has helped to lower the cost of
intermediate inputs to production, contributing to higher investment in
manufacturing and other industries.
Poverty and inequality are two fundamental socio‐economic issues facing
post‐Apartheid South Africa. The coexisting high wages and high
unemployment suggests limitations to improvements in the distribution of
income and gains from growth. Measures of poverty and inequality were shown
to rise during the second half of the 1990s (Hoogeveen and Özler, 2006;
Leibbrandt et al., 2005) as the economy experienced relatively low economic
growth and sluggish employment growth. Increasing overall inequality in the
distribution of income has continued and represents the combination of
declining between‐race inequality and rising within‐race inequality. Expanding
within‐race inequality principally reflects improving job and income prospects
for higher‐skilled, higher‐educated individuals as the economy’s structure,
supported by policies such as tariff reform, shifted towards higher‐skilled
activities. Since the turn of the century, headcount poverty has fallen quite
significantly, reflecting the expansion in the social grants system after 2002 (van
der Berg et al., 2005) and faster job creation since 2003 (see table 1).5 The
experience with inequality is consistent with the pattern experienced amongst
countries integrating further with the world economy—the positive impact of
globalization being higher for more highly skilled workers than for others.
Workers in some sectors such as mining and agriculture have been especially
badly affected by structural change in the South African economy, although this
probably has had more to do with the long‐term decline in commodity prices
(prior to 2004) and policy reform in agriculture than globalization.6
5 Headcount poverty, as measured by the share of the population living on less than R 3,000 per
year fell from a high of 52.1 percent in 1996 to 43.2 percent in 2006 (The Presidency, 2007). 6 Reform primarily consisted of the dismantling of the myriad of marketing boards that existed
prior to 1994, some tariff reform, and land reform.

Policy Change and Economic Growth: A Case Study of South Africa 17
Table 1: Labor Market Trends—Participation, Employment, and Unemployment
Official (ILO) classification* Broad classification**
Year Participation Employment Unemployment Participation Unemployment
1995 51.4 43.3 15.6 60.3 28.2
1999 55.4 41.7 24.8 60.6 38.0
2002 56.9 39.6 30.4 68.1 41.9
2003 54.8 39.5 28.0 67.8 41.8
2004 53.8 39.7 26.2 67.3 41.0
2005 56.5 41.4 26.7 67.7 38.8
2006 57.3 42.7 25.5 68.0 37.3
2007 56.5 43.5 23.0 68.0 36.0
Source: October Household Survey (1995, 1999) and the September wave of the Labour Force Survey (2000 onwards), authors calculations.
Notes: All statistics are for population aged 15 to 65 years old.
* The official classification of unemployment is persons aged 15–65 who did not have a job or business in the seven days prior to the survey interview but had looked for work or had taken steps to start a business in the four weeks prior to the interview.
** The broad classification of unemployment includes discouraged work-seekers who are persons who want to work and are available to work but who say that they are not actively looking for work.
3. Potential Output and the Decomposition of
South Africa’s Economic Growth
The transition to a more stable political dispensation helped to turn the
economy’s trajectory around to one of positive and sustained economic growth.
Successive policy reforms and reintegration with the world economy further
provided a supply side boost to the economy and helped to push the average
growth rate higher. Yet while TFP increased, the use of capital and labor seemed
to slow. The estimated rise in the potential growth rate of the economy
moderated.
We use a Hodrick‐Prescott (HP) filter to smooth GDP and estimate trend
output.7 This, along with the actual output in the economy between 1970 and
2007, is shown in figure 4. Table 2 provides a comparison of actual output (real
GDP growth) and estimates of potential output growth for different subperiods.
7 The HP filter derives a trend output such that it minimizes a weighted average of the gap between
actual output, Yt, and trend output, Y*, and the rate of change in trend output, or its smoothness,
over the whole sample period:
where T is the number of observations and λ is the factor determining the smoothness of the trend
(for the quarterly GDP data available, and consistent with other studies, we apply λ = 1,600).

18 David Faulkner and Christopher Loewald
Figure 4: Real GDP (Y) and Trend GDP (Y*) Using the HP Filter, 1970–2007
400,000
500,000
600,000
700,000
800,000
900,000
1,000,000
1,100,000
1,200,000
1,300,000
1970
1972
1974
1976
1978
1980
1982
1984
1986
1988
1990
1992
1994
1996
1998
2000
2002
2004
2006
R m
illio
ns
GDP
GDP*
Year
Table 2: Real GDP Growth and Trend Output in South Africa
Time period Real GDP growth Trend output
1971–84 3.0 2.9
1985–94 0.9 1.1
1995–2000 2.9 2.6
2001–07 4.3 4.2
Potential output provides an indication of the highest level of GDP output
sustainable in the long term. Both figure 4 and table 2 illustrate the slowdown in
potential output, particularly in the final decade of the Apartheid regime, and
the subsequent recovery post‐1994. Du Plessis et al. (2007) calculate that potential
output fell by 30 percent from the mid‐1970s to the mid‐1990s. The rapid decline
in the final decade of Apartheid illustrates the deleterious effects and inherent
constraints imposed by the Apartheid regime, choking off the possibilities for
sustained growth. Furthermore, the lower average rate of actual growth between
1985 and 1994 exacerbates the condemnation of Apartheid economic policy since
the economy was incapable of achieving even this retarded level of growth.
During the first decade of the post‐Apartheid government until 2004, real GDP
growth essentially equaled potential output, implying an increase in potential
output of 4 percent per year. Over the past four years, however, growth has been
in excess of trend growth. This divergence is a concern for policy makers since it
applies strain on economic capacity and places overheating pressures on the
Policy Change and Economic Growth: A Case Study of South Africa 19
economy. Economic policy must continue to focus on implementing the
reforms—largely relating to the microeconomic challenges of market structure
and competition, productivity, tariffs, and pricing issues—necessary in order to
increase potential output and to raise the sustainable level of growth in South
Africa.
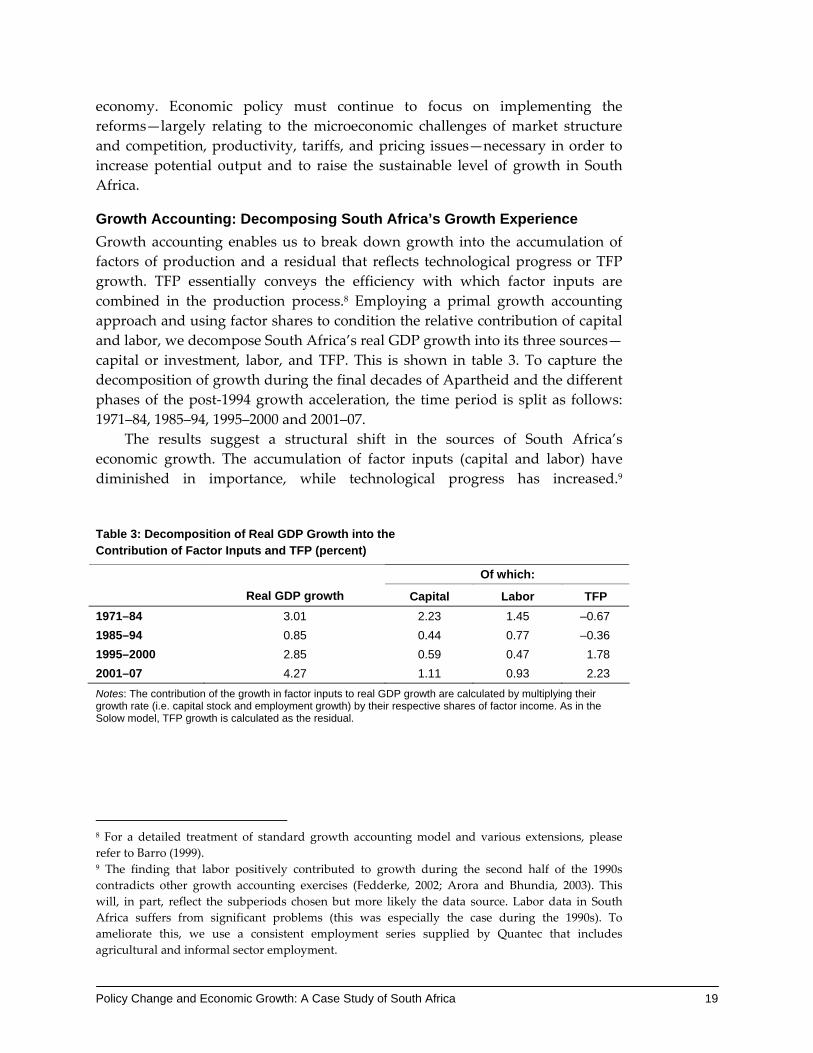
Growth Accounting: Decomposing South Africa’s Growth Experience
Growth accounting enables us to break down growth into the accumulation of
factors of production and a residual that reflects technological progress or TFP
growth. TFP essentially conveys the efficiency with which factor inputs are
combined in the production process.8 Employing a primal growth accounting
approach and using factor shares to condition the relative contribution of capital
and labor, we decompose South Africa’s real GDP growth into its three sources—
capital or investment, labor, and TFP. This is shown in table 3. To capture the
decomposition of growth during the final decades of Apartheid and the different
phases of the post‐1994 growth acceleration, the time period is split as follows:
1971–84, 1985–94, 1995–2000 and 2001–07.
The results suggest a structural shift in the sources of South Africa’s
economic growth. The accumulation of factor inputs (capital and labor) have
diminished in importance, while technological progress has increased.9
Table 3: Decomposition of Real GDP Growth into the Contribution of Factor Inputs and TFP (percent)
Of which:
Real GDP growth Capital Labor TFP
1971–84 3.01 2.23 1.45 –0.67
1985–94 0.85 0.44 0.77 –0.36
1995–2000 2.85 0.59 0.47 1.78
2001–07 4.27 1.11 0.93 2.23
Notes: The contribution of the growth in factor inputs to real GDP growth are calculated by multiplying their growth rate (i.e. capital stock and employment growth) by their respective shares of factor income. As in the Solow model, TFP growth is calculated as the residual.
8 For a detailed treatment of standard growth accounting model and various extensions, please
refer to Barro (1999). 9 The finding that labor positively contributed to growth during the second half of the 1990s
contradicts other growth accounting exercises (Fedderke, 2002; Arora and Bhundia, 2003). This
will, in part, reflect the subperiods chosen but more likely the data source. Labor data in South
Africa suffers from significant problems (this was especially the case during the 1990s). To
ameliorate this, we use a consistent employment series supplied by Quantec that includes
agricultural and informal sector employment.

20 David Faulkner and Christopher Loewald
This outcome seems appropriate given the series of policy and economic shocks
that affected the economy over the long term and accords well with
developments in labor and capital markets. Reintegration with the world
economy and a sustainable democratic constitution have supported the
redevelopment of economic channels that favor the increased access to and feed‐
through of knowledge and an emphasis on productivity as a response to greater
competition. Macroeconomic stability, the historically low inflation, and low
interest rates further augmented TFP growth by facilitating an expansion in
private investment. High inflation and uncertainty in the past likely reduced the
contribution of capital to growth. Inefficient levels of employment caused by
high inflation and real wage disequilibrium would have lowered the marginal
product of labor and then contributed to falling employment levels.
Both factors have the potential to contribute more to growth. Lower inflation
and interest rates will support a rise in the contribution of private sector capital,
further encouraging the crowding‐in effects of public infrastructure investment.
The contribution to growth from labor as a factor of production will rise with
better employment growth, the adjustment of firms to the democratic labor law
framework, lower inflation, and a better balance between real wage growth and
labor productivity.
In the remaining part of the paper, we provide an historical perspective on
economic growth and some of the policies involved in shaping these economic
outcomes.
4. 1970–94: Falling Growth and the
Demise of the Apartheid Economy
Despite averaging economic growth of 3 percent between 1970 and 1984, the
seeds of the Apartheid economy’s demise were sown during this period as
economic performance deteriorated. Rapid expansion of the capital stock (5.2
percent a year on average) reflected an emphasis on extensive economic
development. Growth in TFP was negative. In subsequent years, the Apartheid
system and consequentially limited social base for the economy forestalled the
intensive development of TFP and knowledge‐based deepening of the basic
economic nodes that the extensive approach had put in place. Moreover, by
limiting the participation of the growing black population in economic activity,
the extensive approach also suffered inherent constraints and contradictions—
economies of scale to compete internationally only existed in mining and unit
labor costs soared. The rise in unit labor costs over the period meant that some
sectors of the economy were especially unprepared for the moderate trade
reform and reintegration that occurred after 1993.10
10 Even though this rise in unit labor costs was in itself relatively modest. See discussion below.

Policy Change and Economic Growth: A Case Study of South Africa 21
The Decline of Investment
On average, between 1970 and the early 1980s, investment accounted for more
than 25 percent of GDP, reaching a peak of almost 30 percent in 1976. From the
mid 1980s through to 1993, progressively greater political uncertainty played a
major role in investment decisions, and alongside very high inflation, contributed to
economic stagnation and contraction. By 1993, the share of investment in GDP had
dropped to below 15 percent, resulting in much lower growth rates and
declining GDP per capita, while constraining future growth (see figure 5).11
The critical factor behind the investment peak in 1976 and subsequent
collapse was the behavior of public sector investment including the major state‐
owned enterprises such as Sasol (coal and oil), Iscor (steel), and Eskom
(electricity). Public investment was configured to support the Apartheid regime
and concentrated on supporting economic autarky in energy. Large‐scale
investment, and oversupply in some areas such as electricity, gave way in the
1980s to much slower growth. Government’s share of total investment reached 53
percent in 1976 before approximately halving to 27 percent in 1994. At the time of
transition, the government investment ratio was just 4 percent of GDP. At its
peak in 1976, it had been almost 16 percent of GDP.
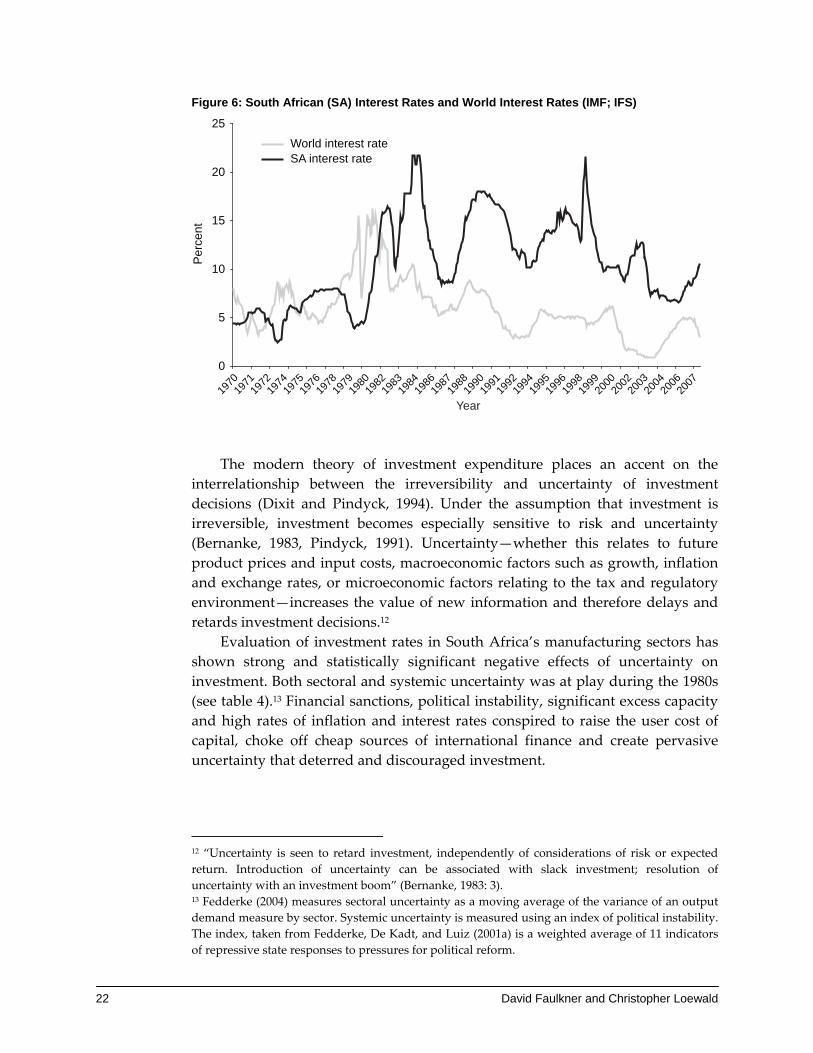
Public sector investment was deterred by the imposition of financial
sanctions that removed state‐owned enterprises’ source of cheap international
finance, forcing them to borrow on the domestic market where interest rates
were much higher (see figure 6). Investment was further discouraged by the
considerable excess capacity generated during the investment surge and made
worse by rising uncertainty.
Figure 5: Total and Private Sector Investment as a Share of GDP, 1970–2007
0
5
10
15
20
25
30
35
1970
1971
1973
1975
1977
1978
1980
1982
1984
1985
1987
1989
1991
1992
1994
1996
1998
1999
2001
2003
2005
2006
Share
of G
DP
(%
)
Investment/GDP
Private investment/GDP
Year
11 The rate of capital accumulation averaged just 0.8 percent per year in the first half of the 1990s.
22 David Faulkner and Christopher Loewald
Figure 6: South African (SA) Interest Rates and World Interest Rates (IMF; IFS)
0
5
10
15
20
25
1970
1971
1972
1974
1975
1976
1978
1979
1980
1982
1983
1984
1986
1987
1988
1990
1991
1992
1994
1995
1996
1998
1999
2000
2002
2003
2004
2006
2007
Perc
ent
World interest rate
SA interest rate
Year
The modern theory of investment expenditure places an accent on the
interrelationship between the irreversibility and uncertainty of investment
decisions (Dixit and Pindyck, 1994). Under the assumption that investment is
irreversible, investment becomes especially sensitive to risk and uncertainty
(Bernanke, 1983, Pindyck, 1991). Uncertainty—whether this relates to future
product prices and input costs, macroeconomic factors such as growth, inflation
and exchange rates, or microeconomic factors relating to the tax and regulatory
environment—increases the value of new information and therefore delays and
retards investment decisions.12
Evaluation of investment rates in South Africa’s manufacturing sectors has
shown strong and statistically significant negative effects of uncertainty on
investment. Both sectoral and systemic uncertainty was at play during the 1980s
(see table 4).13 Financial sanctions, political instability, significant excess capacity
and high rates of inflation and interest rates conspired to raise the user cost of
capital, choke off cheap sources of international finance and create pervasive
uncertainty that deterred and discouraged investment.
12 “Uncertainty is seen to retard investment, independently of considerations of risk or expected
return. Introduction of uncertainty can be associated with slack investment; resolution of
uncertainty with an investment boom” (Bernanke, 1983: 3). 13 Fedderke (2004) measures sectoral uncertainty as a moving average of the variance of an output
demand measure by sector. Systemic uncertainty is measured using an index of political instability.
The index, taken from Fedderke, De Kadt, and Luiz (2001a) is a weighted average of 11 indicators
of repressive state responses to pressures for political reform.

Policy Change and Economic Growth: A Case Study of South Africa 23
Table 4: Standardized Coefficients Determining the Rate of Investment in South Africa
Standardized long-run
coefficients from PMGE
Rate of return on capital 0.30
User cost of capital –0.05
Sectoral uncertainty –0.09
Systemic uncertainty –0.51
Source: Fedderke, 2004.
The Slowdown in Employment Growth
As growth in the capital stock slowed, so too did employment growth. Economic
growth became labor saving with the rate of employment growth slowing from
the early 1970s. Employment growth weakened from 2.8 percent in the 1970s to 2
percent in the 1980s and registered an average rate of growth of just 0.67 percent
between 1990 and 1993 (see figure 7).
Greater employment raises economic output not only today—through
increasing income, consumption, and therefore demand—but also in the future
by ensuring that the economy’s workforce acquires the skills and assets needed
to be productive and drive the economy forward. Since the 1970s, and
abstracting away from the trend over the past four years, labor has accounted for
a diminishing share of South Africa’s growth—see table 3. Some decompositions
of growth estimate that labor subtracted from growth in the 1990s.14
Figure 7: Total Employment and Employment Growth, 1970–2007
0
2,000
4,000
6,000
8,000
10,000
12,000
14,000
16,000
18,000
20,000
1970 1974 1978 1982 1986 1990 1994 1998 2002 2006
Th
ou
sa
nd
s e
mp
loye
d
–2
–1
0
1
2
3
4
5
Pe
rce
nt
Labor force
Total employment
Employment growth (rhs)
Year Source: Quantec.
14 Arora and Bhundia (2003) estimate that labor made a −0.9 percentage point contribution to
economic growth between 1994 and 2001. Fedderke (2002) estimates labor made a
−0.58 percentage point contribution to economic growth in the 1990s.

24 David Faulkner and Christopher Loewald
Output growth and real wages are the conventional determinants of
employment growth in a market economy. However, South Africa’s unique
history of race‐based discrimination has shaped the functioning of the labor
market and created a structural element to the employment conundrum,
especially with regard to the role of trade unions and skills levels for African
workers. The spatial distortions that were an integral part of that system also
have a nearly permanent effect on the supply cost of labor.
Information asymmetries also appear to play a major role in driving up the
supply cost of labor. Observed reservation wages tend to be very high, and
indeed higher than predicted wages. Table 5 shows the ratio of reservation
wages to predicted wages by characteristics of respondents in the 1994 October
Household Survey (OHS) and the 1993 Southern Africa Labor and Development
Research Unit (SALDRU) surveys, as calculated by Kingdon and Knight (2001).
Differences in the ratio appear to reflect the larger impact of deficient
information for people with less experience, education, and age.
Higher real wages lower the demand for labor in South Africa, with wage
elasticities ranging from 0.3 for high‐skilled labor to about 1 for less‐skilled
labor.15 In part, the slowing rate of employment growth since the early 1980s
reflects the rapid growth in real wages that accompanied the expansion in
unionization after the restrictions imposed on unions were lifted in 1979. In
addition to the stronger position of unions, increasing focus on real wage
bargaining in this period was also a reaction to higher inflation, which would
have undermined real income levels if nominal wage growth had not keep pace.
Table 5: Reservation Wages Relative to Predicted Wages
Type of worker Ratio of reservation wage
to predicted wage
Female 1.16 Male 1.13 African 1.27 Non-African 0.81 Low education (< 7 years schooling) 1.30 High education (> 7 years schooling) 1.04 Young (< 30 years old) 1.18 Old (> 30 years old) 1.12 Ever worked before 1.02 Never worked before 1.23 Urban homeland 0.98 Rural homeland 1.37 Urban non-homeland 1.04 Rural non-homeland 1.12
Source: Kingdon and Knight, 2001.
15 The impact of real wages on employment has been considered in a number of studies (for
example, Fallon and Lucas, 1998; Fields et al. 1999; Fedderke and Marriotti, 2002).

Policy Change and Economic Growth: A Case Study of South Africa 25
Apartheid’s active de‐skilling of workers and the extensive nature of
development further cut off the economy’s potential by limiting improvements
to labor productivity that might have kept unit labor costs stable. As real wages
rose faster than labor productivity, South African firms experienced a 38 percent
increase in unit labor costs. The trends in these interrelated variables between
1970 and 1994 are shown in figure 8.
The rise in unit labor costs was especially detrimental to South Africa’s
international competitiveness and contributed to the appreciation in the real
effective exchange rate experienced between 1986 and 1993. South Africa’s unit
labor costs in manufacturing over the period 1990–94 were, on average, 59
percent higher than a sample of 11 emerging market economies.16
Import Substitution and Disappointing Export Performance
The worsening competitiveness of exporters due to adverse unit labor cost growth
was further weakened by import‐substitution policies and trade sanctions. Over the
period 1970 to 1984, the value of exports did not change while export volumes
grew by a mere 13 percent. This compares to growth in the volume of world
trade over the same period of 70 percent. In per capita terms, exports fell by over
20 percent. The recovery since 1991 is evidenced in the marked upward trends in
both real exports and real exports per capita, shown in figure 9.17
Figure 8: Real Producer Wages, Labor Productivity, Unit Labor Costs, and the Real Effective Exchange Rate—1970–94
40
50
60
70
80
90
100
110
120
1970
1971
1973
1974
1976
1977
1979
1980
1982
1983
1985
1986
1988
1989
1991
1992
1994
Index v
alu
e (
2000=
100)
0
20
40
60
80
100
120
140
160
180
RE
ER
(2000=
100)
Labor productivity
Unit labor costs
Nominal wage adj. for ppi
Real effective exchange
rate (rhs)
Year Source: South African Reserve Bank Quarterly Bulletin.
16 Golub and Edwards (2003) use a sample of developing and emerging markets, including Chile;
Hungary; Hong Kong, China; India; Korea; Mauritius; Mexico; Poland; Turkey; Singapore; and
Zimbabwe. 17 Since 1994, exports per capita and exports have surged by 38 percent and 72 percent respectively.

26 David Faulkner and Christopher Loewald
Figure 9: Exports and Exports per Capita, 1970–2007 (constant 2000 prices)
0
50,000
100,000
150,000
200,000
250,000
300,000
350,000
400,000
1970 1974 1978 1982 1986 1990 1994 1998 2002 2006
Ra
nd
(m
illio
n)
0
1,000
2,000
3,000
4,000
5,000
6,000
7,000
8,000
Ra
nd
Exports
Exports per capita
Year Source: South African Reserve Bank Quarterly Bulletin.
Trade policy directed toward import substitution through high tariff
barriers, foreign disinvestment, and financial and economic sanctions together
provided a fertile environment for structural constraints to develop in the form
of high market concentration, low firm creation, and the control of key sectors by
large and inefficient parastatals. Market concentration was high and rising under
the Apartheid regime. Between 1972 and 1996, the proportion of manufacturing
output contributed by the largest 5 percent of firms exceeded 50 percent for all
manufacturing sectors.18 The post‐Apartheid government inherited over 300
state‐owned enterprises in 1994, dominated by the parastatals operating in the
electricity (Eskom), transport (Transnet), telecommunications (Telkom), and
defense (Denel) sectors. The degree of ownership concentration was significant;
“the top six conglomerates controlled companies accounting for 85.7 percent of
the market capitalization of the Johannesburg Stock Exchange (JSE)” (Lewis,
1995: 149). The South African economy exhibited little internal competition and
was characterized by inefficiency and poor incentives to innovate and improve
productivity.
Under a barrage of economic and trade sanctions, political instability, and
damaging micro‐ and macroeconomic policy, the South African economy
stagnated during the final decade of Apartheid, eventually contracting by 5
percent in the early 1990s.19 On a per capita basis, the economic damage was
catastrophic, with per capita GDP falling 16 percent between 1981 and 1993.
18 Fedderke and Szalontai (2005) illustrate that higher market concentration predicts lower growth,
higher unit relative labor costs, and lower labor productivity, which emphasizes the detrimental
effects of high market concentration. 19 SARB records the period from March 1989 to May 1993 as the longest downswing experienced
since 1945.

Policy Change and Economic Growth: A Case Study of South Africa 27
5. 1994 to Present: Democracy,
Macroeconomic Stability, and Growth
Economic Policy Developments: RDP and GEAR
In 1994, the first democratic government faced the enormous political and
societal task of transforming South Africa from a nation that only knew
segregation, marginalization, and exclusion to one based on cohesion, inclusion,
and opportunity. The economic challenges were equally daunting. The inherited
economic environment was precarious, suffering from both short‐term crises and
long‐term structural weaknesses manifested in the variable and, on average,
declining economic growth of the previous decade.
In the short term, South Africa faced a myriad of difficulties including the
aftereffects of a severe drought in 1992, a global economic recession, domestic
political strife, economic policy uncertainty, a distinct absence of foreign
exchange (reserves could not even cover a week’s worth of imports), and
massive outflows of currency (Naidoo, 2007). Fiscal laxity had left the public
finances in a parlous state with a budget deficit of 9.5 percent of GDP recorded in
1992/93.20 Profligate public expenditure exacerbated the excessively
accommodative monetary policy stance prior to 1994, which contributed to high
levels of inflation.21
These short‐term issues were indicative of crisis times. More ominously,
long‐term structural problems pointed to serious underlying weaknesses
undermining aspirations for improved economic performance. Investment and
employment were in long‐term structural decline, high tariff barriers had
cultivated large and inefficient monopolies, and the education system, after
decades of neglect, was producing a labor force inappropriately equipped for the
economic needs of the country. The national budget, the state machinery, and the
industrial sector were thus geared not towards growth and meeting the
developmental challenges that confronted the new government, but rather
towards sustaining the Apartheid system.
The new government chose to focus policy on political, economic, and social
consolidation. From an economic perspective, the priority was to restore South
Africa’s economic and fiscal health and therefore provide the platform for robust
growth. The government’s inaugural approach to economic policy was demand‐
driven under the auspices of the Reconstruction and Development Programme
(RDP). The RDP reprioritized spending towards social development, and was
predicated on the key mandates of meeting basic needs, developing human
resources, building the economy, and democratizing state and society.
Concomitantly, the RDP advocated prudent fiscal policy through tax reform, the
20 This includes the deficits of the Bantustans. 21 Between 1985 and 1994, CPI inflation averaged 14.1 percent and interest rates averaged 14.5
percent.

28 David Faulkner and Christopher Loewald
consolidation of debt, and the cutting of debt service costs that were
undermining the new government’s economic and social objectives.22
While much progress towards reconstructing the public finances was made
during the RDP, achievements with regards to the social objectives were limited.
Insufficient growth precludes feasible social investment and thus economic
policy evolved to place an accent on the role of economic growth. Augmenting
this, greater certainty was necessary with respect to the major macroeconomic
variables that determine long‐run investment decisions, such as inflation, interest
rates, and tax rates. To address these problems, the RDP was supplemented in
1996 with the GEAR strategy, which set out a framework for attaining
macroeconomic stability as a basis for economic growth. The strategy focused on
accelerating fiscal reform (including a faster fiscal deficit reduction program to
contain debt service obligations), further tariff reform, public sector restructuring
(including the disposal of nonstrategic assets), continued reorientation of
expenditure towards service delivery to the poor, and more consistent monetary
policy (in order to prevent a resurgence of inflation).23
Macroeconomic Stability, Providing the Framework for Growth
Under the auspices of GEAR, macroeconomic stability became a core objective of
economic policy making. Prudent fiscal policy lowered the size of the budget
deficit to 2.3 percent of GDP in 2003/04, consolidated debt, and cut debt service
costs to 3.6 percent of GDP. This fiscal consolidation supported the introduction
of inflation targeting, established in 2001, as a framework for monetary policy.
Institutional change provided the SARB with constitutional independence to
pursue an inflation target of 3–6 percent for CPIX inflation (CPI excluding
mortgage interest repayments). The inflation targeting regime has anchored
inflation expectations in the economy and guided inflation to low levels and
interest rates to historical lows—see figure 10. Trade liberalization and public
sector restructuring that included wage restraint also helped to contain domestic
prices and lower inflation.24
22 Building on the recommendations and proposals of the Katz Commission, tax reform efforts were
initially directed towards establishing an efficient tax collection system and broadening the tax
base. 23 In April 1996, CPI inflation had fallen to below 6 percent from 11 percent in April 1995. 24 Aron and Muellbauer (2007) emphasize the important role South Africa’s trade reform and
growing openness played in lowering inflation in the economy.

Policy Change and Economic Growth: A Case Study of South Africa 29
Figure 10: Consumer Price Inflation and Discount Interest Rates, 1970–2007
0
5
10
15
20
25
1970
1971
1973
1975
1977
1979
1981
1983
1985
1987
1989
1991
1993
1994
1996
1998
2000
2002
2004
2006
Pe
rce
nt
Interest rate
CPI
Year Source: International Financial Statistics (IMF).
Using a Taylor chart, which compares the variability of output with the
variability of inflation over time, we can illustrate the macroeconomic stability
achieved in South Africa. Figure 11 compares South Africa’s inflation and output
variability over the past decade with other emerging market economies.25 It also
compares the inflation and output variability for three subperiods of interest—
1985–94, 1995–2000, and 2001–06. South Africa’s proximity to the origin
emphasizes the macroeconomic stability that has been both a focus of economic
policy and a major achievement of the National Treasury and the Reserve Bank.
The disaggregation into subperiods illustrates the marginally higher level of
inflation variability since 2001, which was heavily influenced by the depreciation
of the currency in 2002, and the significant variability of output in the 10 years
prior to democracy. Figure 12 compares the same measure of inflation and
output variability over the last 10 years for South Africa, Canada, the Eurozone,
France, Germany, Italy, the United Kingdom, and the United States. It illustrates
that South Africa’s macroeconomic stability also compares well against this
group of developed economies.
25 Here, variability is calculated as the standard deviation divided by the mean for the 40 quarters
up to the first quarter of 2006.

30 David Faulkner and Christopher Loewald
Figure 11: Macroeconomic Stability across Emerging Markets in the Last 10 Years
0
0.5
1
1.5
2
2.5
3
0 0.2 0.4 0.6 0.8 1 1.2 1.4 1.6 1.8 2
Inflation variability
Ou
tpu
t va
ria
bili
ty
RSA
Argentina
MexicoChile
Korea
Jordan
TurkeyIndonesia
HungaryRSA (2001–06)
RSA (1995–
2000)
RSA (1985–1994)
Source: Du Plessis, Smit, and Sturzenegger (2007, p.3) and authors’ calculations.
Figure 12: Macroeconomic Stability—South Africa and G7 Countries in Last 10 Years
0
0.2
0.4
0.6
0.8
1.0
0 0.2 0.4 0.6 0.8 1.0
Inflation variability
Ou
tpu
t va
ria
bili
ty
South Africa
Canada
FranceUnited Kingdom
ItalyGermany
United
States
Eurozone (12)
Source: International Financial Statistics (IMF), International Key Macroeconomic Indicators (Global Insight), and authors’ calculations.

Policy Change and Economic Growth: A Case Study of South Africa 31
Figure 13: Weekly Country Risk Spread in South Africa (EMBI SA), 1998–2007
0
100
200
300
400
500
600
700
800
900
1,000
1997
1998
1999
2000
2001
2002
2003
2004
2005
2006
2007
0
10
20
30
40
50
60
70
80
90
EMBI_SA
EMBI_EME
EMBI_SA:EMBI_EME ratio (rhs)
Pe
rce
nt
EM
BI
Year Source: Bloomberg.
Macroeconomic stability has helped to improve the country’s risk rating and
country risk spread in South Africa—see figure 13. South Africa’s country risk
spread fell more quickly than that observed for emerging markets in general over
most of the period as illustrated by the considerable decline in the ratio of the
South African Emerging Market Bond Index (EMBI) to the emerging market
EMBI. Most of the decline reflected improvements in fiscal indicators—for
example, declining budget deficits, debt levels, and debt service costs—and more
widely the macroeconomic stability achieved under GEAR.26 The lower
borrowing cost and falling risk rating has helped to mitigate the external
vulnerability associated with the economy’s reliance on foreign capital flows,
enabling a faster pace of growth for a given level of the current account deficit.
Macroeconomic stability has been a key factor in encouraging foreign
capital, stimulating more investment, innovation, technological progress, and
growth in TFP. The trend in economic growth reversed itself relatively quickly,
although some factors of production continued to be inhibited by the
accumulated constraints of previous decades. This was especially true in the
labor market, where job shedding continued in mining and agriculture until
2000. Employment in secondary sectors remained moribund. Significant
26 From 2005, South Africa’s EMBI reached a plateau at a historically low level below 100 points.
The continued falls in the emerging market EMBI thereafter explain why the ratio rises later in the
period.

32 David Faulkner and Christopher Loewald
expansions in employment occurred in the wholesale and retail trade sector, and
later the finance, real estate, and construction sectors. Robust employment
growth also occurred in areas where labor contracts could be made more flexible.
Overall, however, in the 1990s, the contribution of labor continued to decline,
reflecting slow employment creation in the face of both high labor costs and the
shift in the structure of the economy. Within this climate of policy change,
productivity gains were particularly important, accounting for about 60 percent
of economic growth between 1995 and 2000.
After a period of subpar growth in the wake of the Asian financial crisis in
1998, growth accelerated once again in 2000. Since September 1999, the economy
has enjoyed 35 consecutive quarters of economic growth, an unrivalled period of
expansion in South Africa’s post–World War II economic history. GDP growth
has averaged 4.3 percent, largely driven by strong TFP growth, which
contributed 2.5 percentage points to growth. Employment growth has remained
relatively slow but the average for the period masks the recent improvement
with employment growing by an average of 3.7 percent between 2004 and 2007.27
Investment Begins to Recover
The peaceful and stable transition to democracy combined with the removal of
sanctions dramatically reduced political instability, reversed investor sentiment
at a basic level, and alleviated the systemic uncertainty previously pervasive in
the South African economy.28 Given the pivotal role played by uncertainty for
investment in South Africa (Fedderke, 2004; Fedderke and Luiz, 2006), these
developments were critical for the recovery of investment. Macroeconomic
stability and other policy reforms contributed to the more benign inflation
climate, helped lower uncertainty, and encouraged a marginal acceleration in
capital accumulation between 1995 and 2000. Subsequently, low interest rates,
achieved via disinflation and the more sustainable fiscal stance, contributed to a
steady increase in investment growth rates and a growing contribution of capital
to economic growth. Fixed capital formation (as a percentage of GDP) exceeded
20 percent in the first half of 2007, its highest level since the early 1980s.
In sustaining macroeconomic stability as the overriding objective of
economic policy, the government emphasized reducing the uncertainty that had
previously undermined investment.29 From a position of public sector dominance
27 If one were to disaggregate the growth periods further, and consider the 2004–07 period where
South Africa has averaged growth of 5.1 percent per year, the growth decomposition would show
that growth in factor inputs (capital, 1.5 percentage points; labor 1.6 percentage points) actually
contributed more than TFP growth (1.9 percentage points) to overall economic growth. 28 This is evidenced in the dramatic fall exhibited by the political instability index (Fedderke et al.,
2001a) during the early 1990s. 29 Pindyck (1991) argues that policy reforms that provide an enabling environment for investment,
rather than tax incentives and interest rates, may be the more important policy reforms
government can adopt. “This latter point follows from Ingersoll and Ross (1988) who show that for
long‐lived projects, a decrease in interest rates for all future periods may not accelerate investment.

Policy Change and Economic Growth: A Case Study of South Africa 33
in the late 1970s, investment in South Africa is now primarily conducted by the
private sector. In 2007, gross fixed capital formation by government and public
corporations accounted for only 13 percent and 14 percent of total fixed
investment respectively.
Private sector fixed capital formation is strongly correlated to output trends,
the real rate of return, the real after‐tax cost of capital, and, as previously
emphasized, uncertainty. The fiscal contraction of the early years of the new
government helped to reduce the cost of capital and lowered the hurdle rate of
viable private investment projects and was therefore growth‐oriented. The
private sector has been the driving force for capital formation, explaining three‐
quarters of investment since the turn of the century; however, public capital has
played an increasingly influential role through the provision of infrastructure.30
Infrastructure expenditure raises an economy’s growth potential through
two channels: the direct channel—as an additional factor of production—and the
indirect channel through increasing the productivity of private investment. There
has been significant empirical support for the growth‐enhancing effects of
infrastructure expenditure (Aschauer, 1989; Calderón and Servén, 2004) with the
direct channel receiving particularly strong support within South Africa
(Fedderke et al., 2006; Bogetić and Fedderke, 2006; Fourie, 2006; Kulratne, 2006).
Evidence shows that the positive direct impact of infrastructure investment on
growth increases once institutional factors such as property rights and political
stability are considered (Fedderke et al., 2006). This further supports the potential
economic benefits of government’s emphasis on infrastructure investment given
the institutional stability associated with post‐Apartheid South Africa.
From 2001, when the cost of capital had fallen sharply, government picked
up the pace of expenditure on key infrastructure investments, the renewal of
telecommunications and transport networks, and energy production systems
that would crowd‐in, complement, and raise the efficiency of private sector
investment.31 Real public expenditure on infrastructure in South Africa, in both
per capita terms and as a share of GDP, reached a 40‐year low in 2001. Since
2002, infrastructure investment has expanded rapidly, growing at an annual rate
of 12.4 percent in per capita terms—see figure 14.
Such a change also lowers the cost of waiting and thus can have an ambiguous effect on
investment. This suggests that the level of interest rates may be of only secondary importance as a
determinant of aggregate investment spending; interest volatility may be more important”
(Pindyck 1991: 45). 30 Within this context, the type of infrastructure we are concerned with is economic infrastructure—
such as transport infrastructure, energy generation, telecommunications, sanitation, and water—
rather than social infrastructure that is most easily associated with education and health services. 31 Since 2001, infrastructure investment by government and public corporations has risen at an
average rate of 7 percent and 16 percent per year respectively.

34 David Faulkner and Christopher Loewald
Figure 14: Per Capita Infrastructure Investment, Infrastructure Capital Stock, and GDP
40
60
80
100
120
140
160
1970
1972
1974
1976
1978
1980
1982
1984
1986
1988
1990
1992
1994
1996
1998
2000
2002
2004
2006
Index (
1970=
100)
Infrastructural fixed capital stock
Infrastructural investment
GDP
Year Source: South African Reserve Bank Quarterly Bulletin.
The role and importance of public sector infrastructural investment will
continue to be critical for future growth. Infrastructure was identified as a
binding constraint within the current economic policy framework—the
Accelerated and Shared Growth Initiative for South Africa in (ASGISA)—and
therefore addressing current inadequacies will be important. Greater emphasis
by the National Treasury on fixed investment expenditure relative to current
expenditure and improving the quality and efficiency of government’s fixed
investment programs have been, and will continue to be, central objectives in the
effort to increase the growth rate of the economy.32
Within this context, recent disruptions to South Africa’s electricity supply
experienced during 2008 and issues regarding underlying generation capacity
are significant policy concerns for government. The development of these
problems reflects a combination of increasing electricity demand as growth
accelerated from 2004, fixed generation capacity since the mid‐1980s, and
disrupted supply reflecting poor maintenance of the existing electricity grid. This
is largely a pricing issue whereby Eskom’s electricity is significantly cheaper than
it should be and one of the cheapest sources of power in the world. Indeed, in
real terms, the average industrial electricity price has fallen by 40 percent
between 1987 and 2004. Government is addressing the underlying determinants
of current supply disruptions through advocating price increases, supporting the
funding of Eskomʹs build program that will expand generation capacity, and
32 This infrastructure focus in public investment was evident in Budget 2008, where infrastructure
expenditure by government and public corporations was projected at R 568.1 billion over the
medium‐term period (2008/09 to 2010/11), equivalent to 7.5 percent of forecast GDP.

Policy Change and Economic Growth: A Case Study of South Africa 35
through offering tax incentives to demand side management (DSM) policies and
energy efficiency improvements (National Treasury, 2008).33
The Dichotomy between Domestic Savings and Investment
The savings‐investment relationship is a basic building block of macroeconomic
theory and high domestic savings appears to have been critical to finance large
increases in investment in high‐growth countries.34 The relatively low level of
domestic savings in the South African economy is a potential structural constraint
to future growth and a particular concern for policy making in South Africa.
Declining rates of household saving in the 1990s were largely associated
with the effects of financial liberalization (Aron and Muellbauer, 2000), which
contributed strongly to the significant rise in the consumption‐to‐income ratio.
Expanding household wealth as a result of rising asset values, particularly house
prices, and the decline in the interest rate from 1998 augmented the effects of
financial liberalization on declining household saving (Romm, 2005). In addition,
the stable political transition to democracy not only reduced uncertainty,
lowering the precautionary motivation for saving, but raised incomes and access
to finance through the enfranchisement of previously disadvantaged groups and
the emergence of a black middle class. The black share of the higher middle class
is estimated to have doubled between 1994 and 2004 (van der Berg et al., 2005).
More recently, high levels of household credit extension have been reflected in
household net dissaving since 2006. Despite a relatively stable corporate profit
share, corporate saving behavior has experienced a significant fall since 1995 as
dividend distributions have grown and taken a larger share of corporate
income.35
The trends in household, corporate and government saving are fairly
distinct. Prior to 1993, it was falling government saving that was responsible for
the decline in domestic saving. Government dissaving peaked in 1993 as the
fiscal discipline imposed under the RDP and subsequently GEAR improved the
fiscal balance. From 2005, the fiscal stance more directly aimed at making
government a net saver, which it achieved in 2006 and 2007. In contrast,
household and corporate saving has declined sharply since the early 1990s—see
figure 15.
33 National Treasury allocated R 60 billion toward the Eskom capacity build program over the
three‐year medium‐term expenditure framework (MTEF) and R 2 billion in terms of tax incentives
for DSM and energy efficiency. 34 Within this context, “high” savings translates to at least 25 percent of GDP. 35 This is, in part, likely to reflect not only falling real rates of interest as inflation declined under
inflation targeting but also the availability of cheap sources of capital globally. Inflation dynamics
have played an important role in determining corporate saving in South Africa. Aron and
Muellbauer (2001) show that high inflation and interest rates, especially within the context of
financial sanctions, made access to external funds difficult and encouraged the internal use of
funds during the 1970s and 1980s. As inflation began to decline in the 1990s, corporate saving was
supported by higher real rates of interest.
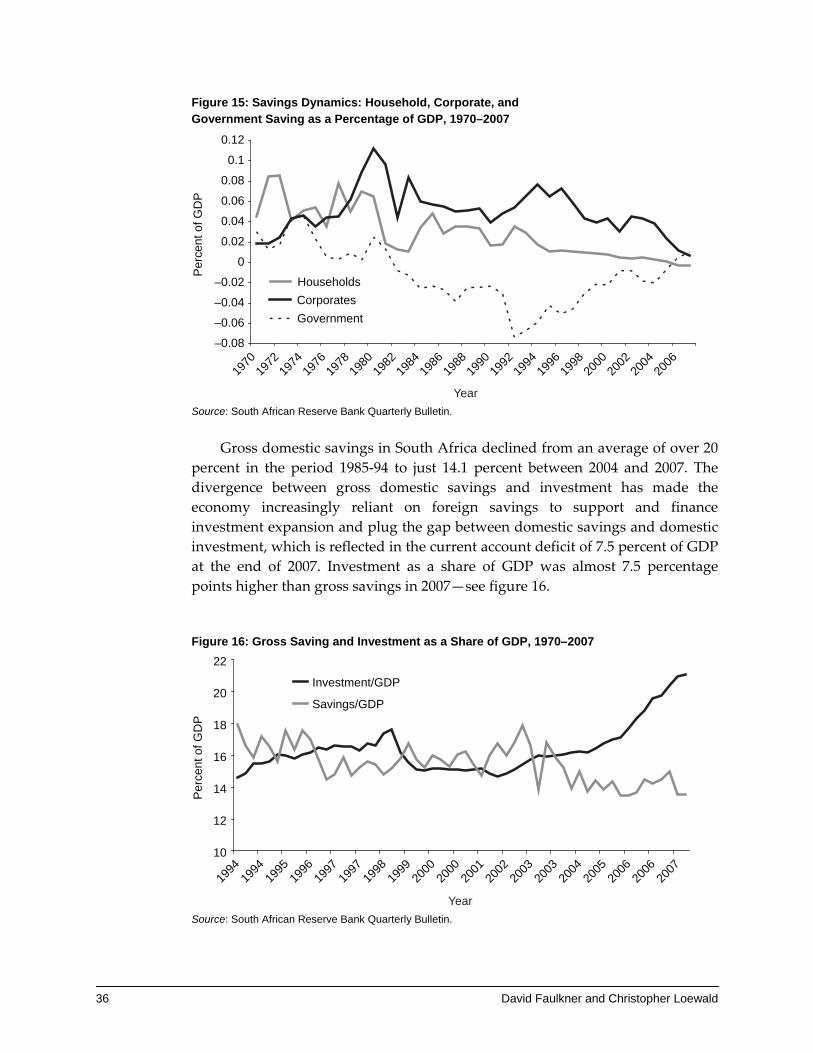
36 David Faulkner and Christopher Loewald
Figure 15: Savings Dynamics: Household, Corporate, and Government Saving as a Percentage of GDP, 1970–2007
–0.08
–0.06
–0.04
–0.02
0
0.02
0.04
0.06
0.08
0.1
0.12
1970
1972
1974
1976
1978
1980
1982
1984
1986
1988
1990
1992
1994
1996
1998
2000
2002
2004
2006
Perc
ent
of
GD
P
Households
Corporates
Government
Year Source: South African Reserve Bank Quarterly Bulletin.
Gross domestic savings in South Africa declined from an average of over 20
percent in the period 1985‐94 to just 14.1 percent between 2004 and 2007. The
divergence between gross domestic savings and investment has made the
economy increasingly reliant on foreign savings to support and finance
investment expansion and plug the gap between domestic savings and domestic
investment, which is reflected in the current account deficit of 7.5 percent of GDP
at the end of 2007. Investment as a share of GDP was almost 7.5 percentage
points higher than gross savings in 2007—see figure 16.
Figure 16: Gross Saving and Investment as a Share of GDP, 1970–2007
10
12
14
16
18
20
22
1994
1994
1995
1996
1997
1997
1998
1999
2000
2000
2001
2002
2003
2003
2004
2005
2006
2006
2007
Perc
ent of G
DP
Investment/GDP
Savings/GDP
Year Source: South African Reserve Bank Quarterly Bulletin.

Policy Change and Economic Growth: A Case Study of South Africa 37
South Africa’s reliance on foreign capital flows to finance the growing gap
between savings and investment helps to stimulate growth but risks a reversal in
foreign capital. In an effort to offset that risk, policy was adjusted to build up a
level of foreign exchange reserves to improve the national “balance sheet.” The
stock of foreign reserves has increased over the past 10 years from a negative net
position of US$22.5 billion in 1998 to a positive gross reserve position of US$33
billion in December 2007.
Trade Liberalization, the Real Effective Exchange Rate, and Exports
Foreign capital flows will continue to be an important source of foreign currency
in the short term. From a long‐term perspective, however, South Africa’s growth
path will be influenced by the country’s ability to expand exports in
manufactured goods and services. Exports enable firms to diversify away from
the uncertainties, fluctuations, and vagaries of the domestic business cycle and
provide a long‐term source of foreign exchange to finance imports. Export
orientation may also boost productivity growth through learning and
demonstration effects, and increased specialization.
Sanctions and South Africa’s own effort to develop import‐competing
industries, however, led to widespread import substitution and high taxes on
exports. A significant phasing down of tariffs after 1994 as part of the Uruguay
Round helped to increase exports and openness more generally, with less
achieved since 2001. Most of what has occurred since 2001 was part of the tariff
phase down scheduled in the agreement with the European Union, which
accounts for about 40 percent of total imports to South Africa. Exports and
imports as a ratio to GDP grew sharply in the wake of tariff liberalization (by
about 10 percentage points of GDP for each), and then moderated after 2000—see
figure 17. Openness has fluctuated around 60 percent of GDP in recent years.
Figure 17: Share of Imports and Exports in GDP
15
17
19
21
23
25
27
29
31
33
35
1990
1991
1992
1993
1994
1995
1996
1997
1998
1999
2000
2001
2002
2003
2004
2005
2006
2007
Pe
rce
nt
GD
P
Exports
Imports
Year Source: South African Reserve Bank Quarterly Bulletin.

38 David Faulkner and Christopher Loewald
Repeated analyses of the impact of tariff reform have nearly all agreed with
the perspective set out recently by Edwards and Lawrence (2006) that trade
policy reform during the 1990s cut tariff collection revenues and boosted the
competitiveness of exporters by reducing effective rates of protection in the
economy (figure 18).36 Tariff liberalization has been good for the economy,
investment and employment on a net economic basis.37 Export orientation is
higher (by well over 100 percent) in a wide range of smaller manufacturing
sectors. Between 1991 and 2001, the volumes of imports and exports of goods
and services increased by 73 percent and 70 percent respectively. While gold
export volumes continued to decline—they dropped by 30 percent over the
decade—exports of other commodities increased by 50 percent and non‐
commodity exports increased by about 200 percent.
Yet despite this radical improvement, South African exports grew more
slowly than exports in the rest of the world. As Edwards and Golub point out,
South Africa’s exports increased by 1 to 2 percent annually in constant dollar
terms, whereas world trade grew by 5 percent annually. Other developing
countries showed far better export growth rates—see table 7. Sluggish exports
have been especially noticeable in sectors thought to have a comparative
advantage and those where tariff protection and industrial subsidies have
continued to be high. Import orientation increased strongly, and has risen most
in the most protected sectors (wearing apparel, footwear) and in sectors strong in
exports (basic iron and steel, non‐metallic minerals, metal products).38
Figure 18: GDP-Weighted Effective Rates of Protection (ERPs) by End-Use and Section, 2006
–5
0
5
10
15
20
25
30
35
40
45
All sectors Agriculture Mining Manufacturing Services
Perc
ent
ERP final goods
ERP inputs
ERP average
Sector Source: Edwards and Lawrence, 2006.
36 Tariff collection revenues as a percentage of the value of imports fell from 11 percent in 1989 to
about 4 percent in 1998 whereas the import‐weighted effective rate of protection dropped
considerably from 35.8 percent in 1989 to approximately 14 percent in 2000. 37 See, for instance, Dunne and Edwards (2007). 38 The latter likely due to rising intra‐industry trade and specialisation.

Policy Change and Economic Growth: A Case Study of South Africa 39
Table 7: Annual Average Growth Rates in Exports by Technology Category, 1988–2002
Category World Developed Developing South Africa
Resources group
Total exports 6.02 4.96 9.58 2.02 6.14
Primary products 3.59 2.79 4.95 –1.14 4.18
Total manufactures 6.32 5.13 10.63 6.91 7.72
Resource based 4.89 4.09 7.89 4.26 5.63
Pure manufactures 6.59 5.33 11.13 8.57 9.52
Low tech 5.63 4.37 7.94 5.57 8.57
Medium tech 5.67 4.77 11.07 9.67 8.51
High tech 9.1 7.14 15.83 11.53 14.95
Source: Edwards and Alves, 2006.
High effective protection appears to be a strong indicator of weaker export
performance, particularly in clothing, footwear, leather products, and textiles,
which have effective rates of protection on final goods well in excess of 100
percent.39 The manufacturing sectors that have performed best in terms of
exports have been the ones liberalized the most, with the lowest rates of effective
protection (Fedderke and Vaze, 2001). This implies that tariff liberalization may
have encouraged efficiency gains within these sectors, which subsequently
enabled the improved export performance. One source of good export
performance has been in automobiles, although there has been a net decline in
employment in vehicle assembly.40 The industry has been extensively
restructured, with a major reform of the system of subsidies and tariffs that had,
prior to 1994, resulted in numerous small product lines. The Motor Vehicle
Industry Development Programme (MIDP) cut tariffs, switched from production
to investment and export subsidies, and set review and termination dates. The
latter have not been applied and the export subsidies raised may be reviewed by
the World Trade Organization (WTO). The program continues to be expensive in
terms of automobile costs, representing a redistribution of surplus from
consumers to mostly foreign‐owned automakers.41
39 The effective rate of protection is the percentage by which a country’s trade barriers increase the
value added per unit of output, taking into account that both input and output tariffs affect an
industry’s value added. 40 Edwards and Alves (2006) report that the largest observed expansion in medium technology
exports was experienced in automobiles, which grew at 21.7 percent per year, assisted through the
Motor Industry Development Programme (MIDP) that provides export credits. The share of
automobile exports in manufacturing exports increased from 2 percent to 14 percent between 1988
and 2002. In 2002, automobile exports constituted 7 percent of South Africa’s total exports. 41 Tariffs remain at about 32 percent for fully built‐up vehicles, and a rebate system (itself valued
according to exports of vehicles and some components) enables automakers to capture the full
difference between tariff‐inclusive price and production plus transport costs.

40 David Faulkner and Christopher Loewald
The rise in imports should be seen as a major economic efficiency gain, and
has been reflected in rising productivity (Jonsson and Subramanian, 2001;
Harding and Rattsø, 2005). But it also continued to reflect a shift towards more
capital‐intensity of production and greater demand for more highly skilled
workers. This has worsened the prospects for real income growth for less‐skilled
workers in sectors unable to raise productivity and the employment
opportunities for those lacking in the skills required by expanding sectors.
The finding that import orientation has grown alongside increasing tariffs
and protection for some sectors, as has been the case in textiles and clothing,
suggests tariff protection has not fostered improvements in the productivity of
domestic producers but rather imposed a significant cost upon South African
consumers.
Net employment gains in manufacturing from trade alone are estimated to
be about 200,000, compared to growth in services jobs of over 1 million between
2001 and 2007. Employment losses in traded goods have been almost entirely in
primary products—mining and agriculture.
Despite the improving trend in exports over the past decade (exports per
capita and exports as a share of GDP have increased), South Africa’s export
performance does not compare favorably in an international context. Hausmann
and Klinger (2006), in discussing whether South Africa faces an export
predicament and looking at the period of export growth (1991–2004), rank South
Africa’s export volume performance close to last (50th) compared with 56
comparator countries.42 They also find a strong divergence in exports per capita
between South Africa and other natural resource exporters (Argentina, Australia,
Canada, and Malaysia) since 1960.
Looking at the change in tariffs, average protection has fallen in most
regions, with particularly large declines occurring in lower‐middle‐income and
low‐income economies. Although tariff protection has declined in South Africa
(−4.9 percent), it has not declined at a significantly faster pace than the average
for other lower‐middle‐income economies (−5.3 percent)—see table 8. These
results suggest that the liberalization process in South Africa has not been
“excessive” compared to its counterparts.
So while tariff reform has helped with exports, it is also fairly clear that
South African reform has not kept pace with that of competitors who have been
putting downward pressure on their real exchange rates via reform and more
rapid growth in factor productivity. Trade liberalization can provide additional
indirect benefits to exports because it depreciates the real exchange rate as the
relative prices of imports, exports, and nontradables change. Aron, Elbadawi and
Kahn (1997) estimate that in South Africa, the real effective exchange rate
depreciates by 2.5 percent in response to a 10 percent liberalization, with the
42 The comparison set is all countries with a population over 4 million and a GDP per capita of at
least 25 percent of South Africa’s. Hausmann and Klinger calculate South Africa’s ranking based on
the World Bank’s World Development Indicators (2005) data.

Policy Change and Economic Growth: A Case Study of South Africa 41
long‐run impact considerably larger. Li (2004) shows that permanent trade
liberalization in 45 countries leads to real depreciation in the exchange rate of
between 27 percent and 48 percent (without controlling for other factors).43
Table 8: Trends in Average Ad Valorem Tariff Rates for Selected Countries and Regions (percentage)
Country/region 1993–95 2002–04 % change
Australia 8.8 4.2 −4.2
Brazil 13.3 13.5 0.2
Chile 11.0 6.5 −4.1
China 37.3 10.9 −19.2
European Union 6.8 4.5 −2.1
India 47.8 29.1 −12.6
Indonesia 16.6 6.9 −8.3
Japan 4.4 3.6 −0.7
Korea, Rep. of 9.1 12.7 3.3
New Zealand 7.5 3.2 −4.1
Nigeria 26.9 30.0 2.4
South Africa (excl. ad valorem equivalents) 16.0 10.3 −4.9
South Africa (incl. ad valorem equivalents) 18.6 10.3 −7.0
Turkey 9.4 10.0 0.5
United States 5.4 3.8 −1.5
Simple average by region
High-income, non-OECD 7.8 5.4 −2.3
High-income, OECD 6.4 3.5 −2.7
Lower-middle-income 18.7 12.4 −5.3
Low-income 25.4 14.7 −8.5
Upper-middle-income 12.3 11.7 −0.5
Observations 69 69
Rank (from high to low tariffs)
South Africa (excl. ad valorem equivalents) 31 40 9
South Africa (incl. ad valorem equivalents) 21 40 19
Source: Edwards, 2005.
Notes: Change in tariff is calculated as (t1 − t0)/(1 + t0). The averages include agriculture, mining, and manufacturing sectors. The data for South Africa is based on the MFN tariff schedule, excluding surcharges.
43 Controlling for other factors (deviation from long‐run equilibrium, relative GDP growth, terms of
trade, share of government spending in GDP, capital inflows), Li estimates that the real exchange
rate depreciates by 14.8 percent in the initial years following the opening of the economy to trade,
and 17.0 percent in the long run.

42 David Faulkner and Christopher Loewald
Between 1994 and 2006, the real effective exchange rate depreciated by 11
percent. One may be inclined to associate the improvement in competitiveness
with the stimulated export growth. Exports as a percentage of GDP were
approximately 30 percent in 2006, up from a low of 21 percent in 1992. However,
it is apparent that exports have been unresponsive to exchange rate depreciation
in the past. Edwards and Lawrence (2006) show that the real exchange rate
provides little help with explaining export performance, especially the rapid
acceleration of exports experienced between 1991 and 1997, and rather appeal to
cost variables—that is, an improvement in export profitability—and most
importantly the liberalization in trade policy.
Firm‐level analyses of export behavior in South Africa (Rankin, 2001; World
Bank, 2005) point to factors that inhibit higher exports and faster export growth.
These suggest the competitiveness of South African exports remains stunted by
the high costs of conducting business, including labor costs and regulations, high
communication costs, transport costs and bottlenecks in supply due to
underdeveloped transport infrastructure, and costs associated with companies
regulation and licensing.
At the same time, few South African firms engage in concerted development
of export markets and production for export. Large firms concentrating on
commodity‐based products account for most exports. An export‐oriented motor
vehicle industry subsidy program generates a significant level of automobile and
components exports. Trade liberalization in some manufacturing subsectors has
led to rapid growth in some areas, although from a very low base. Nonetheless,
exports do appear to rise when their relative profitability to domestic sales
increases, for example, when the exchange rate depreciates. These episodes do
not, however, translate into overall production increases, suggesting fairly
flexible approaches to sales and markets but minimal sustained market
development or consistent gains to sectors supplying upstream inputs.
Explaining the Persistently Slow Employment Growth
In the first six years of democracy (1995–2000), employment growth registered
just 0.9 percent per year. The trend in employment growth has been reversed
more recently with employment expanding considerably since 2003—Labor
Force Survey data suggests 1.84 million jobs have been created in the last three
years at an average rate of 3.7 percent per year. This is a positive development
since greater employment of a productive workforce is critical to support
growth, both in the short‐ and long‐term. The economy requires an employment
growth rate of 3.4 percent per year to meet the government’s target of halving
unemployment by 2014.44
There is a strong belief that the South African economy has experienced
“jobless growth” for most of the past decade. However, recent trends suggest
44 The target announced at the Growth and Development Summit in 2003, a tripartite agreement.

Policy Change and Economic Growth: A Case Study of South Africa 43
this is not the case and there is clear evidence that employment has responded
positively to growth, especially since 2002. Estimation of the output elasticity of
employment (Fedderke and Mariotti, 2002) shows that the elasticity of
employment with respect to output growth in South Africa is close to unitary.45
This implies a one percent increase in output will result in a one percent increase
in employment, everything else being held constant.
Despite the recent favorable employment trends, unemployment remains
high. The rate of employment growth has been declining since the 1970s, and
there is little consensus in the literature on why this has occurred. A range of
explanatory factors have been put forward, including insufficient output growth,
high real wages and unionization, trade liberalization, and structural change, to
name a few. An increase in the participation rate has also been an important
factor, especially for women.
Trade liberalization since the early 1990s, while offering tangible benefits to
exporters, is a frequently mentioned explanation of slow employment growth
since 1994 (or rather job shedding in some sectors in the 1990s), particularly with
respect to unskilled labor. Trade liberalization, and the process of globalization,
increases the competitive pressures from low‐wage, labor‐intensive exporting
countries prompting a shift towards capital‐ and skill‐intensive production
activities. On balance, however, trade has increased employment while
productivity and technological change has reduced employment, with larger
adverse effects where firms are far below the technological production frontier or
where wages are rigid (Aghion, Braun and Fedderke, 2006). Structural change
related to a need for higher‐level skills has likely played a major role in the
decline of employment in the primary sectors (agriculture and mining) and the
nonmineral tradable sector (including manufacturing)—see figure 19.
The skills mismatch deriving from structural change has thus also inhibited
the role and importance of employment growth to economic growth. Lower
labor demand due to a shift in the economic structure has also been exacerbated
by within‐sector, economy‐wide skill upgrading and the move towards skill‐
biased technical change and hence the employment of more skilled individuals.
The demand for private sector labor depends on private sector growth and
the average real private sector wage. The strength of South Africa’s labor market
institutions—the unions and the collective wage bargaining structure—have
reduced the flexibility of the labor market and ensured that prevailing wages are
high when compared to wages across other countries at a similar level of
development. The effect on wages has not been uniform, with some sectors
experiencing strong and sustained growth in real wages for unskilled workers
and others relatively stable real wage levels.46
45 The output elasticity of employment describes how employment changes respond to a given
change in output. 46 Banerjee et al. (2006) argue that the influence of unions has rather been to prevent real wages
from falling since 1994.

44 David Faulkner and Christopher Loewald
Figure 19: The Changing Structure of Formal Employment (thousands)
700
800
900
1,000
1,100
1970 1976 1982 1988 1994 2000 2006
300
400
500
600
700
800
900
1970 1976 1982 1988 1994 2000 2006
1,000
1,100
1,200
1,300
1,400
1,500
1,600
1,700
1970 1976 1982 1988 1994 2000 2006
0
20
40
60
80
100
1970 1976 1982 1988 1994 2000 2006
Agriculture Mining
Manufacturing Composition of employment
Pe
rce
nt
Primary
Secondary
Services
YearYear
YearYear
Em
plo
ym
en
tE
mp
loym
en
t
Em
plo
ym
en
t
Given the impediments to formal employment, the informal sector has a role
to play in absorbing lower‐skilled job hunters into the labor market. In many
developing countries, informal employment constitutes up to 75 percent of all
employment. The informal sector should play a bigger role in South Africa, but
the legacy of the Apartheid regime and the limitations it imposed on worker
mobility have prevented this from happening. The relatively small and slow
growth of the informal sector is therefore another potential explanation of slow
employment growth.
Poor and inconsistent wage adjustment in formal labor markets, high labor‐
supply costs, and extensive skills mismatches are a critically important set of
constraints to a more equitable and growth‐supporting labor market. The
constraints arose over time in response to political factors, such as the important
role of labor unions in the anti‐Apartheid movement, as well as economic
factors.47 In particular, the labor market, its functioning, and its outcomes fit with
the broader product markets of which they are part.
47 Some of the constraints that emerged have been offset by gains, such as greater income stability
in some particularly unstable sectors (for example, agriculture) and a more generally quiescent and
cooperative labor relations environment.

Policy Change and Economic Growth: A Case Study of South Africa 45
Product Markets, Competition, and Economic Growth
Studies of inflation dynamics in South Africa have tended to find robust results
from the effects of producer prices and unit labor costs, the exchange rate, and
the output gap (Fedderke and Loewald, forthcoming). Using markups (that is,
the pricing behavior within industries) as a manifestation of the extent to which
markets are competitive, the National Treasury initiated a research program to
estimate the extent to which the lack of competition and concentration acted as a
constraint on growth and a propellant for inflation. Work by Aghion et al. (2006)
and Fedderke et al. (2007) helped to quantify the extent to which South African
industry has been able to set final goods and services prices to protect profit
margins through the business cycle. Markups over production costs are
estimated to be significantly higher in South African manufacturing industries
than they are in corresponding industries worldwide, with no evidence of a
decline despite tariff reforms in the mid‐1990s.
The finding of high markups in South African industry derives, in a large
part, from the significant concentration that characterizes the economy’s
industrial structure. While for some sectors this reflects the dominance of current
or former state‐owned enterprises, high concentration is pervasive. The four
largest conglomerates in South Africa accounted for 80 percent of market
capitalization on the Johannesburg Stock Exchange during the first half of the
1990s and continued to control more than 50 percent in 2002 (Chabane et al.,
2003). High levels of concentration in sectors have been maintained despite the
observed unbundling of these groupings in recent years. The collective wage
bargaining system—essentially sector‐wide agreements extended to non‐
parties—appears to provide a further degree of protection from potential
entrants.48 Other financial and nonfinancial factors may also be important, such
as extensive cross‐shareholdings, a history of exchange controls that limited
exposure to foreign assets, and extensive use of licensing and exclusive supply
and distribution agreements.
The high levels of market concentration, as evidenced by significant
markups, represent a serious underlying constraint to South Africa’s potential
for achieving sustained higher growth. Aghion et al. (2006) emphasize the
deleterious effects higher markups have on productivity growth and
employment and estimate that a 10 percent reduction in South African markups
would increase productivity growth by between 2 percent and 2.5 percent per
year. Establishing an effective and proactive competition policy, that scrutinizes
potential mergers and encourages new firm entry, is therefore imperative.
Competition, input costs, trade liberalization, innovation, and TFP growth
are all interrelated. For South Africa, and probably other middle‐income
48 In addition to the legal backing provided to the collective bargaining system, the general
shortage of skilled labor enables greater insulation of labor market insiders from competition. The
general approach to bargaining further reinforces that effect by pushing up entry‐level wages (and
contributing to a large youth unemployment problem).

46 David Faulkner and Christopher Loewald
economies, innovation can represent the import of knowledge but also domestic
innovation in markets that for whatever reason are sheltered or discontinuous
with potential substitutes in foreign markets. One aspect of that innovation may
simply be the response in terms of productivity to greater competition from
imported products. Gains to consumers from lower prices may have volume
benefits and other general equilibrium benefits that far outweigh the possible
losses to domestic firms from lower returns on capital and/or lower employment.
In some sectors, in particular textiles and clothing, very high tariffs have retarded
economic adjustment and imposed high costs, especially on low‐income
consumers who would likely benefit most in terms of improved living standards.
Trade liberalization, by raising competition from imports, is one mechanism
to engender innovation, import of knowledge, and technological progress.
Mirroring this, the efficiency improvements and productivity gains associated
with competition will also stimulate exports. Rankin (2001) shows that efficient
firms tend to self‐select themselves as exporters rather than vice versa (exports
causing efficiency), which suggests that there may be subsidiary benefits for
exports to increasing competition and expanding the pool of efficient firms in the
economy. Alternatively, competition policy in preventing the abuse of market
power and uncompetitive markets will encourage the growth of smaller firms.
Since there is a robust positive relationship between exports and firm size,
competition policy can play a role in facilitating firms to grow and become more
export oriented.
TFP: Accelerating South Africa’s Sustainable Growth Path
Faster accumulation of factor inputs and a regulatory environment that
encourages TFP growth will be important in sustaining and further accelerating
growth in South Africa, not least because without appropriate manipulation,
factor inputs are subject to diminishing returns and their growth‐enhancing
effects exhausted over the long term.49 TFP growth can derive from many
sources. In models that treat knowledge as a pure public good, with the dual
characteristics of being nonrival and nonexcludable, TFP growth results from
spillovers and learning‐by‐doing (the indirect channel) associated with capital
investment (Romer, 1986) or investment in human capital (Lucas, 1988).50 In
contrast, the Schumpeterian tradition of economic growth argues that the
intentional devotion of private sector resources to the advancement of
knowledge creation (the direct channel) enables the economy to produce with
49 Given the relatively low level of investment in South Africa and the quantity of unemployed
labor, factor accumulation will, however, continue to play an integral role in growth for years to
come. 50 A good is nonrival if each individual’s consumption of that good does not subtract from any
other individual’s consumption of that good. A good is nonexcludable if it is impossible to exclude
any other individuals from consuming it. This is an indirect channel of TFP growth. Spillovers and
learning‐by‐doing allows capital to cast off the shackles of diminishing returns, achieve increasing
returns to scale, and drive sustained higher economic growth.

Policy Change and Economic Growth: A Case Study of South Africa 47
increasing returns to scale and achieve higher sustainable growth. Different
mechanisms for increasing TFP have been identified, whether they be product
varieties (Romer 1990), quality ladders (Grossman and Helpman 1989), or
creative destruction (Aghion and Howitt 1992). What is common to all three is
the role of human capital, and investment in research and development (R&D) to
further knowledge creation.51 For South Africa, Fedderke (2005) uses
manufacturing data to confirm the positive impact of R&D expenditure on the
growth of TFP, as postulated by the Schumpeterian tradition of endogenous
growth theory. The results also show that human capital is an important
determinant of TFP growth but that it is not the quantity of human capital
(enrolment once again is the chosen proxy) but rather the quality of human
capital that is statistically significant and positively associated with TFP growth
in South Africa.52
There are many determinants of innovation and technological progress and
therefore productivity growth can be fostered through a variety of policies. The
appropriate set of policies and institutions depends on a country’s relative state
of development and its distance from the world technological frontier (Acemoglu
et al., 2002). Economies far from the frontier need institutions capable of
adopting and using existing technology, whereas technological leaders need to
focus on more direct forms of innovation.53
Trade liberalization and increasing openness have also been influential
determinants of TFP growth through the import of new ideas, capital, learning
effects, and technological transfer (Aron, 2001; Arora and Bhundia, 2003).
Continuing trade and tariff reform will arguably not only boost competitiveness
and exports but also benefit TFP. Arora and Bhundia (2003) find the share of
private investment in total investment and investment in capital and machinery
to be important in explaining TFP in South Africa. This suggests that continued
policy focus on macroeconomic stability and its advantageous outcomes such as
low inflation and interest rates, will encourage the private investment that fosters
continued technological progress. Institutional reform has also been found to be
an important determinant of TFP (Arora and Bhundia 2003; IMF, 2003), reflecting
the positive impact of political and institutional change since 1994. The stepped‐
51 Many empirical studies confirm the importance of human capital to economic growth. Barro
(1991) in his study of economic growth in a cross‐section of countries, using the educational
enrolment rate as a proxy, finds human capital to be a significant determinant of growth. Mankiw
et al. (1992) meanwhile generate an Augmented Solow Model of economic growth by including
human capital as an additional factor of production. Their results show that the augmented Solow
model can explain 80 percent of the variation in growth across the countries in their sample. 52 This is consistent with the literature advocating that it is the quality of education, human capital,
and the labor force that is important and statistically significant for productivity improvements and
economic growth (Hanushek and Kimko, 2001; Hanushek and Wößmann, 2007). 53 Policies that facilitate innovation and growth for economies closer to the technological frontier
include product market competition and entry, higher education (more important for innovation
than imitation), stock market finance, democracy, and more decentralized firms with capable and
efficient managers and entrepreneurs.

48 David Faulkner and Christopher Loewald
up effort to modernize and enhance the efficiency of the public sector in South
Africa could play an important role in raising private sector productivity in
coming years.
The dominance of TFP growth as the primary source of growth since 1994 is
beneficial since it is technological progress that enables the economy to achieve a
higher sustainable rate of economic growth. In many developed countries where
the economic growth available from increasing labor and capital has largely been
exhausted, the focus is placed on technological progress and TFP growth. This is
not the case in South Africa, where there remains considerable scope for the
economy to achieve growth through increasing employment and investing in the
capital stock. Current and future economic policy in South Africa therefore needs
to adopt a holistic approach that stimulates all three sources of growth.
Education: Addressing Human Capital Needs and Unlocking Human Capital Potential
The fundamental role of human capital in endogenous growth theory places a
premium on providing the appropriate education, training, and skills
development policies to ensure the realization of technological progress,
productivity improvements, and TFP growth. As mentioned in the previous
section, the pivotal influence is the quality of human capital. The importance of
human capital deepening and the quality of education and the labor force for
economic growth is well‐established (Hanushek and Kimko, 2001; Hanushek and
Wößmann, 2007). Furthermore, as the structure of South Africa’s economy
continues to shift and expand towards medium‐ and high‐technology
manufacturing and services, there is a premium placed on investing in and
developing a high‐skilled workforce. This will ameliorate the current skills
shortage problems detrimentally affecting the economy but more fundamentally
will equip South Africa with a workforce able to sustain an accelerated rate of
growth.54
The education and skills development system is currently failing in this
regard as illustrated in the persistent evidence of South Africa’s weak
educational performance. Cross‐national standardized tests illustrate South
Africa is not internationally competitive (Crouch and Vinjevold, 2006; van der
Berg and Louw, 2007; van der Berg, 2007). The traditional measure of learning
achievement, the matric pass rate, has been declining since 2003 from 73.2
percent to 66.6 percent in 2007. Of equal concern are the more subtle changes in
learning outcomes and the composition of matric passes, with the relatively low
numbers passing in the quality indicators of “exemption” passes and higher
54 In addition to its importance at the macro level, ensuring that education and human capital is of
a sufficient quality is important for micro‐level outcomes. Case and Yogo (1999) show the quality of
schooling has a positive impact on the probability of employment and adult earnings.
Policy Change and Economic Growth: A Case Study of South Africa 49
grade mathematics and science.55 This in itself limits access to quality tertiary
education and places additional pressure on South Africa’s capacity to sustain a
competitive economy in a globalised world.
In explaining this poor performance, one cannot ignore the lingering legacy
of educational inequities that originated during Apartheid. This is one of the
most damaging economic constraints inherited from Apartheid‐era government
policy.56 Since 1994, much has been achieved in redressing these educational
inequities in terms of school access and government resource allocation.
Longitudinal survey data from the Cape Area Panel Study (CAPS) presents “a
school environment characterized by almost universal primary education, high
enrolment rates up to at least age 16, with grade repetition playing a large role in
explaining the racial gap in schooling” (Lam et al., 2008: 11).57 Despite the
laudable progress in access and more equitable government funding, this has not
attained an equalization of educational outcomes.
The education production function describes how educational inputs
translate into educational outcomes. Education in South Africa is well‐resourced
with a significant share of government expenditure devoted to education. On
average, over the last decade, education expenditure has accounted for 22
percent of total consolidated expenditure and has been equivalent to 5.5 percent
of GDP; this compares favorably with many developed countries. Nevertheless,
weak educational performance illustrates that higher educational resources does
not guarantee improved educational outputs.58
Significant research into the South African education production function,
however, finds that a large portion of student performance remains unexplained.
As a result, attention has been reallocated away from the role of resources
towards less quantifiable aspects, such as school management, efficiency and
55 Higher‐grade mathematics passes had fallen from 29,475 in 1995 to an average of 19,678 over the
period 1997–2001. Since 2002, there has been some improvement in this quality indicator with the
number passing higher‐grade mathematics exceeding 25,000 in 2005 and 2006. However, this
remains lower than a decade earlier. 56 An important long‐run impact of apartheid, and in particular apartheid education policies, is that
it retarded parental education, leaving African parents and communities without the cognitive
resources to create a favorable home learning environment. Lam et al. (2008: 27) using CAPS data
finds “the mothers and fathers of African youth have 4–5 years less schooling than the parents of
the white youth.” This element of the apartheid legacy will take considerable time to erode. 57 Grade repetition is found to particularly affect African students and proves an important
explanation for the lower grade attainment, confirming the earlier evidence presented by Anderson
et al. (2001). 58 Whilst this has achieved some narrowing in the discrepancies affecting school quality, as
measured by pupil‐teacher ratios, large disparities in school fees has limited the success of
equalizing government funding translating into equalizing pupil‐teacher ratios. This also, in part,
reflects a drive of policy initially towards raising teachers’ salaries rather than increasing other
resources devoted towards educating South Africa’s young.

50 David Faulkner and Christopher Loewald
governance, and teacher quality (Fedderke and Luiz, 2006; van der Berg and
Louw, 2007; van der Berg, 2007).59
In summary, constraints including a shortage of high‐quality teachers,
governance issues within schools, and inappropriate incentives within the skills
development system all undermine the quality of educational and skills
development outcomes and limit the economy’s potential to fully exploit the
growth‐enhancing policies and reforms instituted since 1994. It is imperative to
develop appropriate educational policies to relax these constraints and release
the human capital potential of South Africa. Without addressing these needs, the
economy is threatened by a persistent problem of skills shortage and greater
difficulties of realizing economic growth through the channel of TFP and
technological progress.
A Final Note on the Underpinning Fundamentals: Policy Change, Institutions, and Economic Growth
The development of policy and its effects on economic growth in South Africa
operates within the context of the institutions that prevail over and underpin the
economy and society. The importance of institutions as a fundamental
determinant of economic growth has become prevalent and influential as an
approach for explaining growth. Institutions are crucial since they “provide the
incentive structure of an economy ... [shaping] the direction of the economy
towards growth, stagnation or decline” (North, 1991: 97). For example, economic
institutions influence investment in physical and human capital, the incentive to
innovate and develop new technology, and how production is organized. As
stated in our introduction: South Africa’s growth experience provides an
example of where contrasting growth trends have pivoted around the political
transition to democracy—and a completely different institutional framework.
The disappointing results from the education production function and
failure to convert significant resources into educational outcomes is an example
that illustrates the importance of governance and the imperative of
implementing appropriate institutions. The role of institutional development and
its interaction with policy change has provided an important subtext to this case
study of South Africa’s economic growth.
A wealth of literature lends support for the importance of institutions in
explaining not only cross‐country differences in income levels, but differences in
economic growth and volatility (North, 1991; Kaufmann et al., 1999; IMF, 2003;
Acemoglu et al., 2004). Apartheid was a political system predicated on a racially
exclusive institutional framework that eroded political rights and freedoms,
property rights, and generated significant levels of political uncertainty
59 Important issues here include the problem of teacher absenteeism, a low proportion of teacher’s
time dedicated to actually teaching, and the lack of qualified teachers (expanding access led to a
compromise on the qualifications of teachers and the proliferation of teachers without a teaching
diploma).

Policy Change and Economic Growth: A Case Study of South Africa 51
(Fedderke et al., 2001a). Crucial to reversing the volatile and generally declining
growth observed during the final decade of Apartheid was the stable and
peaceful establishment of democracy in 1994 and the process of providing
political rights to the majority of the population. The development of these
institutional factors was essential for reducing the political instability and
improving property rights. As has been emphasized earlier, and confirmed in the
econometric evidence (for example, Fedderke et al., 2001b), the reduction in
political instability, and thus uncertainty, facilitated investment and more
generally resuscitated the economy.
Whilst democracy brought the South African economy back to life, the
certainty of policy direction in establishing confidence in the economy and
providing the framework for growth cannot be understated. It has been this
certainty that guided the declining trajectory of fiscal deficits, instilled inflation
targeting as monetary policy, and granted central bank independence. The focus
on growth has been underpinned by commitment to first GEAR and then
ASGISA, and institutionalizing policy certainty continues with the National
Treasury adopting the principles of a structural budget balance in the Budget
2008. This policy certainty has established macroeconomic stability, confidence in
the National Treasury’s stewardship of South Africa’s economic policy, and,
more widely, confidence in the economy.
Looking ahead, the interactions between institutions, policy, and growth
will continue to be crucial. Macroeconomic stability is a necessary condition for
facilitating growth but is insufficient to guarantee the economic growth needed
to continue to expand economic opportunities and welfare in South Africa. Micro
reforms need to be adopted. We have identified the important future role trade
policy, competition policy, regulation in product and labor markets, and
education will play in the as yet unwritten South African growth story; and for
these policy avenues to be successful, a relevant, appropriate, and conducive
institutional environment is required.
6. Conclusion
South Africa’s growth experience has been one of a long period of decline in the
1970s and 1980s followed by an improving growth performance since the
transition to democracy in 1994. Despite factor accumulation making a larger
contribution to growth since 2000, the fundamental driver of accelerating growth
has been TFP growth, accounting for 60 percent of post‐1994 economic growth.
Greater integration and flows of knowledge and more competition have been
important channels.
Prudent fiscal policy and sound macroeconomic management have been
critical factors in creating an environment conducive to growth by stabilizing
economic conditions, lowering the user cost of capital, and putting downward

52 David Faulkner and Christopher Loewald
pressure on the real exchange rate. Better use of capital and labor was a key
result, and has been evident in the boom in retail trade, finance, and residential
and nonresidential construction and infrastructure development. Professional
and engineering services subsectors have also done well. Manufacturing
production has been more moderate but sustained, with more robust increases in
investment at times when the exchange rate is strong and better exports when
the exchange rate makes goods more competitive in foreign markets.
In the South African context of heightened political polarization prior to
1994, achieving low inflation and macroeconomic stability was critical to
unlocking investment by the private sector. However, there needs to be an
enabling microeconomic environment to support macroeconomic stability. This
area has proved difficult to reform effectively for both political economy and
capacity reasons.
Economic growth has been, and still is, skills intensive. This suggests that
much more robust and sustained growth is needed to extend economic activity
into segments of the population that have low skills levels or are marginalized
due to the high costs associated with their location. At the same time, the
microeconomic constraints arising from product and labor market rigidities—
such as regulations and practices that impose high costs on new entrants to
established markets—should help to lower the costs of engaging in economic
activity and increase opportunity, which would benefit factor accumulation and
productivity.
Greater product market competition has proven to be an area difficult to
reform, in part because of the interests that have emerged in correspondence
with the various levels of control and pricing power in the economic system.
Further tariff reform is probably central to efforts to induce the productivity‐
raising effects of competition, but also to reduce anti‐export bias and to help
firms concentrate on developing permanent markets for exports. Reform of
product and labor markets—essentially to provide and enforce basic service
levels, product quality, and conditions of work with more price flexibility to
increase economic activity levels—remains a critical challenge.
Macroeconomic policy has attempted to address these problems, by
providing countercyclical pressure and lowering inflation. With the inelastic
aggregate supply curve of the South African economy that our discussion has
implied and an environment of near fully mobile capital, systematic efforts to
adjust nominal exchange rates to target a consistently more depreciated real rate
would be difficult although not impossible. It is even less clear, however, if it
would work to address supply inelasticity given South Africa’s product markets
without reform of the regulations and practices affecting those markets. Some
combination of a more countercyclically oriented fiscal and monetary policy and
extensive microeconomic reform would help to reduce pricing power, create
opportunity, and incentivize greater production for export markets. Without
such reforms, the surplus created for investment by an initial round of real

Policy Change and Economic Growth: A Case Study of South Africa 53
exchange rate depreciation would be inefficiently expended and reabsorbed by
the existing market incumbents.
Key infrastructure investments have been and will continue to be essential to
lowering the costs and improving the efficiency of the transport and
telecommunications networks, thereby complementing the efficiency and
productivity of private sector investment, reducing the cost burden on exporters,
and raising competitiveness. Investing in a skilled workforce, in science and
technology, and in R&D is also critical to expand the skilled, productive
workforce. Progress in these areas would help to unlock the full potential of the
macroeconomic policy configuration on the economy’s growth rate by improving
the export orientation and increasing foreign demand for South African
products.

54 David Faulkner and Christopher Loewald
References
Acemoglu, D., P. Aghion, and F. Zilibotti. 2002. “Distance to Frontier, Selection,
and Economic Growth.” NBER Working Paper No. 9066. National Bureau
of Economic Research, Cambridge, MA.
Acemoglu, D., S. Johnson, and J. Robinson. 2004. “Institutions as the
Fundamental Cause of Long‐Run Growth.” NBER Working Paper No.
10481. National Bureau of Economic Research, Cambridge, MA.
Aghion, P., and S. Durlauf. 2007. “From Growth Theory to Policy Design.”
Commission on Growth and Development Macroeconomics Working
Paper. Commission on Growth and Development, Washington, DC.
Aghion, P., M. Braun, and J. Fedderke. 2006. “Competition and Productivity
Growth in South Africa.” CID Working Paper No. 132. Centre for
International Development, Harvard University.
Aghion, P. and P. Howitt. 1992. “A Model of Growth Through Creative
Destruction.” Econometrica 60: 323–51.
Anderson, K., A. Case, and D. Lam. 2001. “Causes and Consequences of
Schooling Outcomes in South Africa: Evidence from Survey Data.”
Population Studies Center Research Report No. 01‐490. University of
Michigan, USA.
Aron, J. and J. Muellbauer. 2000. “Personal and Corporate Saving in South
Africa.” CSAE Working Paper 2000–21. Centre for the Study of African
Economies, Oxford University.
———. 2007. “Inflation Dynamics and Trade Openness: With an Application to
South Africa.” CSAE Working Paper 2007‐11. Centre for the Study of
African Economies, University of Oxford.
Aron, J., I. Elbadawi, and B. Khan. 1997. “Real and Monetary Determinants of the
Real Exchange Rate in South Africa.” CSAE Working Paper WPS/97‐16.
Centre for the Study of African Economies, University of Oxford.
Arora, V. 2006. “Economic Growth in Post‐Apartheid South Africa: A Growth
Accounting Analysis.” In M. Nowak and L. A. Ricci, eds., Post‐Apartheid
South Africa: The First Ten Years. Washington, DC: IMF Publications Service.
Arora, V., and A. Bhundia. 2003. “Potential Output and Total Factor Productivity
in Post‐Apartheid South Africa.” IMF Working Paper WP/03/178.
International Monetary Fund, Washington, DC.
Aschauer, D. A. 1989. “Is Public Expenditure Productive?” Journal of Monetary
Economics 23: 177–200.

Policy Change and Economic Growth: A Case Study of South Africa 55
Banerjee, A., S. Galiani, J. Levinsohn, and I. Woolard. 2006. “Why Has
Unemployment Risen in the New South Africa?” CID Working Paper No
134. Centre for International Development, Harvard University.
Barro, R. 1991. “Economic Growth in a Cross Section of Countries.” NBER
Working Paper No. 3120. National Bureau of Economic Research,
Cambridge, MA.
———. 1999. “Notes on Growth Accounting.” Journal of Economic Growth 4(2):
119–37.
Bernanke, B. S. 1983. “Irreversibility, Uncertainty and Cyclical Investment.”
Quarterly Journal of Economics 98: 85–106.
Bogetić, Z., and J. W. Fedderke. 2006. “International Benchmarking of South
Africaʹs Infrastructure Performance.” Policy Research Working Paper Series
3830. World Bank, Washington, DC.
Calderón, C., and L. Servén. 2004. “Trends in Infrastructure in Latin America,
1980–2001.” Policy Research Working Paper Series 3401. World Bank,
Washington, DC.
Case, A., and M. Yogo. 1999. “Does School Quality Matter? Returns to Education
and the Characteristics of Schools in South Africa.” NBER Working Paper
No. 7399. National Bureau of Economic Research, Cambridge, MA.
Chabane, N., J. Machaka, N. Molaba, S. Roberts, and M. Taka. 2003. “10 Year
Review: Industrial Structure and Competition Policy.” Unpublished paper,
commissioned by The Presidency.
Crouch, L., and P. Vinjevold. 2006. “South Africa: Access before Quality, and
What to Do Now?” Unpublished paper. Research Triangle Institute, North
Carolina.
Dixit, A. K., and R. S. Pindyck. 1994. Investment under Uncertainty. Princeton:
Princeton University Press.
Dunne, J., and L. Edwards. 2007. “Trade, Enterprise Production and
Employment.” Journal for Studies in Economics and Econometrics 31(2): 49–68.
Du Plessis, S., and B. Smit. 2006. “South Africa’s Growth Revival after 1994.”
Stellenbosch Economic Working Paper 01/06. Stellenbosch University,
Stellenbosch, South Africa.
Du Plessis, S., B. W. Smit, and F. Sturzenegger. 2007. “Measuring Potential
Output and the Business Cycle in South Africa.” Stellenbosch Economic
Working Paper 11/07. Stellenbosch University, Stellenbosch, South Africa.
Edwards, L. 2005. “Has South Africa Liberalised its Trade?” South African Journal
of Economics 73(4): 754–75.

56 David Faulkner and Christopher Loewald
Edwards, L. and P. Alves. 2006. “South Africa’s Export Performance: Determinants
of Export Supply.” South African Journal of Economics 74(3): 473–98.
Edwards, L. and R. Lawrence. 2006. “South African Trade Policy Matters: Trade
Performance & Trade Policy.” CID Working Paper No. 135. Centre for
International Development, Harvard University.
Fallon, P., and R. Lucas. 1998 “South African Labour Markets: Adjustment and
Inequalities.” Informal Discussion Papers on Aspects of the South African
Economy No. 12. World Bank, Washington, DC.
Fedderke, J. W. 2002. “The Structure of Growth in the South African Economy:
Factor Accumulation and Total Factor Productivity Growth 1970–1997.”
South African Journal of Economics 70(4): 612–46.
———. 2004. “Investment in Fixed Capital Stock: Testing for the Impact of
Sectoral and Systemic Uncertainty.” Oxford Bulletin of Economics and
Statistics 66(2): 165–87.
———. 2005. “From Chimera to Prospect: Toward an Understanding of the South
African Growth Absence.” Report for the South African National Treasury
and the World Bank. (Forthcoming as World Bank Discussion Paper).
Fedderke, J. W. and C. Loewald. Forthcoming. “Inflation and the Costs of
Production: Understanding Industry Structure and Pricing Behaviour in
Formulating a Macroeconomic and Monetary Policy Framework in South
Africa.” Santa Monica: Pardee RAND Graduate School
Fedderke, J. W., and G. Szalontai. 2005. “Industry Concentration in South African
Manufacturing: Trends & Consequences, 1970–1996.” World Bank Africa
Region Working Paper Series No. 96. World Bank, Washington, DC.
Fedderke, J. W., and J. M. Luiz. 2006. “The Political Economy of Institutions,
Stability and Investment: A Simultaneous Equation Approach in an
Emerging Economy the Case of South Africa.” ERSA Working Paper No.
15. Economic Research Southern Africa, University of Cape Town.
Fedderke, J. W., and M. Mariotti. 2002. “Changing Labour Market Conditions in
South Africa: A Sectoral Analysis of the Period 1970–97.” South African
Journal of Economics 70(5): 830–64.
Fedderke, J. W., and P. Vaze. 2001. “The Nature of South Africa’s Trade Patterns
by Economic Sector, and the Extent of Trade Liberalisation During the
Course of the 1990s.” South African Journal of Economics 69(3): 436–77.
Fedderke, J. W., C. Kularatne, and M. Mariotti. 2007. ”Mark‐up Pricing in South
African Industry.” Journal of African Economics 16(1): 28–69.
Fedderke, J. W., P. Perkins, and J. M. Luiz. 2006. “Infrastructural Investment in
Long‐Run Economic Growth: South Africa 1875–2001.” World Development
34(6): 1037–59.

Policy Change and Economic Growth: A Case Study of South Africa 57
Fedderke, J. W., R. de Kadt, and J. M. Luiz. 2001a. “Indicators of Political Liberty,
Property Rights and Political Instability in South Africa: 1935–1997.”
International Review of Law and Economics 21: 103–34.
———. 2001b. ”Growth and Institutions: A Study of the Link between Political
Institutions and Economic Growth in South Africa—A Time Series Study
1935–1997.” Studies in Economics and Econometrics 25(1): 1–26.
Fedderke, J. W., Y. Shin, and P. Vaze. 2003. “Trade and Labour Usage: An
Examination of the South African Manufacturing Industry.” Working
Paper 15. Economic Research Southern Africa, University of Cape Town.
Feinstein, C. H. 2005. An Economic History of South Africa: Conquest, Discrimination
and Development. Cambridge University Press.
Fields, G., M. Leibbrandt, and J. Wakeford. 1999. “Key Labour Market Elasticities
in South Africa.” Report Commissioned by the South African Department
of Finance.
Fourie, J. 2006. “Some Policy Proposals for Future Infrastructure Investment in
South Africa.” Stellenbosch Economic Working Papers 05/06. Stellenbosch
University, Stellenbosch, South Africa.
Golub, S., and L. Edwards. 2003. “South African International Cost
Competitiveness and Exports: A Sectoral Analysis.” Trade and Industry
Monitor 25 (March).
Grossman, G. M., and E. Helpman. 1989. “Quality Ladders in the Theory of
Growth.” NBER Working Paper No. 3099. National Bureau of Economic
Research, Cambridge, MA.
Hanushek, E. and Kimko, D. (2001). Schooling, Labour Force Quality, and the
Growth of Nations, American Economic Review, 90(5): 1184‐1208.
Hanushek, E., and L. Wößmann. 2007. “The Role of Education in Economic
Growth.” Policy Research Working Paper 4122. World Bank, Washington,
DC.
Harding, T., and J. Rattsø. 2005. “The Barrier Model of Productivity Growth:
South Africa.” Working Paper Series, Department of Economics,
Norwegian University of Science and Technology, Norway.
Hausmann, R., and B. Klinger. 2006. “South Africa’s Export Predicament.” CID
Working Paper No. 129. Centre for International Development, Harvard
University.
Hausmann, R., L. Pritchett, and D. Rodrik. 2004. “Growth Accelerations.” NBER
Working Paper 10566. National Bureau of Economic Research, Cambridge,
MA.

58 David Faulkner and Christopher Loewald
Hirsch, A. 2005. “Season of Hope: Economic Reform under Mandela and Mbeki.”
University of KwaZulu Natal Press and International Development
Research Centre (IRDC).
Hoogeveen, J., and B. Özler. 2006. “Poverty and Inequality in Post‐Apartheid
South Africa: 1995–2000.” In H. Bhorat and R. Kanbur, eds., Poverty and
Policy in Post‐Apartheid South Africa. Cape Town: HSRC Press.
IMF (International Monetary Fund). 2003. “Growth and Institutions.” Chapter III
in World Economic Outlook. Washington, DC: IMF.
Jonsson, G. and A. Subramanian. 2001. “Dynamic Gains from Trade Evidence
from South Africa.” IMF Staff Papers 48(1): 197–224. IMF, Washington, DC.
Kaufmann, D., A. Kraay, and P. Zoido‐Lobatón. 1999. “Governance Matters.”
World Bank Policy Research Working Paper 2196. World Bank,
Washington, DC.
Kingdon, G., and J. Knight. 2001. “Unemployment in South Africa: The Nature of
the Beast.” CSAE Working Paper WPS/2001‐15. Centre for the Study of
African Economies, University of Oxford.
Kularatne, C. 2006. “Social and Economic Infrastructure Impacts on Economic
Growth in South Africa.” Mimeo, National Treasury.
Lam, D., C. Ardlington, and M. Leibbrandt. 2008. “Schooling as a Lottery: Racial
Differences in School Advancement in Urban South Africa.” Population
Studies Center Research Report No. 08‐632. University of Michigan, USA.
Leibbrandt, M., J. Levisohn, and M. McCrary. 2005. “Incomes in South Africa
since the Fall of Apartheid.” NBER Working Paper No. 11384. National
Bureau of Economic Research, Cambridge, MA.
Lewis, D. 1995. “Markets, Ownership and Manufacturing Performance.” In A.
Joffe et al., Improving Manufacturing Performance in South Africa: Report of the
Industrial Strategy Project. University of Cape Town Press.
Li, X. 2004. “Trade Liberalisation and Real Exchange Rate Movement.” IMF Staff
Papers 51(3). IMF, Washington DC.
Lucas, R. 1988. “On the Mechanics of Economic Development.” Journal of
Monetary Economics 22(3): 3–42.
Mankiw, N. G., D. Romer, and D. Weil. 1992. “A Contribution to the Empirics of
Economic Growth.” NBER Working Paper No. 3541. National Bureau of
Economic Research, Cambridge, MA.
Naidoo, K. 2007. “Operationalising South Africa’s Move from Macroeconomic
Stability to Microeconomic Reform.” In V. Padayachee, ed., The Development
Decade? Economic and Social Change in South Africa, 1994–2004. Cape Town:
HSRC Press.

Policy Change and Economic Growth: A Case Study of South Africa 59
National Treasury. 2004a. “A Growth and Development Framework for the Next
Decade: 2004–2014.” Discussion Paper prepared for the Cabinet Lekgotla
(May). National Treasury, Republic of South Africa (RSA).
———. 2004b. Growth, Employment and Redistribution: A Macroeconomic Strategy.
National Treasury, RSA.
—––. 2008. Budget Review. National Treasury, RSA.
North, D. C. 1991. “Institutions.” Journal of Economic Perspectives 5(1): 97–112.
Pindyck, R. S. 1991. “Irreversibility, Uncertainty and Investment.” Journal of
Economic Literature 29(3): 1110–48.
Rankin, N. 2001. “The Export Behaviour of South African Manufacturing Firms.”
TIPS 2001 Annual Forum. Trade & Industrial Policy Strategies,
Johannesburg.
Rodrik, D. 2006. “Understanding South Africa’s Economic Puzzles.” CID Working
Paper No. 130. Centre for International Development, Harvard University.
Romer, P. 1986. “Increasing Returns and Long‐Run Growth.” Journal of Political
Economy 94: 1002–37.
———. 1990. “Endogenous Technological Change.” Journal of Political Economy
98: s71–s102.
Romm, A. 2005. “The Relationship Between Saving and Growth in South Africa:
A Time Series Analysis.” South African Journal of Economics 73:2: 171–89.
Teljeur, E., and R. Cassim. 2003. “How Will the Restructuring of SOEs Affect The
South African Economy.” Unpublished paper, commissioned by The
Presidency, RSA.
The Presidency. 2003. “Towards a Ten Year Review: Synthesis Report on
Implementation of Government Programmes.” Discussion Document, The
Presidency, RSA.
———. 2007. “Development Indicators: Mid‐Term Review.” The Presidency, RSA.
Van der Berg, S. 2007. “Apartheid’s Enduring Legacy: Inequalities in Education.”
Journal of African Economies 16(5): 849–80.
Van der Berg, S., and M. Louw. 2007. “Lessons Learnt from SACMEQII: South
African Student Performance in Regional Context.” Stellenbosch Economic
Working Papers, 16/2007, Stellenbosch University, Stellenbosch, South
Africa.
Van der Berg, S., R. Burger, M. Louw, and D. Yu. 2005. “Trends in Poverty and
Inequality since the Political Transition.” Stellenbosch Economic Working
Papers 1/2005. Stellenbosch University, Stellenbosch, South Africa.
World Bank. 2005. “An Assessment of South Africa’s Investment Climate.”
World Bank, Washington, DC.

Eco-Audit
Environmental Benefits Statement
The Commission on Growth and Development is committed to preserving
endangered forests and natural resources. The World Bank’s Office of the
Publisher has chosen to print these Working Papers on 100 percent
postconsumer recycled paper, processed chlorine free, in accordance with the
recommended standards for paper usage set by Green Press Initiative—a
nonprofit program supporting publishers in using fiber that is not sourced from
endangered forests. For more information, visit www.greenpressinitiative.org.
The printing of all the Working Papers in this Series on recycled paper saved the
following:
Trees* Solid Waste Water Net Greenhouse Gases Total Energy
48 2,247 17,500 4,216 33 mil. *40 inches in
height and 6–8
inches in diameter Pounds Gallons Pounds CO2 Equivalent BTUs

The Commission on Growth and Development Working Paper Series
32. Population Aging and Economic Growth, by David E. Bloom, David Canning, and Günther Fink, July 200833. Early Life Nutrition and Subsequent Education, Health, Wage, and Intergenerational Effects, by Jere R. Behrman, July 2008 34. International Finance and Growth in Developing Countries: What Have We Learned, by Maurice Obstfeld, August 2008 35. Policy and Institutional Dynamics of Sustained Development in Botswana, by Gervase Maipose, August 2008 36. Exports of Manufactures and Economic Growth: The Fallacy of Composition Revisited, by William R. Cline, August 2008 37. Integration with the Global Economy: The Case of Turkish Automobile and Consumer Electronics Industries, by Erol Taymaz and Kamil Yılmaz, August 2008 38. Political Leadership and Economic Reform: the Brazilian Experience, by Henrique Cardoso and Eduardo Graeff, September 2008 39. Philippines Case Study: The Political Economy of Reform during the Ramos Administration (1992–98), by Romeo Bernardo and Christine Tang, September 2008 40. Making Diffi cult Choices: Vietnam in Transition, Martin Rama, based on conversations with
H. E. Võ Văn Kiệt, with Professor Đặng Phong and Đoàn Hồng Quang, November 2008
41. Policy Change and Economic Growth: A Case Study of South Africa, by David Faulkner and Christopher Loewald, November 2008
Forthcoming Papers in the Series: International Migration and Development, by Gordon H. Hanson (January 2009)Private Infrastructure in Developing Countries: Lessons from Recent Experience, by José A. Gómez-Ibáñez
(January 2009)
Electronic copies of the working papers in this series are available online at www.growthcommission.org.
They can also be requested by sending an e-mail to [email protected].
Cover_WP041.indd 2 12/9/2008 4:04:10 PM

Policy Change andEconomic Growth:
A Case Study of South Africa
David FaulknerChristopher Loewald
WORKING PAPER NO.41
www.growthcommission.org
Commission on Growth and Development Montek AhluwaliaEdmar BachaDr. BoedionoLord John Browne Kemal DervisAlejandro FoxleyGoh Chok TongHan Duck-sooDanuta HübnerCarin JämtinPedro-Pablo KuczynskiDanny Leipziger, Vice ChairTrevor ManuelMahmoud MohieldinNgozi N. Okonjo-IwealaRobert RubinRobert SolowMichael Spence, ChairSir K. Dwight VennerErnesto ZedilloZhou Xiaochuan
The mandate of the Commission on Growth and Development is to gather the best understanding there is about the policies and strategies that underlie rapid economic growth and poverty reduction.
The Commission’s audience is the leaders of developing countries. The Commission is supported by the governments of Australia, Sweden, the Netherlands, and United Kingdom, The William and Flora Hewlett Foundation, and The World Bank Group.
South Africa’s growth experience shows how contrasting growth trends—long-term decline followed by improved growth—pivot around political change,
in this case a transition to democracy. In the decade prior to 1994, South Africa experienced the worst period of economic growth since the end of the Second World War. The proximate causes of slowing growth were trade and fi nancial sanctions in opposition to the Apartheid government, political instability and macroeconomic policy decisions that resulted in higher infl ation, increased uncertainty, and declining investment. Democracy has proved critical for creating the possibility of a peaceful and more stable future and reversing investor sentiment. Political and economic leadership have been essential for improving the country’s growth performance because of the effect on policy formulation, institutional development, regulatory design, and economic vision. Prudent fi scal policy and sound macroeconomic management have been critical factors in creating an environment conducive to growth by stabilizing economic conditions, lowering the user cost of capital, and putting downward pressure on the real exchange rate. This case study provides some insight into a more general perspective on political and economic transition and some of the key macro- and microeconomic policy shifts that help realize a more rapid and sustained growth path.
David Faulkner, ODI fellow; Senior Economist, National Treasury of the Republic of South AfricaChristopher Loewald, Deputy Director-General for Economic Policy, National Treasury of the Republic of South Africa
Cover_WP041.indd 1 12/9/2008 4:03:34 PM