Embed Size (px)
Citation preview
Policy Issues and Prospects for
Ukraine’s Grain Exports
Kateryna G. Schroeder and
William H. Meyers University of Missouri, Columbia
Presentation delivered at the 2013 Annual Meeting of the International Agricultural Trade Research Consortium (IATRC)
Clearwater Beach, FL, December 15-17, 2013

Policy Issues and Prospects for
Ukraine’s Grain Exports
Kateryna G. Schroeder and William H. Meyers
IATRC 2013 Annual Meeting December 16, 2013

Role of Ukraine in World Grain Exports Policy Issues ◦ Land Reform ◦ Farm Structure ◦ Agricultural and Trade Policies ◦ Infrastructure and Marketing Systems ◦ Agricultural Research and Development ◦ Role of Corruption
How does the future look like?
OUTLINE

Dynamics of the Ukrainian net exports of major grains, mln tons
Source: USDA, December 2013
-5
0
5
10
15
20
1991/92
1992/93
1993/94
1994/95
1995/96
1996/97
1997/98
1998/99
1999/00
2000/01
2001/02
2002/03
2003/04
2004/05
2005/06
2006/07
2007/08
2008/09
2009/10
2010/11
2011/12
2012/13
2013/14e
Barley Corn Wheat

Land Reform

Land Reform Evolution
Denationalization Allocation Transfer Functioning land market

Land ownership constraints
Land leasing
Lease model is simple and functions effectively;
Terms typically range from
2 to 25 years; average is 5-15 years; under the law lease term cannot exceed 49 years;
Annual lease rates typically
range from $40-$100/ ha, often paid in kind (crops) (2009 est.)
Land ownership
Moratorium on purchase and sale of agricultural land in place For the first time moratorium
was introduced in 1992 as a part of the Land Code
In 2001 it was introduced as a
separate law till January 2005 However, since 2004, it has
been extended for every 2-3 years. In 2012 it was extended until 2016.
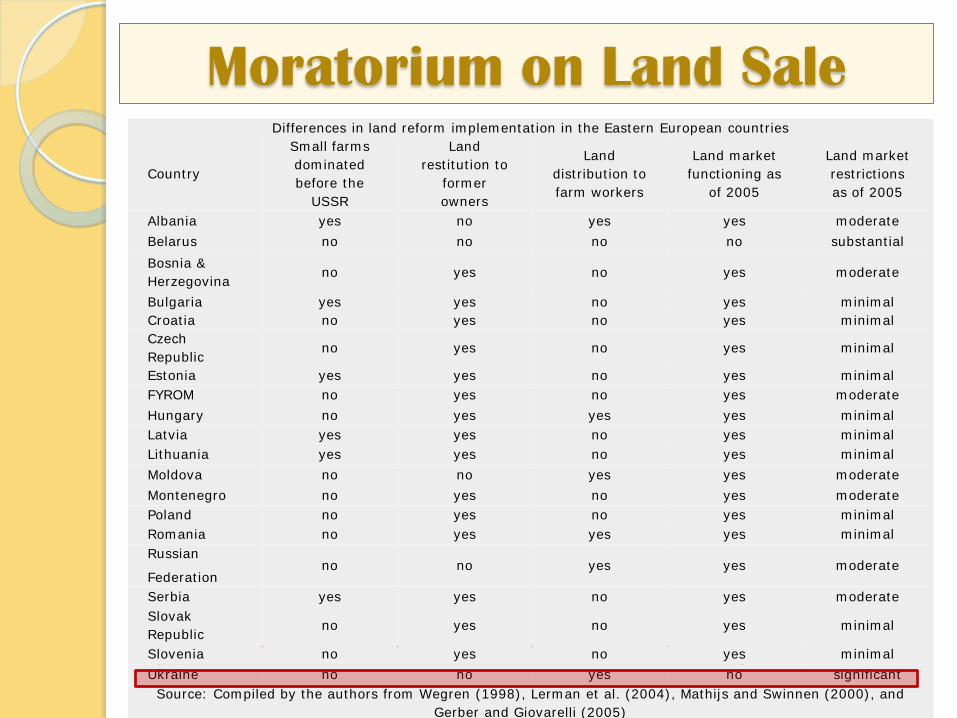
Moratorium on Land Sale Differences in land reform implementation in the Eastern European countries
Country
Small farms dominated before the
USSR
Land restitution to
former owners
Land distribution to farm workers
Land market functioning as
of 2005
Land market restrictions as of 2005
Albania yes no yes yes moderate Belarus no no no no substantial Bosnia & Herzegovina
no yes no yes moderate
Bulgaria yes yes no yes minimal Croatia no yes no yes minimal Czech Republic
no yes no yes minimal
Estonia yes yes no yes minimal FYROM no yes no yes moderate Hungary no yes yes yes minimal Latvia yes yes no yes minimal Lithuania yes yes no yes minimal Moldova no no yes yes moderate Montenegro no yes no yes moderate Poland no yes no yes minimal Romania no yes yes yes minimal Russian
Federation no no yes yes moderate
Serbia yes yes no yes moderate Slovak Republic
no yes no yes minimal
Slovenia no yes no yes minimal Ukraine no no yes no significant Source: Compiled by the authors from Wegren (1998), Lerman et al. (2004), Mathijs and Swinnen (2000), and
Gerber and Giovarelli (2005)

Farm Structure

Source: State Statistics Committee of Ukraine, 2011
Agricultural Enterprises by Number and Size, 2005 – 2008 - 2011
Total, 2011
%, 2011
% change from 2008
% change from 2005
Total area sown
(1,000 ha), 2011
%, 2011
% change from 2008
% change from 2005
Total number of enterprises
44,919 100.0 -6.43 -11.03 19,493.5 100.0 0.17
5.85
Including:
Area < 50 24,464 54.5 -8.49 -14.56 536.9 2.8 0.39 -3.57
50 −100 4,236 9.4 1.46 7.68 309.7 1.6 0.98 6.61
100,01−250,00 4,582 10.2 -6.42 -5.78 749.3 3.8 -6.65 -6.36
250,01−500,00 3,199 7.1 -6.97 -10.92 1153.9 5.9 -6.58 -10.96
500,01−1000,00 2,901 6.5 -5.69 -20.54 2091.9 10.7 -5.67 -20.51
1000,01−2000,00 2,777 6.2 -6.81 -18.28 3976.9 20.4 -6.04 -17.99
2000,01−3000,00 1,322 2.9 -3.86 -2.29 3215.9 16.5 -4.26 -2.36
> 3000,00 1,438 3.2 3.20 35.02 7459.0 38.3 10.15 58.78

Agroholdings Agroholdings – large corporate farms that often cover above
100,000 ha of agricultural land and are vertically integrated with processors and/or exporters.
Agroholdings in Ukraine differ in their location (monoterritorial vs. distributed), degree of vertical integration (the most integrated ones are in sugar industry), and number of integrated enterprises.
The share of agroholdings in total agricultural production amounted to 17.2% in 2010
Indicator June 2010 July 2011
Number of holdings 58 79
Land use, 1000 ha 4005 5200
Average size, 1000 ha 69 66
Source: UCAB study: “Largest agricultural companies of Ukraine”

Why did agroholdings emerge? • Vast availability of cheap fertile land • Sufficient level of infrastructure development • Productive and relatively cheap labor • Preferential terms of agricultural enterprise taxation • Upward trend in international commodity prices • Institutional deficiencies
• A recent study by Deninger et al. (2013)
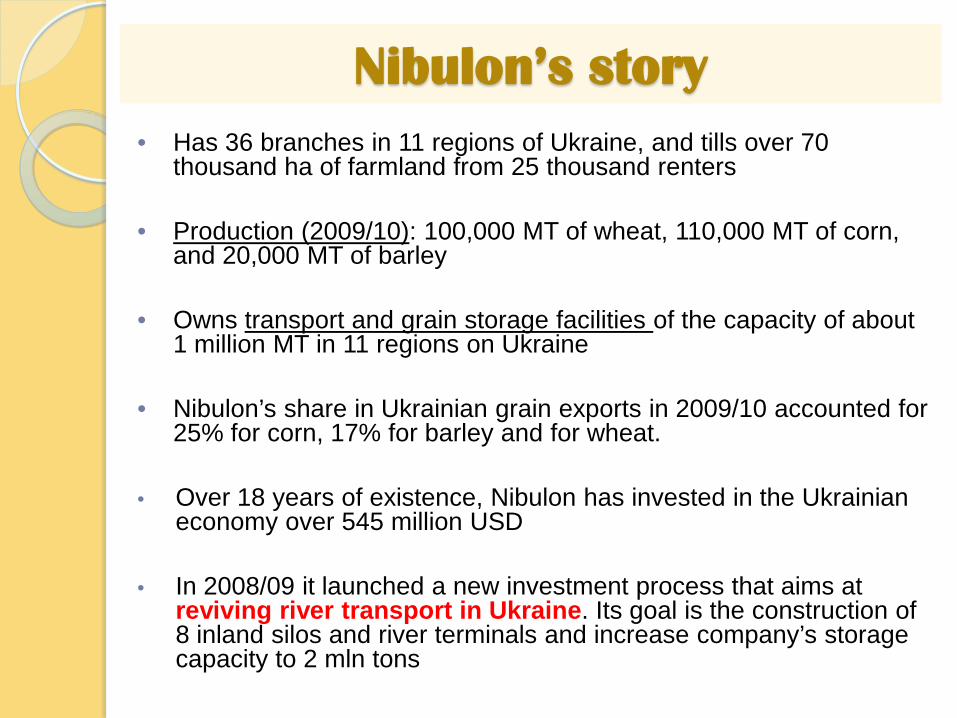
Nibulon’s story • Has 36 branches in 11 regions of Ukraine, and tills over 70
thousand ha of farmland from 25 thousand renters
• Production (2009/10): 100,000 MT of wheat, 110,000 MT of corn, and 20,000 MT of barley
• Owns transport and grain storage facilities of the capacity of about 1 million MT in 11 regions on Ukraine
• Nibulon’s share in Ukrainian grain exports in 2009/10 accounted for 25% for corn, 17% for barley and for wheat.
• Over 18 years of existence, Nibulon has invested in the Ukrainian economy over 545 million USD
• In 2008/09 it launched a new investment process that aims at reviving river transport in Ukraine. Its goal is the construction of 8 inland silos and river terminals and increase company’s storage capacity to 2 mln tons

Agricultural and Trade Policies

Budget transfers
Mechanisms of support
- per hectare payments - partial reimbursements for
the costs of domestically produced machinery and fertilizer
- partial reimbursement of interest rates
- reduction in the cost of insurance premiums
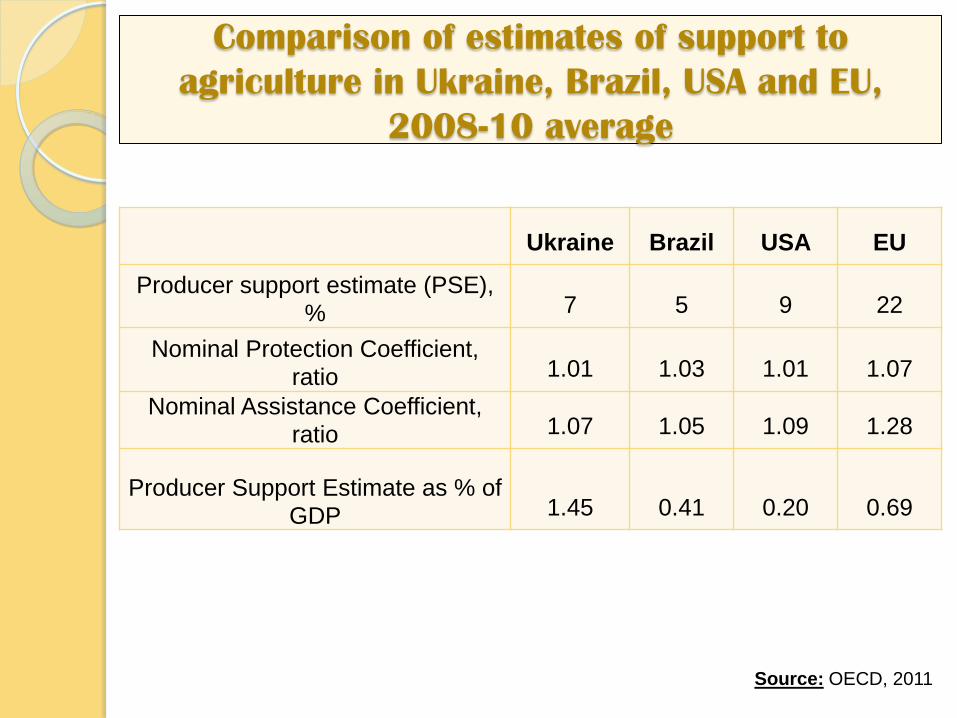
Comparison of estimates of support to agriculture in Ukraine, Brazil, USA and EU,
2008-10 average
Ukraine Brazil USA EU
Producer support estimate (PSE), % 7 5 9 22
Nominal Protection Coefficient, ratio 1.01 1.03 1.01 1.07
Nominal Assistance Coefficient, ratio 1.07 1.05 1.09 1.28
Producer Support Estimate as % of GDP 1.45 0.41 0.20 0.69
Source: OECD, 2011

16 Source: UkrAgroConsult (2013); Kobuta et al. (2012); FAO-EBRD (2010).
Grain Export Policies

Draft law “on agriculture” 1/2012
“The key element of the Draft Law is the system of so-called agricultural passports.
Individual agricultural passports are developed
for five years and contain agricultural production standards as well as the five-year planned production and other targets.”
“Essentially the system of agricultural passports
is a return to the principles of central planning of the Soviet era.” Yulia Ogarenko, APD
Good news – was not implemented

Strategy for the Agricultural Sector Development until 2020

Infrastructure
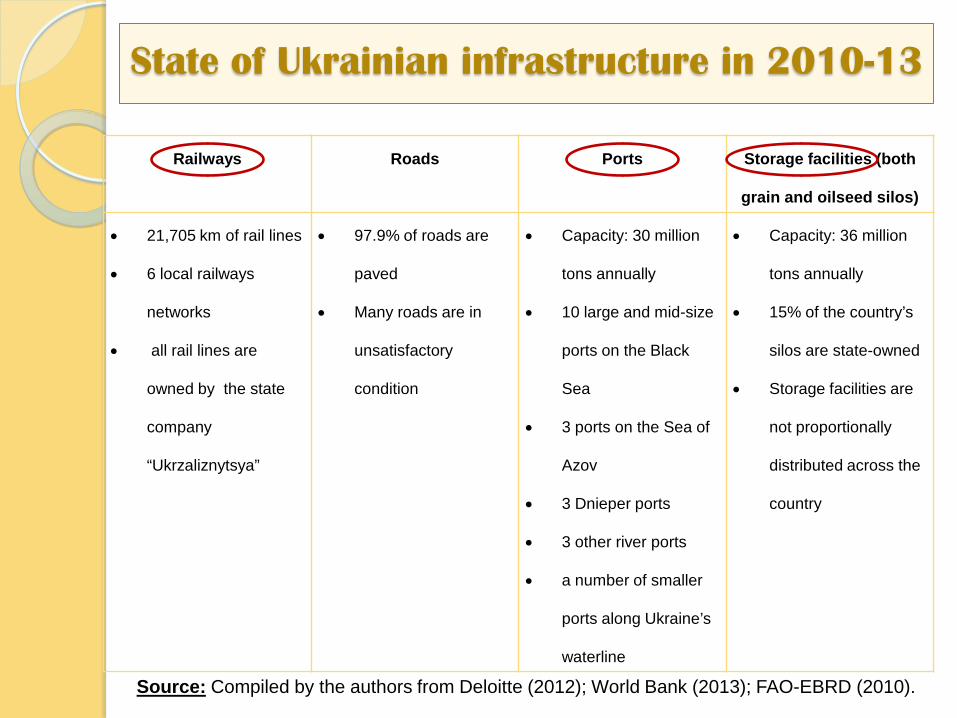
State of Ukrainian infrastructure in 2010-13
Railways Roads Ports Storage facilities (both
grain and oilseed silos)
• 21,705 km of rail lines
• 6 local railways
networks
• all rail lines are
owned by the state
company
“Ukrzaliznytsya”
• 97.9% of roads are
paved
• Many roads are in
unsatisfactory
condition
• Capacity: 30 million
tons annually
• 10 large and mid-size
ports on the Black
Sea
• 3 ports on the Sea of
Azov
• 3 Dnieper ports
• 3 other river ports
• a number of smaller
ports along Ukraine’s
waterline
• Capacity: 36 million
tons annually
• 15% of the country’s
silos are state-owned
• Storage facilities are
not proportionally
distributed across the
country
Source: Compiled by the authors from Deloitte (2012); World Bank (2013); FAO-EBRD (2010).

Corruption in the marketing chain
Tariffs Official Non-official Government inspection services in agriculture
Transportation quality certification (inside the country)
$0.4/mt $1/mt
Transportation quality certification (outside the country) $0.2/mt $1/mt
Storage quality certification $0.07/mt $2/mt Veterinary and phytosanitary inspection services
Phytosanitary certificate $6/mt
$1-2/mt Quarantine certificate $6.5/mt International veterinary certificate for feed grains
$1.85/mt
Regional governments Request to transport grain outside of the region (Vinnytsya and Dnipropetrovsk regions)
- $0.5-1/mt
Trade Department Grain origin certificate - $1/mt
Department of Motor Vehicles Grain transportation - $0.5 – 1.5/mt
Rail Services Obtaining a rail car $3-5/mt
Total $10 – 14.5/mt
Source: newspaper “Ukrainska Pravda”, 11/2013
In 2012/13 Ukraine exported 22.5 mln tons of grain $225-326.26 mln.
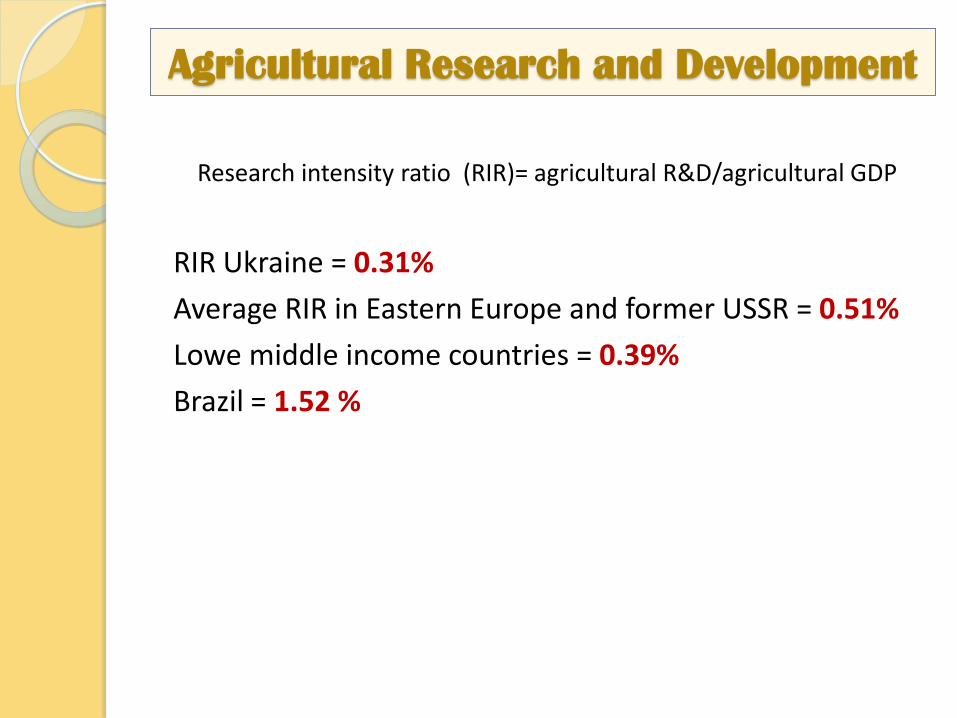
Agricultural Research and Development
Research intensity ratio (RIR)= agricultural R&D/agricultural GDP
RIR Ukraine = 0.31% Average RIR in Eastern Europe and former USSR = 0.51% Lowe middle income countries = 0.39% Brazil = 1.52 %

HOW DOES THE FUTURE
LOOK LIKE?

New Status Quo
The market environment - Higher price and price volatility
Hard Red Wheat and Corn prices, U.S. Gulf, $/mt
Source: FAPRI-MU baseline update, November 2013
0
50
100
150
200
250
300
350
2000 2005 2010 2015 2020
HRW wheat, U.S. Gulf Maize, U.S. Gulf

Source: USDA, 2013
Recovery of Meat Production
0 100 200 300 400 500 600 700 800 900 1000
0
5,000
10,000
15,000
20,000
25,000
30,000
35,000
1991 1992 1993 1994 1995 1996 1997 1998 1999 2000 2001 2002 2003 2004 2005 2006 2007 2008 2009 2010 2011 2012 2013
1000
hea
ds, 1
000
MT 1000 M
T
Poultry Cattle Swine Grain exports (total)

Livestock and poultry growth dynamics in
2012

Human capital

(Slow)Positive trends
Infrastructure development
Growth in investments
Growing role of sector specific
advisory boards and
businesses in policy making

Old style Kernel grain terminal

Nibulon terminal opened 6/2010

Nibulon River barge Loading 7/2012
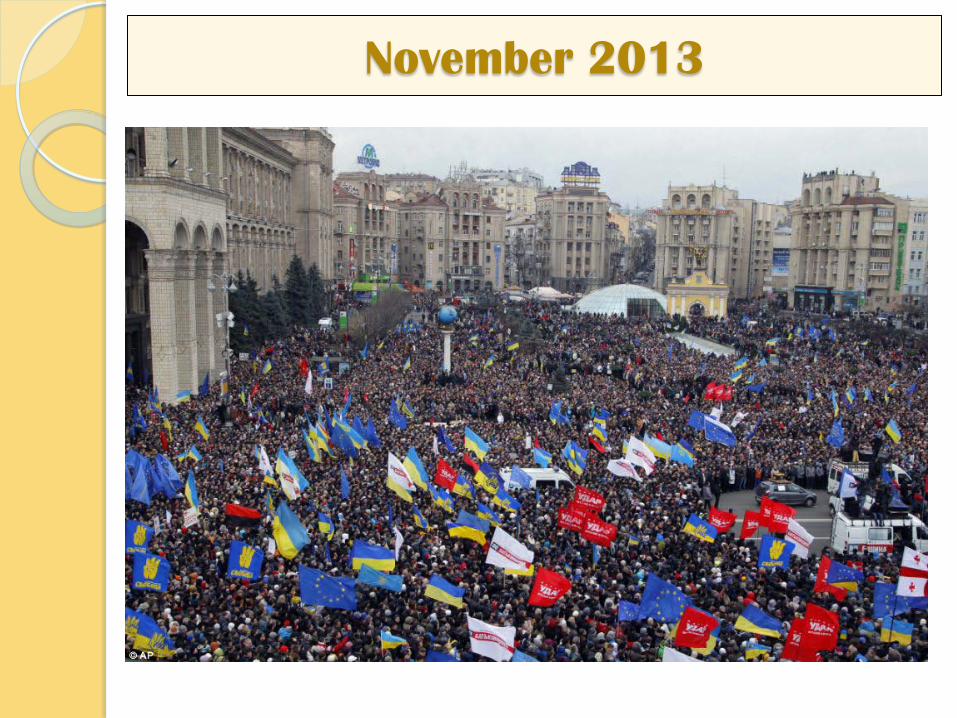
November 2013

Thank you!
Questions?