Embed Size (px)
Citation preview
1
Policy Note Assessing the Bolsa da Mãe Benefit Structure1
A Preliminary Analysis
June 2015
Executive Summary
The Bolsa da Mãe program is currently the only program in Timor-Leste that targets poor
and vulnerable households with children. The objectives of the program are to help reduce
poverty, promote attendance of nine years of compulsory basic education, and increase utilization
of primary health care services. In order for households to receive program benefits, they must
comply with soft conditions related to education and health. The program provides cash transfers
of US$5 per child per month for up to three children, so US$15 is the maximum grant amount a
household can receive per month.
Since its launch in 2008, the Bolsa da Mãe program has expanded significantly to provide
assistance to the poor nationwide. The program initially covered only 7,051 households, but in
2014, the program provided a cash transfer to 55,488 vulnerable households. In line with the
government’s commitment to address the risks and vulnerabilities faced by households with
children, the budget allocation for the program has increased to support program expansion.
Currently, the total budget for cash transfers is US$9 million, which accounts for 6 percent of the
total Ministry for Social Solidarity budget approved for 2014.
Nonetheless, a 2013 World Bank report showed that the allocation for the Bolsa da Mãe
program comprised only 2 percent of the total social assistance budget and achieved a
negligible reduction in national poverty. The small estimated poverty impact raises questions
about program performance. Findings of the report indicate that the size of the program benefit—
estimated at 3.5 percent of the average total household budget for households in the lowest
quintile2—is too low to affect household welfare status. In addition, about 40 percent of the
beneficiaries were estimated to be non-poor.
In light of the government’s interest in improving the adequacy of the grant and its poverty
impacts, this policy note reviews the benefit size and structure of the Bolsa da Mãe program. After a brief overview of the Bolsa da Mãe program, the note discusses the cash transfer size and
its adequacy, drawing on evidence from other conditional cash transfer (CCT) programs
worldwide. Addressing income poverty is not the only or even the main objective of the Bolsa da
Mãe program as improving health and education are as important or more important objectives of
the program. However, since we do not have the data to conduct program impact simulations of
health and education indicators, we only conduct simulations of the program’s impact on household
expenditures of beneficiary households. Assuming the current design and a full compliance rate
(Box 1), this note presents findings from a simulation exercise conducted to present alternative
scenarios for the benefit size of the program and its potential impact on poverty and resulting budget
implications.
1 This policy note was prepared by Rita Fernandes with inputs from Junko Onishi and Tatiana Sviridova (Social Protection & Labor,
The World Bank). Funding of this study was provided by the Trust Fund between the World Bank and Australian Government
Department of Foreign Affairs and Trade. Technical guidance and oversight was provided by Jehan Arulpragasam (Social Protection & Labor, The World Bank). The note benefited from evidence that resulted from a close collaboration with the Ministry for Social
Solidarity, in particular the National Directorate for Social Reinsertion. It also draws heavily from the findings and recommendations of the Timor-Leste Social Assistance Public Expenditure and Program Performance Report published in 2013. 2 According to the households’ reports BdM beneficiary households received on average 6.6 USD per month for the household. This is 2.9 percent of the poverty line.
2
Box 1 – Simulation assumptions
Current program design provides an average grant amount of US$ 12 per household, not taking into account how many children below age 18 are in the household
Two assumptions were made: first that the program covers from the poorest to less poor by saturating coverage
starting from the poorest (estimating the minimum impact on poverty incidence); and secondly that the program covers from the households just below the poverty line and covers all the subsequently poor households until the
beneficiary household quota based on the scenario is saturated (estimating the maximum impact on poverty
incidence) Poor households defined by the number of households with children living on less than US$1.25 dollar a day
(BdM official poverty line based on the TL-SPS and HIES 2011)
Eligible beneficiaries receive the suggested grant amount and use it for consumption
20 percent leakage (80 percent targeting success) means that 20 percent of the beneficiaries are non-poor
Findings of the simulation3 suggest that increasing the average monthly grant amount could
have a significant impact in helping the program meet its objective of reducing poverty.
Raising the Bolsa da Mãe transfer amount from the current 5.3 percent of the total household budget
at the poverty line4 to at least 10 percent (or from 7.8 percent of the total household expenditure of
the poor to at least 15 percent), increasing the current average monthly transfer of US$12 per
household to an average monthly grant amount of US$23 per household, could help to reduce
poverty gap5 by between 19 percent to 22 percent and poverty incidence by up to 11 percent
(between 0 percent and 11 percent). The range is due to the fact that the poverty impact simulation
depends on who we assume is enrolled in the program among the poor. When targeting is successful
in identifying the poorest households and covers them first, then the program impact in terms of
reducing poverty incidence is small as very poor households cannot escape poverty with a monthly
grant of US$23. However, if the program identifies poor households but just below the poverty
line, they can be alleviated from poverty with the grant amount as they were already close to the
poverty line. The difference is also evident in the impact on poverty gap. By enrolling the very poor
first, the average welfare level of the poor is raised and therefore the reduction in poverty gap is
larger, while enrolling households that are already close to the poverty line reduces the poverty gap
by less. Again, this only simulates the potential impact on the poverty alleviation objective of the
program due to data constraints but the program is expected to also have strong impacts on health
and education indicators. These indicators include: school enrollment, school attendance, use of
preventive health services such as childhood immunization, and participation in growth monitoring
sessions.
3 This analysis presented in this note is based on the analysis of HIES 2011. HIES 2011 is understood to have had some
underreporting of consumption of certain categories as noted in detail in HIES Briefing Note 17 Dec 2013 (MOF). The underreporting, as noted in the Briefing Note most occurred among the households with higher levels of income, and potentially on
non-food items. Since this note describes the impact on poor households, the underreporting of non-food items among the high income
households most likely has little effects on this current analysis. Nevertheless, it is recommended that the simulations are redone when the new data is available in 2015, applying the new poverty threshold. The extent of the difference of the simulation results based on the reanalysis with the new 2015 data is unknown. 4 The analysis applies the Bolsa da Mae program poverty line of USD 1.25 per capita per day as referenced in the Ministerial Diploma
N°27 of 19 September 2012. The USD 1.25 per capita per day poverty line was based on the official poverty line at the time the
Ministerial Diploma was issued. It is recommended that the simulations are redone when the new data is available in 2015, applying the new poverty threshold. 5 Poverty gap provides information regarding how far off households are from the poverty line. The non-poor households have a poverty gap of 0.
3
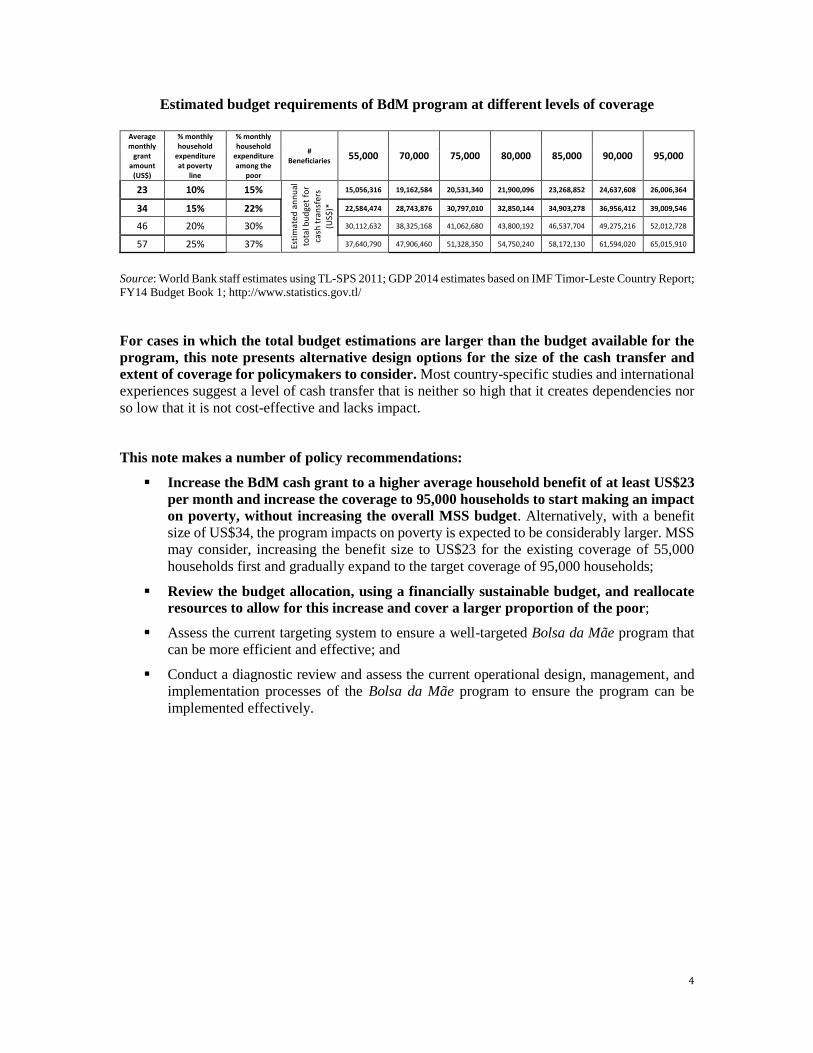
Based on this scenario, a total budget for cash grants equal to US$26 million could benefit
about 95,000 households. This number of beneficiary households corresponds to the estimated
number of poor households with children in Timor-Leste. The required budget for cash transfers
means approximately 1.5 percent of the total government budget in 2014, 1.4 percent of non-oil
GDP and 0.7 percent of oil GDP in 2014.
Simulated potential poverty impact
Average monthly
grant amount
per household
% monthly household
expenditures at poverty
line
% monthly household
expenditure among the
poor
Coverage level
(# households)
Poverty
incidence
reduction
Poverty gap
reduction
Estimated
annual total
budget
(excluding
admin costs)
% of
non-oil
GDP
% of oil
GDP
% of total
governme
nt budget
US$23 10% 15% 95,000 0% to -11% -19% to -22% 26 million 1.4% 0.7% 1.5%
US$34 15% 22% 95,000 -2% to -18% - 27% to -32% 39 million 2.1% 1.0% 2.3%
US$46 20% 30% 95,000 -8% to -26% -34% to -43% 52 million 2.7% 1.4% 3.1%
The note also analyzes the tradeoffs involved in different scenarios in terms of average
monthly cash transfers, budget requirements, program coverage, and corresponding poverty
impact. In assuming that the current number of beneficiaries is maintained (approximately 55,000)
and that a certain degree of leakage occurs, the impact simulation indicates that the major
improvement would occur in the poverty gap. The simulation found that with the coverage of
55,000 beneficiaries and an average monthly transfer of US$23 per household, there will be a
poverty gap reduction between 10 and 12 percent and poverty incidence reduced up to 11 percent
(between 0 and 11 percent). Up to 18 percent reduction in poverty incidence could be achieved by
increasing the monthly average benefit levels to US$34 per household, which would require a total
budget for cash transfers of US$22.5 million (equivalent to 1.3 percent of total government budget
in 2014, 1.2 percent of non-oil GDP and 0.6 percent of oil GDP). Simulations indicate that
increasing current program coverage to a higher number of beneficiaries and providing an average
monthly cash transfer per household of US$23-34 (which is more in line with international
standards) would require a higher budget for BdM cash transfers to obtain welfare improvements
as shown in the table below.
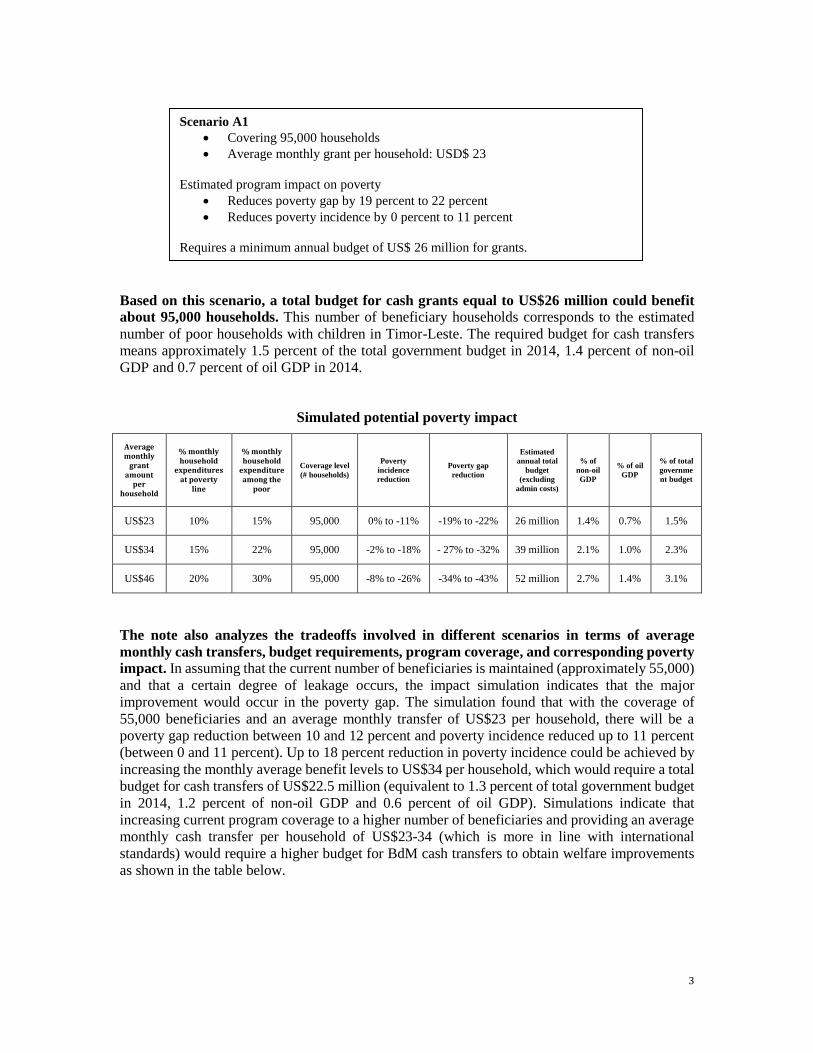
Scenario A1
Covering 95,000 households
Average monthly grant per household: USD$ 23
Estimated program impact on poverty
Reduces poverty gap by 19 percent to 22 percent
Reduces poverty incidence by 0 percent to 11 percent
Requires a minimum annual budget of US$ 26 million for grants.
4
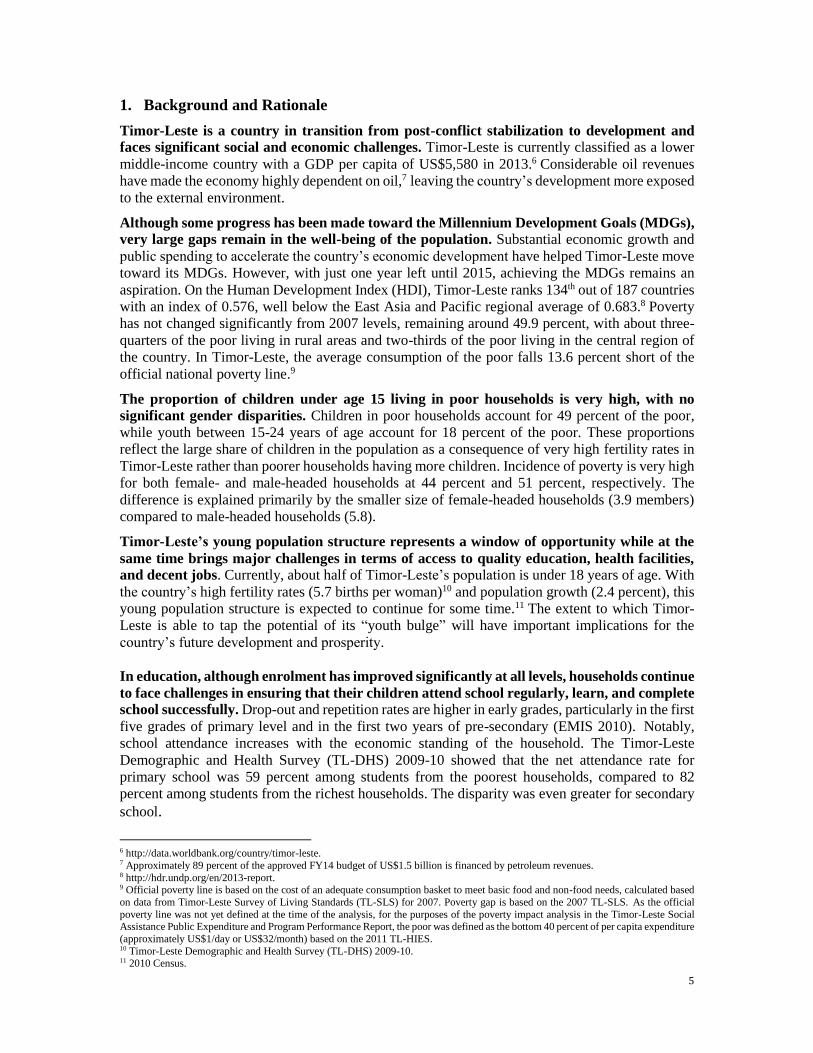
Estimated budget requirements of BdM program at different levels of coverage
Average monthly
grant amount
(US$)
% monthly household
expenditure at poverty
line
% monthly household
expenditure among the
poor
# Beneficiaries
55,000 70,000 75,000 80,000 85,000 90,000 95,000
23 10% 15%
Esti
mat
ed a
nn
ual
tota
l bu
dge
t fo
r
cash
tra
nsf
ers
(US$
)*
15,056,316 19,162,584 20,531,340 21,900,096 23,268,852 24,637,608 26,006,364
34 15% 22% 22,584,474 28,743,876 30,797,010 32,850,144 34,903,278 36,956,412 39,009,546
46 20% 30% 30,112,632 38,325,168 41,062,680 43,800,192 46,537,704 49,275,216 52,012,728
57 25% 37% 37,640,790 47,906,460 51,328,350 54,750,240 58,172,130 61,594,020 65,015,910
Source: World Bank staff estimates using TL-SPS 2011; GDP 2014 estimates based on IMF Timor-Leste Country Report;
FY14 Budget Book 1; http://www.statistics.gov.tl/
For cases in which the total budget estimations are larger than the budget available for the
program, this note presents alternative design options for the size of the cash transfer and
extent of coverage for policymakers to consider. Most country-specific studies and international
experiences suggest a level of cash transfer that is neither so high that it creates dependencies nor
so low that it is not cost-effective and lacks impact.
This note makes a number of policy recommendations:
Increase the BdM cash grant to a higher average household benefit of at least US$23
per month and increase the coverage to 95,000 households to start making an impact
on poverty, without increasing the overall MSS budget. Alternatively, with a benefit
size of US$34, the program impacts on poverty is expected to be considerably larger. MSS
may consider, increasing the benefit size to US$23 for the existing coverage of 55,000
households first and gradually expand to the target coverage of 95,000 households;
Review the budget allocation, using a financially sustainable budget, and reallocate
resources to allow for this increase and cover a larger proportion of the poor;
Assess the current targeting system to ensure a well-targeted Bolsa da Mãe program that
can be more efficient and effective; and
Conduct a diagnostic review and assess the current operational design, management, and
implementation processes of the Bolsa da Mãe program to ensure the program can be
implemented effectively.
5
1. Background and Rationale
Timor-Leste is a country in transition from post-conflict stabilization to development and
faces significant social and economic challenges. Timor-Leste is currently classified as a lower
middle-income country with a GDP per capita of US$5,580 in 2013.6 Considerable oil revenues
have made the economy highly dependent on oil,7 leaving the country’s development more exposed
to the external environment.
Although some progress has been made toward the Millennium Development Goals (MDGs),
very large gaps remain in the well-being of the population. Substantial economic growth and
public spending to accelerate the country’s economic development have helped Timor-Leste move
toward its MDGs. However, with just one year left until 2015, achieving the MDGs remains an
aspiration. On the Human Development Index (HDI), Timor-Leste ranks 134th out of 187 countries
with an index of 0.576, well below the East Asia and Pacific regional average of 0.683.8 Poverty
has not changed significantly from 2007 levels, remaining around 49.9 percent, with about three-
quarters of the poor living in rural areas and two-thirds of the poor living in the central region of
the country. In Timor-Leste, the average consumption of the poor falls 13.6 percent short of the
official national poverty line.9
The proportion of children under age 15 living in poor households is very high, with no
significant gender disparities. Children in poor households account for 49 percent of the poor,
while youth between 15-24 years of age account for 18 percent of the poor. These proportions
reflect the large share of children in the population as a consequence of very high fertility rates in
Timor-Leste rather than poorer households having more children. Incidence of poverty is very high
for both female- and male-headed households at 44 percent and 51 percent, respectively. The
difference is explained primarily by the smaller size of female-headed households (3.9 members)
compared to male-headed households (5.8).
Timor-Leste’s young population structure represents a window of opportunity while at the
same time brings major challenges in terms of access to quality education, health facilities,
and decent jobs. Currently, about half of Timor-Leste’s population is under 18 years of age. With
the country’s high fertility rates (5.7 births per woman)10 and population growth (2.4 percent), this
young population structure is expected to continue for some time.11 The extent to which Timor-
Leste is able to tap the potential of its “youth bulge” will have important implications for the
country’s future development and prosperity.
In education, although enrolment has improved significantly at all levels, households continue
to face challenges in ensuring that their children attend school regularly, learn, and complete
school successfully. Drop-out and repetition rates are higher in early grades, particularly in the first
five grades of primary level and in the first two years of pre-secondary (EMIS 2010). Notably,
school attendance increases with the economic standing of the household. The Timor-Leste
Demographic and Health Survey (TL-DHS) 2009-10 showed that the net attendance rate for
primary school was 59 percent among students from the poorest households, compared to 82
percent among students from the richest households. The disparity was even greater for secondary
school.
6 http://data.worldbank.org/country/timor-leste. 7 Approximately 89 percent of the approved FY14 budget of US$1.5 billion is financed by petroleum revenues. 8 http://hdr.undp.org/en/2013-report. 9 Official poverty line is based on the cost of an adequate consumption basket to meet basic food and non-food needs, calculated based
on data from Timor-Leste Survey of Living Standards (TL-SLS) for 2007. Poverty gap is based on the 2007 TL-SLS. As the official
poverty line was not yet defined at the time of the analysis, for the purposes of the poverty impact analysis in the Timor-Leste Social Assistance Public Expenditure and Program Performance Report, the poor was defined as the bottom 40 percent of per capita expenditure
(approximately US$1/day or US$32/month) based on the 2011 TL-HIES. 10 Timor-Leste Demographic and Health Survey (TL-DHS) 2009-10. 11 2010 Census.
6
Low levels of educational attainment and literacy raise concerns for the future prospects of
Timor-Leste’s young population. The Census conducted in 2010 found that most young people
in their 20s had completed less than secondary education. Even among the cohort of youth 15-19
years of age, which has the lowest illiteracy rate compared to other age groups, 19.9 percent are
still not able to read and write12 (Census 2010). Early school leavers or young people who have
never been to school are more likely to be trapped in low-skilled, low-paid work or cannot find
work at all, leaving them trapped in poverty.
The evidence clearly shows that higher educational attainment is an important pathway out
of poverty in Timor-Leste. Evidence based on the TL-HIES 2009-10 indicates that youth
employed with better education earn more money. The majority of people with university-level
education earn 3-4 times more than the ones with primary or pre-secondary education (NSD-MOF,
2012). Women lag behind, particularly for secondary and tertiary education. Evidence also shows
that among the adult population, poverty incidence decreases rapidly at higher levels of educational
attainment: around 50 percent of those with primary education are poor, compared to 39 percent of
those with pre-secondary, 34 percent of those with secondary, and 18 percent of those with tertiary
education (WB and DNE, 2008). Becoming better-educated can help individuals escape from
poverty by developing the skills necessary to improve their livelihoods and can generate
productivity gains (UNESCO, 2013).
At the same time, keeping children healthy and well-nourished has been very challenging in
Timor-Leste. According to the Global Hunger Index which measures national hunger as a
percentage of the population, Timor-Leste ranked 75th among the 81 countries surveyed (IFPRI,
2011). The Timor-Leste Food and Nutrition Survey 2013 (TLFNS) revealed very high rates of
stunting (50.2 percent), wasting (11 percent), and underweight (37.7 percent) among children 0-59
months of age. Despite improvements in these indicators compared with the 2009/2010 TLDHS,13
Timor-Leste continues to have the highest childhood malnutrition rates in the East Asia and Pacific
region.
Immunization coverage in Timor-Leste is also among the poorest in Asia. According to the
TLFNS 2013, 86.5 percent of children had received complete basic immunization, 85.2 percent had
visited health services during a recent illness, 38.8 percent were dewormed, and 53.2 percent had
received Vitamin A supplements.
Maternal mortality in Timor-Leste is among the highest in the world at 557 deaths per
100,000 live births (2009-10 TLDHS). Most births (78 percent) are still delivered at home and are
not assisted by health professionals, and delivery at a health facility is significantly higher among
mothers in the highest wealth quintiles. The TLFNS 2013 shows slight improvements in the seeking
of professional maternal and neonatal care. Around 87 percent of mothers received antenatal care
during their last pregnancy.
Poor maternal and child health as well as childhood malnutrition carry very high health care
costs and productivity losses, which increase as children become older. Studies suggest that
early childhood malnutrition is linked to poorer socioeconomic outcomes in adulthood with major
implications for human capital, including fewer years of schooling and reduced income levels
(Victoria et al., 2008). Despite the lack of available data to estimate costs related to preventive
12 19.9 percent for young people aged 15-19, compared to 22.1 percent for young people aged 20-24 and 27.3 percent for young people
aged 25-29. 13 TLDH shows that stunting increased from 49 percent to 53 percent, underweight from 46 percent to 52 percent, and wasting from 12 percent to 17 percent between 2003 and 2009.
7
healthcare, preliminary findings from an economic burden of malnutrition study in Timor-Leste14
conducted by Bagriansky suggests that the burden on the country’s economy may be approximately
US$73.5 million annually, representing 1.6 percent of GDP or 3.5 percent of non-oil GDP. The
vast majority of this annual loss represents a net present value (NPV) of future losses due to
mortality and consequent lost future work and productivity of today’s children.
To address these challenges, the Government of Timor-Leste through the Ministry of Social
Solidarity (MSS) has introduced social safety nets such as the Bolsa da Mãe (BdM) program,
aimed at helping the most vulnerable households break out of the intergenerational poverty
trap. By early 2008, the government started the first cash transfer programs to address the urgent
needs of the vulnerable population and help ensure stability after the 2006 outbreak of violence and
social crisis. In March 2008, the MSS launched the BdM conditional cash transfer (CCT) program,
which aimed to support single and widowed mothers with children. The program initially covered
only 7,051 households but has expanded considerably since then, providing assistance to 55,488
households nationwide in 2014.
The BdM program is currently the only program that targets poor and vulnerable households
with children. The objectives of the BdM program are to help reduce poverty, promote attendance
of nine years of compulsory basic education, and increase utilization of primary health care
services. It provides cash transfers of US$5 per child per month for up to three children, so US$15
is the maximum grant amount a household can receive per month. In order for households to receive
the transfers, they must comply with soft conditions on education (school enrolment, attendance)
and health (pre-natal visits, vaccinations, health check-ups).
Since the program’s inception, some adjustments have been made to improve the design and
implementation of the BdM program. After a year of implementation, the MSS carried out the
first assessment of the program and made efforts to improve implementation based on what they
had learned from a study tour to Brazil on the Bolsa Família CCT program. The UNDP provided
additional technical support for improving the design and implementation of the BdM program,
focused on the identification of beneficiaries, design of the monitoring tools for verification of
conditions, design of the beneficiary database, and support in drafting the legal framework.
Adjustments to the program continued until the beginning of 2012, when policy changes to the
program were operationalized and reflected in the law.15
However, a 2013 World Bank report showed that the budget allocation for the BdM program
is relatively small, and the program has achieved a negligible reduction in national poverty.
Although the budget allocation for social assistance programs has increased over time, the
allocation for the BdM program comprised only 2 percent of the total social assistance budget in
2012 (World Bank, 2013). The report also showed that core social assistance programs (i.e. the
BdM program, elderly social pensions, and disability pensions) contributed to a very small
reduction in poverty (5 percentage points), exclusively owing to the elderly social pension.
The small estimated poverty impacts of the BdM program can be explained partly by
problems of coverage and leakage. Data from the Timor-Leste Social Protection Survey (SPS)
2011 and Household Income and Expenditure survey (HIES) 201116 suggest that program affect
14 Twelve nutrition indicators (low body mass index, low height, anemia, sub-optimal breastfeeding, wasting, underweight, vitamin A
deficiency, zinc deficiency, stunting, anemia, working age women and working age men) for four risk groups (pregnant women, child 6-24 months, child under 5 years old, and adults) via four pathways (mortality, cognition & growth, higher morbidity, and adult work
deficits) were considered to assess the magnitude of consequences. 15 A Decree-Law was approved in April 2012, followed by a Ministerial Diploma in September 2012. 16 This analysis presented in this note is based on the analysis of HIES 2011. HIES 2011 is understood to have had some
underreporting of certain categories as noted in detail in HIES Briefing Note 17 Dec 2013 (MOF). The underreporting, as noted in the
Briefing Note most occurred among the households with higher levels of income, and potentially on non-food items. Since this note describes the impact on poor households, the underreporting of non-food items among the high income households most likely has
little effects on this current analysis. Nevertheless, it is recommended that the simulations are redone when the new data is
8
around 2.2 percent of the population, which is too low relative to the size of eligible population.
The BdM program is also not reaching the intended beneficiaries, as 40 percent of the beneficiaries
were estimated to be non-poor.17
The low level of benefits also limits the poverty impacts of the program. World Bank (2013)
suggested that the size of the BdM benefit, estimated at 3.5 percent of the average total household
budget for households in the bottom 20 percent18, is too low to affect household welfare status. The
program is the least generous compared to other cash transfers in Timor-Leste and also less
generous when compared to other CCT programs around the world where grants provided are about
to 10-15 percent of the average income of poor households. Notably, despite increases in the cost
of living since 2008,19 the nominal benefit amount has never been revised.
In light of the government’s interest in improving the adequacy of the grant and its poverty
impacts, this policy note reviews the benefit size and structure of the BdM program. Section
2 provides an overview of the BdM program, describing the basic design parameters, program
coverage, and budget allocation. Section 3 then discusses the cash transfer size and its adequacy.
Section 4 simulates alternative scenarios for the BdM benefit size and its potential impact on
poverty and resulting budget implications. Finally, key policy recommendations are presented in
Section 5.
2. Overview of the Bolsa da Mãe Program
This section describes the current program design parameters, coverage, budget and trends since
the inception of the program, and how these compare with other CCT programs worldwide.
Basic design parameters
Potential BdM beneficiaries are identified through a qualitative scoring method to assess
vulnerability based on information provided by applicants to the program. Social Animators
who are field-based MSS facilitators collect information from applicants (e.g., basic personal
information, household location, household composition, self-reported household income and
assets) through application forms and submit them to the district focal points, where data is entered
into a web-based management information system (MIS) which is linked to a central MIS platform
for Social Assistance (SIGAS—Sistema de Informação de Gestão da Assistência Social). All
applications are verified for eligibility in terms of citizenship (applicants must be Timorese citizens
and have lived in the country for at least the one year prior to the application date), age (17 years
old or above), presence of children (have at least one child under 18 years old), and vulnerability
status.
The qualitative vulnerability assessment creates a score for all applicants based on (i) self-
reported income, (ii) number of children, (iii) type of caregivers, and (iv) number of children
with disabilities. All four components are weighted equally and have a maximum score of 25
percent, i.e. an applicant can reach a maximum of 100 percent. As shown in Table 1, the maximum
income for eligibility is set at a fixed annual per capita household income of US$456.25, which
corresponds to the official poverty line of US$1.25 per capita per day. Single-parent or equivalent,
households with three or more children, and households with two or more children with physical
available in 2015, applying the new poverty threshold. The extent of the difference of the simulation results based on the reanalysis with the new 2015 data is unknown. 17 Beneficiaries spending US$32 or more per month. 18 According to the households’ reports BdM beneficiary households received on average 6.6 USD per month for the household. This is 2.9 percent of the poverty line. 19 https://www.mof.gov.tl/wp-content/uploads/2013/07/Inflation_Paper.pdf; http://data.worldbank.org/indicator/FP.CPI.TOTL.ZG
9
or mental disability are scored as the most vulnerable. Eligible beneficiaries are then ranked by
vulnerability score in order to prioritize the most vulnerable households.
Table 1 – Vulnerability criteria for BdM
Vulnerability Scale Score
Household
economic situation
(per capita annual
income)
Between US$300-US$456.25 6.25%
Between US$200-US$300 12.5%
Between US$100-US$200 18.75%
Less than US$100 25%
Caregivers
Single parent or equivalent 25%
Children
One child 12.5%
Two children 18.75%
Three or more children 25%
Children with
disabilities
One child with disabilities 12.5%
Two or more children with
disabilities
25%
Source: Ministerial Diploma N°27 of 19 September 2012
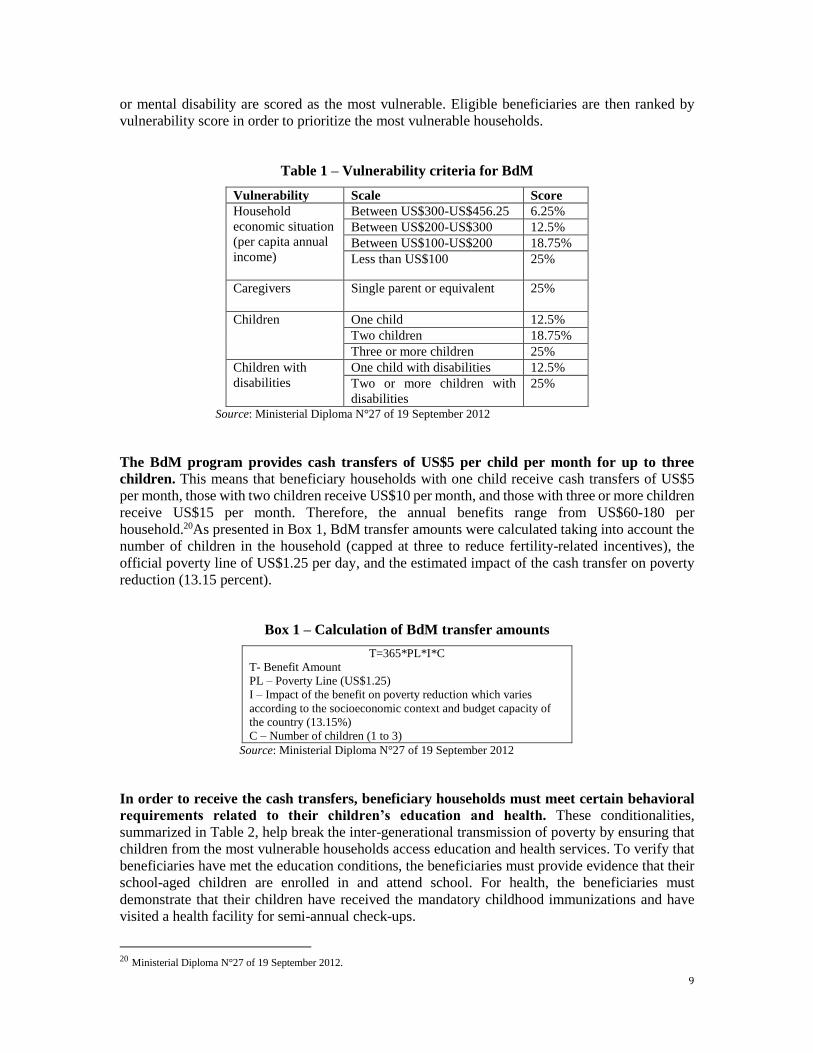
The BdM program provides cash transfers of US$5 per child per month for up to three
children. This means that beneficiary households with one child receive cash transfers of US$5
per month, those with two children receive US$10 per month, and those with three or more children
receive US$15 per month. Therefore, the annual benefits range from US$60-180 per
household.20As presented in Box 1, BdM transfer amounts were calculated taking into account the
number of children in the household (capped at three to reduce fertility-related incentives), the
official poverty line of US$1.25 per day, and the estimated impact of the cash transfer on poverty
reduction (13.15 percent).
Box 1 – Calculation of BdM transfer amounts
T=365*PL*I*C
T- Benefit Amount
PL – Poverty Line (US$1.25)
I – Impact of the benefit on poverty reduction which varies
according to the socioeconomic context and budget capacity of
the country (13.15%)
C – Number of children (1 to 3)
Source: Ministerial Diploma N°27 of 19 September 2012
In order to receive the cash transfers, beneficiary households must meet certain behavioral
requirements related to their children’s education and health. These conditionalities,
summarized in Table 2, help break the inter-generational transmission of poverty by ensuring that
children from the most vulnerable households access education and health services. To verify that
beneficiaries have met the education conditions, the beneficiaries must provide evidence that their
school-aged children are enrolled in and attend school. For health, the beneficiaries must
demonstrate that their children have received the mandatory childhood immunizations and have
visited a health facility for semi-annual check-ups.
20 Ministerial Diploma N°27 of 19 September 2012.
10
Table 2 - The BdM Conditionalities
Education Health Community
Development
Sessions
Enroll all children aged 6-17
in school
Guarantee at least 80%
minimum school attendance
for all school-aged children
Children aged 0-1 years old
receive all mandatory
vaccines
Children aged 0-5 years old
visit the nearest health
center to receive regular
health check-ups every 6
months
Beneficiaries
participate in
community
development
sessions
In addition, requirements for beneficiary participation in community development sessions
will be introduced. These sessions are currently being designed to address the need for
improvements in beneficiaries’ behavior change and practices. Child health, child nutrition,
parenting education, and family planning are examples of suggested areas to be included in the
community development sessions.
Notably, the BdM conditionalities are “soft” conditionalities. Despite having conditionalities in
place, the program has struggled to monitor beneficiary compliance due to lack of MSS
administrative capacity. Therefore, these conditionalities are soft conditionalities, meaning that
there are no consequences in terms of payment if beneficiaries do not comply.
Program coverage
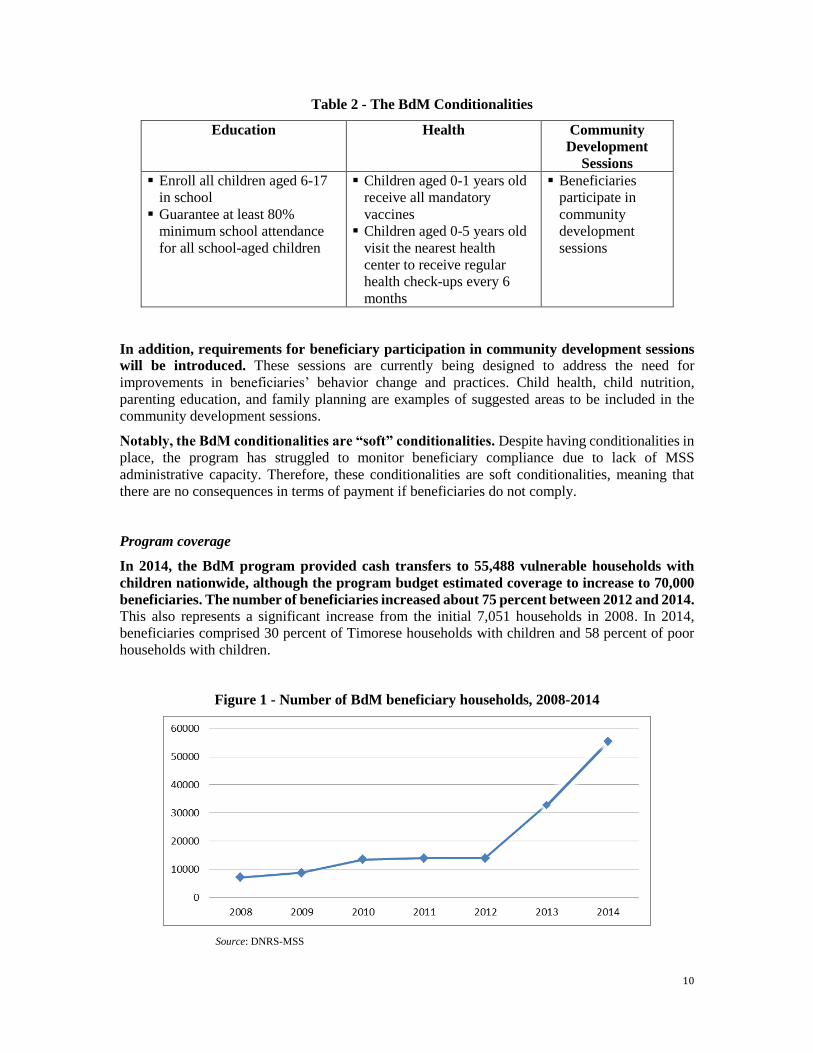
In 2014, the BdM program provided cash transfers to 55,488 vulnerable households with
children nationwide, although the program budget estimated coverage to increase to 70,000
beneficiaries. The number of beneficiaries increased about 75 percent between 2012 and 2014.
This also represents a significant increase from the initial 7,051 households in 2008. In 2014,
beneficiaries comprised 30 percent of Timorese households with children and 58 percent of poor
households with children.
Figure 1 - Number of BdM beneficiary households, 2008-2014
Source: DNRS-MSS
11
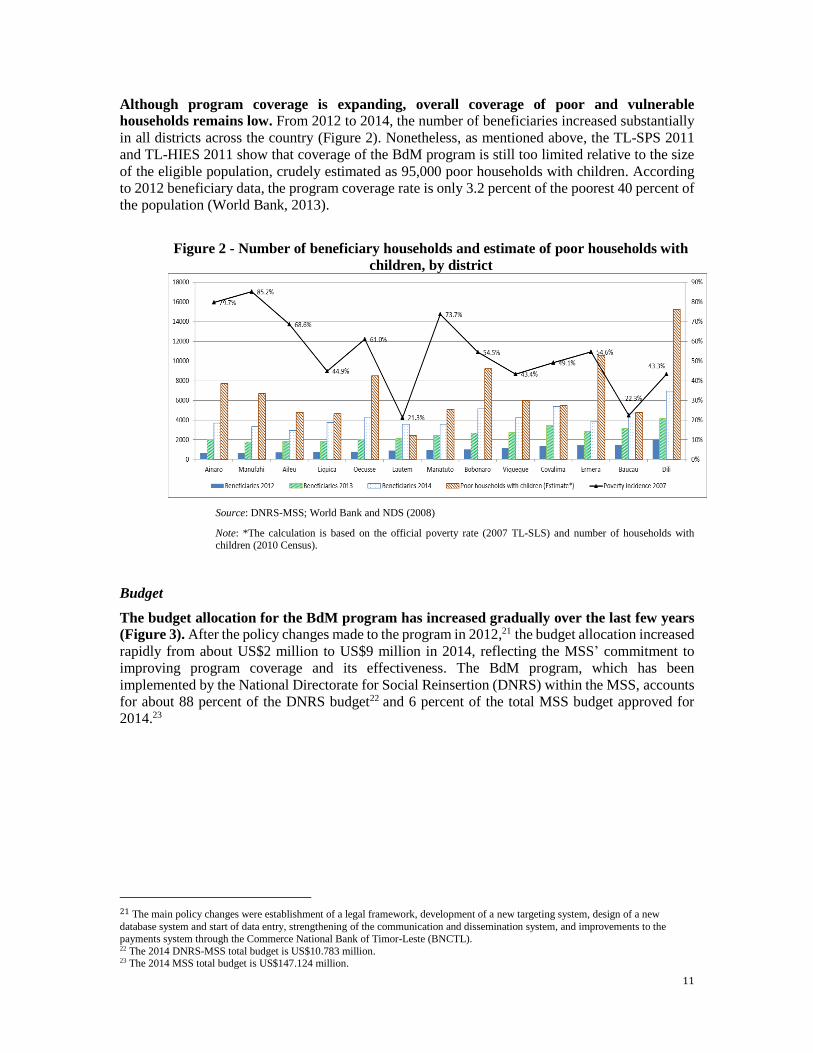
Although program coverage is expanding, overall coverage of poor and vulnerable
households remains low. From 2012 to 2014, the number of beneficiaries increased substantially
in all districts across the country (Figure 2). Nonetheless, as mentioned above, the TL-SPS 2011
and TL-HIES 2011 show that coverage of the BdM program is still too limited relative to the size
of the eligible population, crudely estimated as 95,000 poor households with children. According
to 2012 beneficiary data, the program coverage rate is only 3.2 percent of the poorest 40 percent of
the population (World Bank, 2013).
Figure 2 - Number of beneficiary households and estimate of poor households with
children, by district
Source: DNRS-MSS; World Bank and NDS (2008)
Note: *The calculation is based on the official poverty rate (2007 TL-SLS) and number of households with children (2010 Census).
Budget
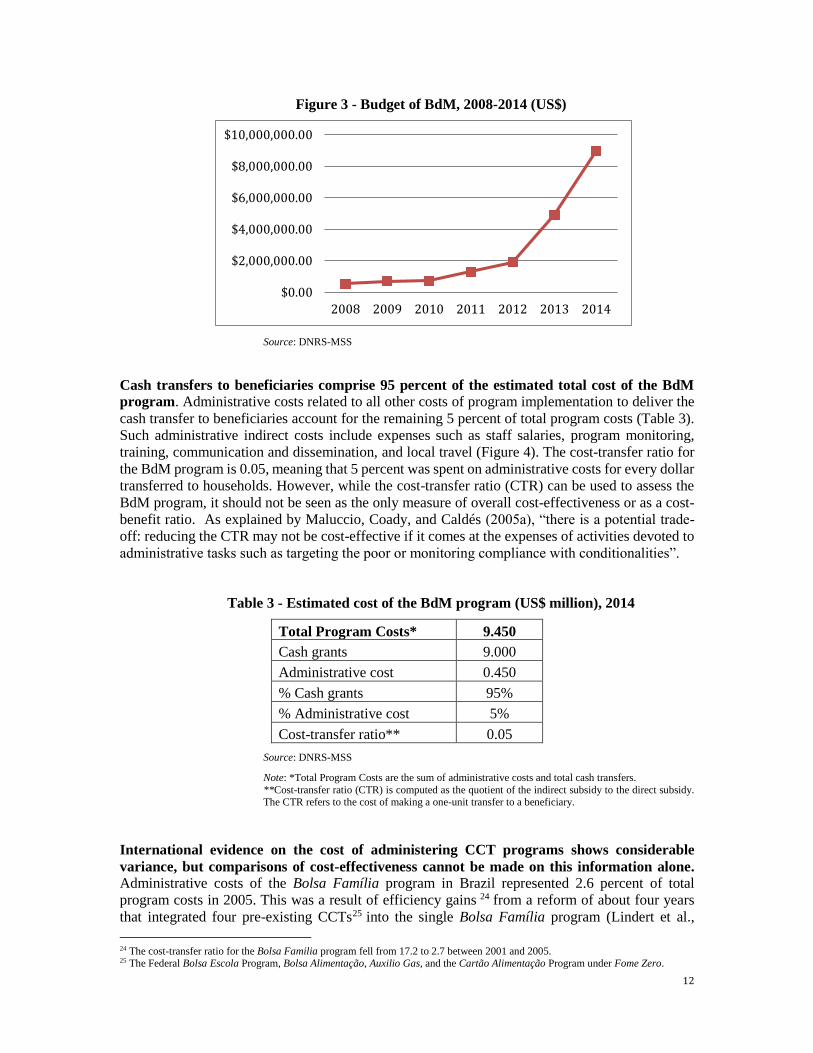
The budget allocation for the BdM program has increased gradually over the last few years
(Figure 3). After the policy changes made to the program in 2012,21 the budget allocation increased
rapidly from about US$2 million to US$9 million in 2014, reflecting the MSS’ commitment to
improving program coverage and its effectiveness. The BdM program, which has been
implemented by the National Directorate for Social Reinsertion (DNRS) within the MSS, accounts
for about 88 percent of the DNRS budget22 and 6 percent of the total MSS budget approved for
2014.23
21 The main policy changes were establishment of a legal framework, development of a new targeting system, design of a new
database system and start of data entry, strengthening of the communication and dissemination system, and improvements to the
payments system through the Commerce National Bank of Timor-Leste (BNCTL). 22 The 2014 DNRS-MSS total budget is US$10.783 million. 23 The 2014 MSS total budget is US$147.124 million.
12
Figure 3 - Budget of BdM, 2008-2014 (US$)
Source: DNRS-MSS
Cash transfers to beneficiaries comprise 95 percent of the estimated total cost of the BdM
program. Administrative costs related to all other costs of program implementation to deliver the
cash transfer to beneficiaries account for the remaining 5 percent of total program costs (Table 3).
Such administrative indirect costs include expenses such as staff salaries, program monitoring,
training, communication and dissemination, and local travel (Figure 4). The cost-transfer ratio for
the BdM program is 0.05, meaning that 5 percent was spent on administrative costs for every dollar
transferred to households. However, while the cost-transfer ratio (CTR) can be used to assess the
BdM program, it should not be seen as the only measure of overall cost-effectiveness or as a cost-
benefit ratio. As explained by Maluccio, Coady, and Caldés (2005a), “there is a potential trade-
off: reducing the CTR may not be cost-effective if it comes at the expenses of activities devoted to
administrative tasks such as targeting the poor or monitoring compliance with conditionalities”.
Table 3 - Estimated cost of the BdM program (US$ million), 2014
Total Program Costs* 9.450
Cash grants 9.000
Administrative cost 0.450
% Cash grants 95%
% Administrative cost 5%
Cost-transfer ratio** 0.05
Source: DNRS-MSS
Note: *Total Program Costs are the sum of administrative costs and total cash transfers.
**Cost-transfer ratio (CTR) is computed as the quotient of the indirect subsidy to the direct subsidy. The CTR refers to the cost of making a one-unit transfer to a beneficiary.
International evidence on the cost of administering CCT programs shows considerable
variance, but comparisons of cost-effectiveness cannot be made on this information alone. Administrative costs of the Bolsa Família program in Brazil represented 2.6 percent of total
program costs in 2005. This was a result of efficiency gains 24 from a reform of about four years
that integrated four pre-existing CCTs25 into the single Bolsa Família program (Lindert et al.,
24 The cost-transfer ratio for the Bolsa Familia program fell from 17.2 to 2.7 between 2001 and 2005. 25 The Federal Bolsa Escola Program, Bolsa Alimentação, Auxilio Gas, and the Cartão Alimentação Program under Fome Zero.
$0.00
$2,000,000.00
$4,000,000.00
$6,000,000.00
$8,000,000.00
$10,000,000.00
2008 2009 2010 2011 2012 2013 2014
13
2007). In the Philippines, the indirect administrative costs of the Pantawid Pamilyang Pilipino
program comprised 13 percent of annual program costs in 2008-2010 (Fernandez and Velarde,
2012). However, before drawing any conclusions on administrative costs, the cost structures of the
programs must be analyzed to understand how they operate in order to achieve the multiple goals
of the programs (e.g., disburse cash and improve the human capital of children). For example, in
the Pantawid Pamilyang Pilipino program, the cost of identifying potential program beneficiaries
accounts for 55 percent of indirect costs (Fernandez and Velarde, 2012), which is expected to have
a return in terms of improved targeting effectiveness.
3. The Benefit Structure of the Bolsa da Mãe Program
The size of the cash transfer is a key aspect of BdM program design that can strongly
influence program outcomes as incentives to beneficiary households to comply with the health
and education conditionalities as well as providing financial support. Thus, the key question is
whether the BdM benefit structure is adequate and how the benefit should be adjusted to further
contribute to meeting program objectives. This section describes the current transfer size and
assesses its adequacy in comparing with other cash transfer programs in Timor Leste and with other
CCT programs around the world.
Transfer size and its adequacy
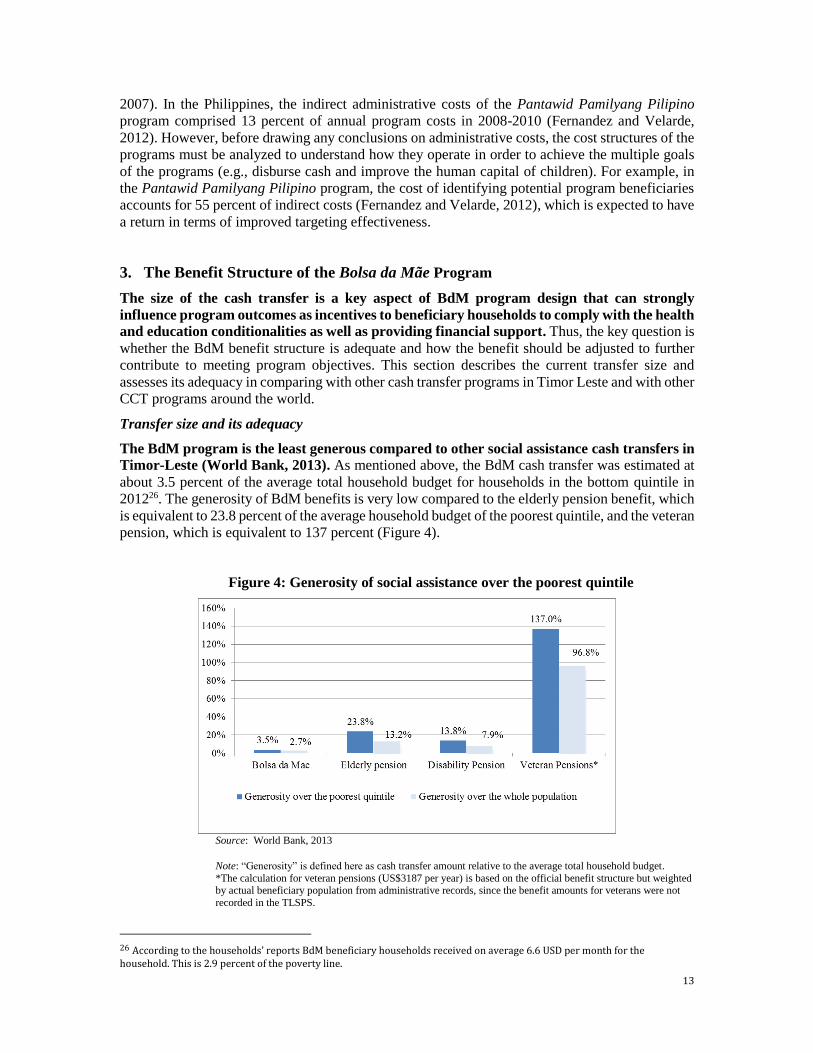
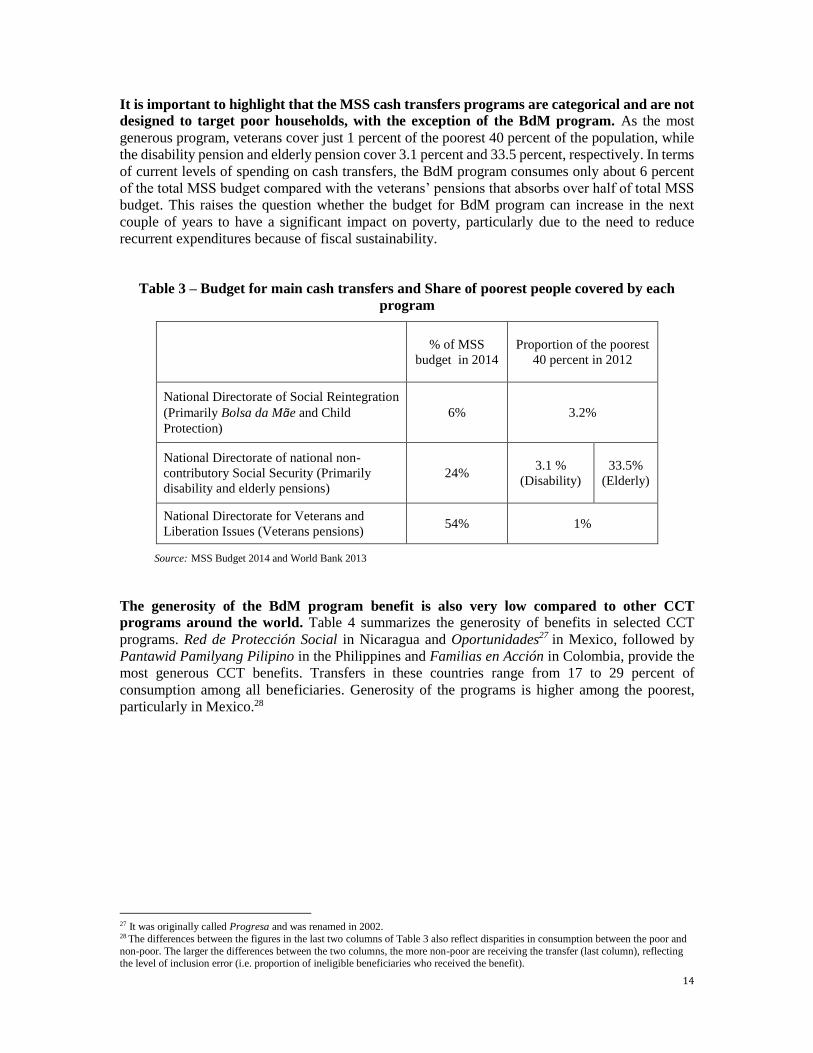
The BdM program is the least generous compared to other social assistance cash transfers in
Timor-Leste (World Bank, 2013). As mentioned above, the BdM cash transfer was estimated at
about 3.5 percent of the average total household budget for households in the bottom quintile in
201226. The generosity of BdM benefits is very low compared to the elderly pension benefit, which
is equivalent to 23.8 percent of the average household budget of the poorest quintile, and the veteran
pension, which is equivalent to 137 percent (Figure 4).
Figure 4: Generosity of social assistance over the poorest quintile
Source: World Bank, 2013
Note: “Generosity” is defined here as cash transfer amount relative to the average total household budget. *The calculation for veteran pensions (US$3187 per year) is based on the official benefit structure but weighted by actual beneficiary population from administrative records, since the benefit amounts for veterans were not
recorded in the TLSPS.
26 According to the households’ reports BdM beneficiary households received on average 6.6 USD per month for the household. This is 2.9 percent of the poverty line.
14
It is important to highlight that the MSS cash transfers programs are categorical and are not
designed to target poor households, with the exception of the BdM program. As the most
generous program, veterans cover just 1 percent of the poorest 40 percent of the population, while
the disability pension and elderly pension cover 3.1 percent and 33.5 percent, respectively. In terms
of current levels of spending on cash transfers, the BdM program consumes only about 6 percent
of the total MSS budget compared with the veterans’ pensions that absorbs over half of total MSS
budget. This raises the question whether the budget for BdM program can increase in the next
couple of years to have a significant impact on poverty, particularly due to the need to reduce
recurrent expenditures because of fiscal sustainability.
Table 3 – Budget for main cash transfers and Share of poorest people covered by each
program
% of MSS
budget in 2014
Proportion of the poorest
40 percent in 2012
National Directorate of Social Reintegration
(Primarily Bolsa da Mãe and Child
Protection)
6% 3.2%
National Directorate of national non-
contributory Social Security (Primarily
disability and elderly pensions)
24% 3.1 %
(Disability)
33.5%
(Elderly)
National Directorate for Veterans and
Liberation Issues (Veterans pensions) 54% 1%
Source: MSS Budget 2014 and World Bank 2013
The generosity of the BdM program benefit is also very low compared to other CCT
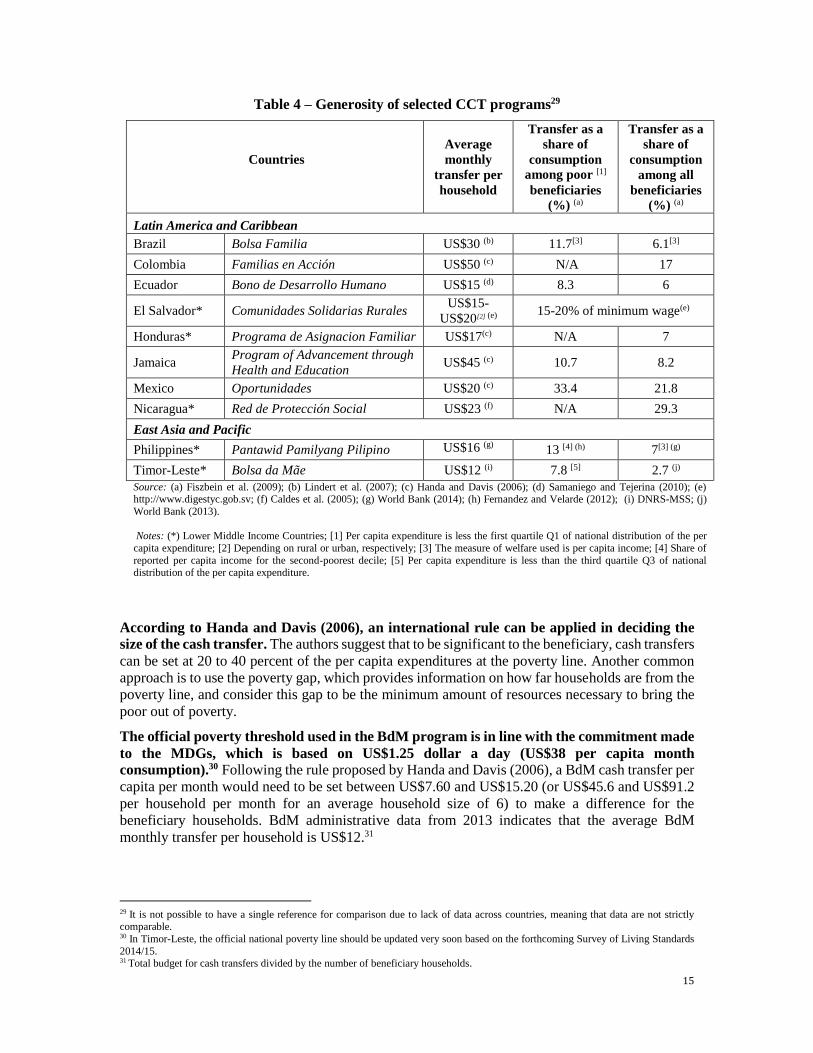
programs around the world. Table 4 summarizes the generosity of benefits in selected CCT
programs. Red de Protección Social in Nicaragua and Oportunidades27 in Mexico, followed by
Pantawid Pamilyang Pilipino in the Philippines and Familias en Acción in Colombia, provide the
most generous CCT benefits. Transfers in these countries range from 17 to 29 percent of
consumption among all beneficiaries. Generosity of the programs is higher among the poorest,
particularly in Mexico.28
27 It was originally called Progresa and was renamed in 2002. 28 The differences between the figures in the last two columns of Table 3 also reflect disparities in consumption between the poor and
non-poor. The larger the differences between the two columns, the more non-poor are receiving the transfer (last column), reflecting the level of inclusion error (i.e. proportion of ineligible beneficiaries who received the benefit).
15
Table 4 – Generosity of selected CCT programs29
Countries
Average
monthly
transfer per
household
Transfer as a
share of
consumption
among poor [1]
beneficiaries
(%) (a)
Transfer as a
share of
consumption
among all
beneficiaries
(%) (a)
Latin America and Caribbean
Brazil Bolsa Familia US$30 (b) 11.7[3] 6.1[3]
Colombia Familias en Acción US$50 (c) N/A 17
Ecuador Bono de Desarrollo Humano US$15 (d) 8.3 6
El Salvador* Comunidades Solidarias Rurales US$15-
US$20[2] (e) 15-20% of minimum wage(e)
Honduras* Programa de Asignacion Familiar US$17(c) N/A 7
Jamaica Program of Advancement through
Health and Education US$45 (c) 10.7 8.2
Mexico Oportunidades US$20 (c) 33.4 21.8
Nicaragua* Red de Protección Social US$23 (f) N/A 29.3
East Asia and Pacific
Philippines* Pantawid Pamilyang Pilipino US$16 (g) 13 [4] (h) 7[3] (g)
Timor-Leste* Bolsa da Mãe US$12 (i) 7.8 [5] 2.7 (j)
Source: (a) Fiszbein et al. (2009); (b) Lindert et al. (2007); (c) Handa and Davis (2006); (d) Samaniego and Tejerina (2010); (e) http://www.digestyc.gob.sv; (f) Caldes et al. (2005); (g) World Bank (2014); (h) Fernandez and Velarde (2012); (i) DNRS-MSS; (j)
World Bank (2013).
Notes: (*) Lower Middle Income Countries; [1] Per capita expenditure is less the first quartile Q1 of national distribution of the per
capita expenditure; [2] Depending on rural or urban, respectively; [3] The measure of welfare used is per capita income; [4] Share of
reported per capita income for the second-poorest decile; [5] Per capita expenditure is less than the third quartile Q3 of national
distribution of the per capita expenditure.
According to Handa and Davis (2006), an international rule can be applied in deciding the
size of the cash transfer. The authors suggest that to be significant to the beneficiary, cash transfers
can be set at 20 to 40 percent of the per capita expenditures at the poverty line. Another common
approach is to use the poverty gap, which provides information on how far households are from the
poverty line, and consider this gap to be the minimum amount of resources necessary to bring the
poor out of poverty.
The official poverty threshold used in the BdM program is in line with the commitment made
to the MDGs, which is based on US$1.25 dollar a day (US$38 per capita month
consumption).30 Following the rule proposed by Handa and Davis (2006), a BdM cash transfer per
capita per month would need to be set between US$7.60 and US$15.20 (or US$45.6 and US$91.2
per household per month for an average household size of 6) to make a difference for the
beneficiary households. BdM administrative data from 2013 indicates that the average BdM
monthly transfer per household is US$12.31
29 It is not possible to have a single reference for comparison due to lack of data across countries, meaning that data are not strictly comparable. 30 In Timor-Leste, the official national poverty line should be updated very soon based on the forthcoming Survey of Living Standards
2014/15. 31 Total budget for cash transfers divided by the number of beneficiary households.
16
The benefit level should also take into account the program’s objective of incentivizing poor
and vulnerable households to send their children to school and keep their children healthy. CCT programs such as Oportunidades (Mexico), Programa de Asignación Familiar (Honduras),
Red de Protección Social (Nicaragua), and Pantawid Pamilyang Pilipino (Philippines) provide
monetary educational and/or health grants to households based on the assumption that poor families
do not invest enough in human capital and are consequently trapped in a vicious cycle of
intergenerational transmission of poverty. As Fiszbein et al. (2009) suggests, “a key parameter is
setting benefit levels in relation to the desired impacts.” For example, a Cambodia evaluation shows
that the child-specific CCT program providing scholarships of US$45-60 (representing 2-3 percent
of the consumption of the median recipient household) to poor children for the three years of lower
secondary school had a large effect on enrollment and attendance, which increased by
approximately 25 percentage points (Filmer and Schady, 2009). The beneficiaries are 16 percentage
points more likely to be enrolled in school and 17 percentage points more likely to be attending on
the day of the unannounced visit, and they spend 5.4 more hours in school per week.
CCT programs worldwide shows that there are several options in setting up the benefit
structure. Some CCT programs use a flat benefit structure in which all beneficiary households
receive the same amount of transfer grants. Other CCT programs use a variable benefit structure in
which transfer amounts can vary according to household characteristics and some programs use a
combination of different types of benefits. Annex 1 provides examples from other countries that
can help the Ministry for Social Solidarity to reflect whether the Bolsa da Mãe benefit structure
should be considered using any of other characteristics.
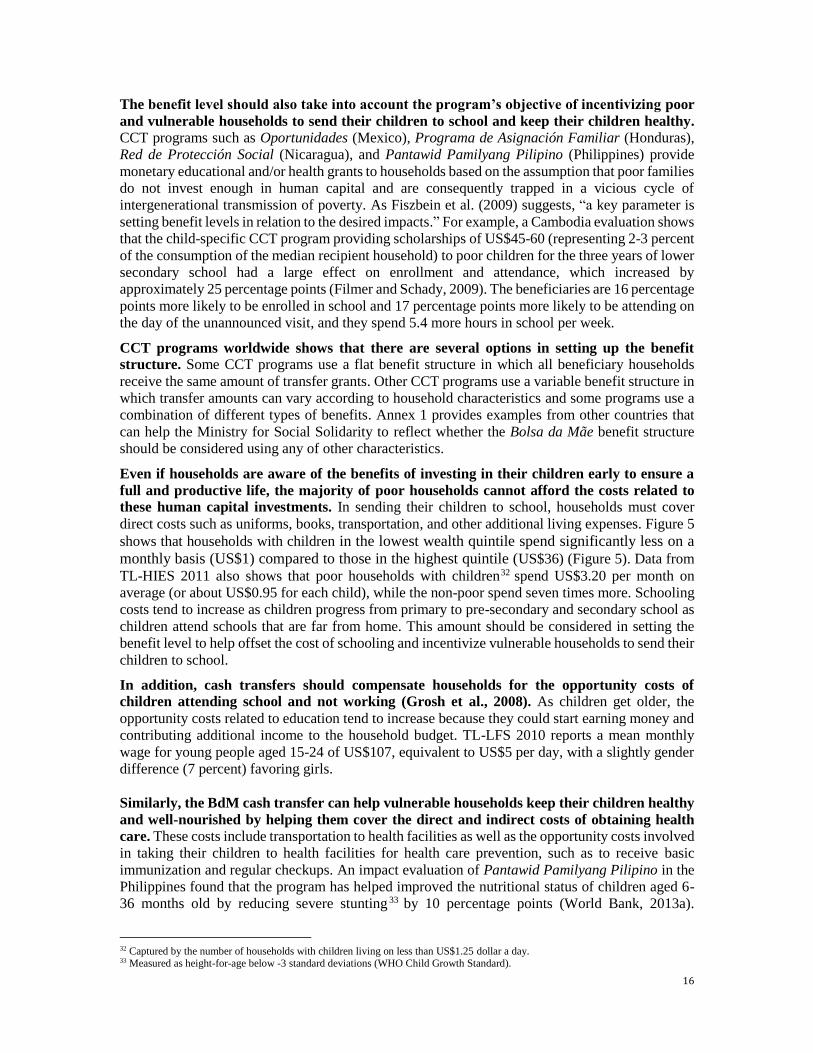
Even if households are aware of the benefits of investing in their children early to ensure a
full and productive life, the majority of poor households cannot afford the costs related to
these human capital investments. In sending their children to school, households must cover
direct costs such as uniforms, books, transportation, and other additional living expenses. Figure 5
shows that households with children in the lowest wealth quintile spend significantly less on a
monthly basis (US$1) compared to those in the highest quintile (US$36) (Figure 5). Data from
TL-HIES 2011 also shows that poor households with children32 spend US$3.20 per month on
average (or about US$0.95 for each child), while the non-poor spend seven times more. Schooling
costs tend to increase as children progress from primary to pre-secondary and secondary school as
children attend schools that are far from home. This amount should be considered in setting the
benefit level to help offset the cost of schooling and incentivize vulnerable households to send their
children to school.
In addition, cash transfers should compensate households for the opportunity costs of
children attending school and not working (Grosh et al., 2008). As children get older, the
opportunity costs related to education tend to increase because they could start earning money and
contributing additional income to the household budget. TL-LFS 2010 reports a mean monthly
wage for young people aged 15-24 of US$107, equivalent to US$5 per day, with a slightly gender
difference (7 percent) favoring girls.
Similarly, the BdM cash transfer can help vulnerable households keep their children healthy
and well-nourished by helping them cover the direct and indirect costs of obtaining health
care. These costs include transportation to health facilities as well as the opportunity costs involved
in taking their children to health facilities for health care prevention, such as to receive basic
immunization and regular checkups. An impact evaluation of Pantawid Pamilyang Pilipino in the
Philippines found that the program has helped improved the nutritional status of children aged 6-
36 months old by reducing severe stunting 33 by 10 percentage points (World Bank, 2013a).
32 Captured by the number of households with children living on less than US$1.25 dollar a day. 33 Measured as height-for-age below -3 standard deviations (WHO Child Growth Standard).
17
Unfortunately, there is no data available in Timor-Leste showing how much households in different
quintiles spend on preventive health care, and further work is needed to understand the costs to the
poor and the possible implications for benefit levels.
Figure 5 - Monthly household school spending by quintile (US$)
Source: TL-HIES 2011
4. Simulation of Bolsa da Mãe Program Impacts
This section describes the simulation analysis to estimate how variations in the BdM benefit
structure could contribute to poverty reduction. It is important to note that due to data limitations
this paper does not attempts to estimate program impacts on health and education indicators. The
simulations here therefore estimate the program impacts only on poverty reduction, and therefore
depicts only a partial picture of the benefits the BdM program.
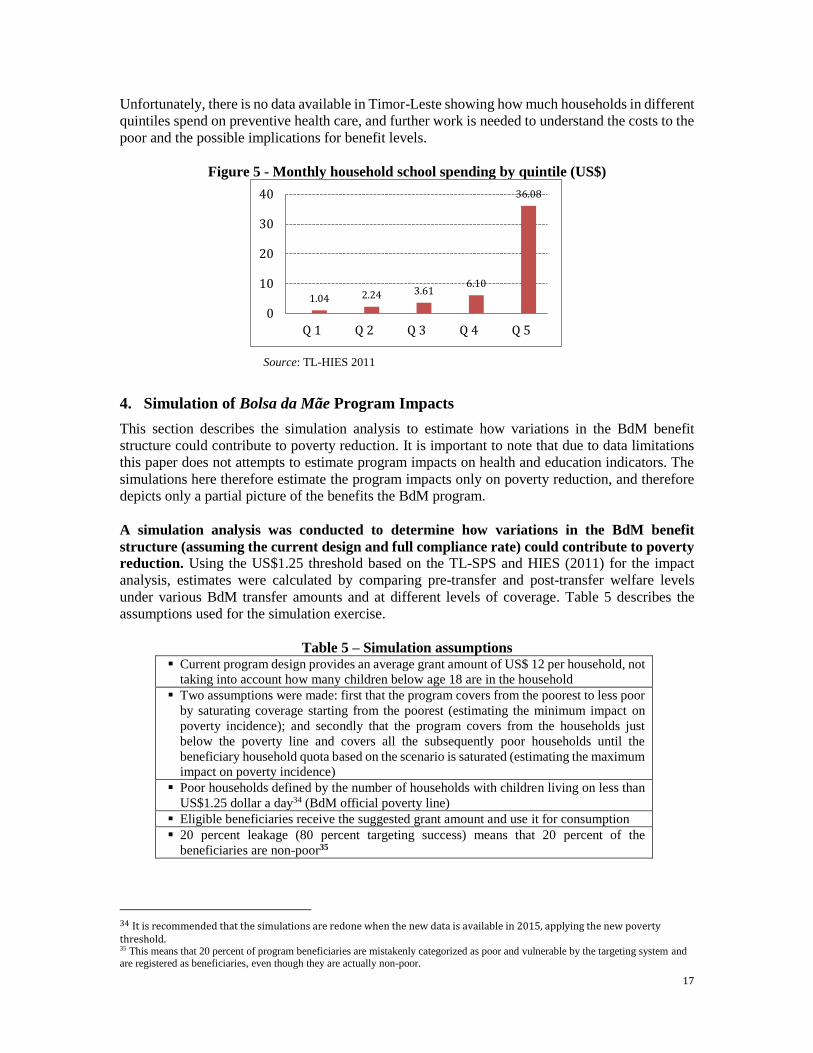
A simulation analysis was conducted to determine how variations in the BdM benefit
structure (assuming the current design and full compliance rate) could contribute to poverty
reduction. Using the US$1.25 threshold based on the TL-SPS and HIES (2011) for the impact
analysis, estimates were calculated by comparing pre-transfer and post-transfer welfare levels
under various BdM transfer amounts and at different levels of coverage. Table 5 describes the
assumptions used for the simulation exercise.
Table 5 – Simulation assumptions Current program design provides an average grant amount of US$ 12 per household, not
taking into account how many children below age 18 are in the household
Two assumptions were made: first that the program covers from the poorest to less poor
by saturating coverage starting from the poorest (estimating the minimum impact on
poverty incidence); and secondly that the program covers from the households just
below the poverty line and covers all the subsequently poor households until the
beneficiary household quota based on the scenario is saturated (estimating the maximum
impact on poverty incidence)
Poor households defined by the number of households with children living on less than
US$1.25 dollar a day34 (BdM official poverty line)
Eligible beneficiaries receive the suggested grant amount and use it for consumption
20 percent leakage (80 percent targeting success) means that 20 percent of the
beneficiaries are non-poor35
34 It is recommended that the simulations are redone when the new data is available in 2015, applying the new poverty threshold. 35 This means that 20 percent of program beneficiaries are mistakenly categorized as poor and vulnerable by the targeting system and are registered as beneficiaries, even though they are actually non-poor.
1.04 2.24 3.616.10
36.08
0
10
20
30
40
Q 1 Q 2 Q 3 Q 4 Q 5
18
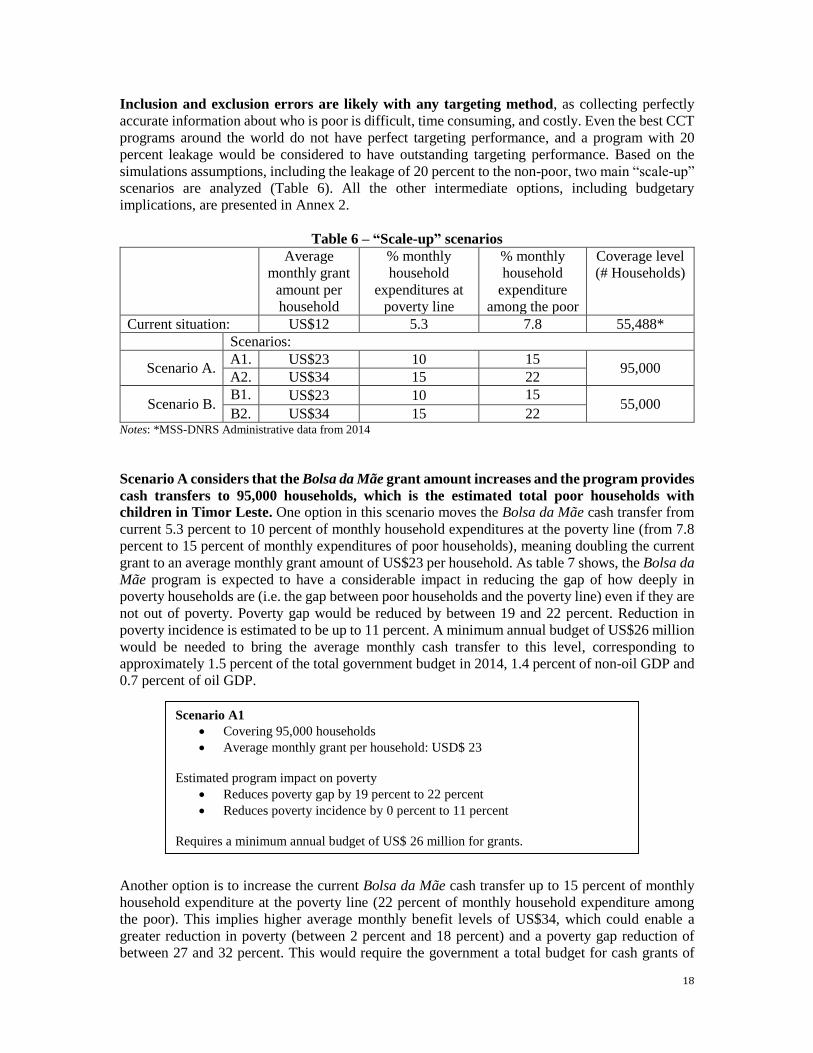
Inclusion and exclusion errors are likely with any targeting method, as collecting perfectly
accurate information about who is poor is difficult, time consuming, and costly. Even the best CCT
programs around the world do not have perfect targeting performance, and a program with 20
percent leakage would be considered to have outstanding targeting performance. Based on the
simulations assumptions, including the leakage of 20 percent to the non-poor, two main “scale-up”
scenarios are analyzed (Table 6). All the other intermediate options, including budgetary
implications, are presented in Annex 2.
Table 6 – “Scale-up” scenarios
Average
monthly grant
amount per
household
% monthly
household
expenditures at
poverty line
% monthly
household
expenditure
among the poor
Coverage level
(# Households)
Current situation: US$12 5.3 7.8 55,488*
Scenarios:
Scenario A. A1. US$23 10 15
95,000 A2. US$34 15 22
Scenario B. B1. US$23 10 15
55,000 B2. US$34 15 22
Notes: *MSS-DNRS Administrative data from 2014
Scenario A considers that the Bolsa da Mãe grant amount increases and the program provides
cash transfers to 95,000 households, which is the estimated total poor households with
children in Timor Leste. One option in this scenario moves the Bolsa da Mãe cash transfer from
current 5.3 percent to 10 percent of monthly household expenditures at the poverty line (from 7.8
percent to 15 percent of monthly expenditures of poor households), meaning doubling the current
grant to an average monthly grant amount of US$23 per household. As table 7 shows, the Bolsa da
Mãe program is expected to have a considerable impact in reducing the gap of how deeply in
poverty households are (i.e. the gap between poor households and the poverty line) even if they are
not out of poverty. Poverty gap would be reduced by between 19 and 22 percent. Reduction in
poverty incidence is estimated to be up to 11 percent. A minimum annual budget of US$26 million
would be needed to bring the average monthly cash transfer to this level, corresponding to
approximately 1.5 percent of the total government budget in 2014, 1.4 percent of non-oil GDP and
0.7 percent of oil GDP.
Another option is to increase the current Bolsa da Mãe cash transfer up to 15 percent of monthly
household expenditure at the poverty line (22 percent of monthly household expenditure among
the poor). This implies higher average monthly benefit levels of US$34, which could enable a
greater reduction in poverty (between 2 percent and 18 percent) and a poverty gap reduction of
between 27 and 32 percent. This would require the government a total budget for cash grants of
Scenario A1
Covering 95,000 households
Average monthly grant per household: USD$ 23
Estimated program impact on poverty
Reduces poverty gap by 19 percent to 22 percent
Reduces poverty incidence by 0 percent to 11 percent
Requires a minimum annual budget of US$ 26 million for grants.
19
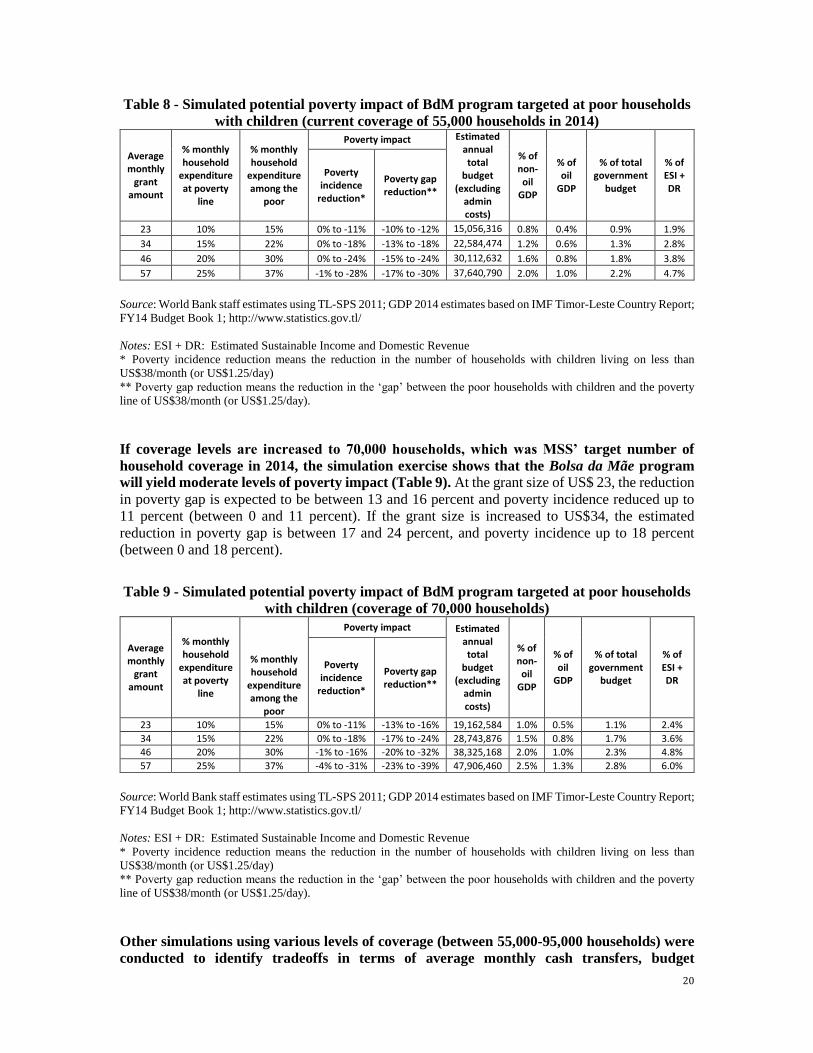
US$39 million to cover 95,000 beneficiary households, equivalent to approximately 2.3 percent of
total government budget in 2014, 2.1 percent of non-oil GDP and 1 percent of oil GDP.
Table 7 - Simulated potential poverty impact of BdM program covering 95,000 poor
households with children (coverage of all poor households)
Average monthly
grant amount
% monthly household
expenditures at poverty line
% monthly household
expenditures among the poor
Poverty impact Estimated annual total
budget (excluding
admin costs)
% of non-oil
GDP
% of oil
GDP
% of total government
budget
% of ESI + DR
Poverty incidence
reduction*
Poverty gap reduction**
23 10% 15% 0% to -11% -19% to -22% 26,006,364 1.4% 0.7% 1.5% 3.3%
34 15% 22% -2% to -18% - 27% to -32% 39,009,546 2.1% 1.0% 2.3% 4.9%
46 20% 30% -8% to -26% -34% to -43% 52,012,728 2.7% 1.4% 3.1% 6.5%
57 25% 37% -14% to -33% -39% to -51% 65,015,910 3.4% 1.7% 3.9% 8.1%
Source: World Bank staff estimates using TL-SPS 2011; GDP 2014 estimates based on IMF Timor-Leste Country
Report; FY14 Budget Book 1; http://www.statistics.gov.tl/
Notes: ESI + DR: Estimated Sustainable Income and Domestic Revenue
* Poverty incidence reduction means the reduction in the number of households with children living on less than
US$38/month (or US$1.25/day)
** Poverty gap reduction means the reduction in the ‘gap’ between the poor households with children and the poverty
line of US$38/month (or US$1.25/day).
Simulation scenario B assumes the same two options of benefits levels adopted in Scenario A,
but a coverage level of 55,000 households, which corresponds to the current coverage in 2014.
As shown in Table 8, the simulation found that with the current coverage of 55,000 beneficiaries
and an average monthly transfer of US$23 per household, there will be a poverty gap reduction
between 10 and 12 percent and poverty incidence reduced up to 11 percent (between 0 and 11
percent). Up to 18 percent reduction in poverty incidence could be achieved by increasing the
monthly average benefit levels to US$34 per household, which would require a total budget for
cash transfers of US$22.5 million (equivalent to 1.3 percent of total government budget in 2014,
1.2 percent of non-oil GDP and 0.6 percent of oil GDP).
Scenario A2
Covering 95,000 households
Average monthly grant per household: USD$ 34
Estimated program impact on poverty
Reduces poverty gap by 27 percent to 32 percent
Reduces poverty incidence by2 percent to 18 percent
Requires a minimum annual budget of US$ 39 million for grants.
Scenario B1
Covering 55,000 households
Average monthly grant per household: USD$ 23
Estimated program impact on poverty
Reduces poverty gap by 10 percent 12 percent
Reduces poverty incidence by 0 percent to 11 percent
Requires a minimum annual budget of US$ 15 million for grants.
20
Table 8 - Simulated potential poverty impact of BdM program targeted at poor households
with children (current coverage of 55,000 households in 2014)
Average monthly
grant amount
% monthly household
expenditure at poverty
line
% monthly household
expenditure among the
poor
Poverty impact Estimated annual total
budget (excluding
admin costs)
% of non-oil
GDP
% of oil
GDP
% of total government
budget
% of ESI + DR
Poverty incidence
reduction*
Poverty gap reduction**
23 10% 15% 0% to -11% -10% to -12% 15,056,316 0.8% 0.4% 0.9% 1.9%
34 15% 22% 0% to -18% -13% to -18% 22,584,474 1.2% 0.6% 1.3% 2.8%
46 20% 30% 0% to -24% -15% to -24% 30,112,632 1.6% 0.8% 1.8% 3.8%
57 25% 37% -1% to -28% -17% to -30% 37,640,790 2.0% 1.0% 2.2% 4.7%
Source: World Bank staff estimates using TL-SPS 2011; GDP 2014 estimates based on IMF Timor-Leste Country Report;
FY14 Budget Book 1; http://www.statistics.gov.tl/
Notes: ESI + DR: Estimated Sustainable Income and Domestic Revenue
* Poverty incidence reduction means the reduction in the number of households with children living on less than
US$38/month (or US$1.25/day)
** Poverty gap reduction means the reduction in the ‘gap’ between the poor households with children and the poverty
line of US$38/month (or US$1.25/day).
If coverage levels are increased to 70,000 households, which was MSS’ target number of
household coverage in 2014, the simulation exercise shows that the Bolsa da Mãe program
will yield moderate levels of poverty impact (Table 9). At the grant size of US$ 23, the reduction
in poverty gap is expected to be between 13 and 16 percent and poverty incidence reduced up to
11 percent (between 0 and 11 percent). If the grant size is increased to US$34, the estimated
reduction in poverty gap is between 17 and 24 percent, and poverty incidence up to 18 percent
(between 0 and 18 percent).
Table 9 - Simulated potential poverty impact of BdM program targeted at poor households
with children (coverage of 70,000 households)
Average monthly
grant amount
% monthly household
expenditure at poverty
line
% monthly household
expenditure among the
poor
Poverty impact Estimated annual total
budget (excluding
admin costs)
% of non-oil
GDP
% of oil
GDP
% of total government
budget
% of ESI + DR
Poverty incidence
reduction*
Poverty gap reduction**
23 10% 15% 0% to -11% -13% to -16% 19,162,584 1.0% 0.5% 1.1% 2.4%
34 15% 22% 0% to -18% -17% to -24% 28,743,876 1.5% 0.8% 1.7% 3.6%
46 20% 30% -1% to -16% -20% to -32% 38,325,168 2.0% 1.0% 2.3% 4.8%
57 25% 37% -4% to -31% -23% to -39% 47,906,460 2.5% 1.3% 2.8% 6.0%
Source: World Bank staff estimates using TL-SPS 2011; GDP 2014 estimates based on IMF Timor-Leste Country Report;
FY14 Budget Book 1; http://www.statistics.gov.tl/
Notes: ESI + DR: Estimated Sustainable Income and Domestic Revenue
* Poverty incidence reduction means the reduction in the number of households with children living on less than
US$38/month (or US$1.25/day)
** Poverty gap reduction means the reduction in the ‘gap’ between the poor households with children and the poverty
line of US$38/month (or US$1.25/day).
Other simulations using various levels of coverage (between 55,000-95,000 households) were
conducted to identify tradeoffs in terms of average monthly cash transfers, budget
21
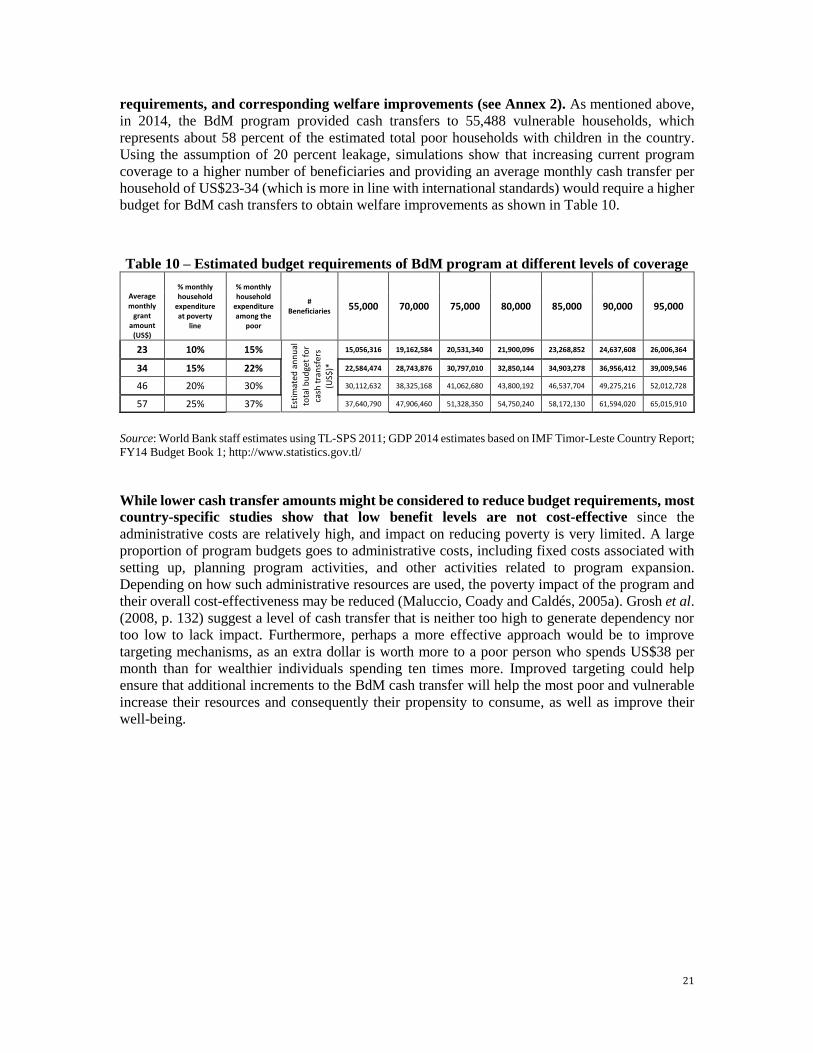
requirements, and corresponding welfare improvements (see Annex 2). As mentioned above,
in 2014, the BdM program provided cash transfers to 55,488 vulnerable households, which
represents about 58 percent of the estimated total poor households with children in the country.
Using the assumption of 20 percent leakage, simulations show that increasing current program
coverage to a higher number of beneficiaries and providing an average monthly cash transfer per
household of US$23-34 (which is more in line with international standards) would require a higher
budget for BdM cash transfers to obtain welfare improvements as shown in Table 10.
Table 10 – Estimated budget requirements of BdM program at different levels of coverage
Average monthly
grant amount
(US$)
% monthly household
expenditure at poverty
line
% monthly household
expenditure among the
poor
# Beneficiaries 55,000 70,000 75,000 80,000 85,000 90,000 95,000
23 10% 15%
Esti
mat
ed a
nn
ual
tota
l bu
dge
t fo
r
cash
tra
nsf
ers
(US$
)*
15,056,316 19,162,584 20,531,340 21,900,096 23,268,852 24,637,608 26,006,364
34 15% 22% 22,584,474 28,743,876 30,797,010 32,850,144 34,903,278 36,956,412 39,009,546
46 20% 30% 30,112,632 38,325,168 41,062,680 43,800,192 46,537,704 49,275,216 52,012,728
57 25% 37% 37,640,790 47,906,460 51,328,350 54,750,240 58,172,130 61,594,020 65,015,910
Source: World Bank staff estimates using TL-SPS 2011; GDP 2014 estimates based on IMF Timor-Leste Country Report;
FY14 Budget Book 1; http://www.statistics.gov.tl/
While lower cash transfer amounts might be considered to reduce budget requirements, most
country-specific studies show that low benefit levels are not cost-effective since the
administrative costs are relatively high, and impact on reducing poverty is very limited. A large
proportion of program budgets goes to administrative costs, including fixed costs associated with
setting up, planning program activities, and other activities related to program expansion.
Depending on how such administrative resources are used, the poverty impact of the program and
their overall cost-effectiveness may be reduced (Maluccio, Coady and Caldés, 2005a). Grosh et al.
(2008, p. 132) suggest a level of cash transfer that is neither too high to generate dependency nor
too low to lack impact. Furthermore, perhaps a more effective approach would be to improve
targeting mechanisms, as an extra dollar is worth more to a poor person who spends US$38 per
month than for wealthier individuals spending ten times more. Improved targeting could help
ensure that additional increments to the BdM cash transfer will help the most poor and vulnerable
increase their resources and consequently their propensity to consume, as well as improve their
well-being.
22
5. Policy Considerations
The BdM program has become widely known across the country and has the enthusiastic
support of policy makers. If implemented well, it is the most promising candidate for an integrated
anti-poverty program for Timor-Leste.
Although poverty reduction is only one of the program objectives and this note does not
estimate the potential program impacts in health and education indicators, adjustments to
the BdM’s benefit structure and improved targeting could help increase the program’s
poverty reduction impact. The simulation results for Timor-Leste and evidence from other CCT
programs around the world point to some measures that could improve the BdM’s impact
significantly. In particular, some recommended measures include:
1. Increase the BdM cash grant to a higher average household benefit of at least US$23 per
month and gradually increase coverage to a target of 95,000 households to start making
an impact on poverty, without increasing the overall MSS budget
The average monthly transfer needs to be increased to maximize poverty reduction. To achieve a
reduction in poverty gap between 19 to 22 percent and a reduction up to 11 percent in the number
of households with children living on less than US$38/month (or US$1.25/day)36, the current
average monthly grant amount would need to be raised to US$23 per household and coverage
increased to 95,000 households. This increase would account for approximately 10 percent of the
monthly household expenditure at the poverty line (or 15 percent of household expenditures among
the poor). Alternatively, with a benefit size of US$34, the program impacts on poverty is expected
to be considerably larger. The government may consider increasing the benefit size for the current
coverage of 55,000 households first, and then gradually expand the coverage with a target of 95,000
households. While impact on poverty incidence may seem low for the large budget required, the
investment in scaling-up the program can have a huge impact on the reduction of poverty gap,
which can be translated in a substantial improvement of the situation of a greater number of
households. Although simulation analyses could not be conducted, increasing benefit size per
household and increasing program coverage not only brings stronger impact on poverty reduction,
it is also expected to improve the beneficiary households’ use of primary health services and level
of school enrollment to a large extent.
2. Review the budget allocation, using a financially sustainable budget, and reallocate
resources to allow for this increase and cover a larger proportion of the poor
Raising the average monthly grant amount to at least US$23 per household as proposed above
covering 95,000 households would involve a total annual cost of at least US$26 million for cash
transfers, excluding administrative costs. This represents about 1.5 percent of the total government
budget, 1.4 percent of non-oil GDP and 0.7 percent of oil GDP. As an indication of costs in other
countries, programs such as Bolsa Familia in Brazil, Oportunidades in Mexico or Pantawid
Pamilyang Pilipino cost approximately 0.5 percent of GDP. The required budget allocation for the
BdM Program without increasing the MSS budget would need a reallocation of resources that
should come through reforms in social programs, mainly through a deep change in veterans’
pensions. To scale up the BdM cash transfer could then be done and translated into significant
reduction in poverty by using the fiscal space created.
36 Based on the Bolsa da Mae program poverty line of USD 1.25 per capita per day as referenced in the Ministerial Diploma N°27 of
19 September 2012. The USD 1.25 per capita per day poverty line was based on the official poverty line at the time the Ministerial
Diploma was issued. It is recommended that the simulations are redone when the new data is available in 2015, applying the new poverty threshold.
23
3. Assess the current targeting system to ensure a well-targeted BdM program that can be
more efficient and effective
The targeting mechanisms need to be revised in order to be more effective and transparent. It is
recommended to reassess the current BdM targeting system, which was introduced in 2012, based
on the Living Standards Survey (LSS) 2014-15 data when available in 2014. The new data can be
used to estimate whether the BdM cash transfer is reaching the intended beneficiaries. Program
officials can use the information to improve the identification of poor households and prevent errors
of inclusion and exclusion.
4. Conduct a diagnostic review and assess the current operational design, management, and
implementation processes of the BdM program to ensure effective implementation
A review and assessment of current BdM operational processes will be important for developing a
comprehensive restructuring action plan to ensure the program is implemented well. This review
should cover design features of the program such as program conditionalities, targeting
methodology and tools, beneficiary enrolment and registration, co-responsibilities for compliance
verification (i.e. the Ministries of Education and Health could help verify compliance with
education- and health-related conditionalities), payment systems, reconciliation process, grievance
redress mechanisms, monitoring and evaluation, and institutional arrangements for program
operations.
24
References
Ruhul, Amin.; De Oliveira, Telma Joana Corte Real ; Da Cunha, Mateus; Brown, Tanya Wells;
Favin, Michael; Cappelier Kelli (2013), “Factors limiting immunization coverage in urban Dili”,
Timor-Leste, Glob Health Sci Pract.,1(3):417-427. http://dx.doi.org/10.9745/GHSP-D-13-00115
Baird, Sarah; McIntosh, Craig and Berk Ozler (2009), “Designing cost-effective cash transfer
programs to boost schooling among young women in Sub-Saharan Africa”, Policy Research
Working Paper 5090, The World Bank: Washington.
Curtain, Richard (2012), A Census report on young people in Timor-Leste in 2010,
NSD/UNFPA/UNICEF: Dili.
Espinosa, Silvia (2013), “Household participation in Conditional Cash Transfer programs: a
structural analysis of Mexico's urban Oportunidades”, Job Market Paper.
https://www.ucl.ac.uk/economics/job-market/espinosa/espinosa-jmp.pdf
Filmer, Deon and Norbert Schady (2009), “School enrollment, selection and test scores”, Policy
Research Working Paper 4998, The World Bank: Washington.
Filmer, Deon and Norbert Schady (2011), “Does more cash in conditional cash transfer programs
always lead to larger impacts on school attendance?”, Journal of Development Economics 96: 150-
157.
Fiszbein, Ariel, Norbert Schady, Francisco H.G Ferreira, Margaret Grosh, Niall Keleher, Pedro
Olinto, and Emmanuel Skoufi (2009), “Conditional cash transfers: reducing present and future
poverty”, World Bank Policy Research Report 47603, The World Bank: Washington.
Fernandez, Luisa and Olfindo, Rosechin (2011), “Overview of the Philippines’ Conditional Cash
Transfer: The Pantawid Pamilyang Pilipino Program (Pantawid Pamilya)”, Philippine Social
Protection Note No.2, The World Bank.
Fernandez, Luisa and Velaverde, Rashiel (2012), “Who benefits from Social assistance in the
Philippines? Evidence from the latest National Household Surveys”, Philippine Social Protection
Note No.4, The World Bank.
Caldés, Natalia; Coady, David and Maluccio, John A. (2005), "The cost of poverty alleviation
transfer programs: a comparative analysis of the three programs in Latin America", World
Development, 34 (5): 818-837.
Caldés, Natalia; Coady, David and Maluccio, John A. (2005a), “The cost of conditional cash
transfers”, Journal of International Development, 17 (2):151-168.
Chaudhury, Nazmul; Friedman, Jed and Onishi, Junko (2013), “Philippines Conditional Cash
Transfer Program. Impact Evaluation”, Report Number 75533-PH, The World Bank: Washington.
Grosh, Margaret, del Ninno, Carlo, Tesliuc, Emil and Ouerghi, Azedine (2008), “For protection
and promotion - The design and implementation of effective safety nets”, The World Bank:
Washington.
IFPRI (2011), Global Food Policy Report, IFPRI: Washington.
IMF (2013), Timor-Leste Country Report, IMF Country Report No. 13/338, International Monetary
Fund, IMF: Washington.
Lindert, Kathy, Emmanuel Skoufias and Joseph Shapiro (2006), “Redistributing income to the poor
and the rich: public transfers in Latin America and the Caribbean”, The World Bank: Washington.
25
Lindert, Kathy, Anja Linder, Jason Hobbs and Bénédicte de la Brière (2007), “The nuts and bolts
of Brazil’s Bolsa Familia Program: implementing Conditional Cash Transfers in a decentralized
context”, SP Discussion Paper N0. 0709, The World Bank: Washington.
Ministry of Health (2014), Timor-Leste Food and Security Survey Report 2013, MoH: Timor-Leste.
General Directorate of Statistics of the Ministry of Finance and UNICEF (2014), The Situation
Analysis of Children in Timor-Leste (SitAn), GDS-MOF and UNICEF: Dili.
NSD-MOF (2012), Timor-Leste Household Income and Expenditure Survey 2011, NSD-MOF: Dili
NSD, MOF and ICF Macro (2010), Timor-Leste Demographics and Health Survey 2009-10, NSD
Timor-Leste and ICF Macro: Dili.
Sudhanshu, Handa and Davis, Benjamin (2006), “The experience of Conditional Cash Transfers in
Latin America and the Caribbean”, Development Policy Review 24 (5): 513-536.
Samaniego, Pablo; Tejerina, Luis (2010), “Financial inclusion through the Bono de Desarrollo
Humano: exploring options and beneficiary readiness”, IDB-Technical Notes 206, IDB.
Victora CG, Adair L, Fall C, et al (2008), “Maternal and child undernutrition study group maternal
and child undernutrition: consequences for adult health and human capital”, Lancet. 2008,
371(9609):340–357.
World Bank and National Directorate for Statistics (2008), Timor-Leste: Poverty in a Young
National, NDS: Timor-Leste.
World Bank (2013), “Timor-Leste Social Assistance Public Expenditure and Program Performance
Report”, Report No. 73484-TP, The World Bank: Washington.
World Bank (2013a), “Philippines Conditional Cash Transfer Program – Impact Evaluation 2012”,
Report Number 75533-PH, The World Bank: Washington.
World Bank (2014), Snippets from the Benefit-Incidence Analysis of the Pantawid Pamilyang
Pilipino Program, Preliminary Findings,The World Bank: Washington.
Ministry of Health (2014), Preliminary findings on economic burden of malnutrition in Timor-
Leste presented by Jack Bagriansky, MoH: Dili
UNESCO (2013), Education transforms lives, Education for All Global Monitoring Report,
UNESCO: Paris.
26
Annex 1. CCT programs worldwide
Some CCT programs use a flat benefit structure in which all beneficiary households receive
the same amount of transfer grants. Flat household-level transfers per month are observed in
Panama (US$50), Ecuador (US$35), Peru (US$33), and El Salvador (US$20). This type of benefit
is used in contexts where there are serious concerns that higher grant amounts for households with
more children could create incentives to increase fertility rates. This type of benefit is also
appropriate when the program’s objective is to provide incentives for household behavioral changes
without making the changes dependent on each successive child. In terms of program costs, flat
benefits may have lower administrative costs than CCT programs with variable grant amounts due
to simpler administrative processes.
Other CCT programs use a variable benefit structure in which transfer amounts can vary
according to household characteristics. Different characteristics can be selected as the basis for
providing variable benefits, such as:
Household income or poverty level. For example, Bolsa Família in Brazil attempts to target
larger transfer amounts to the poorest households by offering the poor (monthly per capita
family income between US$29-58) a benefit between US$7-14 and providing the extreme poor
(monthly per capita family income up to US$29) with a benefit between US$24-45 per month
per family (Lindert et al., 2007).
Household size or household composition. Consistent with the logic of programs that expect
every child to use education and health services, benefits may vary by the number of children
in the household. However, some programs assume there are economies of scale in household
consumption and cap the number of children that can be covered. Other reasons for capping
may be to reduce fertility-related incentives and ensure the cash transfers can cover as many
households as possible. Bolsa Família in Brazil provides poor households with monthly
transfers of US$7 per child for up to three children. For the extreme poor, monthly transfers
range from US$24 per family with no children to US$45 per family with three or more children.
Oportunidades in Mexico caps the benefit at about US$153 which corresponds to two children
in primary school and one in high school, while Solidaridad in the Dominican Republic limits
the transfer to US$19 which corresponds to four or more children (Fiszbein et al., 2009),
Pantawid Pamilyang Pilipino in the Philippines limits only the annual education grant at
US$210,37 equivalent to three children (Fernandez and Olfindo, 2011).
Gender. While the direct costs of accessing education and health services may be the same for
boys and girls, the opportunity costs may differ. The decision on varying program benefits by
gender requires a good understanding of the reasons for gender disparities and what those
disparities represent in terms of costs by sex. For instance, the Program of Advancement
through Health and Education in Jamaica provides boys with 10 percent higher benefits than
girls at all grades as boys have been more disadvantaged in school enrollment. In contrast,
Oportunidades in Mexico offers a higher transfer to girls than boys in lower and upper
secondary, the education level at which girls are more likely to leave school.
Age/grade of children. The opportunity cost of going to school may be higher for older students
compared to younger students, while the direct cost of secondary schooling is also higher due
to more expensive textbooks and/or more distant schools. Emphasis of the benefit can be placed
on the transition from primary to pre-secondary or secondary education, which normally
37 It corresponds to US$7 per month per child 6-14 years of age for up to three children in the beneficiary household for 10 months of the year.
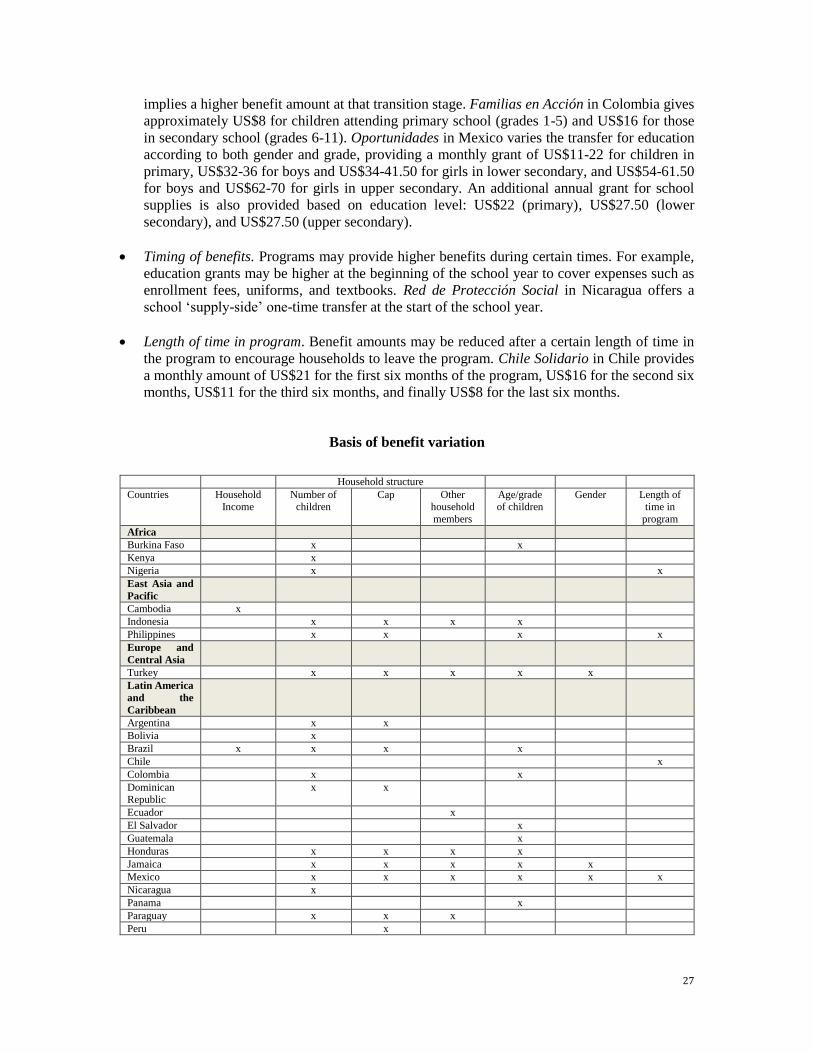
27
implies a higher benefit amount at that transition stage. Familias en Acción in Colombia gives
approximately US$8 for children attending primary school (grades 1-5) and US$16 for those
in secondary school (grades 6-11). Oportunidades in Mexico varies the transfer for education
according to both gender and grade, providing a monthly grant of US$11-22 for children in
primary, US$32-36 for boys and US$34-41.50 for girls in lower secondary, and US$54-61.50
for boys and US$62-70 for girls in upper secondary. An additional annual grant for school
supplies is also provided based on education level: US$22 (primary), US$27.50 (lower
secondary), and US$27.50 (upper secondary).
Timing of benefits. Programs may provide higher benefits during certain times. For example,
education grants may be higher at the beginning of the school year to cover expenses such as
enrollment fees, uniforms, and textbooks. Red de Protección Social in Nicaragua offers a
school ‘supply-side’ one-time transfer at the start of the school year.
Length of time in program. Benefit amounts may be reduced after a certain length of time in
the program to encourage households to leave the program. Chile Solidario in Chile provides
a monthly amount of US$21 for the first six months of the program, US$16 for the second six months, US$11 for the third six months, and finally US$8 for the last six months.
Basis of benefit variation
Household structure
Countries Household Income
Number of children
Cap Other household
members
Age/grade of children
Gender Length of time in
program
Africa
Burkina Faso x x
Kenya x
Nigeria x x
East Asia and
Pacific
Cambodia x
Indonesia x x x x
Philippines x x x x
Europe and
Central Asia
Turkey x x x x x
Latin America
and the
Caribbean
Argentina x x
Bolivia x
Brazil x x x x
Chile x
Colombia x x
Dominican Republic
x x
Ecuador x
El Salvador x
Guatemala x
Honduras x x x x
Jamaica x x x x x
Mexico x x x x x x
Nicaragua x
Panama x
Paraguay x x x
Peru x
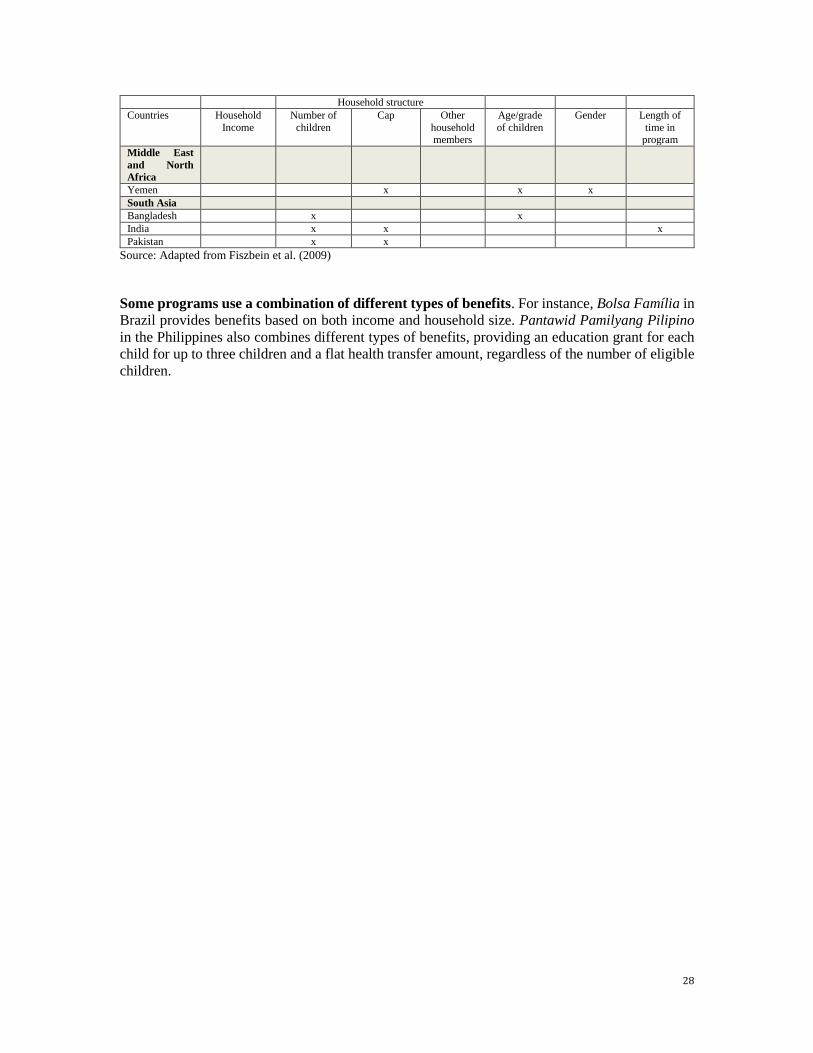
28
Household structure
Countries Household
Income
Number of
children
Cap Other
household members
Age/grade
of children
Gender Length of
time in program
Middle East
and North
Africa
Yemen x x x
South Asia
Bangladesh x x
India x x x
Pakistan x x
Source: Adapted from Fiszbein et al. (2009)
Some programs use a combination of different types of benefits. For instance, Bolsa Família in
Brazil provides benefits based on both income and household size. Pantawid Pamilyang Pilipino
in the Philippines also combines different types of benefits, providing an education grant for each
child for up to three children and a flat health transfer amount, regardless of the number of eligible
children.
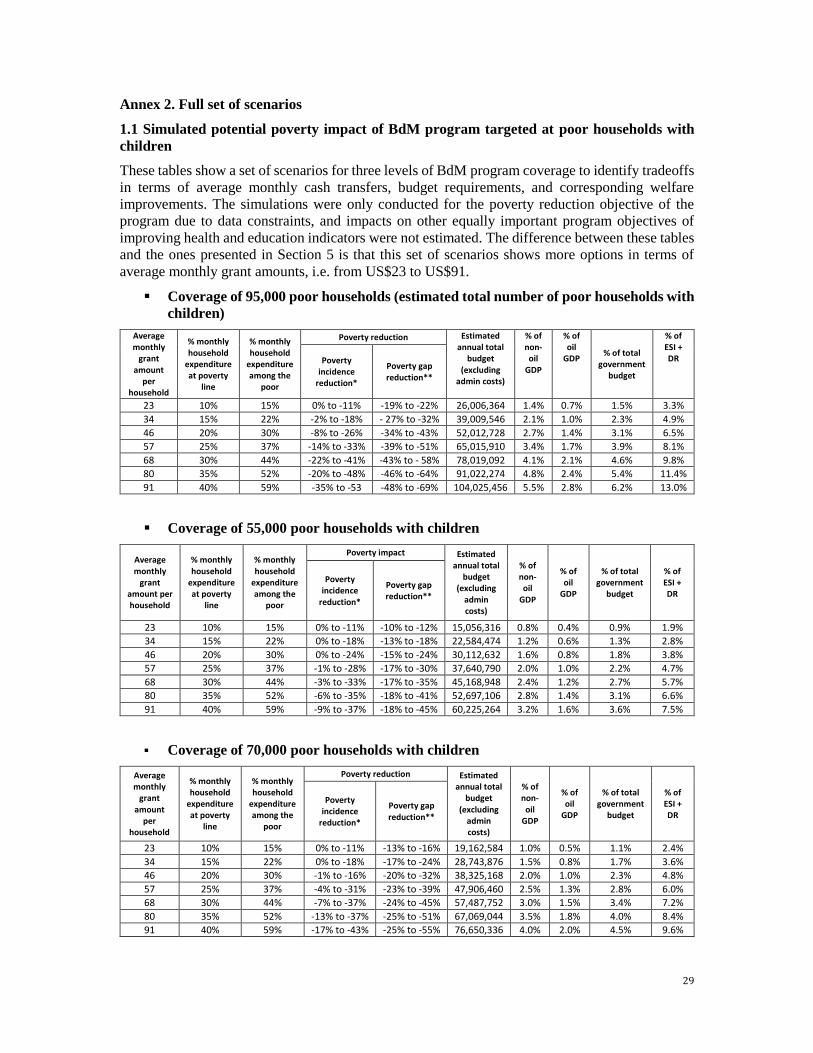
29
Annex 2. Full set of scenarios
1.1 Simulated potential poverty impact of BdM program targeted at poor households with
children
These tables show a set of scenarios for three levels of BdM program coverage to identify tradeoffs
in terms of average monthly cash transfers, budget requirements, and corresponding welfare
improvements. The simulations were only conducted for the poverty reduction objective of the
program due to data constraints, and impacts on other equally important program objectives of
improving health and education indicators were not estimated. The difference between these tables
and the ones presented in Section 5 is that this set of scenarios shows more options in terms of
average monthly grant amounts, i.e. from US$23 to US$91.
Coverage of 95,000 poor households (estimated total number of poor households with
children)
Average monthly
grant amount
per household
% monthly household
expenditure at poverty
line
% monthly household
expenditure among the
poor
Poverty reduction Estimated annual total
budget (excluding
admin costs)
% of non-oil
GDP
% of oil
GDP % of total
government budget
% of ESI + DR Poverty
incidence reduction*
Poverty gap reduction**
23 10% 15% 0% to -11% -19% to -22% 26,006,364 1.4% 0.7% 1.5% 3.3%
34 15% 22% -2% to -18% - 27% to -32% 39,009,546 2.1% 1.0% 2.3% 4.9%
46 20% 30% -8% to -26% -34% to -43% 52,012,728 2.7% 1.4% 3.1% 6.5%
57 25% 37% -14% to -33% -39% to -51% 65,015,910 3.4% 1.7% 3.9% 8.1%
68 30% 44% -22% to -41% -43% to - 58% 78,019,092 4.1% 2.1% 4.6% 9.8%
80 35% 52% -20% to -48% -46% to -64% 91,022,274 4.8% 2.4% 5.4% 11.4%
91 40% 59% -35% to -53 -48% to -69% 104,025,456 5.5% 2.8% 6.2% 13.0%
Coverage of 55,000 poor households with children
Average monthly
grant amount per household
% monthly household
expenditure at poverty
line
% monthly household
expenditure among the
poor
Poverty impact Estimated annual total
budget (excluding
admin costs)
% of non-oil
GDP
% of oil
GDP
% of total government
budget
% of ESI + DR
Poverty incidence
reduction*
Poverty gap reduction**
23 10% 15% 0% to -11% -10% to -12% 15,056,316 0.8% 0.4% 0.9% 1.9%
34 15% 22% 0% to -18% -13% to -18% 22,584,474 1.2% 0.6% 1.3% 2.8%
46 20% 30% 0% to -24% -15% to -24% 30,112,632 1.6% 0.8% 1.8% 3.8%
57 25% 37% -1% to -28% -17% to -30% 37,640,790 2.0% 1.0% 2.2% 4.7%
68 30% 44% -3% to -33% -17% to -35% 45,168,948 2.4% 1.2% 2.7% 5.7%
80 35% 52% -6% to -35% -18% to -41% 52,697,106 2.8% 1.4% 3.1% 6.6%
91 40% 59% -9% to -37% -18% to -45% 60,225,264 3.2% 1.6% 3.6% 7.5%
Coverage of 70,000 poor households with children
Average monthly
grant amount
per household
% monthly household
expenditure at poverty
line
% monthly household
expenditure among the
poor
Poverty reduction Estimated annual total
budget (excluding
admin costs)
% of non-
oil GDP
% of oil
GDP
% of total government
budget
% of ESI + DR
Poverty incidence
reduction*
Poverty gap reduction**
23 10% 15% 0% to -11% -13% to -16% 19,162,584 1.0% 0.5% 1.1% 2.4%
34 15% 22% 0% to -18% -17% to -24% 28,743,876 1.5% 0.8% 1.7% 3.6%
46 20% 30% -1% to -16% -20% to -32% 38,325,168 2.0% 1.0% 2.3% 4.8%
57 25% 37% -4% to -31% -23% to -39% 47,906,460 2.5% 1.3% 2.8% 6.0%
68 30% 44% -7% to -37% -24% to -45% 57,487,752 3.0% 1.5% 3.4% 7.2%
80 35% 52% -13% to -37% -25% to -51% 67,069,044 3.5% 1.8% 4.0% 8.4%
91 40% 59% -17% to -43% -25% to -55% 76,650,336 4.0% 2.0% 4.5% 9.6%
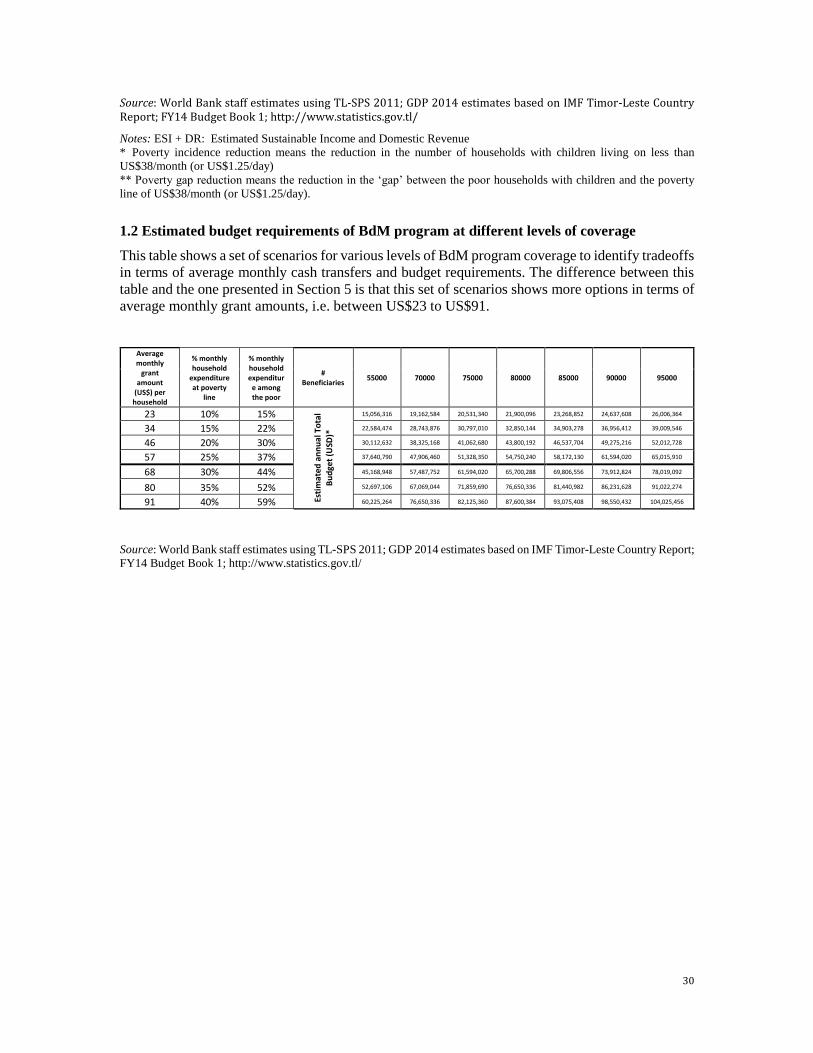
30
Source: World Bank staff estimates using TL-SPS 2011; GDP 2014 estimates based on IMF Timor-Leste Country Report; FY14 Budget Book 1; http://www.statistics.gov.tl/
Notes: ESI + DR: Estimated Sustainable Income and Domestic Revenue
* Poverty incidence reduction means the reduction in the number of households with children living on less than
US$38/month (or US$1.25/day)
** Poverty gap reduction means the reduction in the ‘gap’ between the poor households with children and the poverty
line of US$38/month (or US$1.25/day).
1.2 Estimated budget requirements of BdM program at different levels of coverage
This table shows a set of scenarios for various levels of BdM program coverage to identify tradeoffs
in terms of average monthly cash transfers and budget requirements. The difference between this
table and the one presented in Section 5 is that this set of scenarios shows more options in terms of
average monthly grant amounts, i.e. between US$23 to US$91.
Average monthly
grant amount
(US$) per household
% monthly household
expenditure at poverty
line
% monthly household expenditur
e among the poor
# Beneficiaries
55000 70000 75000 80000 85000 90000 95000
23 10% 15%
Esti
mat
ed a
nn
ual
To
tal
Bu
dge
t (U
SD)*
15,056,316 19,162,584 20,531,340 21,900,096 23,268,852 24,637,608 26,006,364
34 15% 22% 22,584,474 28,743,876 30,797,010 32,850,144 34,903,278 36,956,412 39,009,546
46 20% 30% 30,112,632 38,325,168 41,062,680 43,800,192 46,537,704 49,275,216 52,012,728
57 25% 37% 37,640,790 47,906,460 51,328,350 54,750,240 58,172,130 61,594,020 65,015,910
68 30% 44% 45,168,948 57,487,752 61,594,020 65,700,288 69,806,556 73,912,824 78,019,092
80 35% 52% 52,697,106 67,069,044 71,859,690 76,650,336 81,440,982 86,231,628 91,022,274
91 40% 59% 60,225,264 76,650,336 82,125,360 87,600,384 93,075,408 98,550,432 104,025,456
Source: World Bank staff estimates using TL-SPS 2011; GDP 2014 estimates based on IMF Timor-Leste Country Report;
FY14 Budget Book 1; http://www.statistics.gov.tl/