Embed Size (px)
Citation preview
Policy Shocks and Stock Market Returns:
Evidence from Chinese Solar Panels
Meredith A. Crowley† Ning Meng∗ Huasheng Song‡
October 2018
Abstract
We examine the stock market performance of publicly-listed Chinese firms in the
solar panel industry over 2012 and 2013 in response to announcements of new import
restrictions by the European Union and domestic policy changes by the Chinese gov-
ernment. Using daily stock market prices from the Shanghai-Shenzhen, New York and
Hong Kong markets, we calculate abnormal returns to several policy changes affecting
solar panels produced in China. We find, consistent with the Melitz (2003) model, that
larger, more export-oriented firms experienced larger stock market losses in the wake
of European trade restriction announcements. We further show that European trade
policy had a larger negative effect on Chinese private sector firms relative to state owned
enterprises. Finally, we use a two stage least squares estimation technique to show that
firms listed on US markets are more responsive to news events than those listed in China
and Hong Kong.
JEL Codes: F12, F13, G10, G14
Keywords: Chinese exports, antidumping, solar panels, event study
† Crowley: Faculty of Economics, University of Cambridge, Sidgwick Avenue, Cambridge, CB3 0EE, United
Kingdom; Cambridge Institute for New Economic Thinking (INET) and Centre for Economic Policy Research
(CEPR London). email: [email protected], web: http://meredithcrowley.weebly.com/∗ Meng: School of Economics, Nanjing University, 22 Hankou Road, Nanjing, Jiangsu 210093, China, email:
‡ Song: CRPE and School of Economics, Zhejiang University, 38 Zheda Road, Hangzhou, Zhejiang 310028,
China, email: [email protected]
For helpful conversations and feedback, we thank Holger Breinlich, Hector Calvo Pardo, Paola Conconi, Ron
Davies, Giovanni Facchini, Yi Huang, Brendan Lambe, Christoph Moser, Jose Olmo, Alejandro Riano, Eiichi
Tomura, Maurizio Zanardi, participants at the 27th NBER-TCER-CEPR Conference on “Globalization and
the Welfare Impacts of International Trade,” the European Trade Study Group Conference, the Nottingham-
Zhejiang International Trade Conference, the International Finance and Banking Society Conference, the
China Finance Review International Conference, and seminar participants at University College Dublin and
the University of Southampton.
1 Introduction
How do stock markets respond to information about expected changes in the value of a
firm? The relationship between the dissemination of information and its role in efficiently
allocating resources across firms is fundamental to the growth and development of an econ-
omy, especially when the firms are engaged in producing innovative new products that could
themselves stimulate growth in other industrial sectors.
It has been well established that the Chinese economy, in which a competitive market-
based economy operates alongside a state owned sector, suffers from resource mis-allocation
that manifests as lower than potential productivity. (See Hsieh and Klenow (2009) and
Dollar and Wei (2007)). However, among competitive market-based firms, one might expect
efficient resource allocation associated with clear dissemination of information about market
conditions such as the demand for a product. In this paper, we study a unique series of
policy changes that (1) threatened to dramatically reduce Chinese firms’ access to the EU
market, (2) temporarily restricted Chinese solar panel exports to the EU significantly, and
(3) finally resulted in moderate import restrictions against Chinese solar panel products.
Moreover, in addition to these negative external demand shocks, we examine domestic
policy shocks intended to stimulate China’s domestic demand: (1) the announcement of a
domestic development plan with explicit quantitative targets for the installation of solar
panels and (2) the announcement of a domestic subsidy plan that would only benefit power
generators that adopted solar panels for electricity generation. Our analysis examines how
stock market returns evolved for 37 Chinese solar panel firms that were publicly listed in
different stock markets around the world.
Our analysis begins with event studies of cumulative abnormal returns (CAR) in three
distinct stock markets - New York, Shanghai-Shenzhen and Hong Kong - in response to a
series of announced policy changes regarding the importation into the European Union of
solar panels manufactured in China and the consumption of solar panel products in China.
We document Chinese firms’ cumulative abnormal returns in response to this series of policy
shocks and, importantly, how these responses varied by firm ownership and across the three
different stock markets we examine.
We then examine the predictions of the Melitz (2003) model of firms engaged in in-
ternational trade to explore the cross-sectional determinants of firms’ abnormal returns in
response to trade policy announcements. We find broad support for the Melitz model’s
predictions that the largest and most export-oriented firms will experience the largest pro-
portional decline in expected future profits in response to an increase in a foreign trade
restriction. We extend the analysis along a number of empirically-interesting dimensions.
First, we incorporate the precise value chain position of the firm into our analysis of CARs.
As the structure of global value chains has become more fragmented and complex, it has
become more important to understand how a trade policy change against one output along
a value chain impacts the value of firms along the chain. We find that stock market losses
2

are largest for the more directly impacted value chain positions.
We next extend our analysis to firm ownership types and find that the stock prices of pri-
vate sector firms in China are more responsive to trade and domestic policy announcements
than state owned enterprises (SOEs); private sector firms are more likely to be adversely
affected by trade restrictions than state owned enterprises and private sector firms gain
more from domestic policy initiatives. Notably, we observe very little or no change in the
cumulative abnormal returns of Chinese state owned enterprises (SOEs) to a policy change
that threatened to seriously impair the firms’ access to 80% of the world market for solar
panels and photo-voltaic cells. At a minimum, this suggests that SOEs are largely insulated
from the fundamental market forces that drive the behavior of the Chinese private sector
firms that they compete against. In finding very little or no response in the stock prices of
SOEs to external trade policy shocks alongside negative abnormal returns for private sector
firms, we provide suggestive evidence that the mechanism of resource (mis)allocation is tied
to investors’ perceptions about the extent to which SOEs are invulnerable to market forces.
Although the European Union’s trade policy actions were intended to “level the playing
field” between European and Chinese firms, the policy seems to have had the unintended
consequence of tilting the playing field within China against the Chinese economy’s private
sector solar panel producers in favour of SOEs.
We conclude our analysis by using an instrumental variables approach to study the
importance of the market in which a firm is publicly-listed. To the best our knowledge,
ours is the first work to assess and compare the responses in different stock markets to the
same set of events relevant to the firms listed within them. Interestingly, the prices of private
sector Chinese solar panel firms listed on the US stock market are more responsive to trade
and domestic policy shocks than those listed in Hong Kong or Shanghai-Shenzhen. This
could perhaps be attributed to the fact that the US stock market participants are largely
professional and institutional investors who use analytical tools and have real-time access
to relevant market information, while in the Chinese market the majority of investors are
private individuals.1 Taken together, these findings highlight that trade policy actions which
are intended to foster a fairer competitive environment in global markets can potentially
exacerbate underlying distortions in markets with heavy state involvement.
The present paper contributes to three literatures: (1) the literature on firm productiv-
ity and resource mis-allocation in China (Hsieh and Klenow (2009); Hsieh and Song (2014);
Dollar and Wei (2007)); (2) the event-study literature (Breinlich (2014), Moser and Rose
(2014), Hartigan, Perry, and Kamma (1986); Hughes, Lenway, and Rayburn (1997); Lenway,
Morck, and Yeung (1996); Guzhva and Pagiavlas (2004); Miyajima and Yafeh (2007); Ku-
tan, Muradoglu, and Sudjana (2012); and Kosmidou, Kousenidis, and Negakis (2012)); and
1According to U.S. Securities and Exchange Commission, in the US market institutional investors like
mutual funds, pension funds, endowment fund insurance companies, hedge funds and trust investments
accounted for 67% of the market capitalization in 2010. In contrast, in the Chinese market all types of
institutional investors, including QFII, accounted for only 10.9% of market capitalization in 2013.
3
(3) the literature on the impact of antidumping policy on exporters (Bown and Crowley
(2006), Bown and Crowley (2007), Crowley, Meng, and Song (2018), Tabakis and Zanardi
(2016)).
Our work builds upon a number of significant prior contributions in the event study
literature. An important early study of the impact of special US import tariffs on stock
market returns was conducted by Hartigan, Perry, and Kamma (1986). More recent con-
tributions on the impact of trade policy changes on stock market value include Breinlich
(2014), Breinlich (2015), and Moser and Rose (2014). Breinlich (2014) examines the impact
of the North American Free Trade Agreement (NAFTA) on the value of individual Cana-
dian firms. Moser and Rose (2014) study the impact of signing a regional trade agreement
on the returns in national stock markets. Ries (1993), on Japanese autos in the 1980s,
and Hughes, Lenway, and Rayburn (1997), on semiconductors, examine the impact of trade
policy changes on upstream and downstream firms.
Recent contributions on evaluating externally-created policy shocks include Kutan, Mu-
radoglu, and Sudjana (2012) and Kosmidou, Kousenidis, and Negakis (2012). Kutan, Mu-
radoglu, and Sudjana (2012) examine the impact of IMF-related news on both financial
and real sector stock returns in Indonesia during the Asian crisis, in particular, they ex-
plore the interplay between IMF actions in crisis countries and the actions and responses
of local authorities. Kosmidou, Kousenidis, and Negakis (2012) test for the impact of the
EU/ECB/IMF bailout programs on the financial and real sectors of the Athens Stock Ex-
change during the Greek sovereign crisis.
A number of prior studies on abnormal stock returns have focused on understanding the
cross-sectional determinants of heterogeneous returns: Lenway, Morck, and Yeung (1996)
look at the U.S. steel industry, Guzhva and Pagiavlas (2004) study U.S. airlines after the
September 11th terrorist attacks, and Miyajima and Yafeh (2007) examine Japanese non-
financial companies around major events associated with the Japanese banking crisis of
1995-2000.
The next section describes the history of the Chinese solar panel industry, the EU
antidumping case against Chinese photo voltaic (PV) producers, and Chinese government
initiatives to stimulate the solar panel industry. Section 3 describes the data. The empirical
methodologies employed are discussed in section 4. Section 5 presents the main results.
Section 6 concludes the paper.
2 Policy changes and the Chinese solar panel industry
In most locations around the globe, duirng the period under study, the cost of solar
energy exceeded the cost of power furnished by traditional electric utilities (gas, coal, hydro,
etc.), although it was widely considered to be a promising form of environmentally friendly
clean energy. For example, in 2012 the average price of a kilowatt hour of electricity for
households in China was about 0.5 RMB while the average cost of producing a kilowatt
4
hour of electricity using solar panels was 1.3 RMB.2 Because of its positive environmental
impact, governmental bodies in many countries have provided economic incentives in the
form of rebates, tax credits and subsidies to end users, distributors, system integrators and
manufacturers of photo volataic products to promote the use of solar energy in on-grid
applications. The EU has been notably generous in providing subsidies to consumption,
especially in Germany and Spain.3 Because of the heavy government support for solar
product consumption, the EU has been the world’s leading region in terms of cumulative
installed capacity for several years; in 2011 the EU accounted for 75% of global capacity,
in 2012 70% and in 2013 59%, which corresponded to a physical capacity of 81.5GW in
that year.4 Moreover, the level of European consumption has translated into a massive
increase of the quantity in kW hours of solar generating capacity in Europe. For example,
in Germany in 2014, installed solar capacity was 38 GW compared to 28 GW in gas, 28
GW in hard coal, and 21 GW in brown coal (Burger (2014)).
In contrast to the stated European policy objective of reducing the environmental impact
of energy consumption, the Chinese government justified its engagement with the solar
panel industry as part of an economic development program of cultivating “strategically
important emerging industries.”5 Beginning in 2000, the Chinese government launched a
series of national policies, subsidy schemes and regulations that actively promoted the solar
panel industry at the R&D, production and application stages.6 Production of photo voltaic
products grew exponentially between 2000 and 2012. For example, output of PV modules,
measured in terms of total energy-generating capacity, increased by a factor of about 1000,
from 3 MW in 2000 to 23 GW in 2012. By 2012, Chinese firms produced 58% of the total
global supply of PV modules. The coincidence of EU subsidies to consumption with Chinese
subsidies to production resulted in significant exports of solar panels from China to the EU.
In 2012, Chinese solar panel exports to the EU were valued at e 21 billion and represented
roughly 7% of all Chinese exports to the EU. (Yao and Li (2013)).
In the aftermath of the financial crisis of 2008-2009, European governments came under
pressure to reduce solar panel subsidies as the European fiscal situation deteriorated.7 Al-
2See: “Study on PV electricity cost and Grid Parity,” Cuiping Ma, Dan Shi and Xiaonan Cong, Modern
Economic Science (in Chinese), 36: 85-95 (March 2014).3Germany implemented the Electricity Feed-in Act (Stromeispeisegesetz 1991-1999/2000) to provide in-
centives for renewable electricity generation. This was followed by the “100,000 Solar Roofs Initiative” in
1999-2003 which provided low interest rate loans for PV installation. The Renewable Energy Sources Act in
2000, and amendments in 2004 and 2009, provided photo voltaic-specific feed-in subsidies. See Grau, Huo,
and Neuhoff (2012).4 Source: “Global Outlook for Photovoltaics 2014–2018,” published by EPIA (European Photovoltaic
Industry Association).5On 19 December 2012, the Executive meeting of Chinese State Council convened by then Premier
Wen Jiabao confirmed that the photovoltaic industry is a strategic emerging industry. Source: Xinhua News
Agency, “Executive Meeting of State Council: Serious Over-capacity of Photovoltaic Industry”, 19 December
2012.6See Sun, Zhi, Wang, Yao, and Su (2014) on the development of China’s solar panel industry.7After prices of photovoltaic systems decreased dramatically in 2009 and the fiscal situation deteriorated,
5
though EU government support for solar panel consumption was reduced, total European
consumption of solar panel modules (measured in megawatts) actually increased by 221%
between 2009 and 2012. However, the robust growth of European consumption was not
fully enjoyed by European producers; their total sales growth of only 127% over this period
implied a declining market share (see table 2). Much of this declining market share was due
to strong import growth from China. On 24 July 2012 SolarWorld AG (Bonn, Germany)
filed a complaint with the European Commission (EC) alleging unfair pricing of solar panels
by Chinese photovoltaic manufacturers. This complaint led to a full-scale EU investigation
into dumping by Chinese firms which concluded on 2 December 2013. Over the course of the
18 month investigation, six distinct policy changes with market-relevant information took
place. The EC has a clearly defined process punctuated by a number of steps, each of which
concludes with a policy announcement. Subsequent to SolarWorlds’ filing of a complaint,
the EC made three separate trade policy announcements regarding the importation of solar
panels from China. An aspect of this antidumping case that made it somewhat unusual
was that the Chinese government made two separate industrial policy changes during this
same time window.
We examine the stock market responses to six policy events: (1) the filing of the com-
plaint by EU firms against Chinese solar panel firms, (2) the EU’s preliminary ruling to
impose provisional tariffs on solar panels temporarily while the investigation proceeded,
(3) the initial announcement of solar industry development guidelines by the Chinese gov-
ernment, (4) the announcement of an amendment to the preliminary ruling that replaced
provisional tariffs with a price floor agreement with most Chinese firms and that raised
provisional tariffs against the remaining Chinese firms, (5) the announcement of the de-
tailed features of the Chinese subsidy scheme by the Chinese government on Monday 30
August 2013, and (6) the EC’s final decision to restrict solar panel imports through a price
undertaking (i.e., price floor and quota) agreement with most Chinese firms and high im-
port tariffs against others.8 Our analysis focuses on policy announcements by the European
Commission and official Chinese government entities as these two markets were the major
consumers of solar panels over this period.9 Table 1 outlines the development of events over
the German government decided to reduce the feed-in tariff (i.e., a subsidy) in July 2010 (Grau, Huo, and
Neuhoff (2012)). Spain completely suspended its feed-in tariff (subsidy program) in January 2012. (Brown
(2013)).8Appendix A lists all the firms in our sample and indicates if they participated in the price undertaking
negotiated for the amendment to the provisional decision, the price undertaking negotiated for the final
decision, and whether or not they satisfied the Chinese government’s efficiency requirements laid out in the
Development Guideline.9A similar trade policy investigation against Chinese solar panel firms took place in the US between
October 2011 and November 2012. However, the quantitative importance of the the US market to Chinese
firms at this time was minor. For example, in 2010 consumption of solar modules in the European Union
was 12198 MW with 8606 MW being imported from China. American consumption of solar panel modules
in the same year of 1035 MW was less than one-tenth of Europe’s and American imports from China
of 527 MW were less than one-sixteenth of Europe’s. As the American market was so small, we do not
6
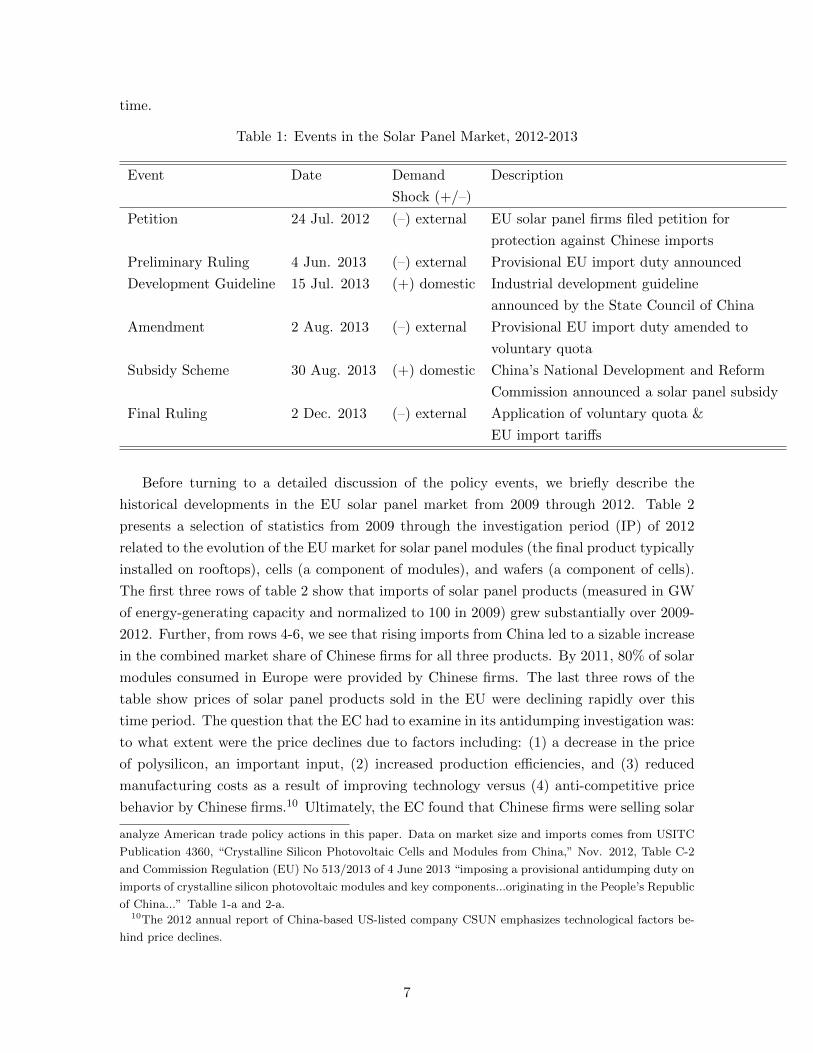
time.
Table 1: Events in the Solar Panel Market, 2012-2013
Event Date Demand Description
Shock (+/–)
Petition 24 Jul. 2012 (–) external EU solar panel firms filed petition for
protection against Chinese imports
Preliminary Ruling 4 Jun. 2013 (–) external Provisional EU import duty announced
Development Guideline 15 Jul. 2013 (+) domestic Industrial development guideline
announced by the State Council of China
Amendment 2 Aug. 2013 (–) external Provisional EU import duty amended to
voluntary quota
Subsidy Scheme 30 Aug. 2013 (+) domestic China’s National Development and Reform
Commission announced a solar panel subsidy
Final Ruling 2 Dec. 2013 (–) external Application of voluntary quota &
EU import tariffs
Before turning to a detailed discussion of the policy events, we briefly describe the
historical developments in the EU solar panel market from 2009 through 2012. Table 2
presents a selection of statistics from 2009 through the investigation period (IP) of 2012
related to the evolution of the EU market for solar panel modules (the final product typically
installed on rooftops), cells (a component of modules), and wafers (a component of cells).
The first three rows of table 2 show that imports of solar panel products (measured in GW
of energy-generating capacity and normalized to 100 in 2009) grew substantially over 2009-
2012. Further, from rows 4-6, we see that rising imports from China led to a sizable increase
in the combined market share of Chinese firms for all three products. By 2011, 80% of solar
modules consumed in Europe were provided by Chinese firms. The last three rows of the
table show prices of solar panel products sold in the EU were declining rapidly over this
time period. The question that the EC had to examine in its antidumping investigation was:
to what extent were the price declines due to factors including: (1) a decrease in the price
of polysilicon, an important input, (2) increased production efficiencies, and (3) reduced
manufacturing costs as a result of improving technology versus (4) anti-competitive price
behavior by Chinese firms.10 Ultimately, the EC found that Chinese firms were selling solar
analyze American trade policy actions in this paper. Data on market size and imports comes from USITC
Publication 4360, “Crystalline Silicon Photovoltaic Cells and Modules from China,” Nov. 2012, Table C-2
and Commission Regulation (EU) No 513/2013 of 4 June 2013 “imposing a provisional antidumping duty on
imports of crystalline silicon photovoltaic modules and key components...originating in the People’s Republic
of China...” Table 1-a and 2-a.10The 2012 annual report of China-based US-listed company CSUN emphasizes technological factors be-
hind price declines.
7
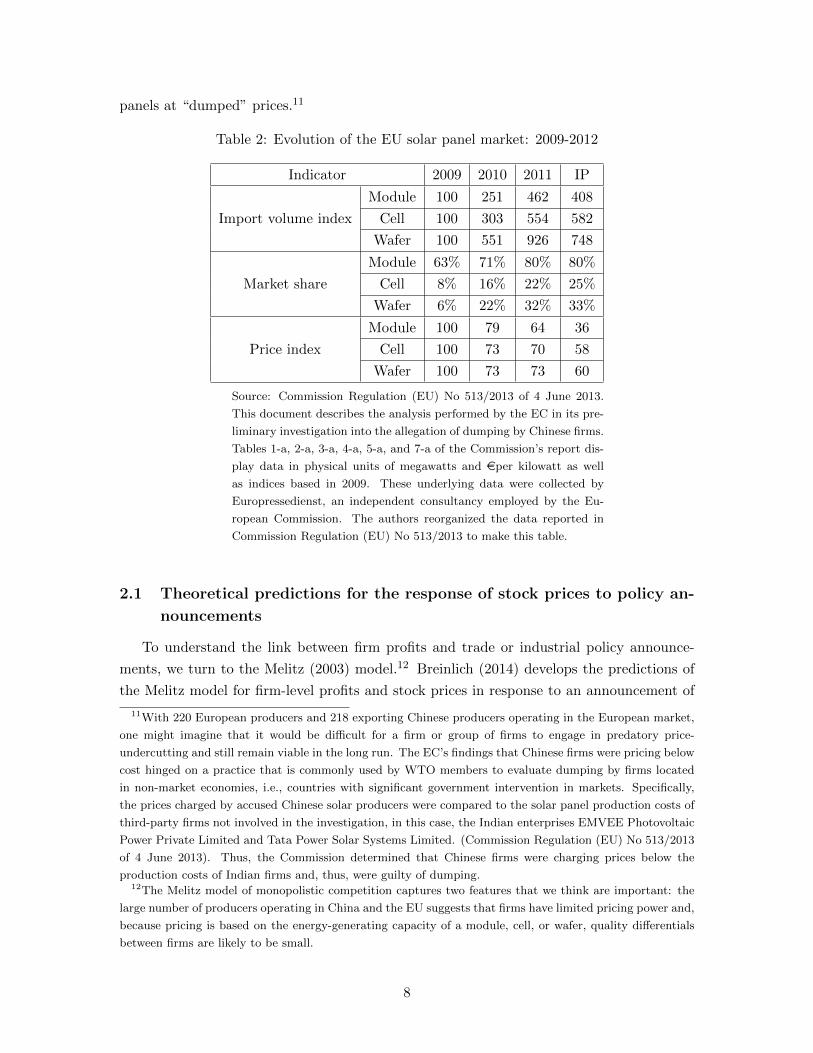
panels at “dumped” prices.11
Table 2: Evolution of the EU solar panel market: 2009-2012
Indicator 2009 2010 2011 IP
Import volume index
Module 100 251 462 408
Cell 100 303 554 582
Wafer 100 551 926 748
Market share
Module 63% 71% 80% 80%
Cell 8% 16% 22% 25%
Wafer 6% 22% 32% 33%
Price index
Module 100 79 64 36
Cell 100 73 70 58
Wafer 100 73 73 60
Source: Commission Regulation (EU) No 513/2013 of 4 June 2013.
This document describes the analysis performed by the EC in its pre-
liminary investigation into the allegation of dumping by Chinese firms.
Tables 1-a, 2-a, 3-a, 4-a, 5-a, and 7-a of the Commission’s report dis-
play data in physical units of megawatts and eper kilowatt as well
as indices based in 2009. These underlying data were collected by
Europressedienst, an independent consultancy employed by the Eu-
ropean Commission. The authors reorganized the data reported in
Commission Regulation (EU) No 513/2013 to make this table.
2.1 Theoretical predictions for the response of stock prices to policy an-
nouncements
To understand the link between firm profits and trade or industrial policy announce-
ments, we turn to the Melitz (2003) model.12 Breinlich (2014) develops the predictions of
the Melitz model for firm-level profits and stock prices in response to an announcement of
11With 220 European producers and 218 exporting Chinese producers operating in the European market,
one might imagine that it would be difficult for a firm or group of firms to engage in predatory price-
undercutting and still remain viable in the long run. The EC’s findings that Chinese firms were pricing below
cost hinged on a practice that is commonly used by WTO members to evaluate dumping by firms located
in non-market economies, i.e., countries with significant government intervention in markets. Specifically,
the prices charged by accused Chinese solar producers were compared to the solar panel production costs of
third-party firms not involved in the investigation, in this case, the Indian enterprises EMVEE Photovoltaic
Power Private Limited and Tata Power Solar Systems Limited. (Commission Regulation (EU) No 513/2013
of 4 June 2013). Thus, the Commission determined that Chinese firms were charging prices below the
production costs of Indian firms and, thus, were guilty of dumping.12The Melitz model of monopolistic competition captures two features that we think are important: the
large number of producers operating in China and the EU suggests that firms have limited pricing power and,
because pricing is based on the energy-generating capacity of a module, cell, or wafer, quality differentials
between firms are likely to be small.
8
a trade liberalization. In the Melitz model, firms have heterogeneous productivity levels,
are engaged in monopolistic competition, and must pay a fixed cost in order to export.
This implies that only the most productive firms export; among exporters, more productive
firms export larger quantities and earn higher profits. Thus, the model predicts that firms
that are more productive (by labour productivity or total factor productivity), are larger
(by employment or sales), and have a higher export share will experience larger expected
profit gains in response to the announcement of a tariff liberalization. Interestingly, with
regard to foreign exporting firms, the Melitz model predicts that moving from free trade
to a restrictive import tariff has the proportionally largest negative impact on the profits
of the most productive firms. That is, while all extant exporting firms would experience a
reduction in profits or increase in the probability of exiting the foreign market in response
to an increase in a foreign import tariff, as a fraction of intial profits, the largest propor-
tional loss would accrue to the firms in the industry with the highest export shares and
productivity.
This theoretical framework provided by the Melitz model guides our expectations about
each of the policy announcements examined.
The first policy event was the filing of the antidumping petition by SolarWorld AG on 24
July 2012. This event represented an increase in the probability of future trade restrictions
against Chinese firms exporting to the EU. As all firms in our sample were exporting to the
EU, Melitz’ theory predicts a decline in Chinese firms’ market values, with larger declines in
expected returns for the firms with the highest export shares, which under the assumptions
of the Melitz model are also the firms with the highest productivity.
The second policy event, the announcement of a provisional antidumping duty of 11.8%
on 4 June 2013 was an actual reduction in market access. The Melitz model predicts a
reduction in expected future profits arising from the provisional tariff increase in the near
term (approximately 6 months) and an increase in the probability of a long term (e.g. 5 year)
import tariff. Again, larger declines in stock returns are predicted for more export-oriented
and more productive firms.
The third policy event, on 15 July 2013, was a Chinese government issuance of new regu-
lations for the solar panel industry. The official Development Guideline of the State Council
of China established ambitious growth, investment and production efficiency standards. In
explicitly laying out production efficiency requirements for producing firms, the Develop-
ment Guideline created winners and losers across Chinese firms by (essentially) restricting
capacity expansion to the most efficient producers and requiring firm closures and indus-
try consolidation.13 The Guideline implied a substantial increase in domestic consumption
13Explicit requirements for new manufacturing sites were set out in the Guideline. For example, to qualify
for a plant expansion, a firm’s existing conversion efficiency ratios had to be greater than or equal to 20%
for mono-crystalline silicon and 18% for poly-crystalline silicon. In addition, the Guideline also stipulated
that the total integrated energy consumption for the production of poly-crystalline silicon could not exceed
an average of 100 kWh per kg of poly-crystalline silicon material produced. Appendix A reports in column 4
9
of PV products within China as the State Council set the annual growth of PV installed
capacity at no less than 10GW from 2013 to 2015, with the intent of reaching 35GW of
installed capacity by 2015.14 The Guideline implied a large positive demand shock for solar
panels. Both the Melitz model and a standard n-firm Cournot oligopoly with heterogeneous
costs predict the largest profit gains for the most productive or lowest cost firms.
The fourth policy announcement of 2 August 2013 was complicated. On this date,
the Commission amended its preliminary ruling by replacing the import tariff of 11.8%
on all Chinese solar panels with a negotiated price undertaking or price floor. Starting
with this announcement, the European Commission began to introduce a small amount of
heterogeneity across firms in the restrictiveness of the import policy. The first dimension of
heterogeneity was participation in the price undertaking agreement. Most of the firms in
our sample participated in the price undertaking; Appendix A lists each firm’s participation
status.15
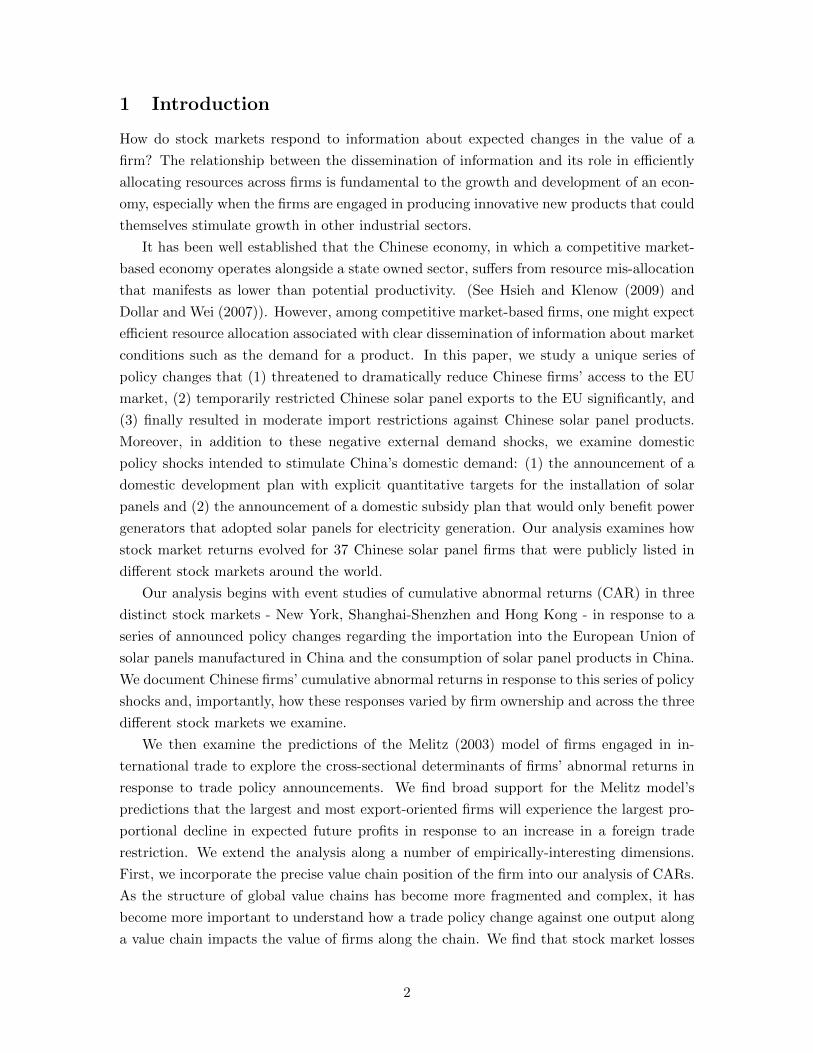
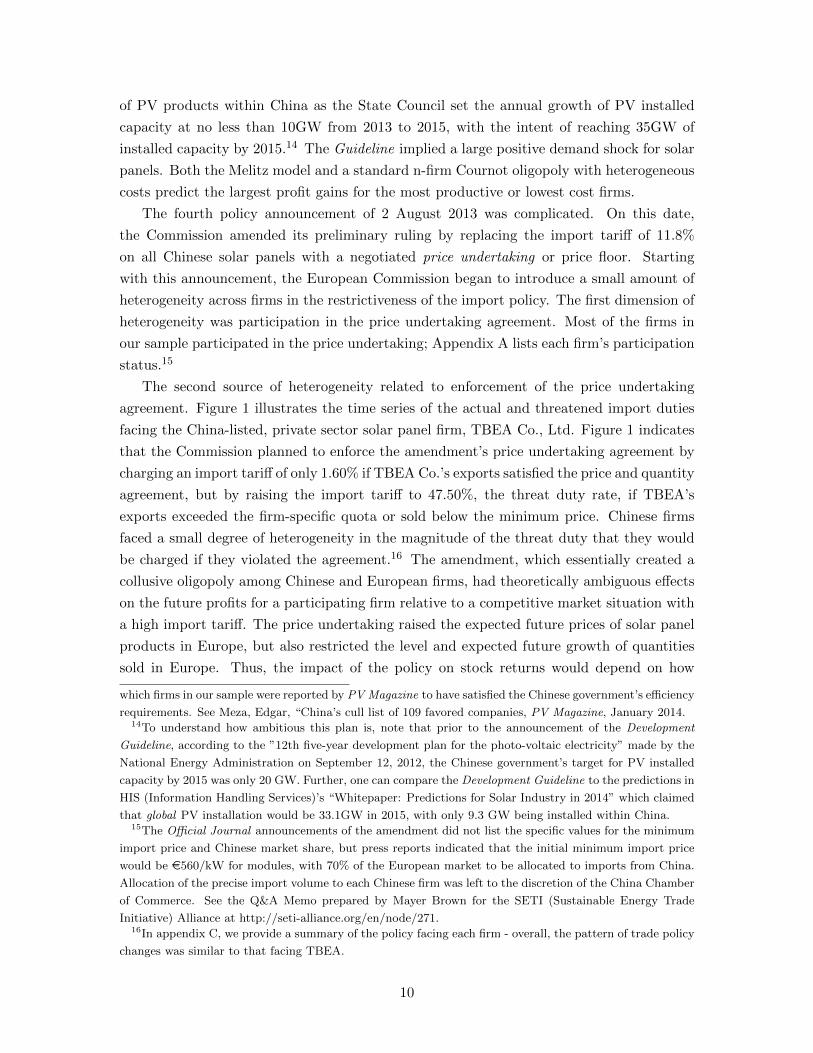
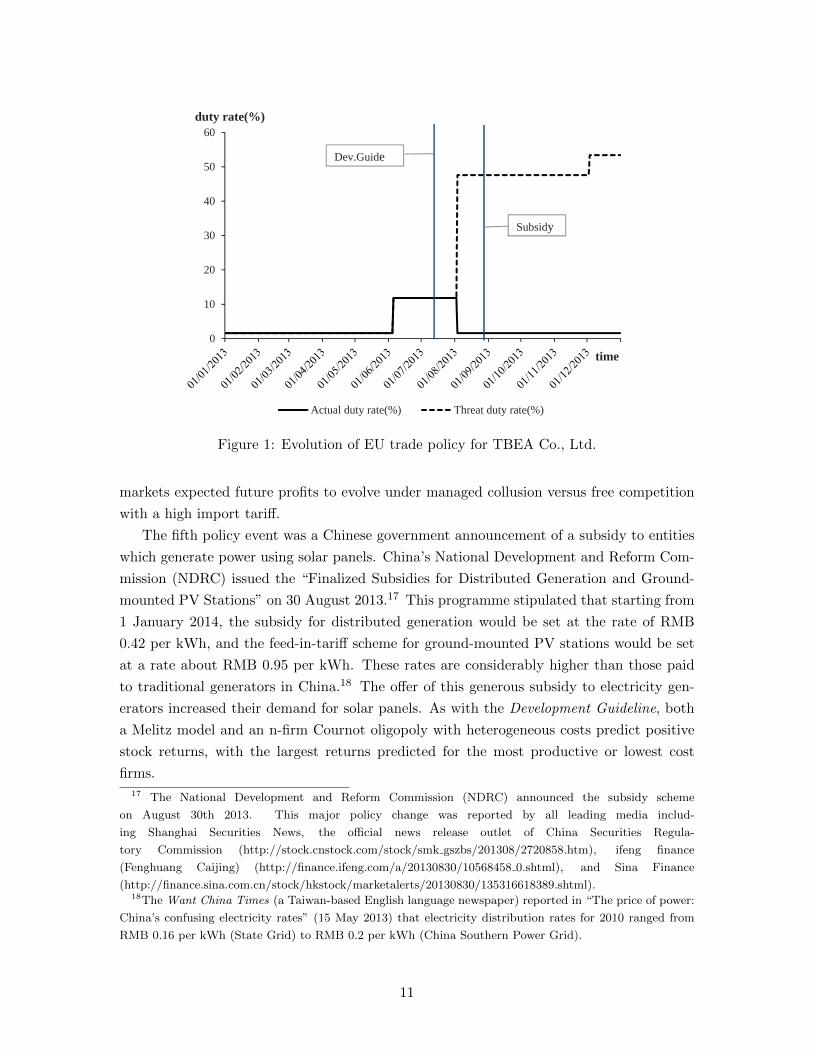
The second source of heterogeneity related to enforcement of the price undertaking
agreement. Figure 1 illustrates the time series of the actual and threatened import duties
facing the China-listed, private sector solar panel firm, TBEA Co., Ltd. Figure 1 indicates
that the Commission planned to enforce the amendment’s price undertaking agreement by
charging an import tariff of only 1.60% if TBEA Co.’s exports satisfied the price and quantity
agreement, but by raising the import tariff to 47.50%, the threat duty rate, if TBEA’s
exports exceeded the firm-specific quota or sold below the minimum price. Chinese firms
faced a small degree of heterogeneity in the magnitude of the threat duty that they would
be charged if they violated the agreement.16 The amendment, which essentially created a
collusive oligopoly among Chinese and European firms, had theoretically ambiguous effects
on the future profits for a participating firm relative to a competitive market situation with
a high import tariff. The price undertaking raised the expected future prices of solar panel
products in Europe, but also restricted the level and expected future growth of quantities
sold in Europe. Thus, the impact of the policy on stock returns would depend on how
which firms in our sample were reported by PV Magazine to have satisfied the Chinese government’s efficiency
requirements. See Meza, Edgar, “China’s cull list of 109 favored companies, PV Magazine, January 2014.14To understand how ambitious this plan is, note that prior to the announcement of the Development
Guideline, according to the ”12th five-year development plan for the photo-voltaic electricity” made by the
National Energy Administration on September 12, 2012, the Chinese government’s target for PV installed
capacity by 2015 was only 20 GW. Further, one can compare the Development Guideline to the predictions in
HIS (Information Handling Services)’s “Whitepaper: Predictions for Solar Industry in 2014” which claimed
that global PV installation would be 33.1GW in 2015, with only 9.3 GW being installed within China.15The Official Journal announcements of the amendment did not list the specific values for the minimum
import price and Chinese market share, but press reports indicated that the initial minimum import price
would be e560/kW for modules, with 70% of the European market to be allocated to imports from China.
Allocation of the precise import volume to each Chinese firm was left to the discretion of the China Chamber
of Commerce. See the Q&A Memo prepared by Mayer Brown for the SETI (Sustainable Energy Trade
Initiative) Alliance at http://seti-alliance.org/en/node/271.16In appendix C, we provide a summary of the policy facing each firm - overall, the pattern of trade policy
changes was similar to that facing TBEA.
10
0
10
20
30
40
50
60
Actual duty rate(%) Threat duty rate(%)
time
duty rate(%)
Dev.Guide
Subsidy
Figure 1: Evolution of EU trade policy for TBEA Co., Ltd.
markets expected future profits to evolve under managed collusion versus free competition
with a high import tariff.
The fifth policy event was a Chinese government announcement of a subsidy to entities
which generate power using solar panels. China’s National Development and Reform Com-
mission (NDRC) issued the “Finalized Subsidies for Distributed Generation and Ground-
mounted PV Stations” on 30 August 2013.17 This programme stipulated that starting from
1 January 2014, the subsidy for distributed generation would be set at the rate of RMB
0.42 per kWh, and the feed-in-tariff scheme for ground-mounted PV stations would be set
at a rate about RMB 0.95 per kWh. These rates are considerably higher than those paid
to traditional generators in China.18 The offer of this generous subsidy to electricity gen-
erators increased their demand for solar panels. As with the Development Guideline, both
a Melitz model and an n-firm Cournot oligopoly with heterogeneous costs predict positive
stock returns, with the largest returns predicted for the most productive or lowest cost
firms.
17 The National Development and Reform Commission (NDRC) announced the subsidy scheme
on August 30th 2013. This major policy change was reported by all leading media includ-
ing Shanghai Securities News, the official news release outlet of China Securities Regula-
tory Commission (http://stock.cnstock.com/stock/smk gszbs/201308/2720858.htm), ifeng finance
(Fenghuang Caijing) (http://finance.ifeng.com/a/20130830/10568458 0.shtml), and Sina Finance
(http://finance.sina.com.cn/stock/hkstock/marketalerts/20130830/135316618389.shtml).18The Want China Times (a Taiwan-based English language newspaper) reported in “The price of power:
China’s confusing electricity rates” (15 May 2013) that electricity distribution rates for 2010 ranged from
RMB 0.16 per kWh (State Grid) to RMB 0.2 per kWh (China Southern Power Grid).
11
The sixth and final policy event in our study was the final ruling in the solar panel
antidumping case by the European Commission on 2 December 2013. The European Com-
mission confirmed its decision to accept the price undertaking (i.e., the price floor and
firm-specific market shares) offered by Chinese exporting producers. This decision enabled
Chinese exporting producers who participated in the undertaking to be exempt from paying
any antidumping duties. The final price undertaking agreement included 121 firms which
represented 80% of the total volume of solar panel products imported from China. The
remaining firms, which did not fully cooperate with the EC’s investigation, faced AD duty
rates from 47% to 64.9%. Appendix A lists each firm’s participation status in the final price
undertaking (UT). The expected impact of this announcement on stock returns is generally
ambiguous (because it raised prices but lowered firm-level quantities).
3 Data
Our dataset comprises 37 solar panel firms whose production facilities are located in
China. All of these firms are publicly-listed entities, of which 17 are publicly-listed in the
Shanghai-Shenzhen stock market, 11 are listed on US markets (7 are listed in NYSE and
4 are listed in NASDAQ), and 9 are listed on the Hong Kong Stock Exchange. Together,
these firms accounted for 80% of China’s solar panel output in 2012.19
The first component of the dataset are the daily stock prices and average market re-
turns from April 2012 through December 2013. For firms listed on the Chinese markets
and the Hong Kong market, which we refer to as China-listed and Hong Kong-listed,
respectively, the firms’ stock returns and the market returns were obtained from Wind
(www.wind.com.cn). Those for US-listed firms were obtained from Wharton Research
Data Services (WRDS, wrds-web.wharton.upenn.edu) and the Center for Research on Stock
Prices (CRSP, www.crsp.com).
The second component of the dataset is detailed information about the individual firms
obtained from annual reports. We carefully reviewed the annual reports of all firms in our
sample for two years, 2011 and 2012.20 For each firm we extracted: (1) the total value of
assets, (2) the total number of employees (in addition, for US and Chinese firms, we also
collected the total number of production employees), (3) the firms’ total revenues, (4) the
age of the firm, (5) the firm’s leverage, (6) the firm’s total export share defined as total
export sales divided by total revenues, and (7) the firm’s R&D expenditures.
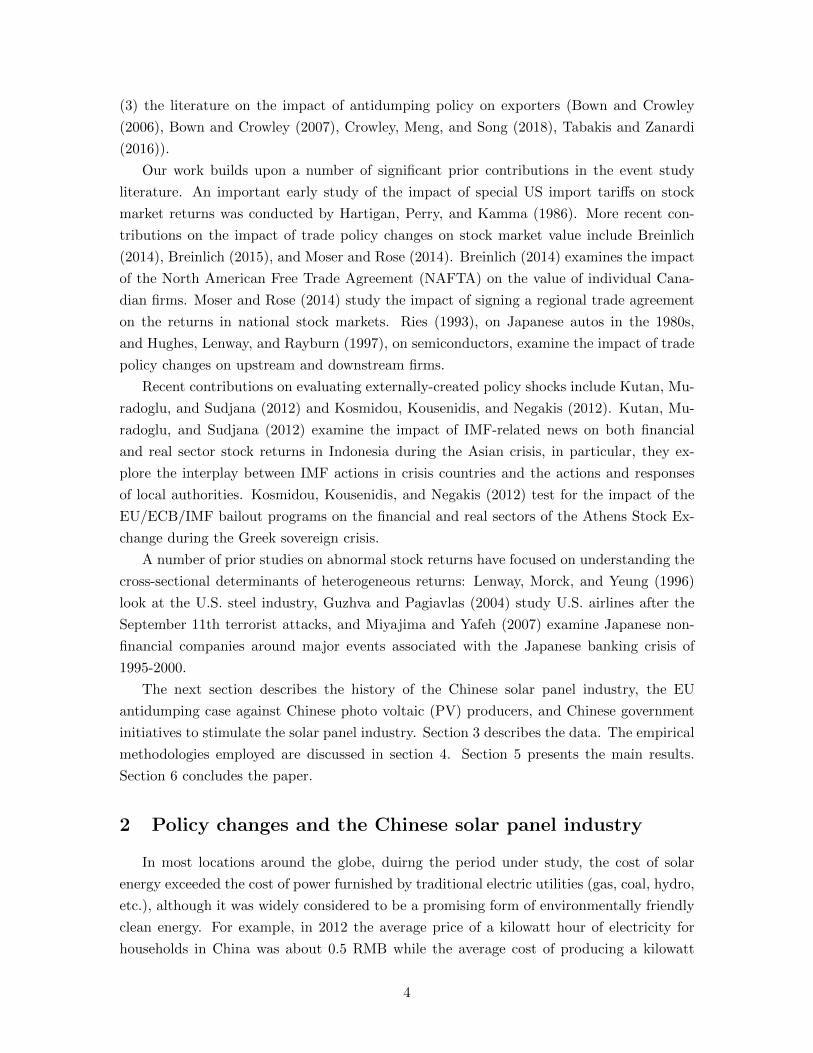
Because we are interested in understanding how a firm’s position along the production
chain impacted its stock market returns, we also construct one additional variable, (8)
product mix. The solar panel production process consists of six clearly-cut stages along a
19 The European Commission’s antidumping case listed 218 entities producing solar panels in China. (See
Official Journal Commission (EU) Regulation No. 748/2013 of 2 August 2013. 80 of these entities were
subsidiaries of the 37 publicly-listed firms in our sample. See Appendix B for the list of subsidiaries.20These annual reports covered all operation and financial information for the fiscal years 2011 and 2012.
12
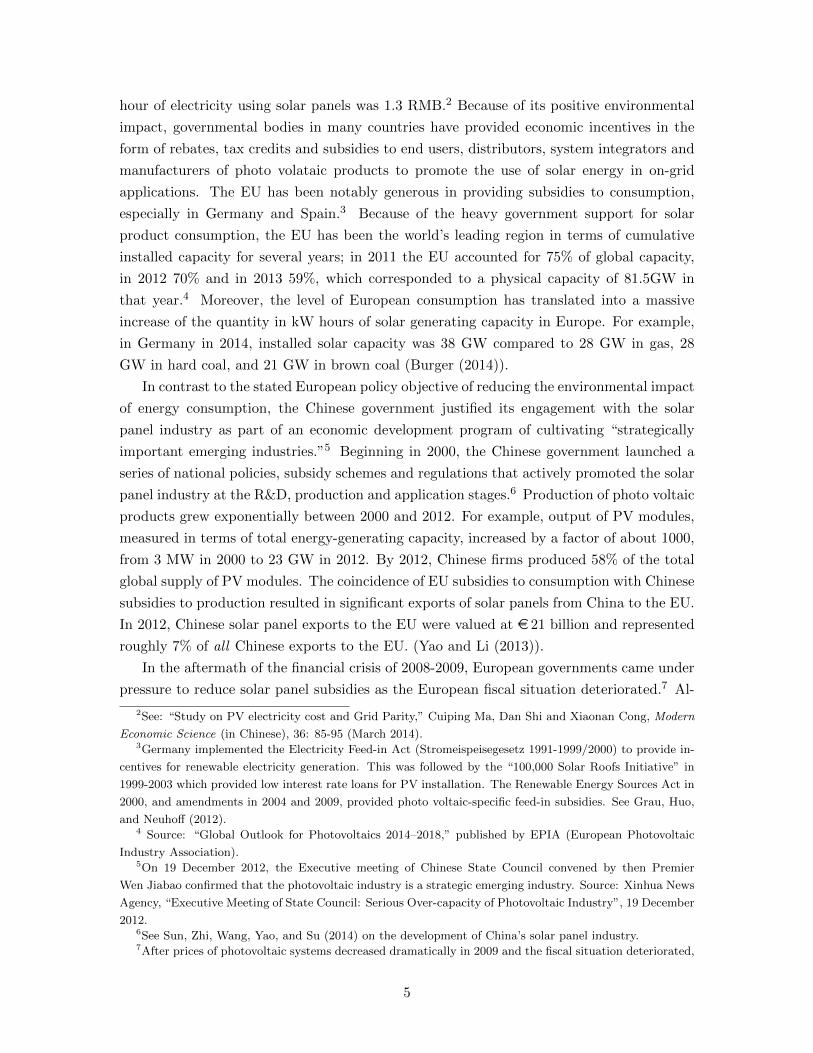
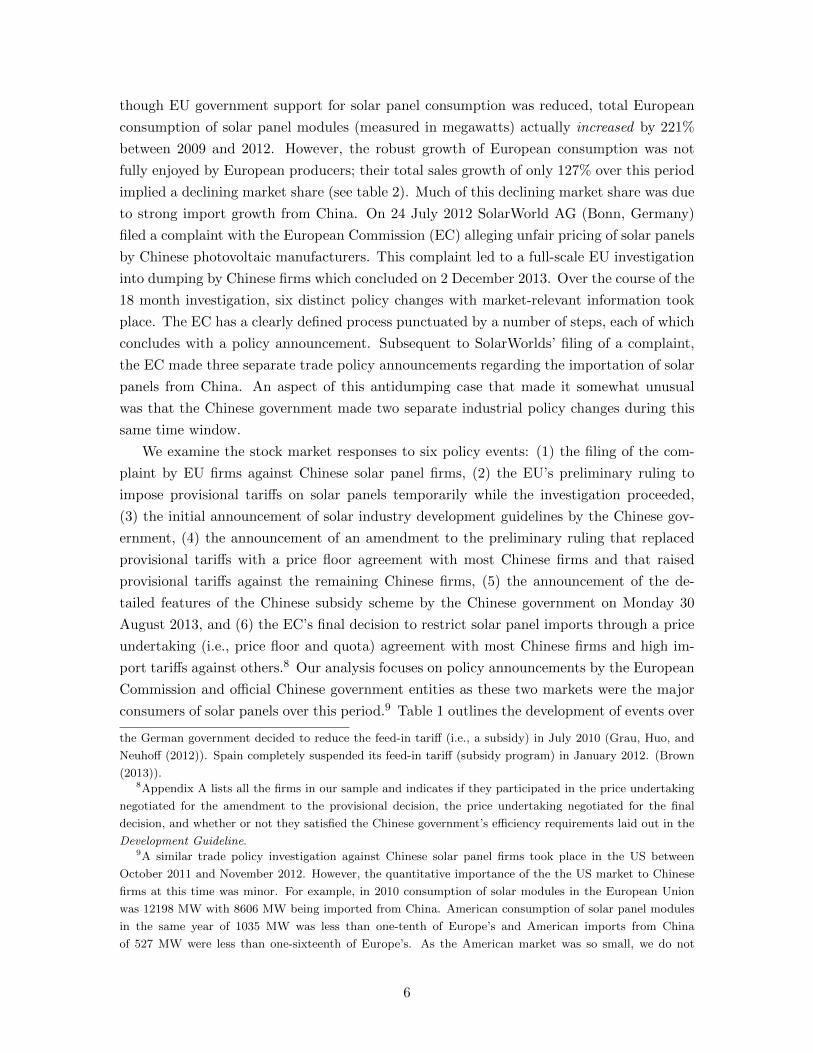
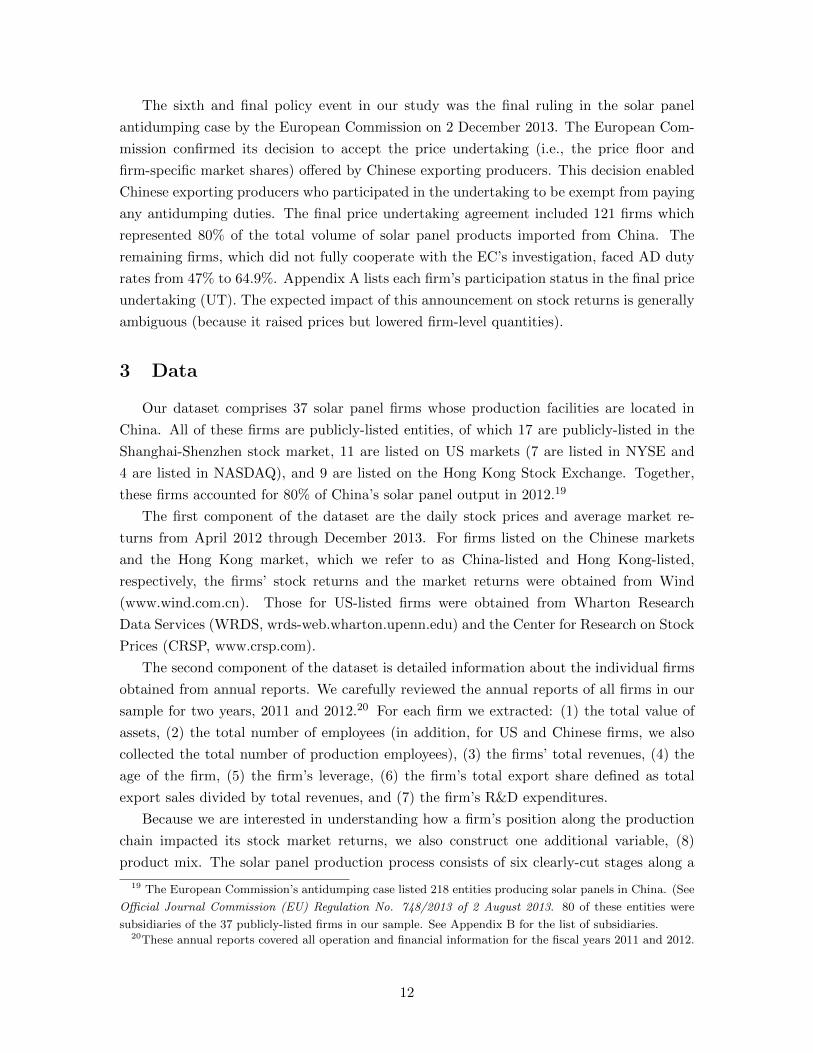
value chain that correspond to six distinct products: silicon, ingot, wafer, photo voltaic cell,
photo voltaic module and photo voltaic system. Along this chain, firms may be actively
engaged in one or more stages. Figures 2, 3 and 4 summarize the value chain of each
firm. These figures are constructed from information in the firms’ annual reports and are
supplemented, when necessary, with information from firms’ websites. We use main sales
to denote a firm’s most important production stage(s) by sales volume and indicate these
stages with red blocks in figures 2, 3 and 4 . If more than one stage have comparable sales
volume shares, we record all of these stages as main sales. We also record production
line activity with blue blocks in the figures if a firm reports that it engages in a stage in its
annual report or website AND if the sales volume for that stage is not negligible. From the
information in figures 2, 3 and 4, we construct the dummy variable which we will use in our
empirical analysis: product mix. This variable is equal to one if a firm’s main sales are in
wafers, cells, or modules (WCM), the three products targeted by the European antidumping
case.
Finally, we calculate the share of EU exports relative to the firm’s total exports for each
firm using the Chinese Customs Database.
Figure 2: Value chain, China-listed companies
A brief examination of figures 2, 3 and 4 reveals some basic patterns. First, most China-
listed firms have their main sales in photo voltaic cells and modules with a significant share
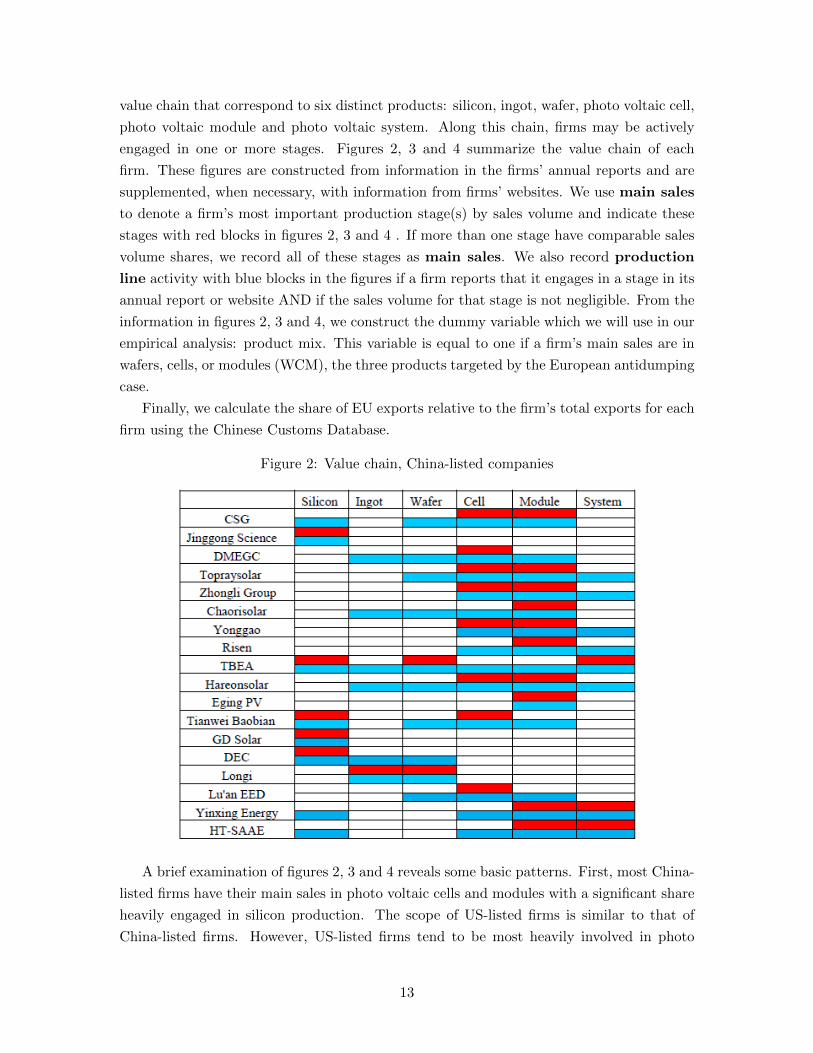
heavily engaged in silicon production. The scope of US-listed firms is similar to that of
China-listed firms. However, US-listed firms tend to be most heavily involved in photo
13
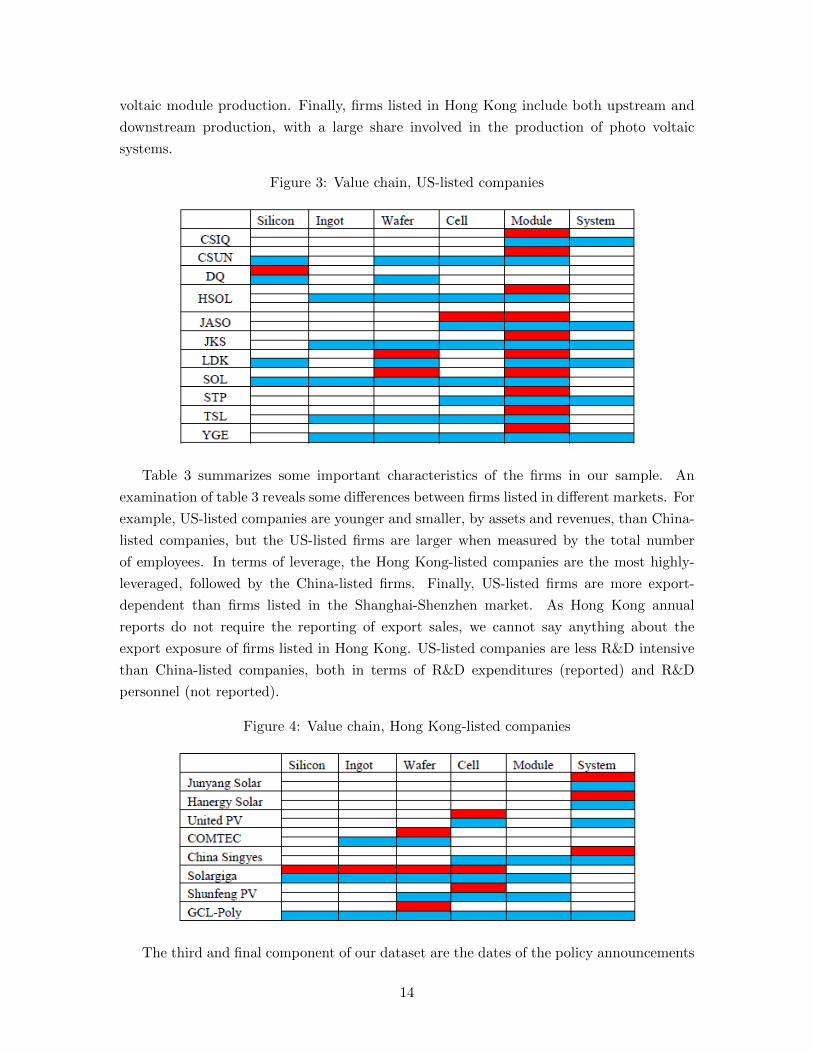
voltaic module production. Finally, firms listed in Hong Kong include both upstream and
downstream production, with a large share involved in the production of photo voltaic
systems.
Figure 3: Value chain, US-listed companies
Table 3 summarizes some important characteristics of the firms in our sample. An
examination of table 3 reveals some differences between firms listed in different markets. For
example, US-listed companies are younger and smaller, by assets and revenues, than China-
listed companies, but the US-listed firms are larger when measured by the total number
of employees. In terms of leverage, the Hong Kong-listed companies are the most highly-
leveraged, followed by the China-listed firms. Finally, US-listed firms are more export-
dependent than firms listed in the Shanghai-Shenzhen market. As Hong Kong annual
reports do not require the reporting of export sales, we cannot say anything about the
export exposure of firms listed in Hong Kong. US-listed companies are less R&D intensive
than China-listed companies, both in terms of R&D expenditures (reported) and R&D
personnel (not reported).
Figure 4: Value chain, Hong Kong-listed companies
The third and final component of our dataset are the dates of the policy announcements
14
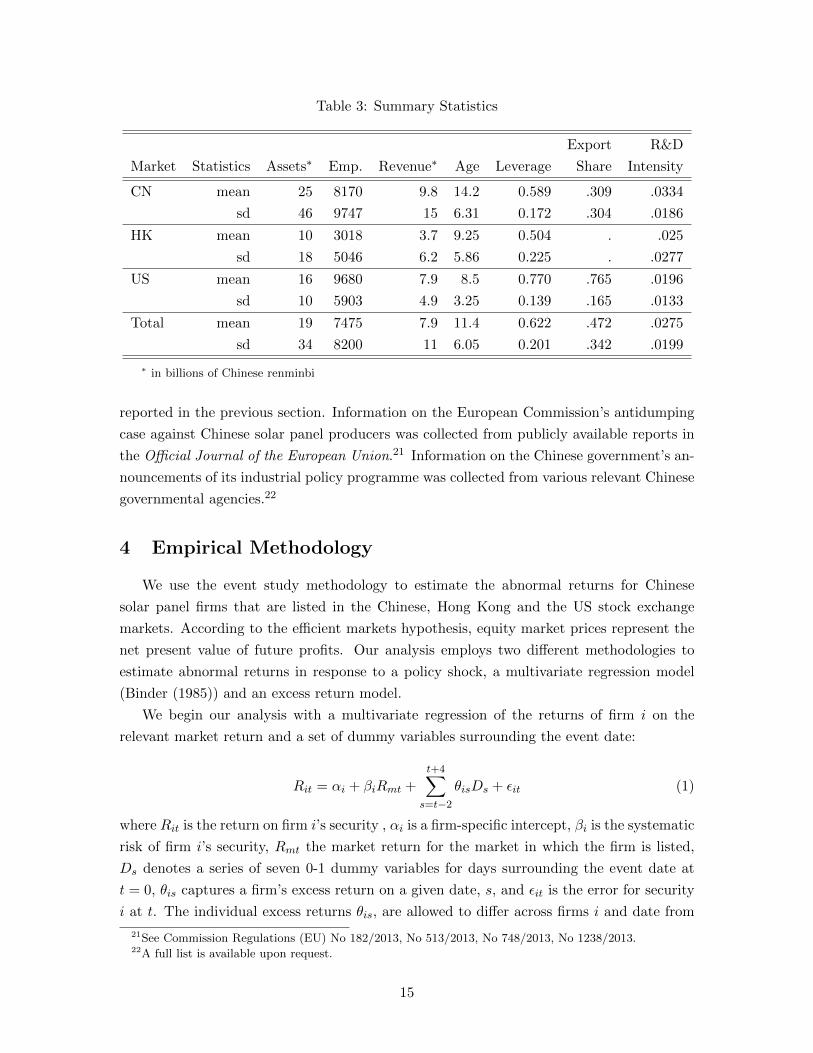
Table 3: Summary Statistics
Export R&D
Market Statistics Assets∗ Emp. Revenue∗ Age Leverage Share Intensity
CN mean 25 8170 9.8 14.2 0.589 .309 .0334
sd 46 9747 15 6.31 0.172 .304 .0186
HK mean 10 3018 3.7 9.25 0.504 . .025
sd 18 5046 6.2 5.86 0.225 . .0277
US mean 16 9680 7.9 8.5 0.770 .765 .0196
sd 10 5903 4.9 3.25 0.139 .165 .0133
Total mean 19 7475 7.9 11.4 0.622 .472 .0275
sd 34 8200 11 6.05 0.201 .342 .0199
∗ in billions of Chinese renminbi
reported in the previous section. Information on the European Commission’s antidumping
case against Chinese solar panel producers was collected from publicly available reports in
the Official Journal of the European Union.21 Information on the Chinese government’s an-
nouncements of its industrial policy programme was collected from various relevant Chinese
governmental agencies.22
4 Empirical Methodology
We use the event study methodology to estimate the abnormal returns for Chinese
solar panel firms that are listed in the Chinese, Hong Kong and the US stock exchange
markets. According to the efficient markets hypothesis, equity market prices represent the
net present value of future profits. Our analysis employs two different methodologies to
estimate abnormal returns in response to a policy shock, a multivariate regression model
(Binder (1985)) and an excess return model.
We begin our analysis with a multivariate regression of the returns of firm i on the
relevant market return and a set of dummy variables surrounding the event date:
Rit = αi + βiRmt +
t+4∑s=t−2
θisDs + εit (1)
where Rit is the return on firm i’s security , αi is a firm-specific intercept, βi is the systematic
risk of firm i’s security, Rmt the market return for the market in which the firm is listed,
Ds denotes a series of seven 0-1 dummy variables for days surrounding the event date at
t = 0, θis captures a firm’s excess return on a given date, s, and εit is the error for security
i at t. The individual excess returns θis, are allowed to differ across firms i and date from
21See Commission Regulations (EU) No 182/2013, No 513/2013, No 748/2013, No 1238/2013.22A full list is available upon request.
15
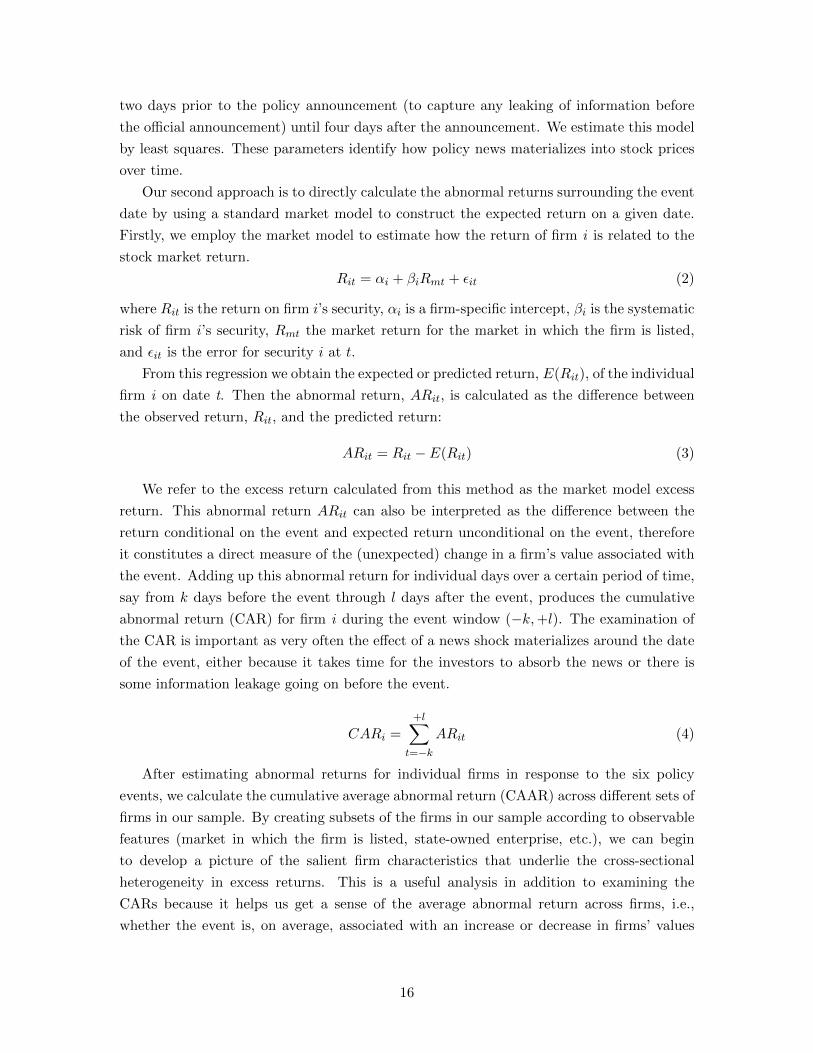
two days prior to the policy announcement (to capture any leaking of information before
the official announcement) until four days after the announcement. We estimate this model
by least squares. These parameters identify how policy news materializes into stock prices
over time.
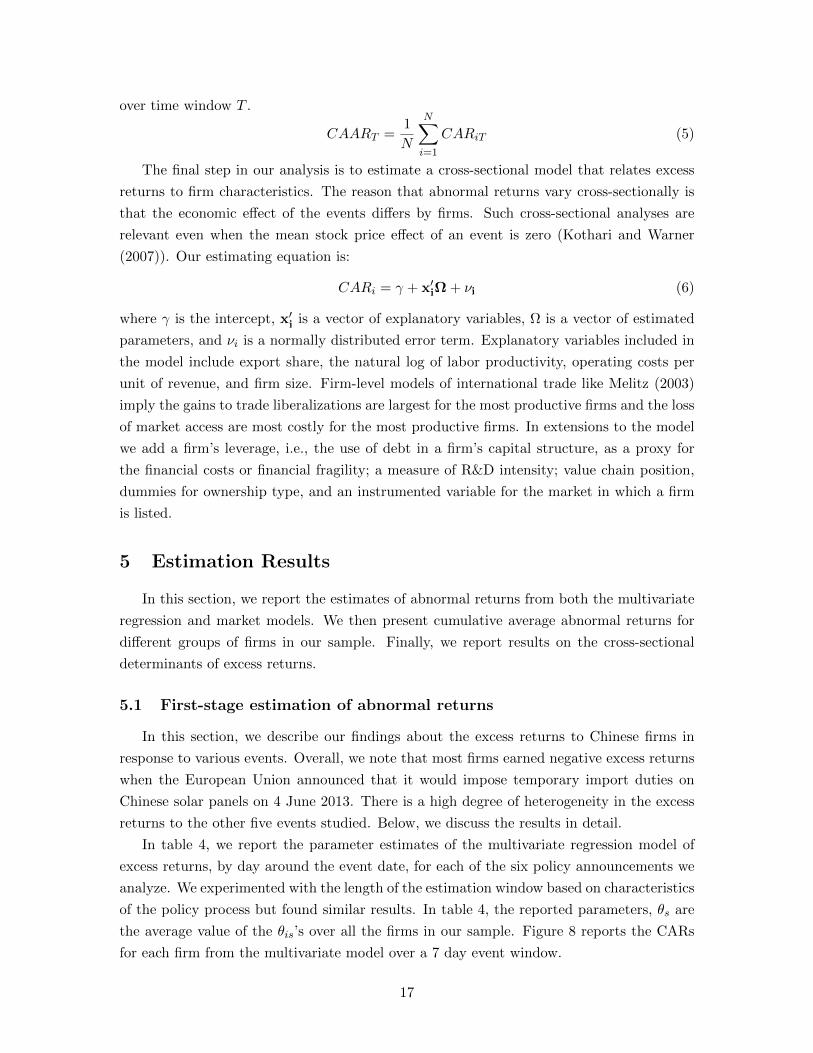
Our second approach is to directly calculate the abnormal returns surrounding the event
date by using a standard market model to construct the expected return on a given date.
Firstly, we employ the market model to estimate how the return of firm i is related to the
stock market return.
Rit = αi + βiRmt + εit (2)
where Rit is the return on firm i’s security, αi is a firm-specific intercept, βi is the systematic
risk of firm i’s security, Rmt the market return for the market in which the firm is listed,
and εit is the error for security i at t.
From this regression we obtain the expected or predicted return, E(Rit), of the individual
firm i on date t. Then the abnormal return, ARit, is calculated as the difference between
the observed return, Rit, and the predicted return:
ARit = Rit − E(Rit) (3)
We refer to the excess return calculated from this method as the market model excess
return. This abnormal return ARit can also be interpreted as the difference between the
return conditional on the event and expected return unconditional on the event, therefore
it constitutes a direct measure of the (unexpected) change in a firm’s value associated with
the event. Adding up this abnormal return for individual days over a certain period of time,
say from k days before the event through l days after the event, produces the cumulative
abnormal return (CAR) for firm i during the event window (−k,+l). The examination of
the CAR is important as very often the effect of a news shock materializes around the date
of the event, either because it takes time for the investors to absorb the news or there is
some information leakage going on before the event.
CARi =
+l∑t=−k
ARit (4)
After estimating abnormal returns for individual firms in response to the six policy
events, we calculate the cumulative average abnormal return (CAAR) across different sets of
firms in our sample. By creating subsets of the firms in our sample according to observable
features (market in which the firm is listed, state-owned enterprise, etc.), we can begin
to develop a picture of the salient firm characteristics that underlie the cross-sectional
heterogeneity in excess returns. This is a useful analysis in addition to examining the
CARs because it helps us get a sense of the average abnormal return across firms, i.e.,
whether the event is, on average, associated with an increase or decrease in firms’ values
16
over time window T .
CAART =1
N
N∑i=1
CARiT (5)
The final step in our analysis is to estimate a cross-sectional model that relates excess
returns to firm characteristics. The reason that abnormal returns vary cross-sectionally is
that the economic effect of the events differs by firms. Such cross-sectional analyses are
relevant even when the mean stock price effect of an event is zero (Kothari and Warner
(2007)). Our estimating equation is:
CARi = γ + x′iΩ + νi (6)
where γ is the intercept, x′i is a vector of explanatory variables, Ω is a vector of estimated
parameters, and νi is a normally distributed error term. Explanatory variables included in
the model include export share, the natural log of labor productivity, operating costs per
unit of revenue, and firm size. Firm-level models of international trade like Melitz (2003)
imply the gains to trade liberalizations are largest for the most productive firms and the loss
of market access are most costly for the most productive firms. In extensions to the model
we add a firm’s leverage, i.e., the use of debt in a firm’s capital structure, as a proxy for
the financial costs or financial fragility; a measure of R&D intensity; value chain position,
dummies for ownership type, and an instrumented variable for the market in which a firm
is listed.
5 Estimation Results
In this section, we report the estimates of abnormal returns from both the multivariate
regression and market models. We then present cumulative average abnormal returns for
different groups of firms in our sample. Finally, we report results on the cross-sectional
determinants of excess returns.
5.1 First-stage estimation of abnormal returns
In this section, we describe our findings about the excess returns to Chinese firms in
response to various events. Overall, we note that most firms earned negative excess returns
when the European Union announced that it would impose temporary import duties on
Chinese solar panels on 4 June 2013. There is a high degree of heterogeneity in the excess
returns to the other five events studied. Below, we discuss the results in detail.
In table 4, we report the parameter estimates of the multivariate regression model of
excess returns, by day around the event date, for each of the six policy announcements we
analyze. We experimented with the length of the estimation window based on characteristics
of the policy process but found similar results. In table 4, the reported parameters, θs are
the average value of the θis’s over all the firms in our sample. Figure 8 reports the CARs
for each firm from the multivariate model over a 7 day event window.
17
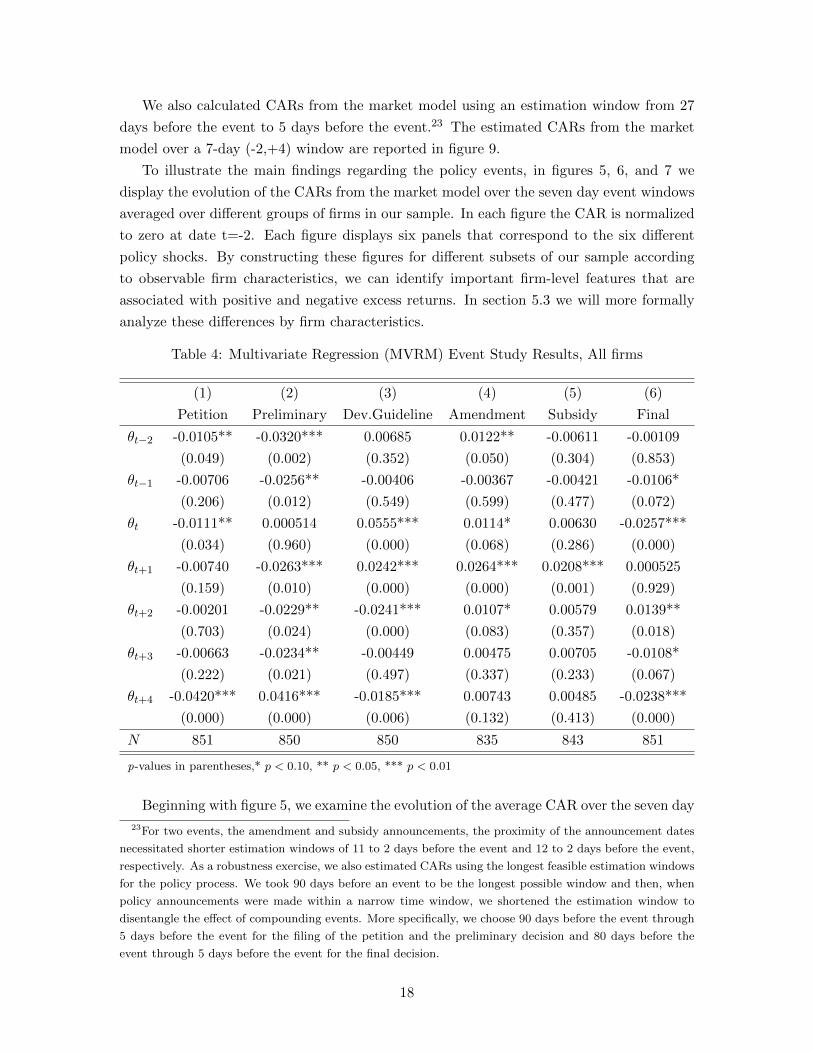
We also calculated CARs from the market model using an estimation window from 27
days before the event to 5 days before the event.23 The estimated CARs from the market
model over a 7-day (-2,+4) window are reported in figure 9.
To illustrate the main findings regarding the policy events, in figures 5, 6, and 7 we
display the evolution of the CARs from the market model over the seven day event windows
averaged over different groups of firms in our sample. In each figure the CAR is normalized
to zero at date t=-2. Each figure displays six panels that correspond to the six different
policy shocks. By constructing these figures for different subsets of our sample according
to observable firm characteristics, we can identify important firm-level features that are
associated with positive and negative excess returns. In section 5.3 we will more formally
analyze these differences by firm characteristics.
Table 4: Multivariate Regression (MVRM) Event Study Results, All firms
(1) (2) (3) (4) (5) (6)
Petition Preliminary Dev.Guideline Amendment Subsidy Final
θt−2 -0.0105** -0.0320*** 0.00685 0.0122** -0.00611 -0.00109
(0.049) (0.002) (0.352) (0.050) (0.304) (0.853)
θt−1 -0.00706 -0.0256** -0.00406 -0.00367 -0.00421 -0.0106*
(0.206) (0.012) (0.549) (0.599) (0.477) (0.072)
θt -0.0111** 0.000514 0.0555*** 0.0114* 0.00630 -0.0257***
(0.034) (0.960) (0.000) (0.068) (0.286) (0.000)
θt+1 -0.00740 -0.0263*** 0.0242*** 0.0264*** 0.0208*** 0.000525
(0.159) (0.010) (0.000) (0.000) (0.001) (0.929)
θt+2 -0.00201 -0.0229** -0.0241*** 0.0107* 0.00579 0.0139**
(0.703) (0.024) (0.000) (0.083) (0.357) (0.018)
θt+3 -0.00663 -0.0234** -0.00449 0.00475 0.00705 -0.0108*
(0.222) (0.021) (0.497) (0.337) (0.233) (0.067)
θt+4 -0.0420*** 0.0416*** -0.0185*** 0.00743 0.00485 -0.0238***
(0.000) (0.000) (0.006) (0.132) (0.413) (0.000)
N 851 850 850 835 843 851
p-values in parentheses,* p < 0.10, ** p < 0.05, *** p < 0.01
Beginning with figure 5, we examine the evolution of the average CAR over the seven day
23For two events, the amendment and subsidy announcements, the proximity of the announcement dates
necessitated shorter estimation windows of 11 to 2 days before the event and 12 to 2 days before the event,
respectively. As a robustness exercise, we also estimated CARs using the longest feasible estimation windows
for the policy process. We took 90 days before an event to be the longest possible window and then, when
policy announcements were made within a narrow time window, we shortened the estimation window to
disentangle the effect of compounding events. More specifically, we choose 90 days before the event through
5 days before the event for the filing of the petition and the preliminary decision and 80 days before the
event through 5 days before the event for the final decision.
18
event window. Each panel corresponds to one of the six policy events, with time measured
in days from the policy announcement date of zero along the x-axis and the cumulative
abnormal return on the y-axis. In each panel, the solid line is the average CAR over the
31 private sector firms and the dashed line is the average CAR over the six state owned
enterprises (SOEs) in our dataset. The light dotted lines depict the 95% confidence intervals
around each average CAR. Beginning with the left-most panel in the top row, we note that
the average impact of the filing of the antidumping petition was more negative for private
sector firms than for China’s state owned enterprises. On average, this policy announcement
was associated with differences by ownership, but the average for different groups of firms
was not large. More interestingly, in the third panel of the top row and the middle panel
of the bottom row, we see that the announcement of the Development Guideline and the
Chinese government’s subsidy plan for solar power generation both had average positive
impacts on private sector firms in China, but virtually no impact on SOEs. Further, the
average effect of the amendment to the provisional tariff order, i.e., the establishment of the
price floor and quota system, was zero. Lastly, in the bottom right, announcement of the
final decision to permanently implement a price floor and quota system, with the Chinese
firms allocated a 70% market share in the EU, was clearly negative for private sector firms,
but had no impact on the SOEs.
Turning to figure 6, we consider whether the differential impact of the policy announce-
ments on average CARs is related to the firm’s value chain position. As before, each panel
represents the average CAR to a policy announcement. In this figure, the solid line de-
notes the average across firms that have their main line of business is solar wafers, cells or
modules while the dashed line denotes firms at the other two extremes of the value chain -
primary inputs and solar power generating systems. The main takeaway from this figure is
that firms engaged in wafer, cell or module production experience more negative abnormal
returns in response to European policy announcements like the initiation of the petition and
the final imposition of the price floor and quota than other firms. These same producers
also respond most positively to the Chinese industrial policy announcements.
Differential responses by the stock market in which a firm is listed are displayed in figure
7. In this figure, the solid line represents the average CAR across firms listed in Chinese
stock markets, the dark dashed line is the average CAR across firms listed in US markets,
and the lighter dashed line indicates the average CAR over firms listed on the Hong Kong
Stock Exchange. Large differences in the average CAR between US-listed and Chinese-
listed firms are evident in response to the filing of the antidumping petition with European
Commission, in response to the announcement of the Chinese Development Guideline, in
response to the EC’s amendment to its preliminary tariff establishing a price floor and
quota, and in response to the announcement of the subsidy program.24
24 We acknowledge that one possible explanation for the difference in average responses between the
Chinese and the US or Hong Kong stock markets could be that the Chinese market is less efficient at
processing new information into stock prices (perhaps because the share of sophisticated market participants
19
While the previous figures have given us a broad picture of the evolution of abnormal
returns, they obscure the interesting cross-sectional heterogeneity in firm responses. In
figure 8, we present the firms’ individual CARs over the seven day event window based on
the multivariate regression model. Similarly, figure 9 displays firms’ CARs derived from the
market model (i.e., realized less predicted return from the market model). The abnormal
returns presented in these two figures are those which we will examine further in section
5.3.
To read figure 8, note that each panel represents one of the six policy announcements.
The vertical axis measures the 7 day cumulative abnormal return of a firm with each bar
along the x-axis corresponding to a firm; bars 1-18 represent China-listed firms, bars 19-29
represent US-listed firms and bars 30-37 represent firms listed in Hong Kong. See appendix
A for the correspondence between bar numbers and a firm’s name. Clearly we see the
policy news has heterogeneous impacts on these firms. For US-listed firms, the effects of
the various EU policy announcements (petition, preliminary, amendment, and final) are
is substantially lower). If this is correct, the use of the efficient market model might not be appropriate.
However, in figures 8 and 9, where we report the CARs of individual firms, the fact that many China-listed
firms share the same qualitative pattern of response to policy announcement shocks, even if the magnitude
is smaller, leads us to believe that the use of the efficient markets model in this context is justified.
20
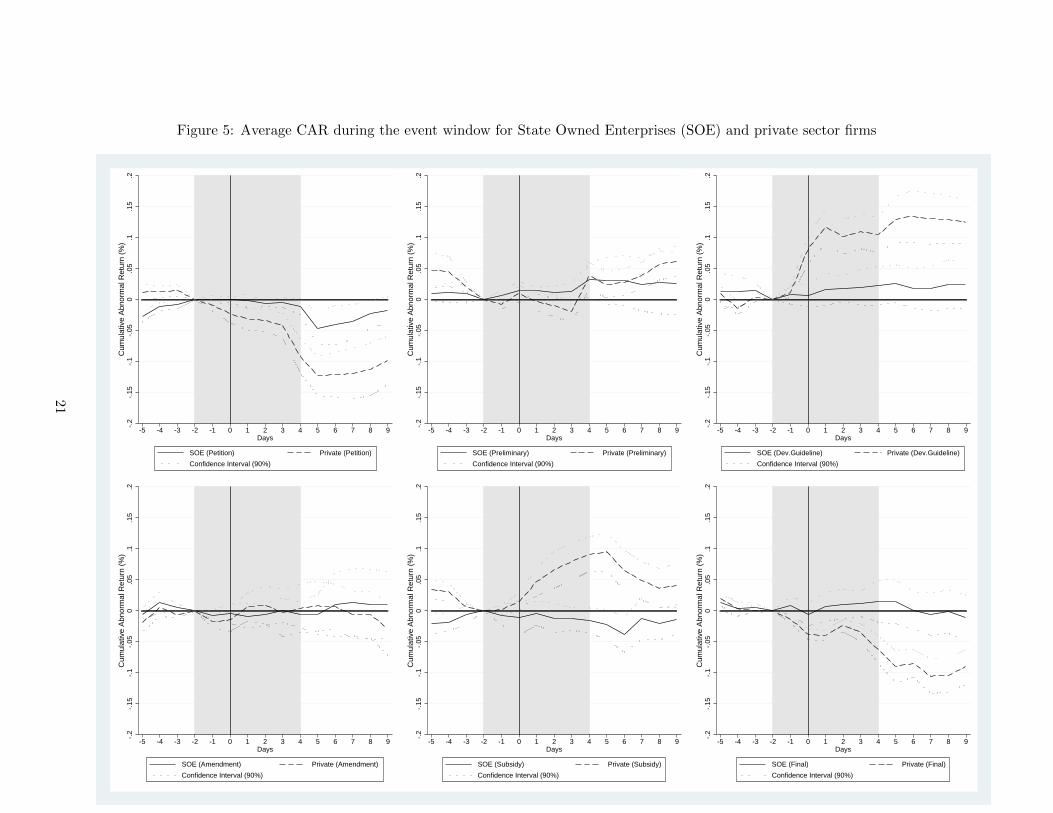
Figure 5: Average CAR during the event window for State Owned Enterprises (SOE) and private sector firms-.
2-.
15-.
1-.
050
.05
.1.1
5.2
Cum
ulat
ive
Abn
orm
al R
etur
n (%
)
-5 -4 -3 -2 -1 0 1 2 3 4 5 6 7 8 9Days
SOE (Petition) Private (Petition)
Confidence Interval (90%)
-.2
-.15
-.1
-.05
0.0
5.1
.15
.2C
umul
ativ
e A
bnor
mal
Ret
urn
(%)
-5 -4 -3 -2 -1 0 1 2 3 4 5 6 7 8 9Days
SOE (Preliminary) Private (Preliminary)
Confidence Interval (90%)
-.2
-.15
-.1
-.05
0.0
5.1
.15
.2C
umul
ativ
e A
bnor
mal
Ret
urn
(%)
-5 -4 -3 -2 -1 0 1 2 3 4 5 6 7 8 9Days
SOE (Dev.Guideline) Private (Dev.Guideline)
Confidence Interval (90%)
-.2
-.15
-.1
-.05
0.0
5.1
.15
.2C
umul
ativ
e A
bnor
mal
Ret
urn
(%)
-5 -4 -3 -2 -1 0 1 2 3 4 5 6 7 8 9Days
SOE (Amendment) Private (Amendment)
Confidence Interval (90%)
-.2
-.15
-.1
-.05
0.0
5.1
.15
.2C
umul
ativ
e A
bnor
mal
Ret
urn
(%)
-5 -4 -3 -2 -1 0 1 2 3 4 5 6 7 8 9Days
SOE (Subsidy) Private (Subsidy)
Confidence Interval (90%)
-.2
-.15
-.1
-.05
0.0
5.1
.15
.2C
umul
ativ
e A
bnor
mal
Ret
urn
(%)
-5 -4 -3 -2 -1 0 1 2 3 4 5 6 7 8 9Days
SOE (Final) Private (Final)
Confidence Interval (90%)
21
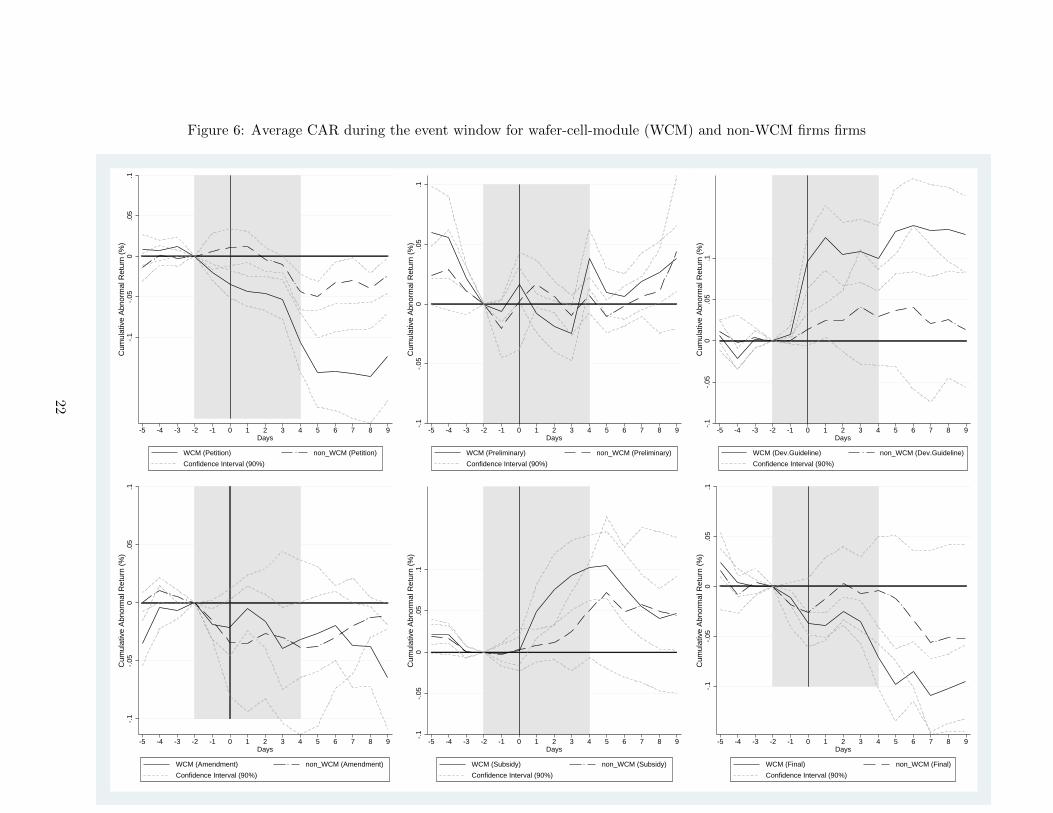
Figure 6: Average CAR during the event window for wafer-cell-module (WCM) and non-WCM firms firms-.
1-.
050
.05
.1C
umul
ativ
e A
bnor
mal
Ret
urn
(%)
-5 -4 -3 -2 -1 0 1 2 3 4 5 6 7 8 9Days
WCM (Petition) non_WCM (Petition)
Confidence Interval (90%)
-.1
-.05
0.0
5.1
Cum
ulat
ive
Abn
orm
al R
etur
n (%
)
-5 -4 -3 -2 -1 0 1 2 3 4 5 6 7 8 9Days
WCM (Preliminary) non_WCM (Preliminary)
Confidence Interval (90%)
-.1
-.05
0.0
5.1
Cum
ulat
ive
Abn
orm
al R
etur
n (%
)
-5 -4 -3 -2 -1 0 1 2 3 4 5 6 7 8 9Days
WCM (Dev.Guideline) non_WCM (Dev.Guideline)
Confidence Interval (90%)
-.1
-.05
0.0
5.1
Cum
ulat
ive
Abn
orm
al R
etur
n (%
)
-5 -4 -3 -2 -1 0 1 2 3 4 5 6 7 8 9Days
WCM (Amendment) non_WCM (Amendment)
Confidence Interval (90%)
-.1
-.05
0.0
5.1
Cum
ulat
ive
Abn
orm
al R
etur
n (%
)
-5 -4 -3 -2 -1 0 1 2 3 4 5 6 7 8 9Days
WCM (Subsidy) non_WCM (Subsidy)
Confidence Interval (90%)
-.1
-.05
0.0
5.1
Cum
ulat
ive
Abn
orm
al R
etur
n (%
)
-5 -4 -3 -2 -1 0 1 2 3 4 5 6 7 8 9Days
WCM (Final) non_WCM (Final)
Confidence Interval (90%)
22
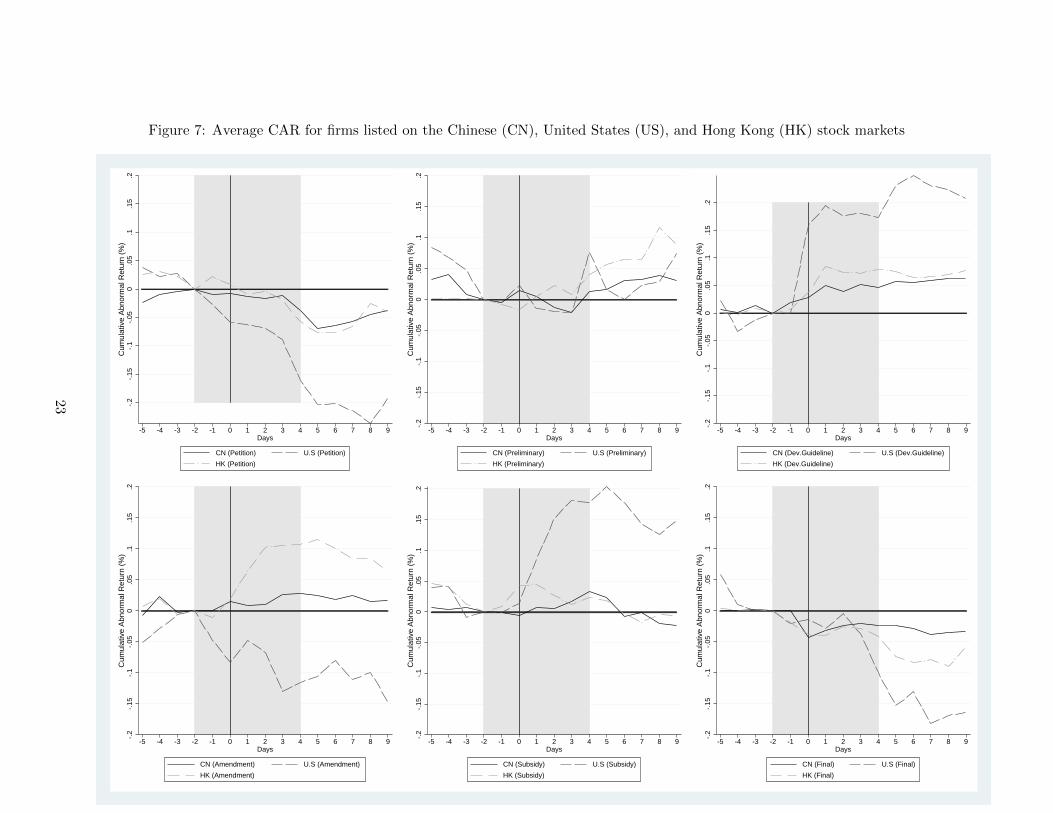
Figure 7: Average CAR for firms listed on the Chinese (CN), United States (US), and Hong Kong (HK) stock markets-.
2-.
15-.
1-.
050
.05
.1.1
5.2
Cum
ulat
ive
Abn
orm
al R
etur
n (%
)
-5 -4 -3 -2 -1 0 1 2 3 4 5 6 7 8 9Days
CN (Petition) U.S (Petition)
HK (Petition)
-.2
-.15
-.1
-.05
0.0
5.1
.15
.2C
umul
ativ
e A
bnor
mal
Ret
urn
(%)
-5 -4 -3 -2 -1 0 1 2 3 4 5 6 7 8 9Days
CN (Preliminary) U.S (Preliminary)
HK (Preliminary)
-.2
-.15
-.1
-.05
0.0
5.1
.15
.2C
umul
ativ
e A
bnor
mal
Ret
urn
(%)
-5 -4 -3 -2 -1 0 1 2 3 4 5 6 7 8 9Days
CN (Dev.Guideline) U.S (Dev.Guideline)
HK (Dev.Guideline)
-.2
-.15
-.1
-.05
0.0
5.1
.15
.2C
umul
ativ
e A
bnor
mal
Ret
urn
(%)
-5 -4 -3 -2 -1 0 1 2 3 4 5 6 7 8 9Days
CN (Amendment) U.S (Amendment)
HK (Amendment)
-.2
-.15
-.1
-.05
0.0
5.1
.15
.2C
umul
ativ
e A
bnor
mal
Ret
urn
(%)
-5 -4 -3 -2 -1 0 1 2 3 4 5 6 7 8 9Days
CN (Subsidy) U.S (Subsidy)
HK (Subsidy)
-.2
-.15
-.1
-.05
0.0
5.1
.15
.2C
umul
ativ
e A
bnor
mal
Ret
urn
(%)
-5 -4 -3 -2 -1 0 1 2 3 4 5 6 7 8 9Days
CN (Final) U.S (Final)
HK (Final)
23
overwhelmingly negative. In contrast, for the China-listed firms, the EU policy shocks come
with mixed effects; they are positive or negative, depending on the firm.
Consider the firm-level responses to each event by considering each event in turn. Be-
ginning with the panel labeled “Petition,” the left-most panel in the top row, we see that of
the 18 China-listed firms, all but four experienced negative CARs when Solar AG filed its
complaint with the European Commission. The impact of this policy announcement was
negative but modest in size; the cumulative negative abnormal return for most China-listed
firms was less than 10%. In contrast, the US-listed firms experienced sizable negative CARs;
three firms lost 40% or more of their value after the announcement. The Hong Kong-listed
firms had mixed results, most experienced moderate negative returns, but two has positive
abnormal returns. Negative abnormal returns to the petition seem quite natural as this
raised the probability of a future European trade restriction.
Moving across the top row of figure 8, the middle panel, “Preliminary,” depicts the al-
most universally negative CARs arising in response to the EC decision to impose provisional
import duties. Investors clearly perceived this as a sharp blow to the future profitability
of solar panel manufacturers in China. Firms listed in the US markets (bars 19-29) were
hardest hit, with losses of 20-40% fairly typical. The impact on firms listed in China (bars
1-18) was the more muted, with negative CARs in the 10-20% range, although several firms
had no losses or small positive returns. The impact on Hong Kong-listed firms was mixed.
Continuing across the top row of figure 8, the right most panel documents the consid-
erable heterogeneity in responses across firms to the Chinese government’s announcement
of its Development Guideline. The Guideline had three main components: 1. a radical
expansion of production capacity that would be restricted to those firms whose existing
operations could satisfy government efficiency requirements, 2. a restructuring of the in-
dustry in China toward fewer firms, and 3. technological improvement through university
collaborations. Thus, with the inherent threat that weaker, less productive firms might be
shut down or merged into stronger rivals, we hypothesize that the heterogeneous returns
are linked to a firm’s underlying production efficiency.
In the bottom row, “Amendment” shows that US-listed firms were hardest hit by the
ECs decision to amend the temporary import duties from an 11% ad valorem duty to a
price floor and import quota system. Many US-listed firms experienced a negative abnormal
return greater than 20%. In contrast, the Chinese and Hong Kong listed firms experienced
almost no change in value (with one Hong Kong firm experiencing a large positive abnormal
return). One possible explanation is that market participants believed that the allocation of
firm-specific export quotas to Europe by the Chinese Chamber of Commerce would favour
firms listed in China over those listed in the U.S. These negative excess returns are somewhat
surprising when compared to another famous voluntary initiative to restrict exports - the
US Auto VER. In that case, announcement of the VER led to substantial increases in
the stock market value of Japanese firms subject to the import restrictions. The middle
panel in the bottom row displays CARs in response to the announcement of the subsidy
24
to distributed generators (households or firms in China that installed rooftop solar panels).
The largest beneficiaries of this policy to stimulate consumer demand in China were firms
listed in the US. Among firms listed in China and Hong Kong, the results were mixed, with
some experiencing small positive returns while other experienced negative returns.
Lastly, the bottom right panel of figure 8 presents the CARs in response to the final de-
cision by the European Commission that resulted in a long-term price undertaking. There
is a high degree of heterogeneity in excess returns across firms. Although the final rul-
ing was essentially a confirmation of the amendment, it expanded the list of firms entitled
to participate in the negotiated price undertaking. As with the amendment to the provi-
sional tariff, the hardest hit firms were those listed in the US. Some firms listed in China
experienced sizable losses, but many experienced little or no change in value. In section
5.3 we examine the determinants of this cross-sectional heterogeneity in abnormal returns.
Again, the sharply negative return across a large number of firms is in sharp contrast to
the experience of Japanese automakers at the time of the US Auto VER.
We next calculate the abnormal return for individual firms using the expected return
derived from the estimated market model (2). Figure 9 presents CARs over the seven
day event window, but calculates the abnormal return as the difference between the actual
return and the return predicted by the market model. The results are qualitatively and
quantitatively similar to those of the multivariate model.
5.2 Cumulative Average Abnormal Returns
The next set of results summarizes the average effect of each of the policy announcements
over a seven day window for different subsamples of our data. Table 5 shows the estimation
results on CAAR across markets and across different groups of firms within the same market.
Each row presents the average of the CAR from the market model over a seven day event
window for the sample described in the row. In the first row, we calculate the CAAR
for the full sample of 37 firms. We can see that the petition by SolarWorld AG (column
1), the preliminary decision to impose provisional import duties (column 2) and the EC’s
final decision to impose a permanent price undertaking (column 6) all resulted in negative
abnormal returns for Chinese firms. Given that each of these events was associated with
restricting access to the firms’ largest market, the results are as expected. The two initiatives
by the Chinese government to stimulate domestic Chinese demand for solar panels, the
announcement of the Development Guideline (column 3) and the subsidy program (column
5) resulted in an increase in abnormal returns.
25
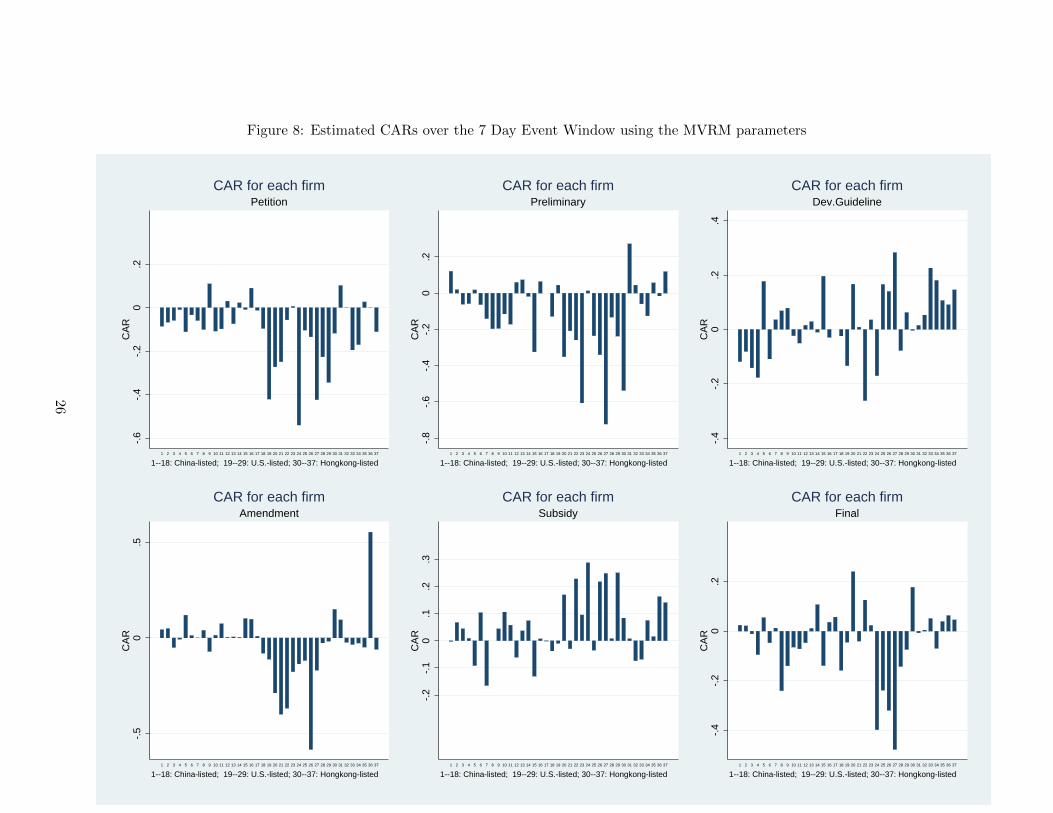
Figure 8: Estimated CARs over the 7 Day Event Window using the MVRM parameters-.
6-.
4-.
20
.2C
AR
1 2 3 4 5 6 7 8 9 10 11 12 13 14 15 16 17 18 19 20 21 22 23 24 25 26 27 28 29 30 31 32 33 34 35 36 37
1--18: China-listed; 19--29: U.S.-listed; 30--37: Hongkong-listed
PetitionCAR for each firm
-.8
-.6
-.4
-.2
0.2
CA
R
1 2 3 4 5 6 7 8 9 10 11 12 13 14 15 16 17 18 19 20 21 22 23 24 25 26 27 28 29 30 31 32 33 34 35 36 37
1--18: China-listed; 19--29: U.S.-listed; 30--37: Hongkong-listed
PreliminaryCAR for each firm
-.4
-.2
0.2
.4C
AR
1 2 3 4 5 6 7 8 9 10 11 12 13 14 15 16 17 18 19 20 21 22 23 24 25 26 27 28 29 30 31 32 33 34 35 36 37
1--18: China-listed; 19--29: U.S.-listed; 30--37: Hongkong-listed
Dev.GuidelineCAR for each firm
-.5
0.5
CA
R
1 2 3 4 5 6 7 8 9 10 11 12 13 14 15 16 17 18 19 20 21 22 23 24 25 26 27 28 29 30 31 32 33 34 35 36 37
1--18: China-listed; 19--29: U.S.-listed; 30--37: Hongkong-listed
AmendmentCAR for each firm
-.2
-.1
0.1
.2.3
CA
R
1 2 3 4 5 6 7 8 9 10 11 12 13 14 15 16 17 18 19 20 21 22 23 24 25 26 27 28 29 30 31 32 33 34 35 36 37
1--18: China-listed; 19--29: U.S.-listed; 30--37: Hongkong-listed
SubsidyCAR for each firm
-.4
-.2
0.2
CA
R
1 2 3 4 5 6 7 8 9 10 11 12 13 14 15 16 17 18 19 20 21 22 23 24 25 26 27 28 29 30 31 32 33 34 35 36 37
1--18: China-listed; 19--29: U.S.-listed; 30--37: Hongkong-listed
FinalCAR for each firm
26
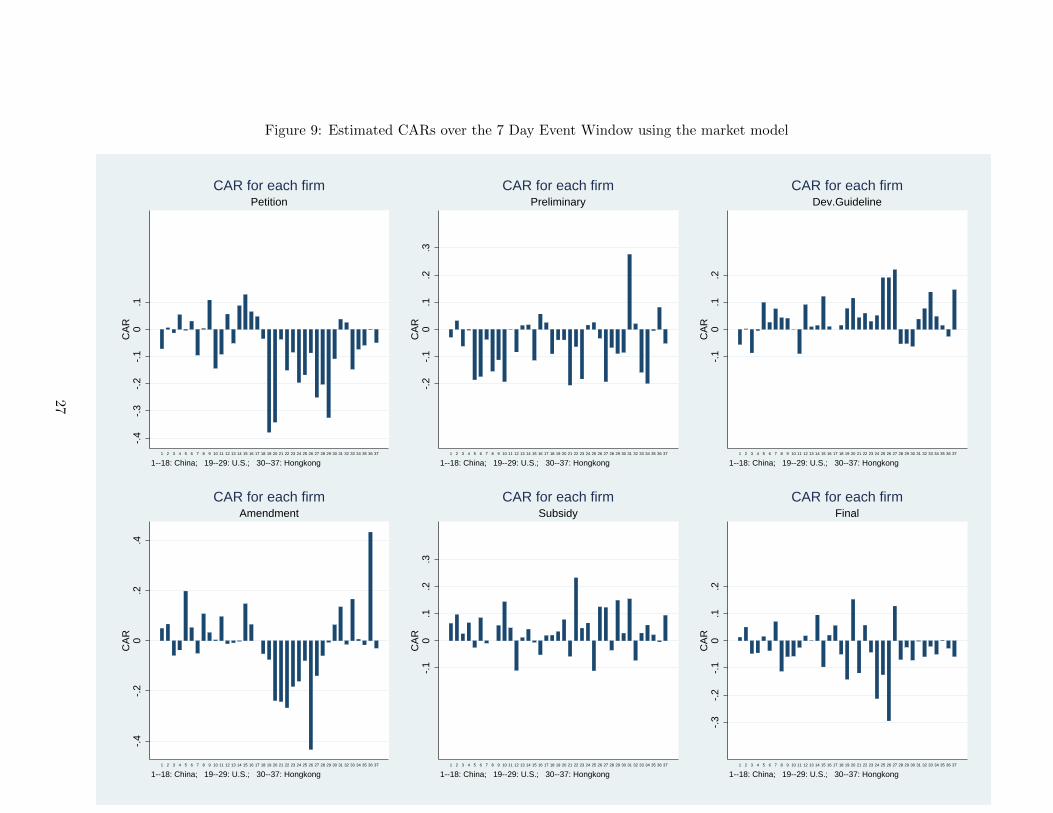
Figure 9: Estimated CARs over the 7 Day Event Window using the market model-.
4-.
3-.
2-.
10
.1C
AR
1 2 3 4 5 6 7 8 9 10 11 12 13 14 15 16 17 18 19 20 21 22 23 24 25 26 27 28 29 30 31 32 33 34 35 36 37
1--18: China; 19--29: U.S.; 30--37: Hongkong
PetitionCAR for each firm
-.2
-.1
0.1
.2.3
CA
R
1 2 3 4 5 6 7 8 9 10 11 12 13 14 15 16 17 18 19 20 21 22 23 24 25 26 27 28 29 30 31 32 33 34 35 36 37
1--18: China; 19--29: U.S.; 30--37: Hongkong
PreliminaryCAR for each firm
-.1
0.1
.2C
AR
1 2 3 4 5 6 7 8 9 10 11 12 13 14 15 16 17 18 19 20 21 22 23 24 25 26 27 28 29 30 31 32 33 34 35 36 37
1--18: China; 19--29: U.S.; 30--37: Hongkong
Dev.GuidelineCAR for each firm
-.4
-.2
0.2
.4C
AR
1 2 3 4 5 6 7 8 9 10 11 12 13 14 15 16 17 18 19 20 21 22 23 24 25 26 27 28 29 30 31 32 33 34 35 36 37
1--18: China; 19--29: U.S.; 30--37: Hongkong
AmendmentCAR for each firm
-.1
0.1
.2.3
CA
R
1 2 3 4 5 6 7 8 9 10 11 12 13 14 15 16 17 18 19 20 21 22 23 24 25 26 27 28 29 30 31 32 33 34 35 36 37
1--18: China; 19--29: U.S.; 30--37: Hongkong
SubsidyCAR for each firm
-.3
-.2
-.1
0.1
.2C
AR
1 2 3 4 5 6 7 8 9 10 11 12 13 14 15 16 17 18 19 20 21 22 23 24 25 26 27 28 29 30 31 32 33 34 35 36 37
1--18: China; 19--29: U.S.; 30--37: Hongkong
FinalCAR for each firm
27
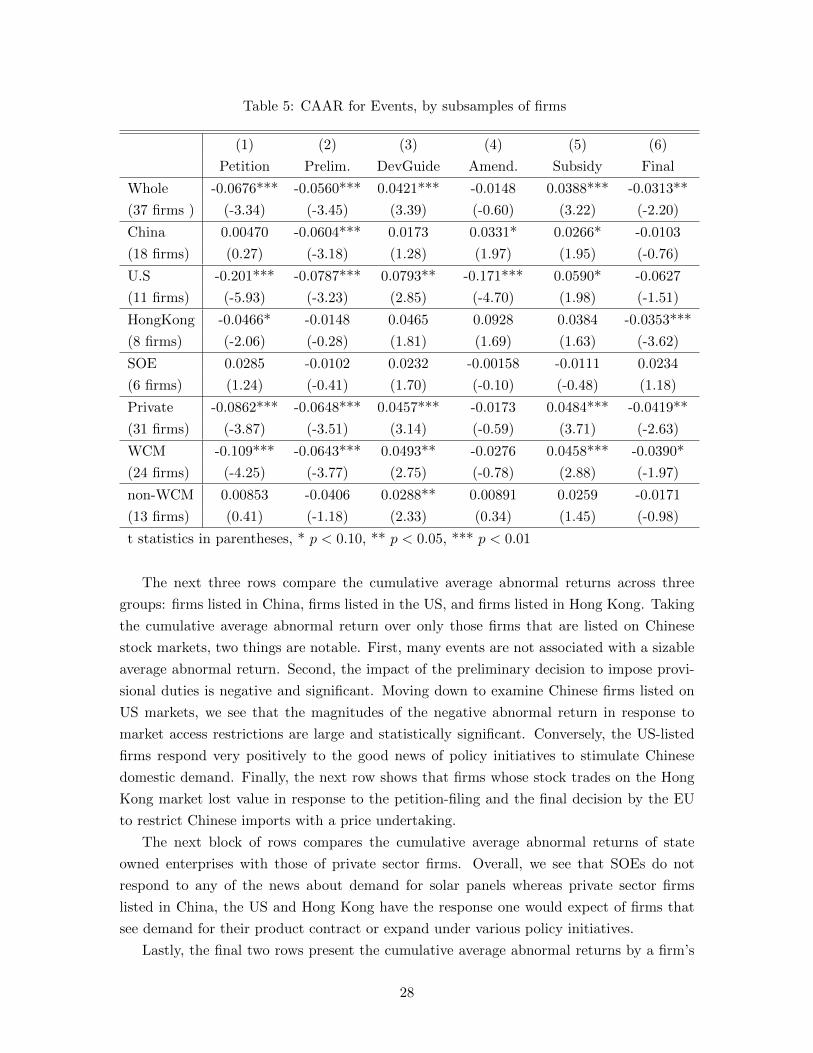
Table 5: CAAR for Events, by subsamples of firms
(1) (2) (3) (4) (5) (6)
Petition Prelim. DevGuide Amend. Subsidy Final
Whole -0.0676*** -0.0560*** 0.0421*** -0.0148 0.0388*** -0.0313**
(37 firms ) (-3.34) (-3.45) (3.39) (-0.60) (3.22) (-2.20)
China 0.00470 -0.0604*** 0.0173 0.0331* 0.0266* -0.0103
(18 firms) (0.27) (-3.18) (1.28) (1.97) (1.95) (-0.76)
U.S -0.201*** -0.0787*** 0.0793** -0.171*** 0.0590* -0.0627
(11 firms) (-5.93) (-3.23) (2.85) (-4.70) (1.98) (-1.51)
HongKong -0.0466* -0.0148 0.0465 0.0928 0.0384 -0.0353***
(8 firms) (-2.06) (-0.28) (1.81) (1.69) (1.63) (-3.62)
SOE 0.0285 -0.0102 0.0232 -0.00158 -0.0111 0.0234
(6 firms) (1.24) (-0.41) (1.70) (-0.10) (-0.48) (1.18)
Private -0.0862*** -0.0648*** 0.0457*** -0.0173 0.0484*** -0.0419**
(31 firms) (-3.87) (-3.51) (3.14) (-0.59) (3.71) (-2.63)
WCM -0.109*** -0.0643*** 0.0493** -0.0276 0.0458*** -0.0390*
(24 firms) (-4.25) (-3.77) (2.75) (-0.78) (2.88) (-1.97)
non-WCM 0.00853 -0.0406 0.0288** 0.00891 0.0259 -0.0171
(13 firms) (0.41) (-1.18) (2.33) (0.34) (1.45) (-0.98)
t statistics in parentheses, * p < 0.10, ** p < 0.05, *** p < 0.01
The next three rows compare the cumulative average abnormal returns across three
groups: firms listed in China, firms listed in the US, and firms listed in Hong Kong. Taking
the cumulative average abnormal return over only those firms that are listed on Chinese
stock markets, two things are notable. First, many events are not associated with a sizable
average abnormal return. Second, the impact of the preliminary decision to impose provi-
sional duties is negative and significant. Moving down to examine Chinese firms listed on
US markets, we see that the magnitudes of the negative abnormal return in response to
market access restrictions are large and statistically significant. Conversely, the US-listed
firms respond very positively to the good news of policy initiatives to stimulate Chinese
domestic demand. Finally, the next row shows that firms whose stock trades on the Hong
Kong market lost value in response to the petition-filing and the final decision by the EU
to restrict Chinese imports with a price undertaking.
The next block of rows compares the cumulative average abnormal returns of state
owned enterprises with those of private sector firms. Overall, we see that SOEs do not
respond to any of the news about demand for solar panels whereas private sector firms
listed in China, the US and Hong Kong have the response one would expect of firms that
see demand for their product contract or expand under various policy initiatives.
Lastly, the final two rows present the cumulative average abnormal returns by a firm’s
28
position on the solar panel value chain. Firms that produce wafers, cells, or modules
experienced negative returns in response to policies that restricted EU market access and
positive returns in response to the Chinese policies intended to stimulate demand. In
contrast, the non-WCM firms that make primary inputs into solar panels or that use solar
panels as part of a power-generating system had almost no response to the EU import
restriction. The one exception is a small positive response to the Development Guideline.
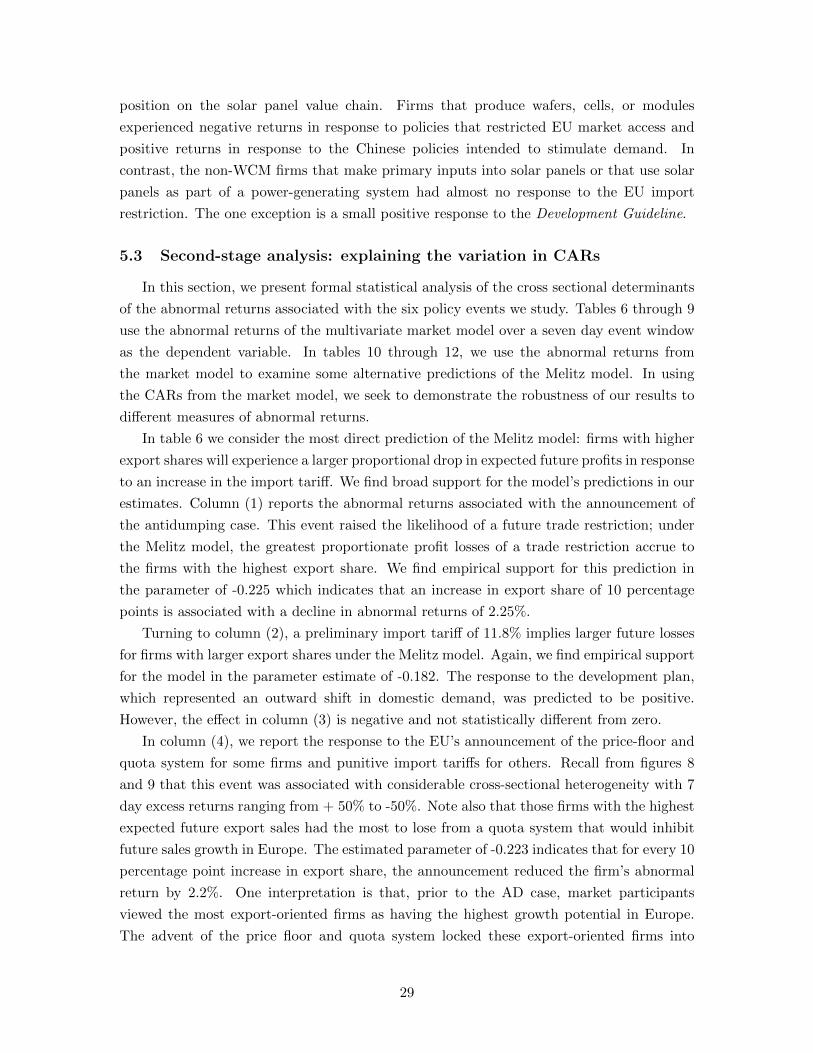
5.3 Second-stage analysis: explaining the variation in CARs
In this section, we present formal statistical analysis of the cross sectional determinants
of the abnormal returns associated with the six policy events we study. Tables 6 through 9
use the abnormal returns of the multivariate market model over a seven day event window
as the dependent variable. In tables 10 through 12, we use the abnormal returns from
the market model to examine some alternative predictions of the Melitz model. In using
the CARs from the market model, we seek to demonstrate the robustness of our results to
different measures of abnormal returns.
In table 6 we consider the most direct prediction of the Melitz model: firms with higher
export shares will experience a larger proportional drop in expected future profits in response
to an increase in the import tariff. We find broad support for the model’s predictions in our
estimates. Column (1) reports the abnormal returns associated with the announcement of
the antidumping case. This event raised the likelihood of a future trade restriction; under
the Melitz model, the greatest proportionate profit losses of a trade restriction accrue to
the firms with the highest export share. We find empirical support for this prediction in
the parameter of -0.225 which indicates that an increase in export share of 10 percentage
points is associated with a decline in abnormal returns of 2.25%.
Turning to column (2), a preliminary import tariff of 11.8% implies larger future losses
for firms with larger export shares under the Melitz model. Again, we find empirical support
for the model in the parameter estimate of -0.182. The response to the development plan,
which represented an outward shift in domestic demand, was predicted to be positive.
However, the effect in column (3) is negative and not statistically different from zero.
In column (4), we report the response to the EU’s announcement of the price-floor and
quota system for some firms and punitive import tariffs for others. Recall from figures 8
and 9 that this event was associated with considerable cross-sectional heterogeneity with 7
day excess returns ranging from + 50% to -50%. Note also that those firms with the highest
expected future export sales had the most to lose from a quota system that would inhibit
future sales growth in Europe. The estimated parameter of -0.223 indicates that for every 10
percentage point increase in export share, the announcement reduced the firm’s abnormal
return by 2.2%. One interpretation is that, prior to the AD case, market participants
viewed the most export-oriented firms as having the highest growth potential in Europe.
The advent of the price floor and quota system locked these export-oriented firms into
29
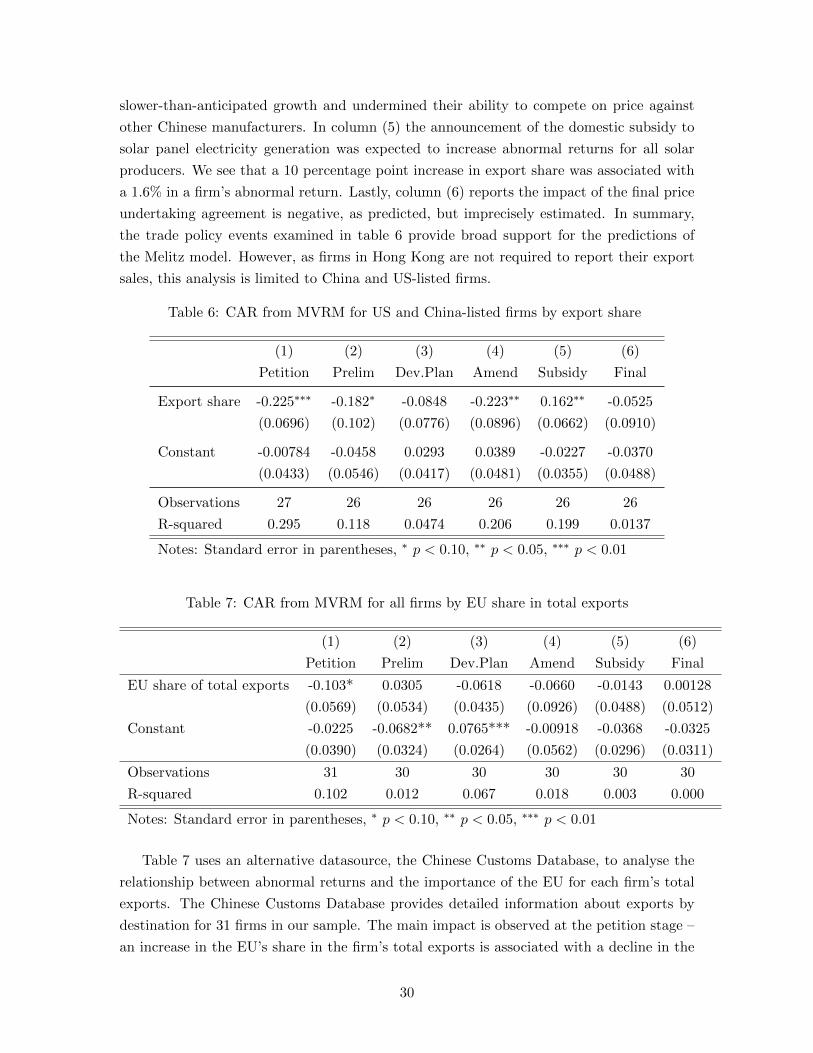
slower-than-anticipated growth and undermined their ability to compete on price against
other Chinese manufacturers. In column (5) the announcement of the domestic subsidy to
solar panel electricity generation was expected to increase abnormal returns for all solar
producers. We see that a 10 percentage point increase in export share was associated with
a 1.6% in a firm’s abnormal return. Lastly, column (6) reports the impact of the final price
undertaking agreement is negative, as predicted, but imprecisely estimated. In summary,
the trade policy events examined in table 6 provide broad support for the predictions of
the Melitz model. However, as firms in Hong Kong are not required to report their export
sales, this analysis is limited to China and US-listed firms.
Table 6: CAR from MVRM for US and China-listed firms by export share
(1) (2) (3) (4) (5) (6)
Petition Prelim Dev.Plan Amend Subsidy Final
Export share -0.225∗∗∗ -0.182∗ -0.0848 -0.223∗∗ 0.162∗∗ -0.0525
(0.0696) (0.102) (0.0776) (0.0896) (0.0662) (0.0910)
Constant -0.00784 -0.0458 0.0293 0.0389 -0.0227 -0.0370
(0.0433) (0.0546) (0.0417) (0.0481) (0.0355) (0.0488)
Observations 27 26 26 26 26 26
R-squared 0.295 0.118 0.0474 0.206 0.199 0.0137
Notes: Standard error in parentheses, ∗ p < 0.10, ∗∗ p < 0.05, ∗∗∗ p < 0.01
Table 7: CAR from MVRM for all firms by EU share in total exports
(1) (2) (3) (4) (5) (6)
Petition Prelim Dev.Plan Amend Subsidy Final
EU share of total exports -0.103* 0.0305 -0.0618 -0.0660 -0.0143 0.00128
(0.0569) (0.0534) (0.0435) (0.0926) (0.0488) (0.0512)
Constant -0.0225 -0.0682** 0.0765*** -0.00918 -0.0368 -0.0325
(0.0390) (0.0324) (0.0264) (0.0562) (0.0296) (0.0311)
Observations 31 30 30 30 30 30
R-squared 0.102 0.012 0.067 0.018 0.003 0.000
Notes: Standard error in parentheses, ∗ p < 0.10, ∗∗ p < 0.05, ∗∗∗ p < 0.01
Table 7 uses an alternative datasource, the Chinese Customs Database, to analyse the
relationship between abnormal returns and the importance of the EU for each firm’s total
exports. The Chinese Customs Database provides detailed information about exports by
destination for 31 firms in our sample. The main impact is observed at the petition stage –
an increase in the EU’s share in the firm’s total exports is associated with a decline in the
30
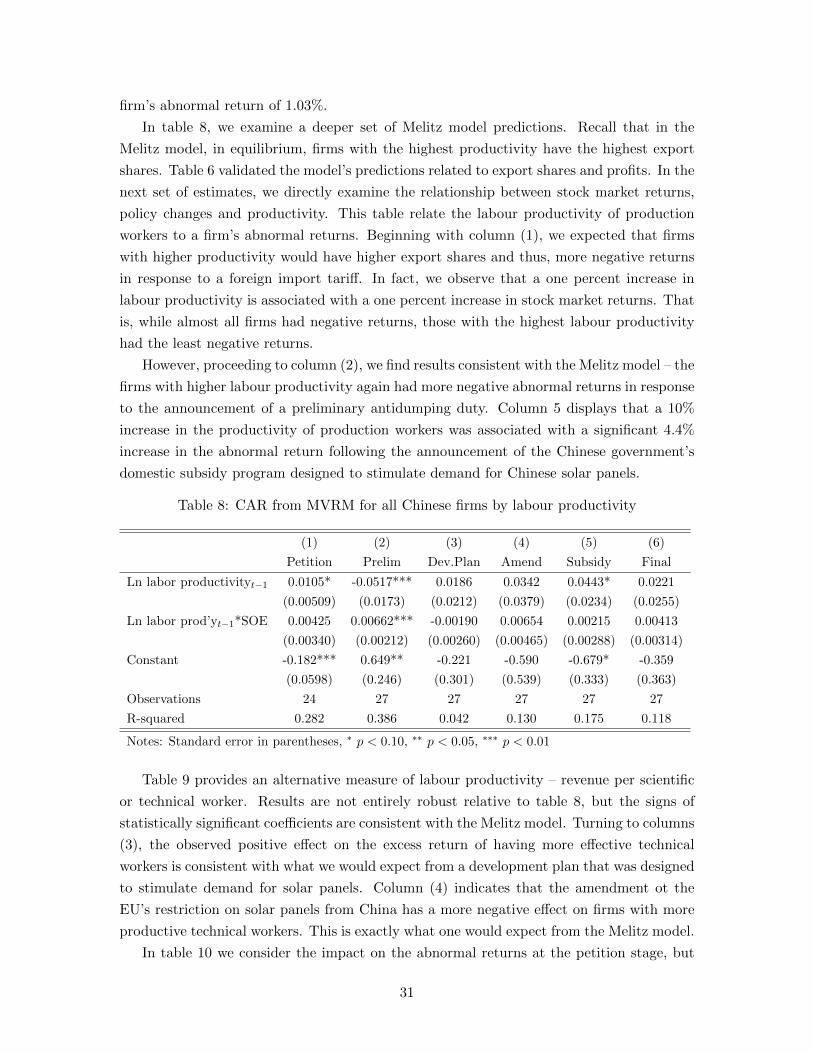
firm’s abnormal return of 1.03%.
In table 8, we examine a deeper set of Melitz model predictions. Recall that in the
Melitz model, in equilibrium, firms with the highest productivity have the highest export
shares. Table 6 validated the model’s predictions related to export shares and profits. In the
next set of estimates, we directly examine the relationship between stock market returns,
policy changes and productivity. This table relate the labour productivity of production
workers to a firm’s abnormal returns. Beginning with column (1), we expected that firms
with higher productivity would have higher export shares and thus, more negative returns
in response to a foreign import tariff. In fact, we observe that a one percent increase in
labour productivity is associated with a one percent increase in stock market returns. That
is, while almost all firms had negative returns, those with the highest labour productivity
had the least negative returns.
However, proceeding to column (2), we find results consistent with the Melitz model – the
firms with higher labour productivity again had more negative abnormal returns in response
to the announcement of a preliminary antidumping duty. Column 5 displays that a 10%
increase in the productivity of production workers was associated with a significant 4.4%
increase in the abnormal return following the announcement of the Chinese government’s
domestic subsidy program designed to stimulate demand for Chinese solar panels.
Table 8: CAR from MVRM for all Chinese firms by labour productivity
(1) (2) (3) (4) (5) (6)
Petition Prelim Dev.Plan Amend Subsidy Final
Ln labor productivityt−1 0.0105* -0.0517*** 0.0186 0.0342 0.0443* 0.0221
(0.00509) (0.0173) (0.0212) (0.0379) (0.0234) (0.0255)
Ln labor prod’yt−1*SOE 0.00425 0.00662*** -0.00190 0.00654 0.00215 0.00413
(0.00340) (0.00212) (0.00260) (0.00465) (0.00288) (0.00314)
Constant -0.182*** 0.649** -0.221 -0.590 -0.679* -0.359
(0.0598) (0.246) (0.301) (0.539) (0.333) (0.363)
Observations 24 27 27 27 27 27
R-squared 0.282 0.386 0.042 0.130 0.175 0.118
Notes: Standard error in parentheses, ∗ p < 0.10, ∗∗ p < 0.05, ∗∗∗ p < 0.01
Table 9 provides an alternative measure of labour productivity – revenue per scientific
or technical worker. Results are not entirely robust relative to table 8, but the signs of
statistically significant coefficients are consistent with the Melitz model. Turning to columns
(3), the observed positive effect on the excess return of having more effective technical
workers is consistent with what we would expect from a development plan that was designed
to stimulate demand for solar panels. Column (4) indicates that the amendment ot the
EU’s restriction on solar panels from China has a more negative effect on firms with more
productive technical workers. This is exactly what one would expect from the Melitz model.
In table 10 we consider the impact on the abnormal returns at the petition stage, but
31
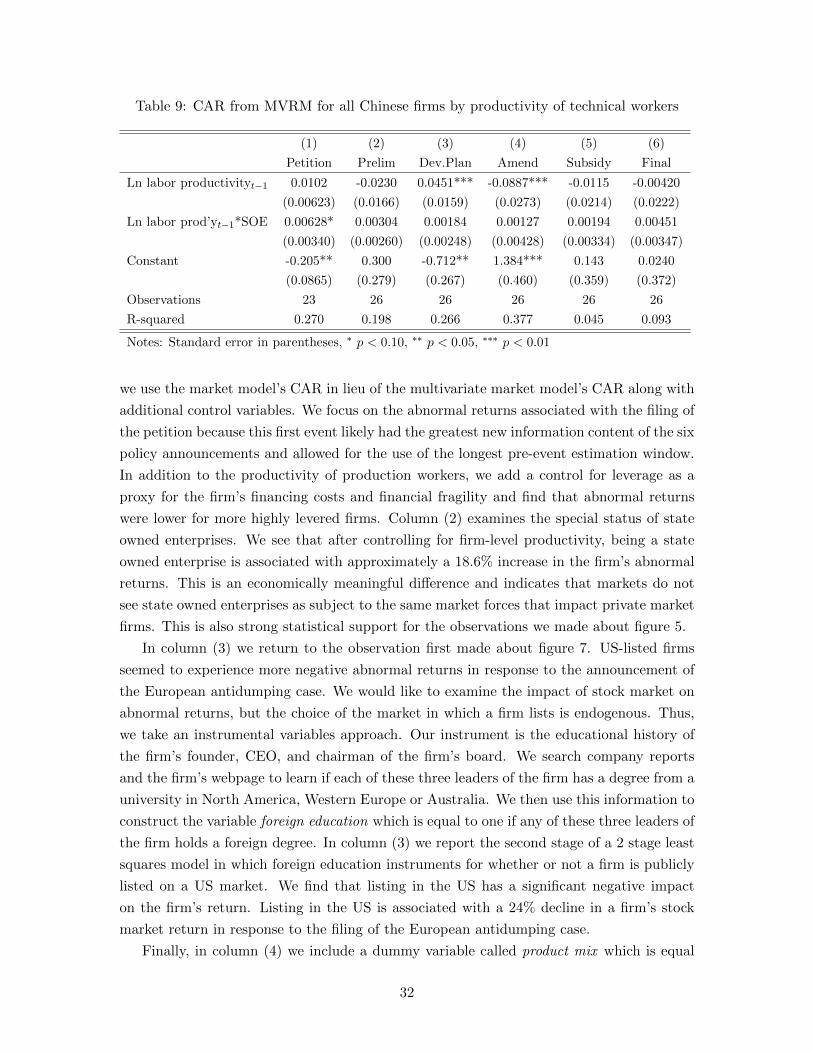
Table 9: CAR from MVRM for all Chinese firms by productivity of technical workers
(1) (2) (3) (4) (5) (6)
Petition Prelim Dev.Plan Amend Subsidy Final
Ln labor productivityt−1 0.0102 -0.0230 0.0451*** -0.0887*** -0.0115 -0.00420
(0.00623) (0.0166) (0.0159) (0.0273) (0.0214) (0.0222)
Ln labor prod’yt−1*SOE 0.00628* 0.00304 0.00184 0.00127 0.00194 0.00451
(0.00340) (0.00260) (0.00248) (0.00428) (0.00334) (0.00347)
Constant -0.205** 0.300 -0.712** 1.384*** 0.143 0.0240
(0.0865) (0.279) (0.267) (0.460) (0.359) (0.372)
Observations 23 26 26 26 26 26
R-squared 0.270 0.198 0.266 0.377 0.045 0.093
Notes: Standard error in parentheses, ∗ p < 0.10, ∗∗ p < 0.05, ∗∗∗ p < 0.01
we use the market model’s CAR in lieu of the multivariate market model’s CAR along with
additional control variables. We focus on the abnormal returns associated with the filing of
the petition because this first event likely had the greatest new information content of the six
policy announcements and allowed for the use of the longest pre-event estimation window.
In addition to the productivity of production workers, we add a control for leverage as a
proxy for the firm’s financing costs and financial fragility and find that abnormal returns
were lower for more highly levered firms. Column (2) examines the special status of state
owned enterprises. We see that after controlling for firm-level productivity, being a state
owned enterprise is associated with approximately a 18.6% increase in the firm’s abnormal
returns. This is an economically meaningful difference and indicates that markets do not
see state owned enterprises as subject to the same market forces that impact private market
firms. This is also strong statistical support for the observations we made about figure 5.
In column (3) we return to the observation first made about figure 7. US-listed firms
seemed to experience more negative abnormal returns in response to the announcement of
the European antidumping case. We would like to examine the impact of stock market on
abnormal returns, but the choice of the market in which a firm lists is endogenous. Thus,
we take an instrumental variables approach. Our instrument is the educational history of
the firm’s founder, CEO, and chairman of the firm’s board. We search company reports
and the firm’s webpage to learn if each of these three leaders of the firm has a degree from a
university in North America, Western Europe or Australia. We then use this information to
construct the variable foreign education which is equal to one if any of these three leaders of
the firm holds a foreign degree. In column (3) we report the second stage of a 2 stage least
squares model in which foreign education instruments for whether or not a firm is publicly
listed on a US market. We find that listing in the US has a significant negative impact
on the firm’s return. Listing in the US is associated with a 24% decline in a firm’s stock
market return in response to the filing of the European antidumping case.
Finally, in column (4) we include a dummy variable called product mix which is equal
32
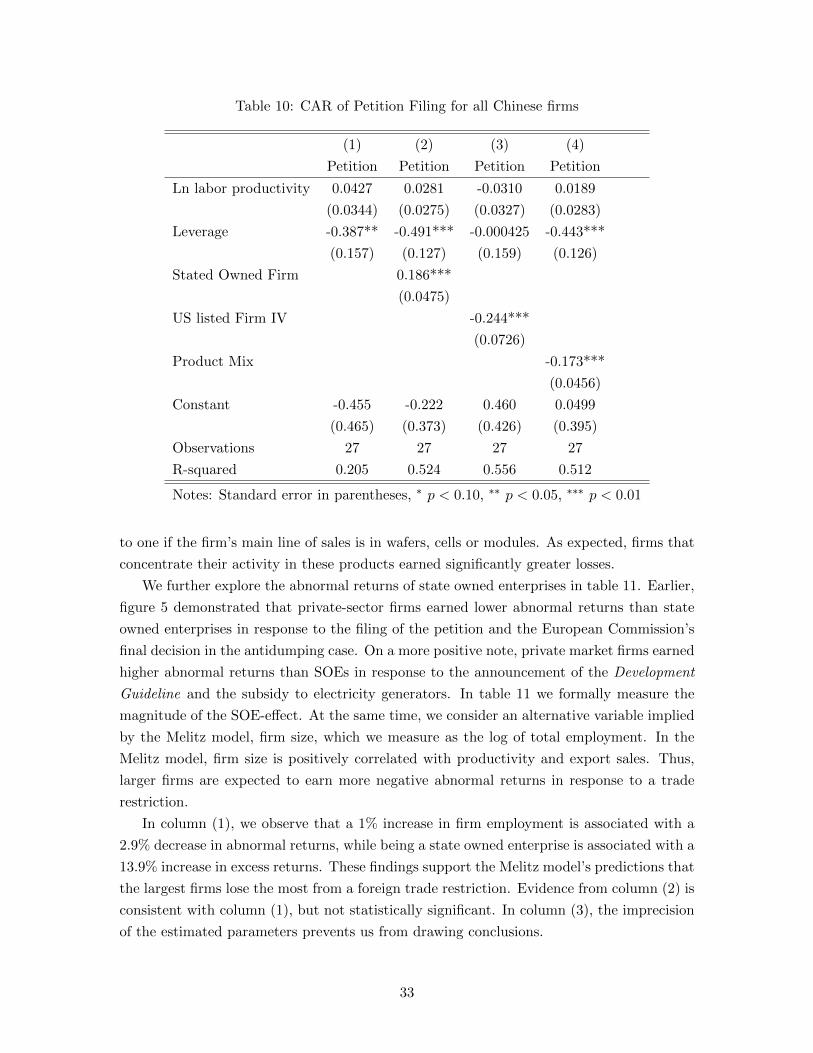
Table 10: CAR of Petition Filing for all Chinese firms
(1) (2) (3) (4)
Petition Petition Petition Petition
Ln labor productivity 0.0427 0.0281 -0.0310 0.0189
(0.0344) (0.0275) (0.0327) (0.0283)
Leverage -0.387** -0.491*** -0.000425 -0.443***
(0.157) (0.127) (0.159) (0.126)
Stated Owned Firm 0.186***
(0.0475)
US listed Firm IV -0.244***
(0.0726)
Product Mix -0.173***
(0.0456)
Constant -0.455 -0.222 0.460 0.0499
(0.465) (0.373) (0.426) (0.395)
Observations 27 27 27 27
R-squared 0.205 0.524 0.556 0.512
Notes: Standard error in parentheses, ∗ p < 0.10, ∗∗ p < 0.05, ∗∗∗ p < 0.01
to one if the firm’s main line of sales is in wafers, cells or modules. As expected, firms that
concentrate their activity in these products earned significantly greater losses.
We further explore the abnormal returns of state owned enterprises in table 11. Earlier,
figure 5 demonstrated that private-sector firms earned lower abnormal returns than state
owned enterprises in response to the filing of the petition and the European Commission’s
final decision in the antidumping case. On a more positive note, private market firms earned
higher abnormal returns than SOEs in response to the announcement of the Development
Guideline and the subsidy to electricity generators. In table 11 we formally measure the
magnitude of the SOE-effect. At the same time, we consider an alternative variable implied
by the Melitz model, firm size, which we measure as the log of total employment. In the
Melitz model, firm size is positively correlated with productivity and export sales. Thus,
larger firms are expected to earn more negative abnormal returns in response to a trade
restriction.
In column (1), we observe that a 1% increase in firm employment is associated with a
2.9% decrease in abnormal returns, while being a state owned enterprise is associated with a
13.9% increase in excess returns. These findings support the Melitz model’s predictions that
the largest firms lose the most from a foreign trade restriction. Evidence from column (2) is
consistent with column (1), but not statistically significant. In column (3), the imprecision
of the estimated parameters prevents us from drawing conclusions.
33
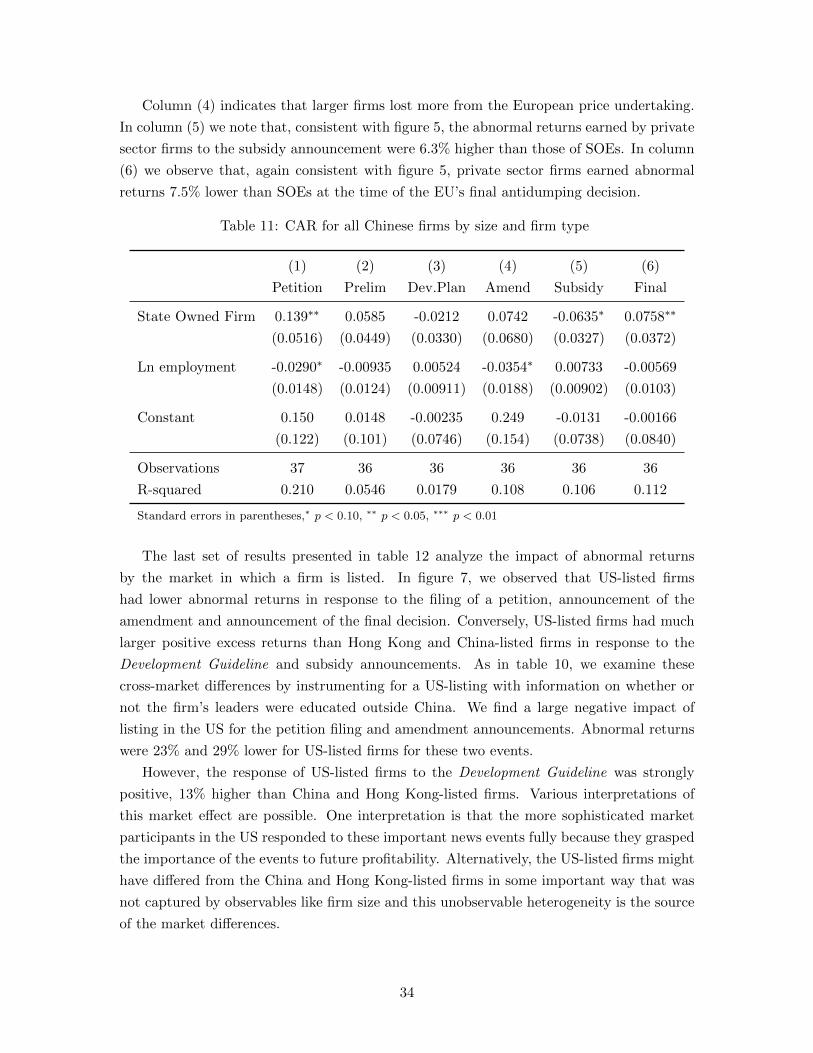
Column (4) indicates that larger firms lost more from the European price undertaking.
In column (5) we note that, consistent with figure 5, the abnormal returns earned by private
sector firms to the subsidy announcement were 6.3% higher than those of SOEs. In column
(6) we observe that, again consistent with figure 5, private sector firms earned abnormal
returns 7.5% lower than SOEs at the time of the EU’s final antidumping decision.
Table 11: CAR for all Chinese firms by size and firm type
(1) (2) (3) (4) (5) (6)
Petition Prelim Dev.Plan Amend Subsidy Final
State Owned Firm 0.139∗∗ 0.0585 -0.0212 0.0742 -0.0635∗ 0.0758∗∗
(0.0516) (0.0449) (0.0330) (0.0680) (0.0327) (0.0372)
Ln employment -0.0290∗ -0.00935 0.00524 -0.0354∗ 0.00733 -0.00569
(0.0148) (0.0124) (0.00911) (0.0188) (0.00902) (0.0103)
Constant 0.150 0.0148 -0.00235 0.249 -0.0131 -0.00166
(0.122) (0.101) (0.0746) (0.154) (0.0738) (0.0840)
Observations 37 36 36 36 36 36
R-squared 0.210 0.0546 0.0179 0.108 0.106 0.112
Standard errors in parentheses,∗ p < 0.10, ∗∗ p < 0.05, ∗∗∗ p < 0.01
The last set of results presented in table 12 analyze the impact of abnormal returns
by the market in which a firm is listed. In figure 7, we observed that US-listed firms
had lower abnormal returns in response to the filing of a petition, announcement of the
amendment and announcement of the final decision. Conversely, US-listed firms had much
larger positive excess returns than Hong Kong and China-listed firms in response to the
Development Guideline and subsidy announcements. As in table 10, we examine these
cross-market differences by instrumenting for a US-listing with information on whether or
not the firm’s leaders were educated outside China. We find a large negative impact of
listing in the US for the petition filing and amendment announcements. Abnormal returns
were 23% and 29% lower for US-listed firms for these two events.
However, the response of US-listed firms to the Development Guideline was strongly
positive, 13% higher than China and Hong Kong-listed firms. Various interpretations of
this market effect are possible. One interpretation is that the more sophisticated market
participants in the US responded to these important news events fully because they grasped
the importance of the events to future profitability. Alternatively, the US-listed firms might
have differed from the China and Hong Kong-listed firms in some important way that was
not captured by observables like firm size and this unobservable heterogeneity is the source
of the market differences.
34
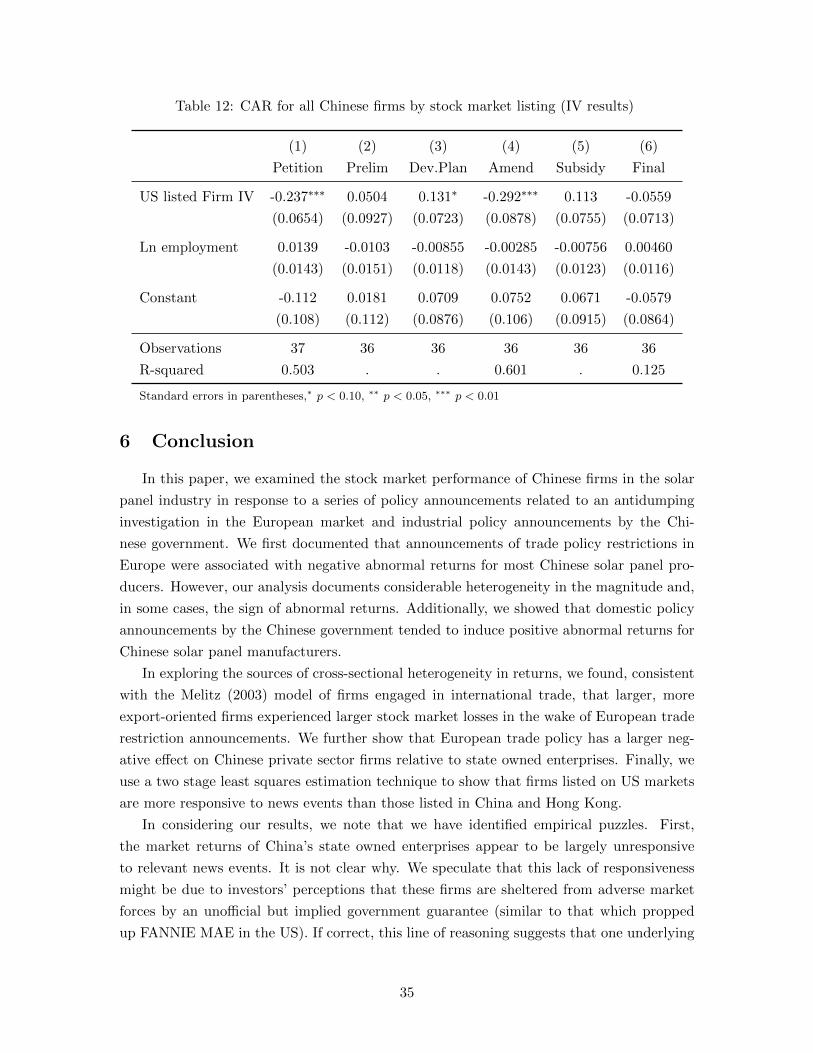
Table 12: CAR for all Chinese firms by stock market listing (IV results)
(1) (2) (3) (4) (5) (6)
Petition Prelim Dev.Plan Amend Subsidy Final
US listed Firm IV -0.237∗∗∗ 0.0504 0.131∗ -0.292∗∗∗ 0.113 -0.0559
(0.0654) (0.0927) (0.0723) (0.0878) (0.0755) (0.0713)
Ln employment 0.0139 -0.0103 -0.00855 -0.00285 -0.00756 0.00460
(0.0143) (0.0151) (0.0118) (0.0143) (0.0123) (0.0116)
Constant -0.112 0.0181 0.0709 0.0752 0.0671 -0.0579
(0.108) (0.112) (0.0876) (0.106) (0.0915) (0.0864)
Observations 37 36 36 36 36 36
R-squared 0.503 . . 0.601 . 0.125
Standard errors in parentheses,∗ p < 0.10, ∗∗ p < 0.05, ∗∗∗ p < 0.01
6 Conclusion
In this paper, we examined the stock market performance of Chinese firms in the solar
panel industry in response to a series of policy announcements related to an antidumping
investigation in the European market and industrial policy announcements by the Chi-
nese government. We first documented that announcements of trade policy restrictions in
Europe were associated with negative abnormal returns for most Chinese solar panel pro-
ducers. However, our analysis documents considerable heterogeneity in the magnitude and,
in some cases, the sign of abnormal returns. Additionally, we showed that domestic policy
announcements by the Chinese government tended to induce positive abnormal returns for
Chinese solar panel manufacturers.
In exploring the sources of cross-sectional heterogeneity in returns, we found, consistent
with the Melitz (2003) model of firms engaged in international trade, that larger, more
export-oriented firms experienced larger stock market losses in the wake of European trade
restriction announcements. We further show that European trade policy has a larger neg-
ative effect on Chinese private sector firms relative to state owned enterprises. Finally, we
use a two stage least squares estimation technique to show that firms listed on US markets
are more responsive to news events than those listed in China and Hong Kong.
In considering our results, we note that we have identified empirical puzzles. First,
the market returns of China’s state owned enterprises appear to be largely unresponsive
to relevant news events. It is not clear why. We speculate that this lack of responsiveness
might be due to investors’ perceptions that these firms are sheltered from adverse market
forces by an unofficial but implied government guarantee (similar to that which propped
up FANNIE MAE in the US). If correct, this line of reasoning suggests that one underlying
35
cause of the resource mis-allocation problem in China is the belief in implicit government
guarantees.
Second, we observe that firms listed in the United States are more responsive to news
events than those listed in China and Hong Kong, even after controlling for observable
characteristics and instrumenting for the decision to list in a foreign market. Many possible
explanations exist; for example, this could be due to differences in the sophistication of
investors, the functioning of the stock markets, or unaccounted-for differences in the firms
in our sample. We suggest that this question warrants further research as it relates back
to the deeper question of resource mis-allocation and the mechanisms necessary to improve
efficiency.
Finally, our analysis points to the unexpected outcome of Europe’s antidumping policy
in solar panels. The intellectual origins of antidumping policy and the contemporary pop-
ular commentary surrounding it suggest that it is intended to promote a fair competitive
environment for firms. However, our results highlight that publicly-listed Chinese private
sector firms experienced the largest losses under Europe’s import restrictions. Weirdly, the
state owned enterprises that possibly benefit from implicit government guarantees experi-
enced little or no adverse impact. Rather than fostering a fair competitive market in green
energy products, it seems that the Europeans unintentionally tilted the playing field against
the Chinese private sector in favor of state owned enterprises.
36

References
Binder, J. J. (1985): “Measuring the effects of regulation with stock price data,” The
RAND Journal of Economics, pp. 167–183.
Bown, C. P., and M. A. Crowley (2006): “Policy externalities: How US antidumping
affects japanese exports to the EU,” European Journal of Political Economy, 22(3), 696–
714.
(2007): “Trade deflection and trade depression,” Journal of International Eco-
nomics, 72(1), 176–201.
Breinlich, H. (2014): “Heterogeneous firm-level responses to trade liberalization: A test
using stock price reactions,” Journal of International Economics, 93, 270–285.
(2015): “The Effect of Trade Liberalization on Firm-Level Profits: An Event-Study
Approach,” University of Nottingham Working Paper.
Brown, P. (2013): “European Union Wind and Solar Electricity Policies: Overview and
Considerations,” Congressional Research Service Report for Congress, (R43176).
Burger, B. (2014): “Electricity production from solar and wind in Germany in 2014,”
www.ise.fraunhofer.de.
Crowley, M., N. Meng, and H. Song (2018): “Tariff scares: Trade policy uncertainty
and foreign market entry by Chinese firms,” Journal of International Economics, 114, 96
– 115.
Dollar, D., and S.-J. Wei (2007): “Das (Wasted) Kapital: Firm Ownership and Invest-
ment Efficiency in China,” NBER Working Paper, (13103).
Grau, T., M. Huo, and K. Neuhoff (2012): “Survey of photovolataic industry and
policy in Germany and China,” Energy Policy, 51, 20–37.
Guzhva, V. S., and N. Pagiavlas (2004): “US Commercial airline performance after
September 11, 2001: decomposing the effect of the terrorist attack from macroeconomic
influences,” Journal of Air Transport Management, 10(5), 327–332.
Hartigan, J. C., P. R. Perry, and S. Kamma (1986): “The Value of Administered
Protection: A Capital Market Approach,” The Review of Economics and Statistics, 68(4),
610–17.
Hsieh, C.-T., and P. J. Klenow (2009): “Misallocation and Manufacturing TFP in
China and India,” The Quarterly Journal of Economics, 124(4), 1403–1448.
Hsieh, C.-T., and Z. Song (2014): “Grasp the Large, Let Go of the Small: The Trans-
formation of the State Sector in China,” .
37
Hughes, J. S., S. Lenway, and J. Rayburn (1997): “Stock price effects of US trade
policy responses to Japanese trading practices in semi-conductors,” Canadian Journal of
Economics, pp. 922–942.
Kosmidou, K. V., D. V. Kousenidis, and C. I. Negakis (2012): “The impact of the
EU/ECB/IMF bailout programs on the financial and reeal sectors of the ASE during the
Greek sovereign crisis,” Journal of Banking and Finance, 36, 164–281.
Kothari, S., and J. Warner (2007): “Handbook of Corporate Finance: Empirical Cor-
porate Finance,” vol. 1 of Handbook of Corporate Finance: Empirical Corporate Finance,
pp. 3–36. Elsevier/North-Holland, Amsterdam.
Kutan, A. M., G. Muradoglu, and B. G. Sudjana (2012): “IMF programs, financial
and real sector performance, and the Asian crisis,” Journal of Banking and Finance, 36,
164–281.
Lenway, S., R. Morck, and B. Yeung (1996): “Rent Seeking, Protectionism and Inno-
vation in the American Steel Industry,” Economic Journal, 106(435), 410–21.
Melitz, M. J. (2003): “The Impact of Trade on Intra-Industry Reallocations and Aggre-
gate Industry Productivity,” Econometrica, 71(6), 1695–1725.
Miyajima, H., and Y. Yafeh (2007): “Japan’s banking crisis: An event-study perspec-
tive,” Journal of Banking and Finance, 31(9), 2866–2885.
Moser, C., and A. K. Rose (2014): “Who benefits from regional trade agreements? The
view from the stock market,” European Economic Review, 68, 31–47.
Ries, J. C. (1993): “Windfall Profits and Vertical Relationships: Who Gained in the
Japanese Auto Industry from VERs?,” The Journal of Industrial Economics, 41(3), 259–
276.
Sun, H., Q. Zhi, Y. Wang, Q. Yao, and J. Su (2014): “China’s solar photovoltaic
industry development: The status quo, problems and approaches,” Applied Energy, 118,
221–230.
Tabakis, C., and M. Zanardi (2016): “Antidumping echoing,” Economic Inquiry.
Yao, D., and F. Li (2013): “Antidumping case against Chinese PV firms causes division
among EU members,” China Economic Weekly, 21.
38
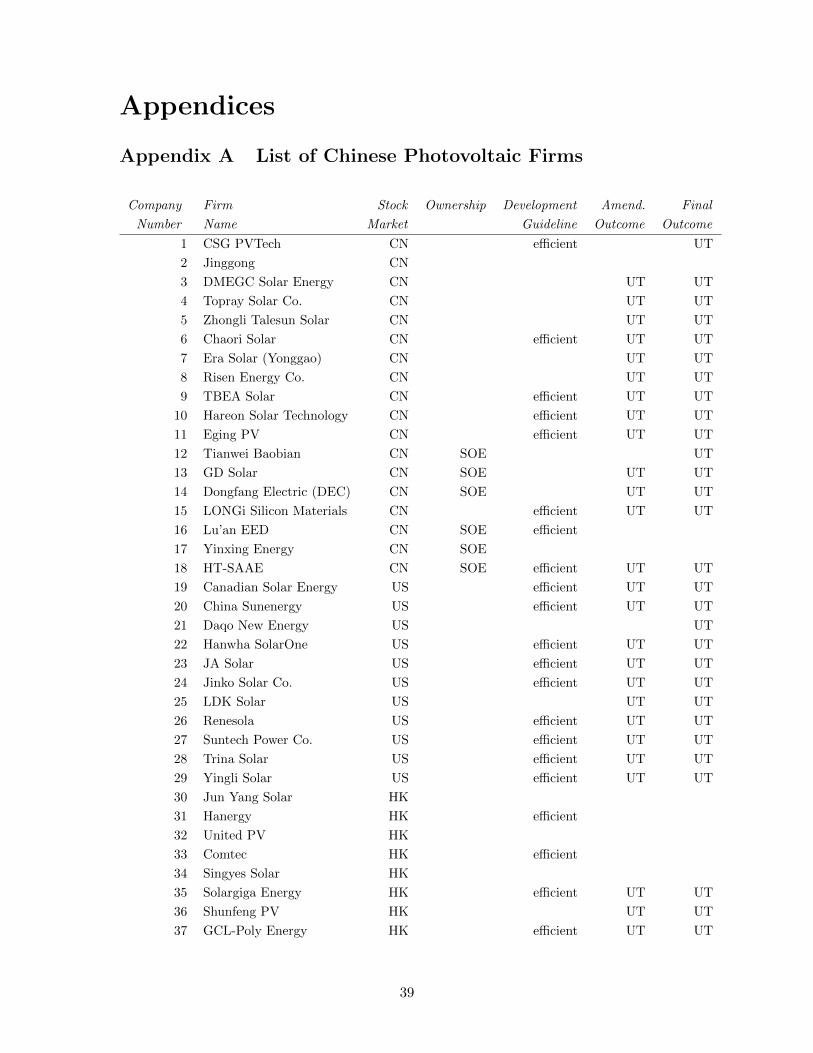
Appendices
Appendix A List of Chinese Photovoltaic Firms
Company Firm Stock Ownership Development Amend. Final
Number Name Market Guideline Outcome Outcome
1 CSG PVTech CN efficient UT
2 Jinggong CN
3 DMEGC Solar Energy CN UT UT
4 Topray Solar Co. CN UT UT
5 Zhongli Talesun Solar CN UT UT
6 Chaori Solar CN efficient UT UT
7 Era Solar (Yonggao) CN UT UT
8 Risen Energy Co. CN UT UT
9 TBEA Solar CN efficient UT UT
10 Hareon Solar Technology CN efficient UT UT
11 Eging PV CN efficient UT UT
12 Tianwei Baobian CN SOE UT
13 GD Solar CN SOE UT UT
14 Dongfang Electric (DEC) CN SOE UT UT
15 LONGi Silicon Materials CN efficient UT UT
16 Lu’an EED CN SOE efficient
17 Yinxing Energy CN SOE
18 HT-SAAE CN SOE efficient UT UT
19 Canadian Solar Energy US efficient UT UT
20 China Sunenergy US efficient UT UT
21 Daqo New Energy US UT
22 Hanwha SolarOne US efficient UT UT
23 JA Solar US efficient UT UT
24 Jinko Solar Co. US efficient UT UT
25 LDK Solar US UT UT
26 Renesola US efficient UT UT
27 Suntech Power Co. US efficient UT UT
28 Trina Solar US efficient UT UT
29 Yingli Solar US efficient UT UT
30 Jun Yang Solar HK
31 Hanergy HK efficient
32 United PV HK
33 Comtec HK efficient
34 Singyes Solar HK
35 Solargiga Energy HK efficient UT UT
36 Shunfeng PV HK UT UT
37 GCL-Poly Energy HK efficient UT UT
39
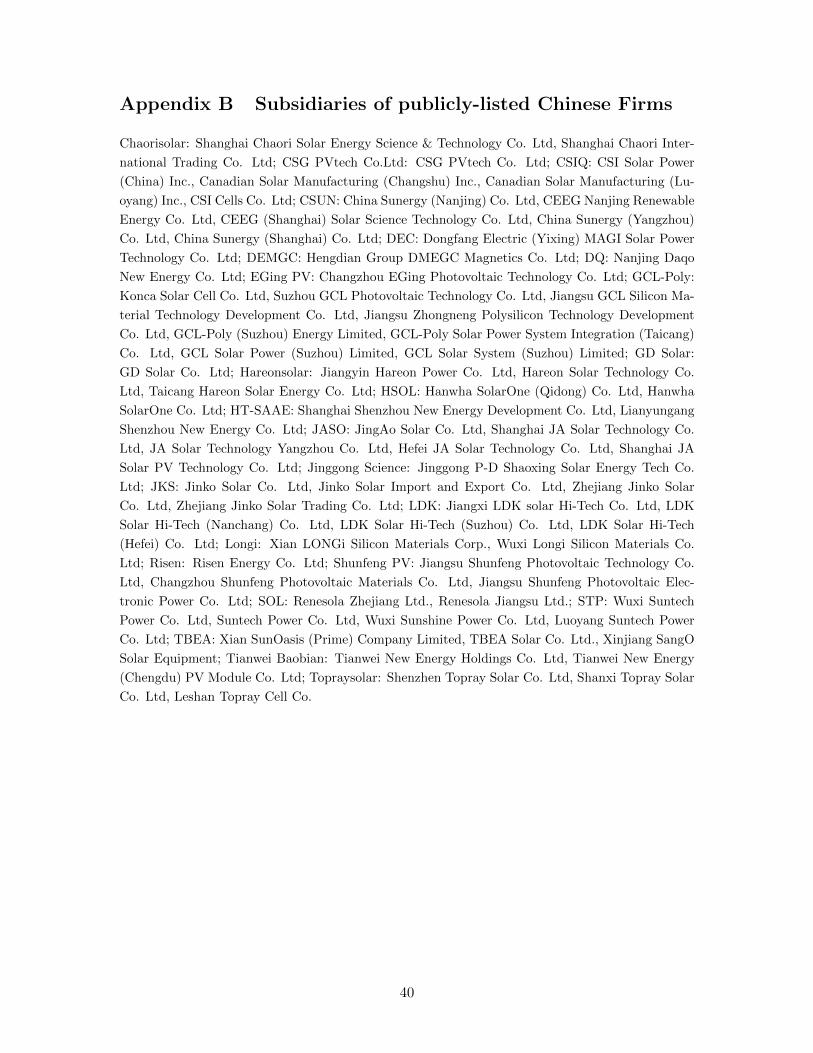
Appendix B Subsidiaries of publicly-listed Chinese Firms
Chaorisolar: Shanghai Chaori Solar Energy Science & Technology Co. Ltd, Shanghai Chaori Inter-
national Trading Co. Ltd; CSG PVtech Co.Ltd: CSG PVtech Co. Ltd; CSIQ: CSI Solar Power
(China) Inc., Canadian Solar Manufacturing (Changshu) Inc., Canadian Solar Manufacturing (Lu-
oyang) Inc., CSI Cells Co. Ltd; CSUN: China Sunergy (Nanjing) Co. Ltd, CEEG Nanjing Renewable
Energy Co. Ltd, CEEG (Shanghai) Solar Science Technology Co. Ltd, China Sunergy (Yangzhou)
Co. Ltd, China Sunergy (Shanghai) Co. Ltd; DEC: Dongfang Electric (Yixing) MAGI Solar Power
Technology Co. Ltd; DEMGC: Hengdian Group DMEGC Magnetics Co. Ltd; DQ: Nanjing Daqo
New Energy Co. Ltd; EGing PV: Changzhou EGing Photovoltaic Technology Co. Ltd; GCL-Poly:
Konca Solar Cell Co. Ltd, Suzhou GCL Photovoltaic Technology Co. Ltd, Jiangsu GCL Silicon Ma-
terial Technology Development Co. Ltd, Jiangsu Zhongneng Polysilicon Technology Development
Co. Ltd, GCL-Poly (Suzhou) Energy Limited, GCL-Poly Solar Power System Integration (Taicang)
Co. Ltd, GCL Solar Power (Suzhou) Limited, GCL Solar System (Suzhou) Limited; GD Solar:
GD Solar Co. Ltd; Hareonsolar: Jiangyin Hareon Power Co. Ltd, Hareon Solar Technology Co.
Ltd, Taicang Hareon Solar Energy Co. Ltd; HSOL: Hanwha SolarOne (Qidong) Co. Ltd, Hanwha
SolarOne Co. Ltd; HT-SAAE: Shanghai Shenzhou New Energy Development Co. Ltd, Lianyungang
Shenzhou New Energy Co. Ltd; JASO: JingAo Solar Co. Ltd, Shanghai JA Solar Technology Co.
Ltd, JA Solar Technology Yangzhou Co. Ltd, Hefei JA Solar Technology Co. Ltd, Shanghai JA
Solar PV Technology Co. Ltd; Jinggong Science: Jinggong P-D Shaoxing Solar Energy Tech Co.
Ltd; JKS: Jinko Solar Co. Ltd, Jinko Solar Import and Export Co. Ltd, Zhejiang Jinko Solar
Co. Ltd, Zhejiang Jinko Solar Trading Co. Ltd; LDK: Jiangxi LDK solar Hi-Tech Co. Ltd, LDK
Solar Hi-Tech (Nanchang) Co. Ltd, LDK Solar Hi-Tech (Suzhou) Co. Ltd, LDK Solar Hi-Tech
(Hefei) Co. Ltd; Longi: Xian LONGi Silicon Materials Corp., Wuxi Longi Silicon Materials Co.
Ltd; Risen: Risen Energy Co. Ltd; Shunfeng PV: Jiangsu Shunfeng Photovoltaic Technology Co.
Ltd, Changzhou Shunfeng Photovoltaic Materials Co. Ltd, Jiangsu Shunfeng Photovoltaic Elec-
tronic Power Co. Ltd; SOL: Renesola Zhejiang Ltd., Renesola Jiangsu Ltd.; STP: Wuxi Suntech
Power Co. Ltd, Suntech Power Co. Ltd, Wuxi Sunshine Power Co. Ltd, Luoyang Suntech Power
Co. Ltd; TBEA: Xian SunOasis (Prime) Company Limited, TBEA Solar Co. Ltd., Xinjiang SangO
Solar Equipment; Tianwei Baobian: Tianwei New Energy Holdings Co. Ltd, Tianwei New Energy
(Chengdu) PV Module Co. Ltd; Topraysolar: Shenzhen Topray Solar Co. Ltd, Shanxi Topray Solar
Co. Ltd, Leshan Topray Cell Co.
40
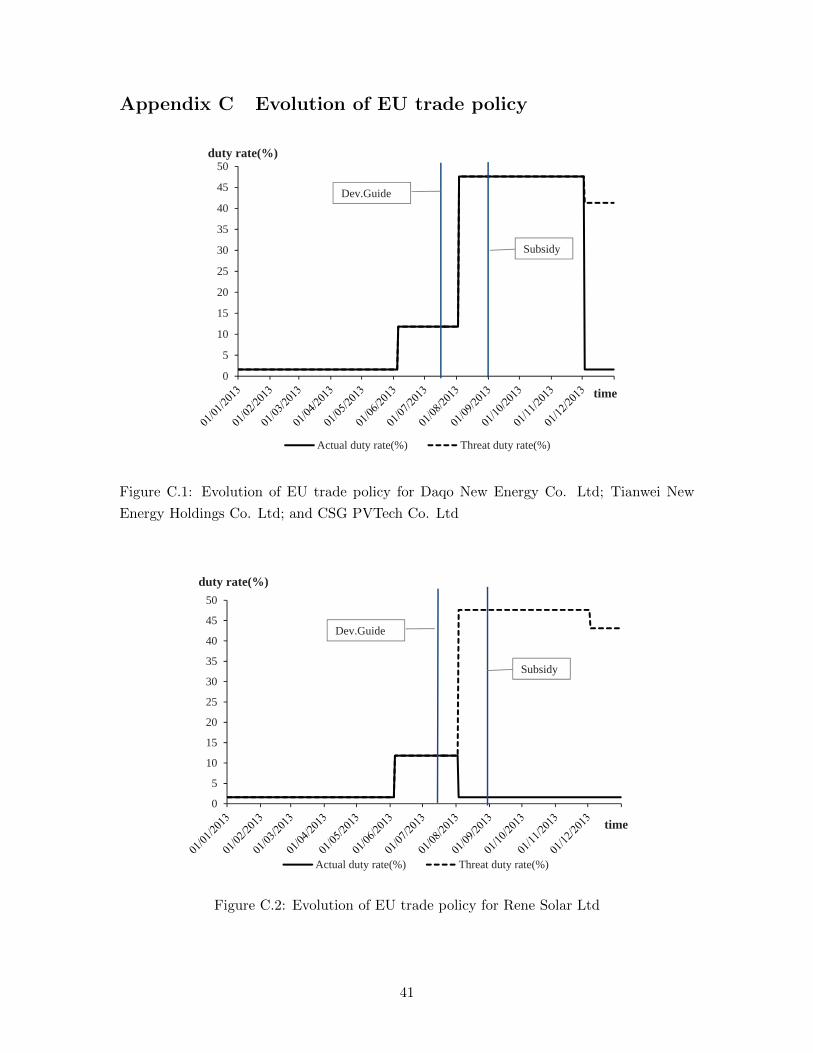
Appendix C Evolution of EU trade policy
0
5
10
15
20
25
30
35
40
45
50
Actual duty rate(%) Threat duty rate(%)
time
duty rate(%)
Dev.Guide
Subsidy
Figure C.1: Evolution of EU trade policy for Daqo New Energy Co. Ltd; Tianwei New
Energy Holdings Co. Ltd; and CSG PVTech Co. Ltd
0
5
10
15
20
25
30
35
40
45
50
Actual duty rate(%) Threat duty rate(%)
time
duty rate(%)
Dev.Guide
Subsidy
Figure C.2: Evolution of EU trade policy for Rene Solar Ltd
41
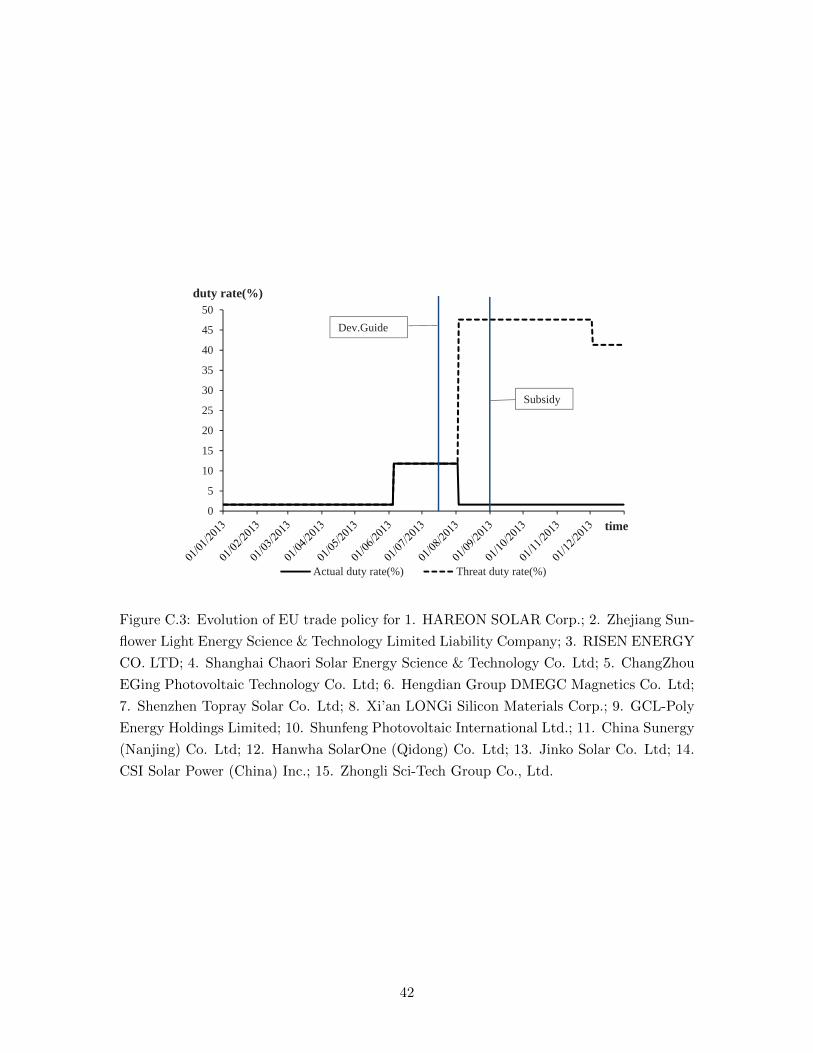
0
5
10
15
20
25
30
35
40
45
50
Actual duty rate(%) Threat duty rate(%)
time
duty rate(%)
Dev.Guide
Subsidy
Figure C.3: Evolution of EU trade policy for 1. HAREON SOLAR Corp.; 2. Zhejiang Sun-
flower Light Energy Science & Technology Limited Liability Company; 3. RISEN ENERGY
CO. LTD; 4. Shanghai Chaori Solar Energy Science & Technology Co. Ltd; 5. ChangZhou
EGing Photovoltaic Technology Co. Ltd; 6. Hengdian Group DMEGC Magnetics Co. Ltd;
7. Shenzhen Topray Solar Co. Ltd; 8. Xi’an LONGi Silicon Materials Corp.; 9. GCL-Poly
Energy Holdings Limited; 10. Shunfeng Photovoltaic International Ltd.; 11. China Sunergy
(Nanjing) Co. Ltd; 12. Hanwha SolarOne (Qidong) Co. Ltd; 13. Jinko Solar Co. Ltd; 14.
CSI Solar Power (China) Inc.; 15. Zhongli Sci-Tech Group Co., Ltd.
42
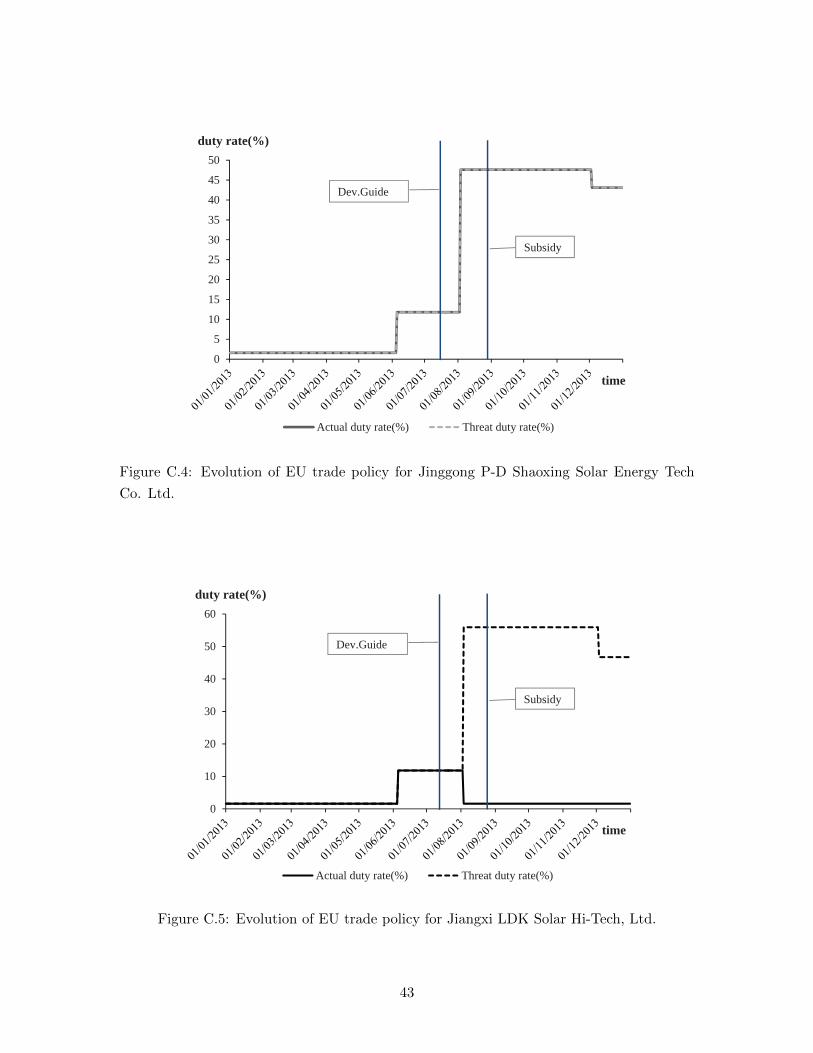
0
5
10
15
20
25
30
35
40
45
50
Actual duty rate(%) Threat duty rate(%)
time
duty rate(%)
Dev.Guide
Subsidy
Figure C.4: Evolution of EU trade policy for Jinggong P-D Shaoxing Solar Energy Tech
Co. Ltd.
0
10
20
30
40
50
60
Actual duty rate(%) Threat duty rate(%)
time
duty rate(%)
Dev.Guide
Subsidy
Figure C.5: Evolution of EU trade policy for Jiangxi LDK Solar Hi-Tech, Ltd.
43
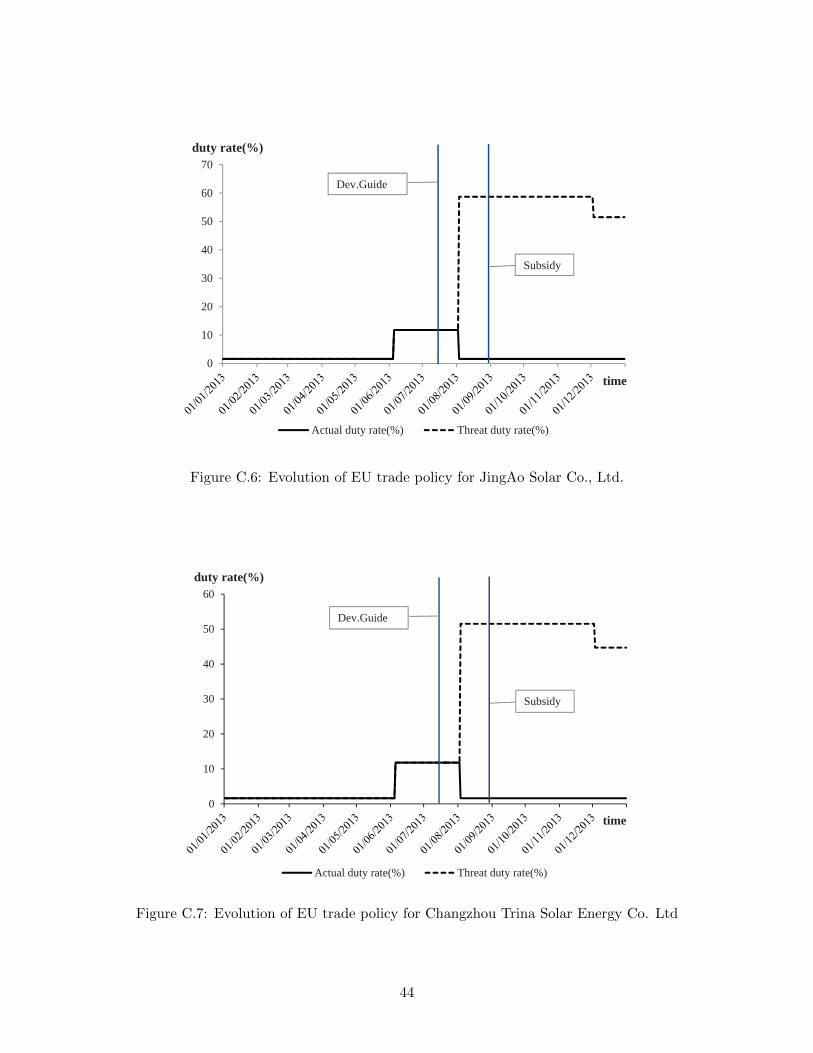
0
10
20
30
40
50
60
70
Actual duty rate(%) Threat duty rate(%)
duty rate(%)
Dev.Guide
Subsidy
time
Figure C.6: Evolution of EU trade policy for JingAo Solar Co., Ltd.
0
10
20
30
40
50
60
Actual duty rate(%) Threat duty rate(%)
duty rate(%)
Dev.Guide
Subsidy
time
Figure C.7: Evolution of EU trade policy for Changzhou Trina Solar Energy Co. Ltd
44
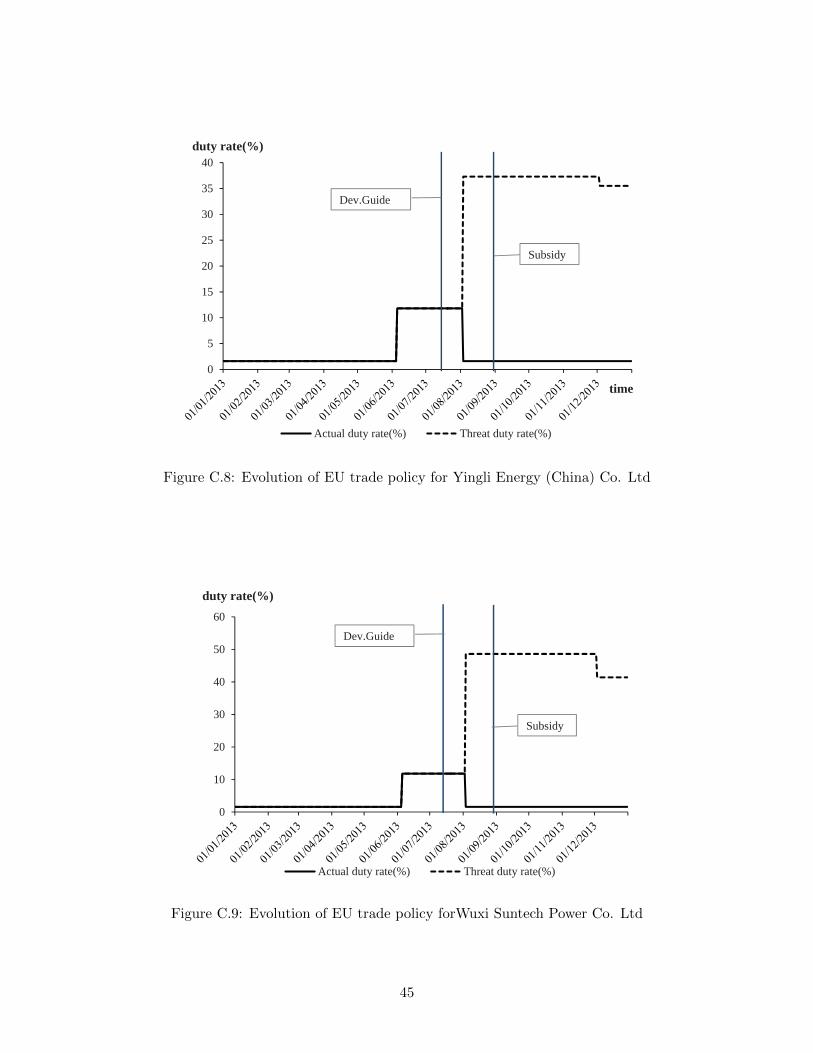
0
5
10
15
20
25
30
35
40
Actual duty rate(%) Threat duty rate(%)
duty rate(%)
time
Dev.Guide
Subsidy
Figure C.8: Evolution of EU trade policy for Yingli Energy (China) Co. Ltd
0
10
20
30
40
50
60
Actual duty rate(%) Threat duty rate(%)
duty rate(%)
Dev.Guide
Subsidy
Figure C.9: Evolution of EU trade policy forWuxi Suntech Power Co. Ltd
45
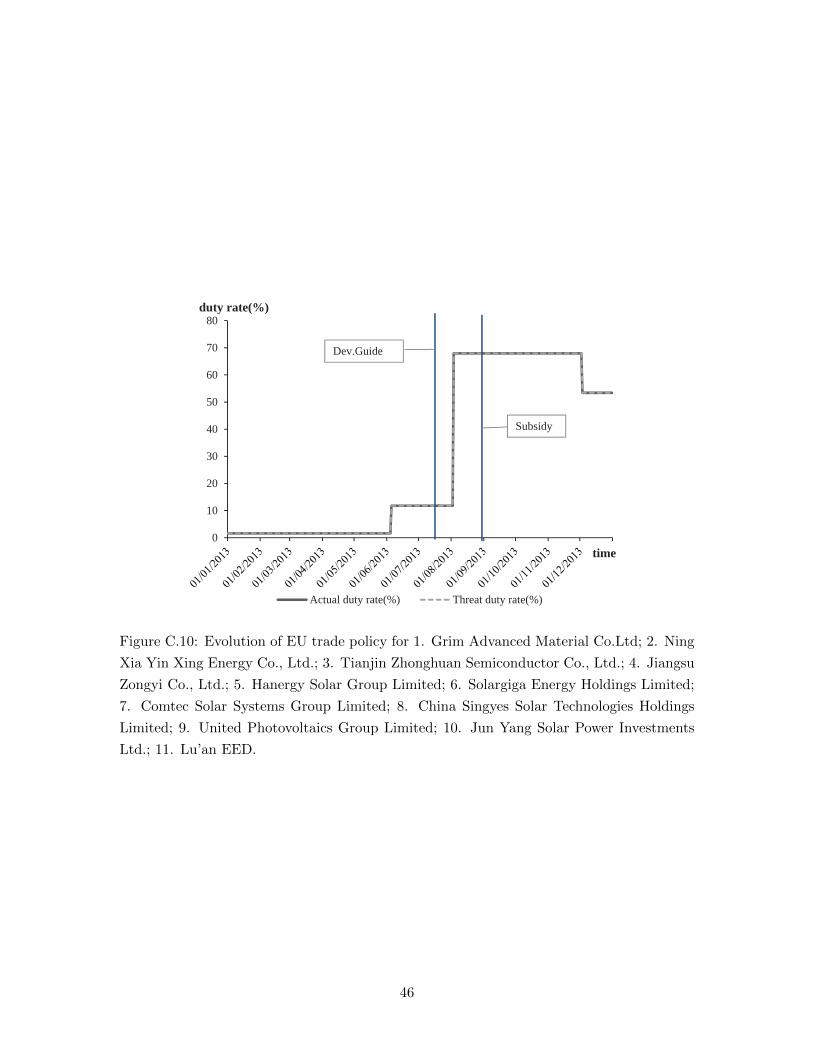
0
10
20
30
40
50
60
70
80
Actual duty rate(%) Threat duty rate(%)
duty rate(%)
Dev.Guide
Subsidy
time
Figure C.10: Evolution of EU trade policy for 1. Grim Advanced Material Co.Ltd; 2. Ning
Xia Yin Xing Energy Co., Ltd.; 3. Tianjin Zhonghuan Semiconductor Co., Ltd.; 4. Jiangsu
Zongyi Co., Ltd.; 5. Hanergy Solar Group Limited; 6. Solargiga Energy Holdings Limited;
7. Comtec Solar Systems Group Limited; 8. China Singyes Solar Technologies Holdings
Limited; 9. United Photovoltaics Group Limited; 10. Jun Yang Solar Power Investments
Ltd.; 11. Lu’an EED.
46