Embed Size (px)
Citation preview
PolicyInformationReport
Research Division
Policy InformationCenter
Teaching the Teachers:Different Settings, Different Results
CONTENTS
Foreword . . . . . . . . . . . . . . . . . . . . . . . . . . . . . . . . . . . . . . . . . . . . . 1
Preface . . . . . . . . . . . . . . . . . . . . . . . . . . . . . . . . . . . . . . . . . . . . . . . 2
Acknowledgments . . . . . . . . . . . . . . . . . . . . . . . . . . . . . . . . . . . . . . 2
Executive Summary . . . . . . . . . . . . . . . . . . . . . . . . . . . . . . . . . . . . . 3
Chapter One: The Controversy over Teacher Education. . . . . . . . . . 7
Chapter Two: What the Prior Research Says . . . . . . . . . . . . . . . . . . . 11
Chapter Three: A Portrait of Education Schools and TheirStudents . . . . . . . . . . . . . . . . . . . . . . . . . . . . . . . . . . . . . . . . . . . . 16
Chapter Four: How Characteristics of Education Schools AreRelated to Licensure Examination Scores . . . . . . . . . . . . . . . . . . . 26
Chapter Five: Implications for Educational Policy and FutureResearch . . . . . . . . . . . . . . . . . . . . . . . . . . . . . . . . . . . . . . . . . . . . 30
References . . . . . . . . . . . . . . . . . . . . . . . . . . . . . . . . . . . . . . . . . . . . 34
Appendix Tables . . . . . . . . . . . . . . . . . . . . . . . . . . . . . . . . . . . . . . . . 36
This report was written by:
Harold WenglinskyEducational Testing Service
The views expressed in this reportare those of the author and do notnecessarily reflect the views of theofficers and trustees of EducationalTesting Service.
Additional copies of this report can beordered for $10.50 (prepaid) from:
Policy Information CenterMail Stop 04-REducational Testing ServiceRosedale RoadPrinceton, NJ 08541-0001(609) 734-5694Internet – [email protected]
Copies can also be downloaded fromwww.ets.org/research/pic.
Copyright © 2000 by Educational TestingService. All rights reserved. EducationalTesting Service is an Affirmative Action/Equal Opportunity Employer. EducationalTesting Service, ETS, the ETS logo, andNTE are registered trademarks of Educa-tional Testing Service. SAT is a registeredtrademark of the College Board. The PraxisSeries is a trademark of Educational TestingService. The modernized ETS logo is atrademark of Educational Testing Service.
August 2000
2
FOREWORD
Perhaps no issue is of greaterimportance to K-12 educationthan the quality of the teachingforce.While there is almost univer-sal agreement that student successis predicated on effective teachers,there are intense debates about thequality of those who teach andhow best to produce an effectiveteaching force. These debates arehaving a significant impact onpolicy decisions throughout thecountry at local, state, and federallevels. We are seeing school dis-tricts and states attempting toimplement rewards and sanctionsfor teachers on the basis of studentoutcomes. A number of states arerewarding teachers with significantpay increases for demonstrationsof accomplished practice throughsuch mechanisms as the NationalBoard for Professional TeachingStandards. Recent federal legis-lation requires states to reportpublicly the performance of theirteacher education programs. Wesee states increasing requirementsfor initial licensure at the sametime that we see greater investmentin supporting the developmentof beginning teachers duringtheir first years of practice. Thesetrends, as well as others, reflect theurgency that policymakers from allalong the political spectrum aregiving to the task of supportingthe development of an effectiveteaching force.
As is often the case withcontentious policy debates, passionsometimes leads to polarizationand simplification of the issues.But simple generalizations, whileseductive, do not serve the public
well, particularly when issues arecomplex and untidy. Given theprominent role of EducationalTesting Service� in the assessmentof teachers throughout theircareers, we take seriously ourresponsibility for contributing tothe dialogue about the quality ofthe teaching force and teachereducation. We believe it is impor-tant to bring to the fore data thatilluminate complicated issues sothat policymakers can make moreinformed decisions.
I am very proud to present thisreport by my colleague HaroldWenglinsky. This study is the thirdin a series that examines criticalissues surrounding the teachingpipeline. Last year, I collaboratedwith Andrew Latham and RobertZiomek on The Academic Qualityof Prospective Teachers, in which weexamined the college entranceexamination scores of variouscategories of prospective teachers.We found that the academicquality of prospective teachers,using the very rough measuresof SAT� and ACT scores, wasextremely varied. For example,while the scores of those seekingelementary licensure lagged behindthose of the average college gradu-ate, those seeking subject matterlicenses (e.g., mathematics or socialstudies) had SAT scores thatexceeded those of the averagecollege graduate. We also foundthat licensure testing had a majorimpact on the academic quality ofthe teaching pool as those who metthe licensure requirements hadmuch higher SAT and ACT scores,as well as college grades, than those
candidates who did not meet therequirements. We also determinedthat raising licensure standards wasnot an easy solution. Indeed, theprofile of successful candidateswould improve if licensing stan-dards were increased. However, thepool would be much smaller, andless diverse, suggesting that manymore unlicensed teachers wouldfind their way into the classroomsin order to meet increasingdemands for teachers.
In another recent ETS study,Richard Coley and BarbaraBruschi compared the literacyskills of teachers to those of adultsin other occupations. They foundthat the literacy skills of teacherswere comparable to those of otherprofessionals. For instance, teach-ers performed as well as lawyers,physicians, and electrical engineers,while outperforming managers andadministrators on two of the threeforms of literacy that were studied.Their standing was particularlyimpressive when taking intoaccount the large difference wefound in compensation. Comparedto other college graduates at thehighest level of literacy, teachersearned $222 less each week.
Teaching the Teachers: DifferentSettings, Different Results representsthe third of these efforts to studyaspects of teaching and learning, inthis case to study the effectivenessof the institutions in which teach-ers are prepared. The study was anundertaking of nearly three years.Institutions and their schools ofeducation were studied by drawingon multiple sources of informa-tion, including government
3
PREFACE
The matters of teacher preparationand effectiveness are discussed onthe front pages of newspapers thesedays, and are prominent in thepositions of candidates for politicaloffice — from the local to thepresidential level. The debate oversolutions is vigorous — andpolarized. However, facts are inshort supply. As Drew Gitomerexplains in the Foreword, ETS isexpanding its research effort toinform this debate and the choicesthat have to be made. This report,Teaching the Teachers, is our largestundertaking to date.
Paul E. Barton, Director ETS Policy Information
Center
ACKNOWLEDGMENTS
This report could not have beenwritten without the contributionsof many people and organizations.Financial support was provided bythe Teaching and Learning Pro-gram and the Research Division ofEducational Testing Service. Dataon Praxis licensure examinationswere provided by the Teaching andLearning Program. Data on SATscores were provided by the schoolsand colleges program, also ofEducational Testing Service. Dataon teacher education institutionswere drawn from the IntegratedPostsecondary Educational DataSystem, a database of the NationalCenter for Education Statistics.Data on schools, colleges anddepartments of education camefrom a questionnaire sent to deansof education as part of this study.Assistance in the development andadministration of this survey wasprovided by Barbara Bruschi, MyraJoy, Diane Rein, and Gita Wilder.The report was reviewed by PaulBarton, Richard Coley, EmilyFeistritzer, Robin Henke, DanielMayer, Robert Mislevy, andRichard Tannenbaum. RichardColey also provided the graphics;Carla Cooper designed the coverand provided desktop publishingservices. Amanda McBride wasthe editor. Kathleen Benischeckcoordinated production. Last butnot least, Drew Gitomer providedguidance and feedback through allstages of the project. This reportdoes not, however, necessarilyrepresent the views of those whocontributed to its production. Anyerrors of fact or interpretation arethe responsibility of the author.
databases and a study-administeredquestionnaire to deans of educa-tion. The study then related theseaspects of institutions and schoolsof education to the performance ofteacher candidates on the Praxis IIteacher licensure examinations.Once again, we find a morecomplex story than the politicalrhetoric would lead one to con-clude. The quality of results inteacher education is highly variable,but is associated with some veryclear attributes of teacher educationinstitutions. Wenglinsky’s resultsmake clear once again that teach-ing requires a mastery of bothcontent and pedagogy, and thatone at the exclusion of the otheris insufficient.
We intend to continue toexpand our research on teaching.Recently we have established aresearch center to take on thiswork. We are now conductingstudies that will look at studentacademic performance as animportant indicator of teachereffectiveness. We have a series ofstudies exploring the validity of theassessments of National Board forProfessional Teaching Standards.While none of these efforts isexpected to settle the questionsunder study once and for all, it ishoped that they will encourageother researchers in the field topursue these lines of inquiryfurther. The report that youare about to read should beunderstood in that light.
Drew GitomerVice President
Research Division
4
EXECUTIVE SUMMARY
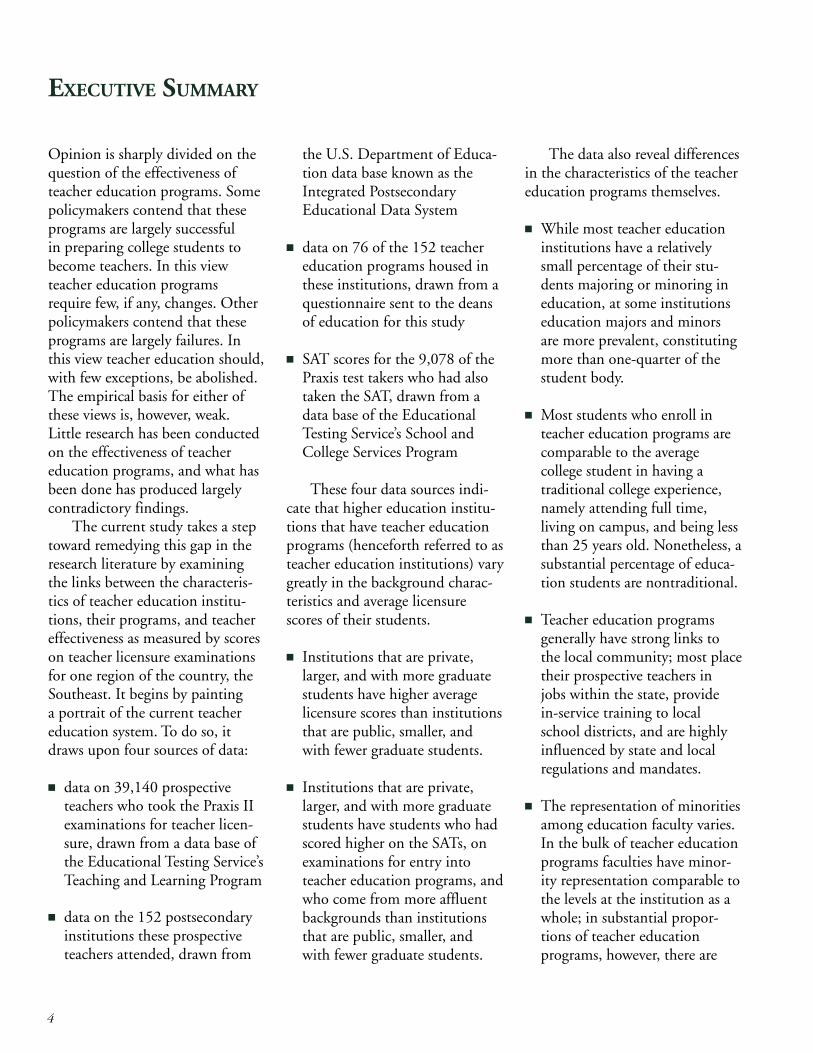
Opinion is sharply divided on thequestion of the effectiveness ofteacher education programs. Somepolicymakers contend that theseprograms are largely successfulin preparing college students tobecome teachers. In this viewteacher education programsrequire few, if any, changes. Otherpolicymakers contend that theseprograms are largely failures. Inthis view teacher education should,with few exceptions, be abolished.The empirical basis for either ofthese views is, however, weak.Little research has been conductedon the effectiveness of teachereducation programs, and what hasbeen done has produced largelycontradictory findings.
The current study takes a steptoward remedying this gap in theresearch literature by examiningthe links between the characteris-tics of teacher education institu-tions, their programs, and teachereffectiveness as measured by scoreson teacher licensure examinationsfor one region of the country, theSoutheast. It begins by paintinga portrait of the current teachereducation system. To do so, itdraws upon four sources of data:
� data on 39,140 prospectiveteachers who took the Praxis IIexaminations for teacher licen-sure, drawn from a data base ofthe Educational Testing Service’sTeaching and Learning Program
� data on the 152 postsecondaryinstitutions these prospectiveteachers attended, drawn from
the U.S. Department of Educa-tion data base known as theIntegrated PostsecondaryEducational Data System
� data on 76 of the 152 teachereducation programs housed inthese institutions, drawn from aquestionnaire sent to the deansof education for this study
� SAT scores for the 9,078 of thePraxis test takers who had alsotaken the SAT, drawn from adata base of the EducationalTesting Service’s School andCollege Services Program
These four data sources indi-cate that higher education institu-tions that have teacher educationprograms (henceforth referred to asteacher education institutions) varygreatly in the background charac-teristics and average licensurescores of their students.
� Institutions that are private,larger, and with more graduatestudents have higher averagelicensure scores than institutionsthat are public, smaller, andwith fewer graduate students.
� Institutions that are private,larger, and with more graduatestudents have students who hadscored higher on the SATs, onexaminations for entry intoteacher education programs, andwho come from more affluentbackgrounds than institutionsthat are public, smaller, andwith fewer graduate students.
The data also reveal differencesin the characteristics of the teachereducation programs themselves.
� While most teacher educationinstitutions have a relativelysmall percentage of their stu-dents majoring or minoring ineducation, at some institutionseducation majors and minorsare more prevalent, constitutingmore than one-quarter of thestudent body.
� Most students who enroll inteacher education programs arecomparable to the averagecollege student in having atraditional college experience,namely attending full time,living on campus, and being lessthan 25 years old. Nonetheless, asubstantial percentage of educa-tion students are nontraditional.
� Teacher education programsgenerally have strong links tothe local community; most placetheir prospective teachers injobs within the state, providein-service training to localschool districts, and are highlyinfluenced by state and localregulations and mandates.
� The representation of minoritiesamong education faculty varies.In the bulk of teacher educationprograms faculties have minor-ity representation comparable tothe levels at the institution as awhole; in substantial propor-tions of teacher educationprograms, however, there are
5
either higher or lower percent-ages of minority faculty com-pared to the institution asa whole.
Thus, there is great diversityboth in the outcomes of teachereducation programs, as measuredby licensure scores, and the charac-teristics of these programs, theirteacher education institutions, andthe students that attend them. Totease out the relative influenceteacher education program charac-teristics, teacher education institu-tion characteristics, and studentbackground characteristics have onlicensure scores, it was necessaryto apply advanced statisticaltechniques to the data from thefour sources. Three sets of relation-ships were measured:
� the links between the character-istics of teacher educationinstitutions and student scoreson a series of licensure tests
� the links between the character-istics of teacher educationprograms and student scoreson a series of licensure tests
� the links between the character-istics of teacher educationinstitutions and the characteris-tics of teacher education pro-grams within those institutions
For purposes of this study, the“effectiveness” of teacher educationinstitutions and their programsshould be understood as thetendency of certain characteristicsof these institutions and programs
to be associated with higherlicensure scores, above and beyondthe characteristics of the studentsenrolled in them. This notion ofeffectiveness is a relative one; itidentifies ways in which someinstitutions are more effective thanothers by virtue of their higherscores, but does not indicate anabsolute level of scores at whichinstitutions cross the line fromineffectiveness to effectiveness.While this research can suggestdirections for the improvement ofinstitutions and programs, it ismore in the purview of policy-makers to define what level ofteacher preparation is “goodenough” to provide primary andsecondary school students withthe teachers they deserve.
The study found that fivecharacteristics of institutions andprograms were indeed conduciveto higher teacher licensure scores:
� Private institutions outper-formed public ones.
� Universities outperformedcolleges.
� Teacher education programswith a higher number of tradi-tional students outperformedthose with fewer such students.
� Teacher education programswith ethnically diverse facultiesoutperformed those with over-whelmingly White faculties.
� Institutions with large propor-tions of education majors andminors and large proportions of
their budgets devoted to teachereducation performed worse thaninstitutions with small propor-tions of education majors andminors and small proportionsof their budgets devoted toteacher education.
These findings suggest thatneither the views of supportersnor those of detractors of teachereducation programs are entirelycorrect. For one thing, teachereducation programs are neitheruniformly successful nor uniformlyunsuccessful. Depending on theircharacteristics, some produceteacher candidates who performwell on licensure tests, whereasothers do not. While the successfulschools may be a minority, they area substantial one. For instance,private institutions, which werefound to be particularly effective,constitute one-quarter of institu-tions with teacher educationprograms. For another, while somecharacteristics of effective pro-grams are what detractors wouldexpect, others are what supporterswould expect. Supporters viewhigher education as an environ-ment conducive to preparingteachers. This research supportsthis contention, finding thatprospective teachers who have atraditional college experienceoutperform those who do not.Detractors, however, note thatteacher education programs mayplace too great an emphasis onknowledge of pedagogy, potentiallyat the expense of knowledge of thesubject matter to be taught. Thisresearch supports this contention
6
as well, finding that prospectiveteachers in institutions with highproportions of education majorsand minors perform less well thanprospective teachers in institutionswith somewhat less emphasis onpedagogical training.
While this study does take afirst look at the links amongteacher education institutions,teacher education programs,and teacher effectiveness, muchremains to be done. Futureresearch should examine anumber of issues, including:
� the impact of teacher educationinstitutions on other measuresof teacher effectiveness, includ-ing classroom observations
� the impact of other characteris-tics of teacher education pro-grams, such as curriculumand mentoring programs forstudent teachers
These issues for furtherresearch notwithstanding, it ishoped that the current studyprovides sufficient evidence thatthe key to improving teachereducation programs lies neither intheir abolition nor in their beingmaintained as they are. Rather,ineffective programs should bereformed to emulate the practicesof effective ones.
7
CHAPTER ONE: THE
CONTROVERSY OVER
TEACHER EDUCATION
There is a broad consensus amongpolicymakers and educators thatone of the biggest challenges of the21st century will be to confrontthe trade-off between teacherquantity and teacher quality. Onthe one hand, there is growingpressure to hire more teachers.Student enrollments are increasingdramatically just as large numbersof teachers are reaching retirementage. Initiatives at the federal andstate levels to reduce class size byhiring more teachers furtherexacerbate this problem. On theother hand, policymakers want toimprove the quality of the teachingforce. The promulgation of highacademic standards in many stateshas led to concerns that teacherswill not be prepared to help theirstudents meet them. And theexperience in Massachusetts, where60 percent of the prospectiveteaching force failed a proficiencytest (although the appropriatenessof the test has been subject todebate), suggests that those con-cerns may be justified (Bradley,1999). The challenge for educatorsand policymakers is that the twinpressures for quantity and quality,if left to their own devices, are atodds with one another. In stateslike California, as districts hiremore and more teachers, theybring in an increasing proportionof uncertified teachers, de factolowering standards. As states likeMassachusetts raise the bar for
teachers, they will find fewer andfewer that they can hire.
Yet this dilemma is moreapparent than real. Both thenumber and quality of teachers canbe enhanced by improving theirpreparation for teaching. Just asimproving K-12 education willhelp more students meet highacademic standards, improvingpreservice teacher training willhelp more teachers make the grade.Although most policymakers agreethat improving teacher prepara-tion is the key to resolving thequantity-quality trade-off, theydisagree on the changes to teacherpreparation that need to occur tofoster improvement. At the riskof simplifying the matter, mostpolicymakers want either topreserve most aspects of thecurrent system of teacher educa-tion, increasing its role in teacherpreparation without changingits content, or to abandon thesystem wholesale.
The current system of teachereducation can be briefly character-ized as one that emphasizes profes-sional knowledge at the expense ofcontent knowledge, and one thatemphasizes the control of teachereducation by schools, colleges, anddepartments of education (SCDEs)housed in higher education institu-tions rather than control by K-12school districts. Professionalknowledge typically refers toknowledge of how students learn,teaching methods, and childdevelopment. Content knowledgetypically refers to knowledge ofsubject matter from an academicdiscipline. In other words, content
knowledge is what is to be taught,and professional knowledge is howto teach it. To receive a license thatallows them to teach in a givenstate, most prospective teachersneed to learn both content andprofessional knowledge at aninstitution of higher education.They are required to complete acertain number of credit hoursof professional knowledge courses,a certain number of credit hoursof content knowledge courses andto engage in student teaching. Allof the professional knowledgecourses, and some of the contentknowledge courses, are taught bythe SCDEs. The clinical training,while occurring in an elementary,middle, or high school, is alsoorganized and supervised by theSCDEs. Usually, prospectiveteachers are also required to passexternal examinations of theirprofessional and content knowl-edge prior to or shortly after theybegin teaching.
One set of proposals to reformteacher education has been putforward by the National Commis-sion on Teaching and America’sFuture (NCTAF), whose recom-mendations are described in itsreport What Matters Most:Teaching for America’s Future(NCTAF, 1996). In addition to itsrecommendations on recruitingteachers, increasing opportunitiesfor career advancement, andorganizing schools to supportbetter teaching, the report makes aseries of proposals for reformingthe teacher education system. Itcalls for the establishment of statelicensing boards, comprised of
8
faculty from SCDEs as well asparticularly gifted teachers andprincipals. These boards wouldpromulgate high standards forteaching. All SCDEs would berequired to obtain accreditationfrom an independent organization,the National Council for theAccreditation of Teacher Education(NCATE). The state would berequired to close SCDEs that areconsistently found to be inad-equate. The requirements ofteacher education institutions(TEIs)1 would be modified torequire four years of college with amajor in an academic subject,followed by postbaccalaureateeducation courses and a one-yearstudent teaching experience in aK-12 school closely affiliated with acollege or university, known as aprofessional development school.And all prospective teachers wouldbe required to pass examinations inprofessional knowledge and contentknowledge to receive their licenses.
Yet this set of proposals, whilemaking the system of teachereducation more uniform, does notchange its emphasis on profes-sional knowledge or the predomi-nance of SCDEs. All preserviceteacher training will continue tocome from SCDEs; there is noprovision for alternate pathways toteaching except through thoseSCDEs. And professional knowl-edge will continue to be empha-sized at current levels; all of theproposals continue to make profes-sional knowledge courses a prereq-uisite for teaching. Required
licensure tests will include one forprofessional knowledge. Accredita-tion of institutions by NCATE willsimply bring deviant institutionsinto conformity with a model thatrequires substantial amounts ofcoursework in professional knowl-edge or high passage rates on theprofessional knowledge test, alongwith NCATE’s requirements forcontent knowledge. And while theproposal to move educationcourses to the postbaccalaureatelevel will increase students’ oppor-tunities to take courses in contentknowledge, it also avoids reducingthe courseload in professionalknowledge; students simply takethe education courses later.
An alternative to the NCTAFproposals is suggested by theThomas B. Fordham Foundation(TBFF), as contained in its mani-festo “The Teachers We Need andHow to Get More of Them”(TBFF, 1999). In addition torecommending differential pay forteachers based on their knowledgeand skill, the abolition of teachertenure, and principal control overpersonnel decisions, the manifestocontains various proposals perti-nent to teacher education. Itwould eliminate all requirementsfor the licensure of teachers exceptfor criminal background checks,examinations of content knowl-edge, and a major in the relevantsubject. The manifesto would alsoencourage pathways to teachingother than through SCDEs. Dataon the passage rates of SCDEs onlicensure examinations would be
published, and prospective teacherscould choose to take educationcourses at whichever of theseinstitutions they wished. Alter-nately, prospective teachers couldopt out of SCDEs, instead receiv-ing compressed training in con-junction with student teaching.This training need not be providedby SCDEs.
The TBFF proposals aretantamount to the elimination ofthe current system. The SCDEslose their monopoly on teachereducation — prospective teachersmay go elsewhere for their careerpreparation, either to the schooldistricts that will hire them or toother training academies. Giventhe costs in time and money of acollege- or university-based teachereducation program, it is unlikelythat many students will continueto choose SCDEs for their prepa-ration. Licensure tests in profes-sional knowledge will also beeliminated; prospective teachersneed only be proficient in thesubject matter they intend toteach. This change will also havethe consequence of reducing thepower of SCDEs; even if teachercandidates might choose them overother sources of training in profes-sional knowledge, there is noincentive for them to master thatprofessional knowledge, since itwill not be “on the test.”
Thus the two dominantproposals to reform teachereducation and increase the supplyof high-quality teachers arediametrically opposed to one
1 The phrase “teacher education institutions” refers to postsecondary institutions that house SCDEs.
9
another. NCTAF seeks to preserveor even enhance the importanceof professional knowledge inpreparing teachers; TBFF seeks toincrease the importance of contentknowledge at the expense ofprofessional knowledge. NCTAFseeks to maintain the predomi-nance of higher education gener-ally and SCDEs in particular overteacher education; TBFF seeks togive the control over teachereducation to teacher candidatesand the principals who hire them.In essence, the NCTAF approachviews a somewhat enhancedversion of the current system ofteacher education programshoused in colleges and universitiesas the solution to deficits inteacher quality; TBFF views thecurrent system as the problem.
In holding these views, the twoproposals make dramaticallydifferent empirical assumptionsabout the link between TEIs andteacher effectiveness. In theNCTAF view, TEIs are conduciveto high-quality teaching, albeitwith modest changes. The moreprospective teachers who gothrough the moderately enhancedversion of the current system ofcoursework and receive permanentlicenses to teach, the higher thequality of the teaching force. Andto the extent that the currentsystem needs to be changed, it isonly insofar as requirements needto be increased and loopholes thatevade these requirements closed. Inthe TBFF view, TEIs are deleteri-ous to high-quality teaching. Themore coursework in educationthat prospective teachers have to
complete, the less likely that theywill be good teachers. And manypeople who would make excellentteachers are turned away fromelementary, middle, and secondaryschools because they have nottaken the requisite educationcourses. In both the NCTAF andTBFF views, TEIs are a uniformlot, either providing what studentsneed to become good teachers orcreating an unnecessary and evendangerous hurdle to becominga teacher.
Yet a middle ground betweenthese two views certainly exists,namely that the ability to preparehigh-quality teachers varies greatlyamong TEIs. Perhaps certain typesof teacher education program areparticularly adept at preparingteachers while others are not. Ifthis is the case, then the solution tothe quality-quantity trade-off isneither to maintain the currentsystem nor to abolish TEIs as theprimary site for teacher training.Rather, the practices of the mosteffective institutions should beidentified and emulated by theleast effective ones. In this way, thequality of prospective teacherscoming through the pipeline canbe increased, making it possibleboth to raise the bar for licensureand still meet the growing demandfor more teachers. Many educa-tional organizations advocate thismiddle ground. NCATE, forinstance, has moved towardaccrediting TEIs based not simplyon their course requirements, buton the performance of prospectiveteachers on licensure tests closelyaligned to state academic
standards. To the extent that statesrequire NCATE accreditation,such an approach would pushineffective TEIs to emulate theireffective counterparts, or else facethe possibility of closure.
This report provides an empiri-cal basis for this middle ground. Itpresents the results of a study thatdistinguishes the characteristicsof effective TEIs from those ofineffective ones. The study identi-fied 40,000 prospective teacherswho took licensure examinations,and related their scores on theexaminations to the characteristicsof their TEIs. The study finds thatthe effectiveness of teacher educa-tion does indeed vary a great deal,depending on five characteristics ofthe programs. Private institutionsdo a better job than public ones;universities do a better job thancolleges; institutions where thescope of the SCDE is more limiteddo a better job than institutionswhere the SCDE predominates;SCDEs where prospective teacherstend to be traditional collegestudents, living on campus andattending school full-time, dobetter than those where nontradi-tional students predominate; andSCDEs with ethnically diversefaculties do better than those withfew minority faculty members.Before discussing these results inmore detail, however, it is neces-sary to provide some context forthem. The next chapter willsummarize what is known aboutTEIs and their effectiveness fromother research studies. ChapterThree will present informationfrom this study that describes the
10
great diversity of TEIs, andexplains how the data for thisstudy were collected. Chapter Fourwill present results concerning theconnection between certain charac-teristics of TEIs and teacher licen-sure examination scores, and thentouch on the statistical techniquesemployed to accomplish this.Chapter Five will suggest what elseneeds to be done to learn about theeffectiveness of TEIs and identifysome implications of the studyfor policymakers.
11
CHAPTER TWO:WHAT THE PRIOR
RESEARCH SAYS
The views of NCTAF and TBFFmake certain empirical assump-tions about the impact of TEIson teacher effectiveness; the oneassumes that TEIs have, on aver-age, a positive impact on teachereffectiveness, while the otherassumes that TEIs have no impactor even a negative impact onteacher effectiveness. Prior researchhas taken various approaches totesting these assumptions. Oneapproach is to gauge the overallimpact of teacher licensing poli-cies, including teacher education,licensure examinations, andsupporting beginning teachers(referred to as “induction”) bycomparing licensed teachers totheir unlicensed counterparts.Another approach is to measurethe benefits of teacher educationprograms with full course-takingrequirements by comparing themto streamlined alternate formsof certification. Or studies canexamine the importance of prepa-ration in professional knowledge,characteristic of SCDEs, relativeto preparation in other areas suchas content knowledge, not neces-sarily characteristic of SCDEs.NCTAF would expect that the firstapproach would find that licensedteachers outperformed unlicensedones, that the second approachwould find that teacher educationprograms with full course-takingrequirements outperformedalternate certification programs,and that the third approach would
find that professional knowledgewas more important than contentknowledge. TBFF, on the otherhand, would expect that licensedteachers would perform no betterthan unlicensed ones; that alter-nate certification programs woulddo just as well, if not better than,traditional programs, and thatprofessional knowledge would beless important than content knowl-edge. Much of the prior researchon teacher education has taken oneof these three approaches. Unfortu-nately, the results from the firsttwo approaches have been inconsis-tent. The results from the thirdapproach, while consistent, havenot entirely supported either theNCTAF or TBFF perspectives.
Studies measuring the impactof licensing on teacher effective-ness have produced mixed results.Practicing teachers tend to haveone of four categories of license:a permanent or regular license,which indicates that they have metall requirements for becoming ateacher; a probationary license,which indicates that they have metmost requirements and will meetthe remaining few during the firstyear or two of teaching; an emer-gency license, which indicates thatthey have not met most require-ments but are permitted to teachnonetheless; and no license what-soever. While most teachershave permanent or probationarylicenses, during periods whenteaching is in high demand thereis growing pressure to conferemergency licenses or to allowunlicensed teachers to teach. Insuch circumstances, researchers
have an opportunity to comparethe effectiveness of teachers withpermanent or probationarylicenses to those with emergencylicenses or none at all. The twomost recent studies to do so,however, have reached contradic-tory conclusions. Goldhaber andBrewer (1999) used a national database of students and teachers, the“National Educational Longitudi-nal Study of 1988–92,” to relatetypes of teacher licensure to stu-dent academic performance inmathematics and science. Theycompared teachers who had apermanent license in the subjectthey were teaching to teachers whohad an emergency license in thatfield and those who had either nolicense at all or a license in anotherfield. They found that the studentswith teachers who had eitherpermanent or emergency certifica-tion in the relevant field outper-formed students with teachers whohad no license in that field. Theyalso found no significant differencebetween students whose teachershad permanent licenses in the fieldand those who had emergencylicenses. Pointing to this secondfinding, they concluded that thefull set of requirements associatedwith permanent licenses did nottranslate into improved studentperformance; teachers could justas well avoid the required course-work, testing, and inductionprograms and simply receivean emergency license.
Another study, however,reached the opposite conclusion.Linda Darling-Hammond (2000)compared the percentages of
12
teachers in each state withpermanent licenses to the stateaverage of students’ scores inmathematics and reading from theNational Assessments of Educa-tional Progress in 1990, 1992,1994, and 1996. The study foundthat states with higher percentagesof permanently licensed teachershad higher test scores in both sub-jects; this characteristic explainedfrom two-thirds to four-fifths ofthe variation in test scores. Thefindings from earlier studies havebeen similarly contradictory.Perhaps the leading reason for thisambiguity is that the categories oflicenses being compared eachinclude a wide range of teachersand circumstances, depending onthe state. In some states, permanentcertification means a great deal ofcoursework in education; in otherstates it reflects more emphasis oncontent knowledge. And teacherswith emergency licenses can eitherbe particularly gifted prospectiveteachers that a school system wantsto attract with reduced require-ments, or underqualified prospec-tive teachers who are hired toaddress a teacher shortage. It isthus difficult to use comparisonsamong license types to learn aboutthe impact of teacher educationon teacher effectiveness or studentacademic performance.
Studies can also compareoutcomes between traditionalcertification and alternate certifi-cation programs. Many states havedeveloped a set of procedures thatpermit prospective teachers with abachelors’ degree in a relevant fieldto receive a license without having
to take the full complement ofprofessional knowledge courses.Comparing these teachers to thosewho had to meet all requirementswould suggest the added benefit ofthe full requirements above andbeyond the minimal ones ofalternate certification. Here too,however, the results from priorresearch are mixed. One study ofNew Jersey’s alternate certificationprogram found that it providedpositive benefits over traditionalcertification (Natriello et al.,1990), while another found thesame program to have deleteriouseffects (Smith, 1990). Reviews ofthe research thus disagree on thelesson to draw from alternatecertification, some claiming that itindicates the uselessness of tradi-tional requirements and particu-larly SCDEs (Kwiatowski, 1999)and others claiming that it indi-cates that there is no viable short-cut to taking the full complementof courses from SCDEs (Darling-Hammond, 1990). Some of theambiguous results from thesestudies may be explained by thefact that the prospective teacherswho pursue alternate certificationmay not be a homogeneous group;those who receive alternate licensesmay be high performers beinglured into teaching from otherprofessions through reduced entryrequirements, or low performerswho could not meet the require-ments of a traditional license.Depending on the kinds of teach-ers utilizing alternate certificationprograms, they could performeither better or worse than tradi-tionally certified teachers.
While studies of teacherlicensing and alternate certificationhave not been conclusive, anotherapproach has yielded more defini-tive results. Some studies com-pared the impact of professionalknowledge preparation to theimpact of subject-matter prepara-tion. Rather than investigating thecharacteristics of teacher educationprograms of prospective teachers,these studies tended to surveyestablished teachers as to theirlevels of preparation in professionalknowledge and content knowledgeand link these to measures ofteacher effectiveness. A summaryof the results of 65 of these studiesin the subject of science, referredto as a meta-analysis, found thatboth preparation in science andpreparation in professional knowl-edge were linked to teacher effec-tiveness (Druva & Anderson,1983). Other reviews have alsofound this to be the case (Byrne,1983; Ashton & Crocker, 1987).More recently, Monk (1994)studied a national sample of morethan 2,000 students and theirteachers, and found that both thesubject matter and pedagogicalpreparation of teachers had animpact on student achievement inmathematics and science. Thesestudies of content and professionalknowledge thus suggest that goodteacher preparation requirescourses in both areas; subjectmatter knowledge without profes-sional knowledge produces teach-ers who cannot convey what theyknow about the subject, andprofessional knowledge withoutsubject matter knowledge
13
produces teachers who havenothing to convey.
In sum, prior research hassupported neither the views ofNCTAF nor those of TBFF.Research on the impact of teacherlicensing on student outcomes hasbeen mixed, as has research com-paring alternate certification totraditional programs. And thefindings of studies of professionaland content knowledge have notgiven preference to either type ofknowledge; both have been foundto be important components ofeffective teaching.
A third view, that TEIs vary intheir effectiveness, makes its ownset of empirical assumptions. Itpredicts not only that some TEIswill have more positive outcomesfor their prospective teachers thanothers, but that the TEIs withmore positive outcomes will have acommon set of characteristics thatare distinct from those of TEIswith more negative outcomes. Thisview can be tested by studying thelinks between various character-istics of TEIs and measures ofteacher effectiveness. Those charac-teristics of TEIs that are associatedwith positive outcomes can bedeemed as characteristics of effec-tive TEIs, which ineffective institu-tions should seek to emulate.
Unfortunately, little work ofthis sort has been undertaken. Todate, virtually no large-scale studiesattempt to gauge the impact ofTEI characteristics on teachereffectiveness. The one exceptionis a study of 2,229 studentsattending 15 public institutions inNorth Carolina (Ayres & Bennett,
1983; Ayres, 1983). That studyrelated scores on the NationalTeacher Examination (NTE�) tothe average age and SAT scoresof the student body, the numberof hours of general educationrequired, the level of educationalattainment and salaries of thefaculty, the size of the library, andthe size of the institution. It foundthat TEI characteristics were quiteimportant, explaining 88 percentof the variation in NTE scores.However, a reanalysis of the datafound that only the educationalattainment of the faculty hada statistically significant effecton NTE scores (Pascarella &Terenzini, 1991). In addition tothe Ayres and Bennett work, a fewstudies found a specific teachereducation program to have animpact on its graduates, but thesestudies have consisted of no morethan 300 teacher candidates andcannot compare the influence ofthe institution under study to theinfluence of other institutions withother characteristics.
However, while little is knownabout the links between TEIcharacteristics and teacher effec-tiveness, a great deal is knownabout the characteristics of TEIsthemselves, as well as of the stu-dents attending them. This body ofresearch is generally referred to asresearch on the “teaching pipeline.”
The “teaching pipeline” is theseries of steps through whichcollege students become teachers.For the most typical students,these steps include entry into ateacher education program, com-pletion of course requirements
in the program, engaging instudent teaching with facultysupervision, passing an exit orlicensing examination, and beinginducted as a teacher. Manystudents deviate from this processin various ways, however. Forinstance, one alternate routeinvolves entering a teachereducation program at the post-baccalaureate level after havinggraduated from college and evenhaving worked for a few years inanother occupation. Anotheralternate route is not to enter ateacher education program at all,and instead engage in studentteaching and receive professionaldevelopment in professionalknowledge during the periodof induction.
A surprisingly large proportionof college students experiencesome aspect of the teacher pipe-line. According to a study by theNational Center for EducationStatistics (NCES, 2000), four yearsafter college 36 percent of allgraduates reported having engagedin student teaching, havingreceived some form of teachercertification, or having consideredteaching. One-third of thesestudents, or 13 percent of collegegraduates, had taught within thefirst four years out of college. Thekinds of students who chose thepipeline is a subject of somecontroversy. Academically, thosewho plan on entering teachingenter college with lower SAT andACT scores. However, a recentstudy shows that the SAT andACT scores of prospective teachersvary widely, depending on what
14
they plan to teach (Gitomer,Latham, & Ziomek, 1999).Although the SAT and ACT scoresof prospective elementary schoolteachers are lower than those ofthe average college graduate, thoseof prospective teachers takinglicensure tests in specific subjectareas (e.g., mathematics or science)are equal to or above those of theaverage college graduate. Further,as students progress through thepipeline, lower achieving teachingcandidates are weeded out; pro-spective teachers who passedentrance examinations for teachereducation programs and thosewho passed licensure examinationshad higher college entranceexamination scores than theircounterparts who failed these tests.Other studies have shown thatthose entering the teaching pipe-line are more likely to be femaleand less likely to be Asian Ameri-cans (NCES, 2000).
Research also reveals greatdiversity in the routes candidatespursue toward becoming teachers.According to one study (NCES,1997), 139,000 teachers were hiredin 1993–1994; of these, just 42percent were both fresh out ofcollege and had never taughtbefore. The alternate route of apostbaccalaureate teaching programis experienced by a substantialnumber of teachers; of the 200,000teaching candidates attending TEIsin 1998, 28 percent were enrolledat this level (Feistritzer, 1999).Also, many teaching candidates donot major in education; of the200,000, 29 percent of thoseplanning to enter elementary
education were not majoring ineducation, and 49 percent of thoseplanning to enter secondary educa-tion were not doing so (Feistritzer,1999). Substantial numbers ofprospective teachers do not enrollin teacher education programsat all; of college graduates whoentered the pipeline, 7 percent wereteaching four years out of collegebut had not been involved inteacher education (NCES, 2000).Compared to all other collegegraduates who entered the pipeline,these “unprepared” teachers werefrom high-achieving rather thanlow-achieving backgrounds. Theyhad higher SAT and ACT scores,were more likely to have obtaineda masters degree, were more likelyto have been enrolled in a privatedoctorate-granting institution, andwere more likely to aspire to adoctoral degree.
Various studies of prospectiveteachers reveal great uniformity intheir demographic characteristics(Zimpher & Sherrill, 1996;Goodlad, 1990; Feistritzer, 1999).They are overwhelmingly female(80%), White (80%) and frommiddle- or high-income families(85%). In addition, most prospec-tive teachers enroll in teachereducation full time (87%) and areyoung, less than 25 years old (87%).
The faculty of teacher educa-tion programs evince somewhatdifferent characteristics. They, too,are overwhelmingly White (92%),but, compared to the students, agreater percentage are male. Thetwo-thirds of the faculty that aretenured are predominantly male(80%), while nontenured faculty
are more than 50 percent female.Most faculty hold doctoral degrees(80%) and commit the bulk oftheir time (60% of it) to teaching.
The institutions that prospec-tive teachers attend vary in theircharacteristics (Feistritzer, 1999).Three-quarters of teaching candi-dates attend public institutions,whereas one-quarter attend privateinstitutions. Nearly half attendinstitutions with enrollments of10,000 or more students; one-quarter attend institutions of5,000 to 9,999 students; and one-quarter attend institutions of lessthan 5,000 students.
The teacher education pro-grams housed within these institu-tions vary in their characteristicsfor entry, their course require-ments, and their characteristics forexit (Feistritzer, 1999). One-halfof the students entering SCDEsare sophomores; one-third arejuniors, and the rest are seniors orfirst-year students. All SCDEsrequire a test of some kind forentry, and one-half require a basicskills test that has been approvedby the state. Other admissionsrequirements include a minimumGPA (required at 94% of theSCDEs), recommendations(required at 80% of the SCDEs),interviews (required to 65% of theSCDEs), and a minimum collegeentrance examination score(required at 33% of the SCDEs).Most SCDEs offer a four-yearprogram (78%). In addition,11 percent offer a five-year pro-gram. One-half offer programs atthe postbaccalaureate level. Atthe undergraduate level, course
15
requirements typically consist of51 to 52 credit hours of generalstudies, 36 to 39 hours in themajor, 24 to 31 hours of profes-sional knowledge and 14 to 16hours of student teaching. Theserequirements add up to morecredit hours than are typicallyestablished for other students; theaverage undergraduate takes 120hours, prospective secondaryteachers take 129 hours, andprospective elementary schoolteachers take 134 hours of course-work. Student-teaching require-ments vary widely from SCDE toSCDE, with 40 percent requiringat least a semester and 60 percentrequiring less than a semester.One-half of SCDEs have studentsteach under the supervision of oneteacher in a single school; one-third have students under thesupervision of various teachers atvarious schools. Finally, almost allSCDEs require an exit or licensuretest (up from just 5% in 1983).The nature of the test, however,varies widely among SCDEs.
From this pastiche of TEIsfrom various studies over the lastdecade, some crucial points emerge.First, students and faculty possessfairly uniform demographics. Bothare predominantly White and atleast middle class. The students arepredominantly female whereas thefaculty are predominantly male,but this may change as the over-whelmingly male senior faculty arereplaced by the predominantlyfemale junior faculty. Also, stu-dents are predominantly of aconventional type; most attendcollege full-time and are less than
25 years old. Second, the bulk ofTEIs are large public colleges anduniversities; however, there aresubstantial numbers of private andsmaller institutions that provideteacher education. Finally, therequirements associated withSCDEs are substantial. Mostrequire entrance and exit examina-tions, and their course require-ments are greater than those forother college students.
Yet much still remainsunknown about the SCDEs andthe institutions in which they arehoused. Little is known about thesize of SCDEs relative to theoverall institution; still less isknown about the relationshipbetween SCDEs and their sur-rounding communities. And, asthis review of prior research hasrevealed, almost nothing is knownabout how the various characteris-tics of institutions and SCDEsdescribed here relate to actualoutcomes among teachers. Thisstudy will present informationabout the link between TEIcharacteristics and teacher effec-tiveness. But before doing so, it isworthwhile to use informationfrom this study to elaborate on thedescription of TEIs and SCDEsfound in the research on theteaching pipeline.
16
CHAPTER THREE:A PORTRAIT OF
EDUCATION SCHOOLS
AND THEIR STUDENTS
While prior research reveals a greatdeal about the character andvariety of TEIs, much remainsunknown. This chapter examinesthe characteristics of TEIs, thestudents who attend them, and theSCDEs housed within them. TEIscan be characterized as one ofseven types: small public colleges,small public universities, smallprivate colleges, small privateuniversities, large public colleges,large public universities, and largeprivate universities (too fewstudents attend large privatecolleges to consider this as aseparate type). As a first look at thecentral question of this study, thelink between TEIs and outcomesfor prospective teachers, prospec-tive teachers’ scores on licensureexaminations will be comparedamong the seven institutions; thenother characteristics of the pro-spective teachers, including theirdemographics and their scores onexaminations for entering SCDEs,will be compared. Then, theSCDEs will be characterized interms of four issues: (1) the scopeof SCDEs in relation to theircorresponding TEIs; (2) the extentto which prospective teachers are
more or less traditional than theTEI student body; (3) the extentto which the SCDE focuses onissues in the local school district;and (4) the extent of ethnic diver-sity among the faculty. While thesefour issues are hardly exhaustive ofwhat needs to be known aboutSCDEs, they all play a significantrole in policy and research discus-sions of teacher education.
Compiling information on allof these characteristics of SCDEsand TEIs for the same set ofstudents involved gathering datafrom several sources. The core ofthe resulting data base consisted ofdata from the Teaching and Learn-ing Program of ETS (TLP), whichadministers The Praxis Series� ofteacher assessments. These assess-ments include Praxis I, an exami-nation for entrance into an SCDE,and Praxis II, a licensure examina-tion. Praxis II is currently used as alicensing requirement in 34 states.Because Praxis II is most com-monly used as a requirement in theSoutheast, this region was selectedfor study. The 400,000 prospectiveteachers who took Praxis between1994 and 1997 in this region wereidentified. From these a sample ofapproximately 40,000 students wasselected.2 For each of these pro-spective teachers, the TLP database provided scores on Praxis IIassessments, as well as backgroundinformation that test takers
provided when they registered forthe examination. This informationincluded parents’ education levelsand the prospective teacher’sethnicity. Praxis I scores were alsoavailable for nearly 10,000 students.
The registration materials alsoasked test takers to indicate theTEI that they had attended,making it possible to link informa-tion about test takers to informa-tion about their institutions.Institutional information wascollected from the IntegratedPostsecondary Educational DataSystem (IPEDS), a databasemaintained by the United StatesDepartment of Education. BecauseIPEDS contains information onevery college and university in theU.S., it was possible to gatherinformation on all of the 152institutions attended by the40,000 prospective teachers inTLP. The information collected inthis way included whether theinstitution was public or private,the number of students enrolled,and the percentage of studentswho were undergraduates.
Knowing the TEI for thestudents also made it possible tocollect information on theirSCDEs. Unfortunately, there is nopre-existing national data base thatincludes information on the issuesregarding SCDEs discussed above.It was therefore necessary to sendquestionnaires to the deans of
2 The sample was generated by stratifying the population by attendance at a Historically Black College or University and attendance at otherinstitutions. All prospective teachers from Historically Black Colleges and Universities were included; from the remainder, a random sample of anequivalent number of prospective teachers was selected.
17
3 The SCDEs that responded to the survey were housed in institutions that differed to some extent in their characteristics. The TEIs of respondingSCDEs were larger than the other TEIs, for instance. However, a propensity score analysis was conducted to measure the influence of nonresponseon the study’s findings, and found no significant change in results.
4 All comparisons discussed in the text were statistically significant.
5 While the core battery was the major set of tests given at the time of this data collection (1994–1997), it has since been phased out by ETS and itsclients.
education in the 152 institutionsunder study. One-half of the deansof education responded, represent-ing 66 percent of the 40,000students in the study. From theseresponses, it was possible to deriveinformation about the scope ofSCDEs, the extent to whichprospective teachers were tradi-tional students, the degree of localinvolvement, and faculty diversity.3
Finally, it was deemed useful toknown more about the test perfor-mance of prospective teachers priorto entering an SCDE. While PraxisI scores provided some of thisinformation, it was also possible toobtain SAT scores for a large groupof prospective teachers. This wasaccomplished by linking the SocialSecurity numbers in TLP to SocialSecurity numbers in a data basecontaining all SAT scores from1989 through 1996. This proce-dure resulted in 9,078 scores onboth the verbal and mathematicssections of the SAT. Thus theresulting data base consisted of thescores of the 40,000 students onPraxis II, their background charac-teristics, and some characteristicsof their TEIs. In addition, infor-mation on SCDEs was obtainedfor two-thirds of the students andeither SAT or Praxis I scores fortwo-fifths of the students.
Seven types of TEIs wereidentified based on whether they
were public or private, the num-bers of students enrolled, and thepercentage who were undergradu-ates. Institutions with more than10,000 students were deemedlarge, and those with less than10,000 deemed small; institutionswhere more than 10 percent of thestudent body consisted of graduatestudents were deemed universities,and the rest were deemed colleges.And public institutions weredistinguished from private ones.Of the eight possible categories,large private colleges were notincluded in the comparisonsbecause too few students attendedprivate institutions with enroll-ments of more than 10,000 stu-dents, less than 10 percent ofwhom were graduate students.
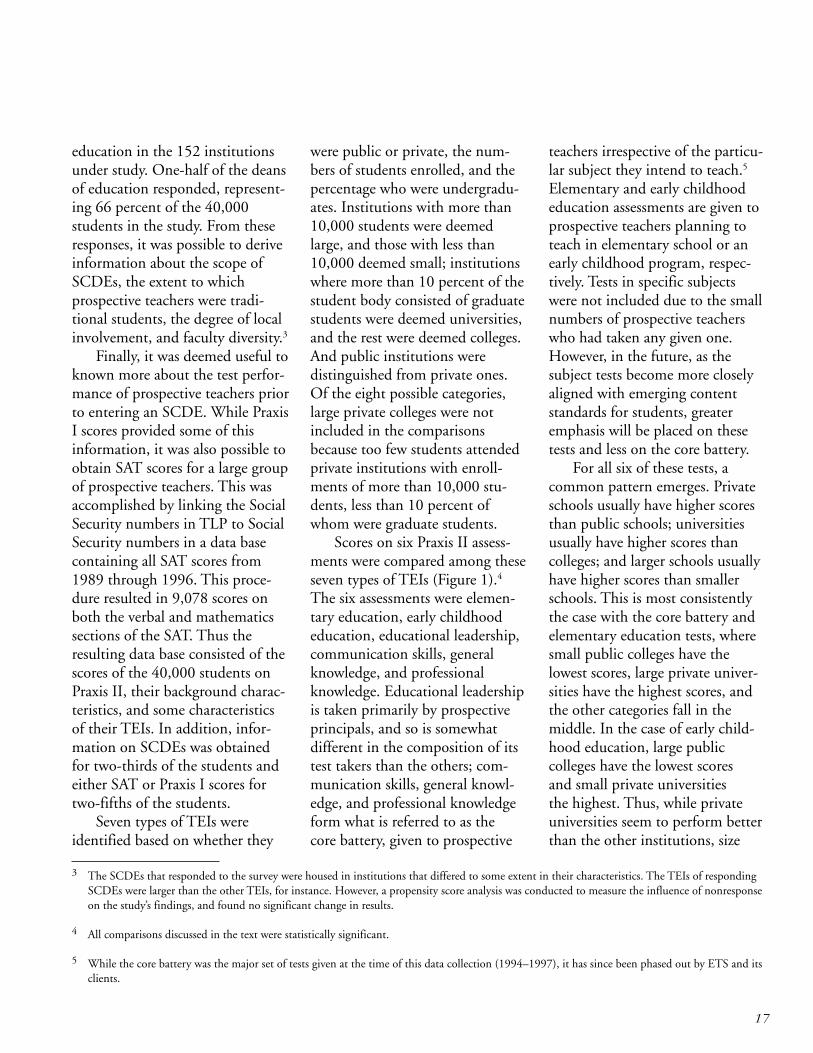
Scores on six Praxis II assess-ments were compared among theseseven types of TEIs (Figure 1).4
The six assessments were elemen-tary education, early childhoodeducation, educational leadership,communication skills, generalknowledge, and professionalknowledge. Educational leadershipis taken primarily by prospectiveprincipals, and so is somewhatdifferent in the composition of itstest takers than the others; com-munication skills, general knowl-edge, and professional knowledgeform what is referred to as thecore battery, given to prospective
teachers irrespective of the particu-lar subject they intend to teach.5
Elementary and early childhoodeducation assessments are given toprospective teachers planning toteach in elementary school or anearly childhood program, respec-tively. Tests in specific subjectswere not included due to the smallnumbers of prospective teacherswho had taken any given one.However, in the future, as thesubject tests become more closelyaligned with emerging contentstandards for students, greateremphasis will be placed on thesetests and less on the core battery.
For all six of these tests, acommon pattern emerges. Privateschools usually have higher scoresthan public schools; universitiesusually have higher scores thancolleges; and larger schools usuallyhave higher scores than smallerschools. This is most consistentlythe case with the core battery andelementary education tests, wheresmall public colleges have thelowest scores, large private univer-sities have the highest scores, andthe other categories fall in themiddle. In the case of early child-hood education, large publiccolleges have the lowest scoresand small private universitiesthe highest. Thus, while privateuniversities seem to perform betterthan the other institutions, size
18
Figure 1Average Praxis II Scores for Teacher Candidates, by Type of Institution
Praxis II - Elementary Education
Small public colleges
Small public universities
Small private colleges
Small private universities
Large public colleges
Large public universities
Large private universities
250 550 600 650 950
593
629
613
637
642
635
649
Scale Score
Praxis II - Early Childhood Education
250 550 600 650 990
623
629
628
660
620
645
656
Small public colleges
Small public universities
Small private colleges
Small private universities
Large public colleges
Large public universities
Large private universities
Scale Score
Praxis II - Educational Leadership
250 550 600 650 950
650
606
623
663
670
663
688
Small public colleges
Small public universities
Small private colleges
Small private universities
Large public colleges
Large public universities
Large private universities
Scale Score
Praxis II - Communication Skills
600 645 650 655 660 665 695
646
657
657
659
656
656
662
Small public colleges
Small public universities
Small private colleges
Small private universities
Large public colleges
Large public universities
Large private universities
Scale Score
Praxis II- General Knowledge
600 645 650 655 660 665 695
642
654
653
656
653
653
660
Small public colleges
Small public universities
Small private colleges
Small private universities
Large public colleges
Large public universities
Large private universities
Scale Score
Praxis II - Professional Knowledge
600 645 650 655 660 665 695
651
654
655
659
659
656
661
Small public colleges
Small public universities
Small private colleges
Small private universities
Large public colleges
Large public universities
Large private universities
Scale Score
Source: Tabulated by author from database of Teaching and Learning Program of ETS.
19
does not seem to be as important afactor, with smaller schools oftendoing better than larger ones.Results for the educational leader-ship test also appear to be differ-ent, not surprising given the test’sdistinct pool of test takers.Whilelarge private universities remainthe high scorers, small publiccolleges, large public colleges, andlarge public universities also havequite high scores; small publicuniversities and small privatecolleges have the lowest scores.
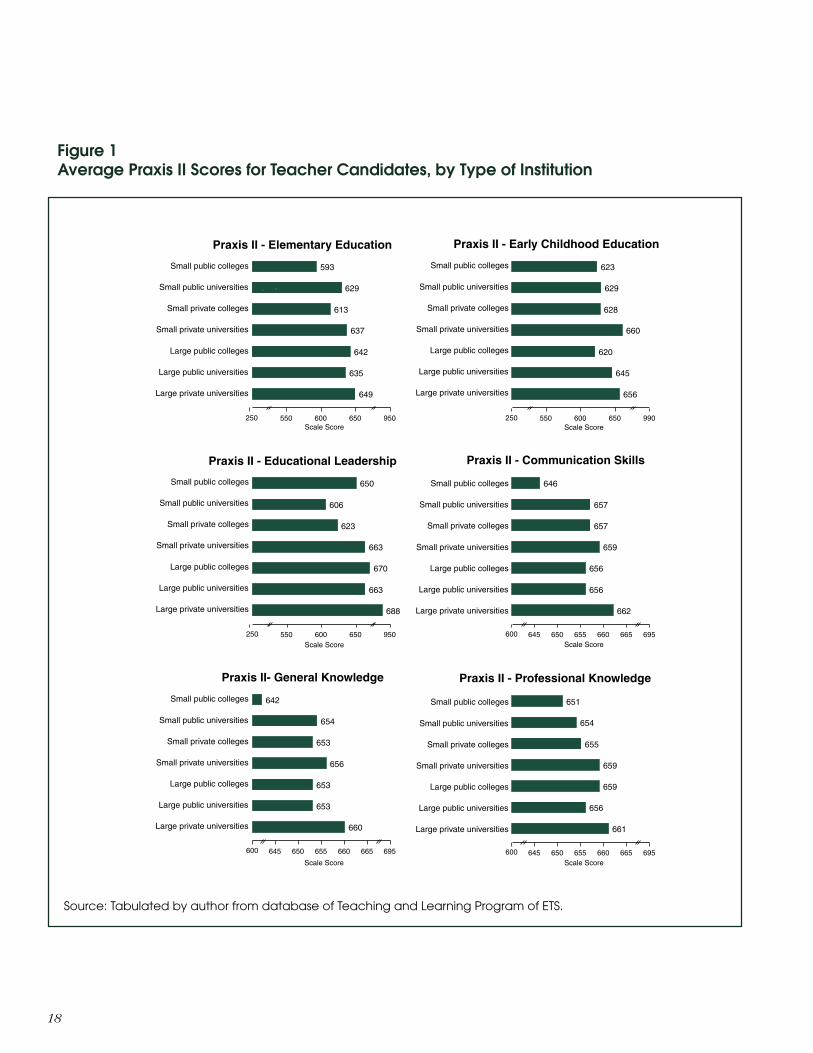
Although institutions seemto differ greatly in their scores onPraxis II, these differences maynot have anything to do with thepolicies, programs, or practicesof the institutions; it may be thatprospective teachers at higherperforming institutions werehigher achievers before they evenentered those institutions. Thispossibility can be examined bycomparing the characteristics ofstudents at the seven types ofinstitution prior to entering college(Figure 2). Indeed, it appears thatmore-advantaged students attendinstitutions that are larger, private,and enroll a larger percentage ofgraduate students. The SAT scoresand the level of the mother’seducation are highest at largeprivate universities and lowest atsmall public colleges. Father’seducation is also generally higherat universities than at colleges, andat private than at public institu-tions (size is less important in this
case). The ethnicity of the studentbody, however, does not conformto this pattern; small publiccolleges seem to have the largestpercentage of African Americanstudents (51%), but large privateuniversities have a larger percent-age than do large public collegesor universities or small privateuniversities. Thus, the size of theschool, whether it is public orprivate, and the percentage ofundergraduates are less importantin this case.
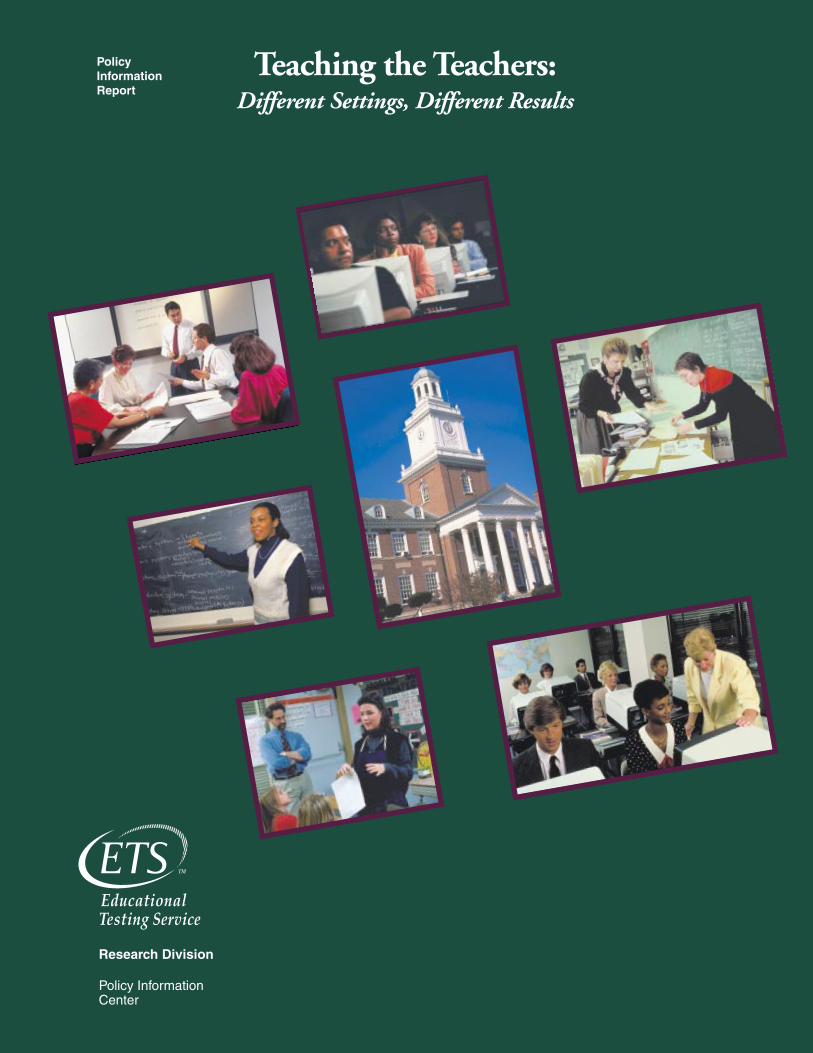
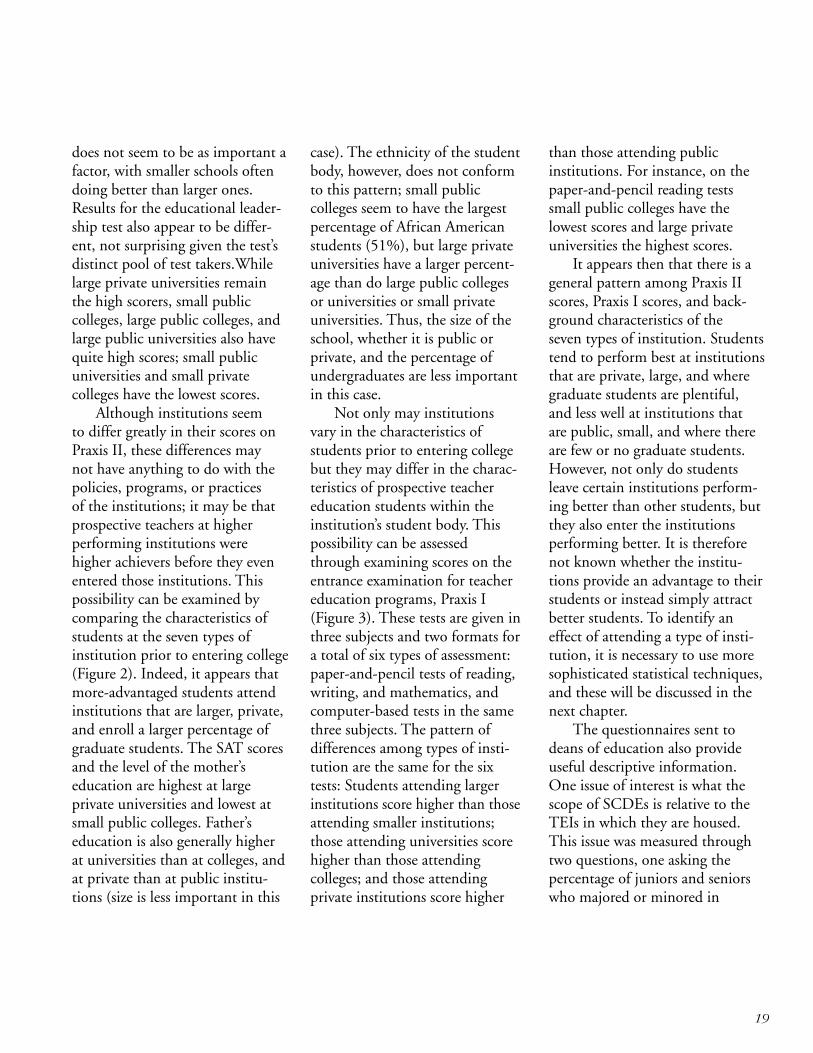
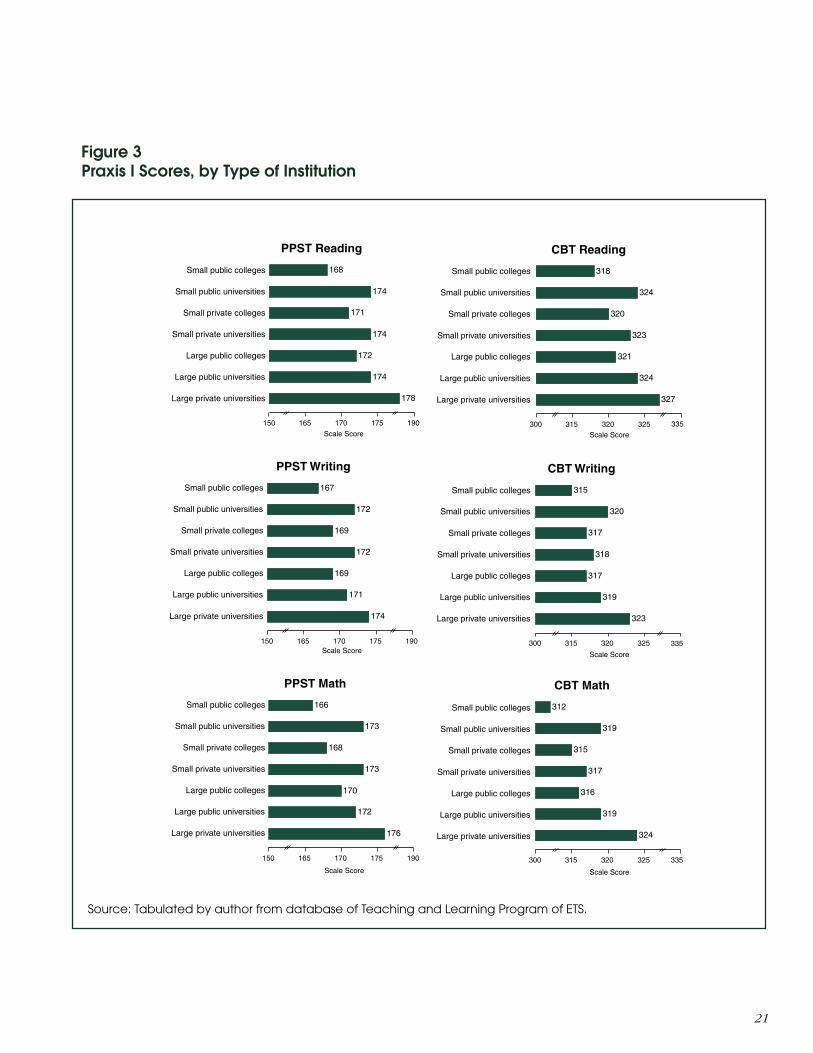
Not only may institutionsvary in the characteristics ofstudents prior to entering collegebut they may differ in the charac-teristics of prospective teachereducation students within theinstitution’s student body. Thispossibility can be assessedthrough examining scores on theentrance examination for teachereducation programs, Praxis I(Figure 3). These tests are given inthree subjects and two formats fora total of six types of assessment:paper-and-pencil tests of reading,writing, and mathematics, andcomputer-based tests in the samethree subjects. The pattern ofdifferences among types of insti-tution are the same for the sixtests: Students attending largerinstitutions score higher than thoseattending smaller institutions;those attending universities scorehigher than those attendingcolleges; and those attendingprivate institutions score higher
than those attending publicinstitutions. For instance, on thepaper-and-pencil reading testssmall public colleges have thelowest scores and large privateuniversities the highest scores.
It appears then that there is ageneral pattern among Praxis IIscores, Praxis I scores, and back-ground characteristics of theseven types of institution. Studentstend to perform best at institutionsthat are private, large, and wheregraduate students are plentiful,and less well at institutions thatare public, small, and where thereare few or no graduate students.However, not only do studentsleave certain institutions perform-ing better than other students, butthey also enter the institutionsperforming better. It is thereforenot known whether the institu-tions provide an advantage to theirstudents or instead simply attractbetter students. To identify aneffect of attending a type of insti-tution, it is necessary to use moresophisticated statistical techniques,and these will be discussed in thenext chapter.
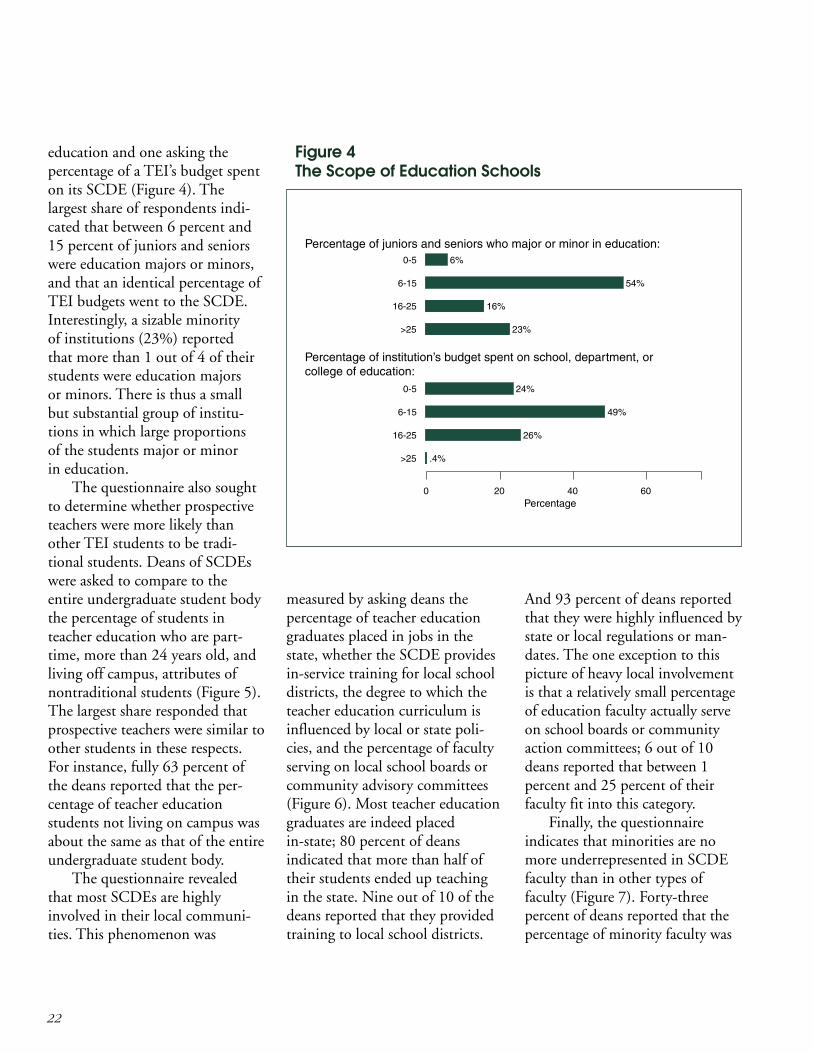
The questionnaires sent todeans of education also provideuseful descriptive information.One issue of interest is what thescope of SCDEs is relative to theTEIs in which they are housed.This issue was measured throughtwo questions, one asking thepercentage of juniors and seniorswho majored or minored in
20
Figure 2Background Characteristics of Teacher Candidates, by Type of Institution
Father’s Education
1 2 3 4 5 6 7
3.2
3.7
3.4
3.6
2.9
3.3
4.4
Small public colleges
Small public universities
Small private colleges
Small private universities
Large public colleges
Large public universities
Large private universities
Som
e hi
gh s
choo
l
Hig
h sc
hool
dip
lom
a
Som
e co
llege
Ass
ocia
te d
egre
e
Bac
helo
r’s d
egre
e
Som
e gr
adua
te s
choo
l
Gra
duat
e/pr
ofes
sion
al d
egre
e
Mother’s Education
1 2 3 4 5 6 7
3.1
3.9
3.6
4
3.2
3.6
5
Small public colleges
Small public universities
Small private colleges
Small private universities
Large public colleges
Large public universities
Large private universities
Som
e hi
gh s
choo
l
Hig
h sc
hool
dip
lom
a
Som
e co
llege
Ass
ocia
te d
egre
e
Bac
helo
r’s d
egre
e
Som
e gr
adua
te s
choo
l
Gra
duat
e/pr
ofes
sion
al d
egre
e
Percentage of Black Students
0 20 40 60
51
28
24
7
14
9
21
Small public colleges
Small public universities
Small private colleges
Small private universities
Large public colleges
Large public universities
Large private universities
Percentage
SAT - Verbal
200 450 500 550 800
447
505
479
526
493
503
557
Small public colleges
Small public universities
Small private colleges
Small private universities
Large public colleges
Large public universities
Large private universities
SAT Verbal Score
SAT - Math
200 450 500 550 800
460
530
499
542
502
510
576
Small public colleges
Small public universities
Small private colleges
Small private universities
Large public colleges
Large public universities
Large private universities
SAT Math Score
Source: Tabulated by author from databases of Teaching Learning Program and School and College ServicesProgram of ETS.
21
PPST Reading
150 165 170 175 190
168
174
171
174
172
174
178
Small public colleges
Small public universities
Small private colleges
Small private universities
Large public colleges
Large public universities
Large private universities
Scale Score
PPST Writing
150 165 170 175 190
167
172
169
172
169
171
174
Small public colleges
Small public universities
Small private colleges
Small private universities
Large public colleges
Large public universities
Large private universities
Scale Score
PPST Math
150 165 170 175 190
166
173
168
173
170
172
176
Small public colleges
Small public universities
Small private colleges
Small private universities
Large public colleges
Large public universities
Large private universities
Scale Score
CBT Reading
300 315 320 325 335
318
324
320
323
321
324
327
Small public colleges
Small public universities
Small private colleges
Small private universities
Large public colleges
Large public universities
Large private universities
Scale Score
CBT Writing
300 315 320 325 335
315
320
317
318
317
319
323
Small public colleges
Small public universities
Small private colleges
Small private universities
Large public colleges
Large public universities
Large private universities
Scale Score
CBT Math
300 315 320 325 335
312
319
315
317
316
319
324
Small public colleges
Small public universities
Small private colleges
Small private universities
Large public colleges
Large public universities
Large private universities
Scale Score
Figure 3Praxis I Scores, by Type of Institution
Source: Tabulated by author from database of Teaching and Learning Program of ETS.
22
Figure 4The Scope of Education Schools
0-5
6-15
16-25
>25
0-5
6-15
16-25
>25
6%
54%
16%
23%
24%
49%
26%
.4%
Percentage of juniors and seniors who major or minor in education:
0 20 40 60Percentage
Percentage of institution’s budget spent on school, department, orcollege of education:
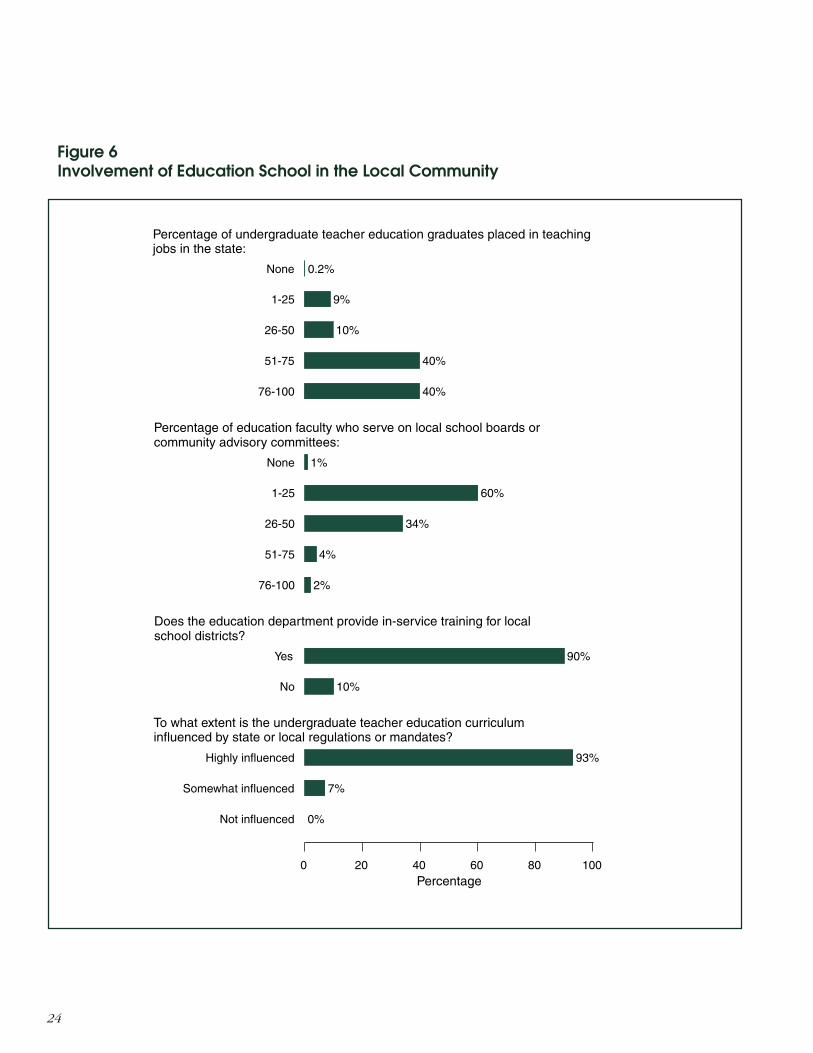
measured by asking deans thepercentage of teacher educationgraduates placed in jobs in thestate, whether the SCDE providesin-service training for local schooldistricts, the degree to which theteacher education curriculum isinfluenced by local or state poli-cies, and the percentage of facultyserving on local school boards orcommunity advisory committees(Figure 6). Most teacher educationgraduates are indeed placedin-state; 80 percent of deansindicated that more than half oftheir students ended up teachingin the state. Nine out of 10 of thedeans reported that they providedtraining to local school districts.
And 93 percent of deans reportedthat they were highly influenced bystate or local regulations or man-dates. The one exception to thispicture of heavy local involvementis that a relatively small percentageof education faculty actually serveon school boards or communityaction committees; 6 out of 10deans reported that between 1percent and 25 percent of theirfaculty fit into this category.
Finally, the questionnaireindicates that minorities are nomore underrepresented in SCDEfaculty than in other types offaculty (Figure 7). Forty-threepercent of deans reported that thepercentage of minority faculty was
education and one asking thepercentage of a TEI’s budget spenton its SCDE (Figure 4). Thelargest share of respondents indi-cated that between 6 percent and15 percent of juniors and seniorswere education majors or minors,and that an identical percentage ofTEI budgets went to the SCDE.Interestingly, a sizable minorityof institutions (23%) reportedthat more than 1 out of 4 of theirstudents were education majorsor minors. There is thus a smallbut substantial group of institu-tions in which large proportionsof the students major or minorin education.
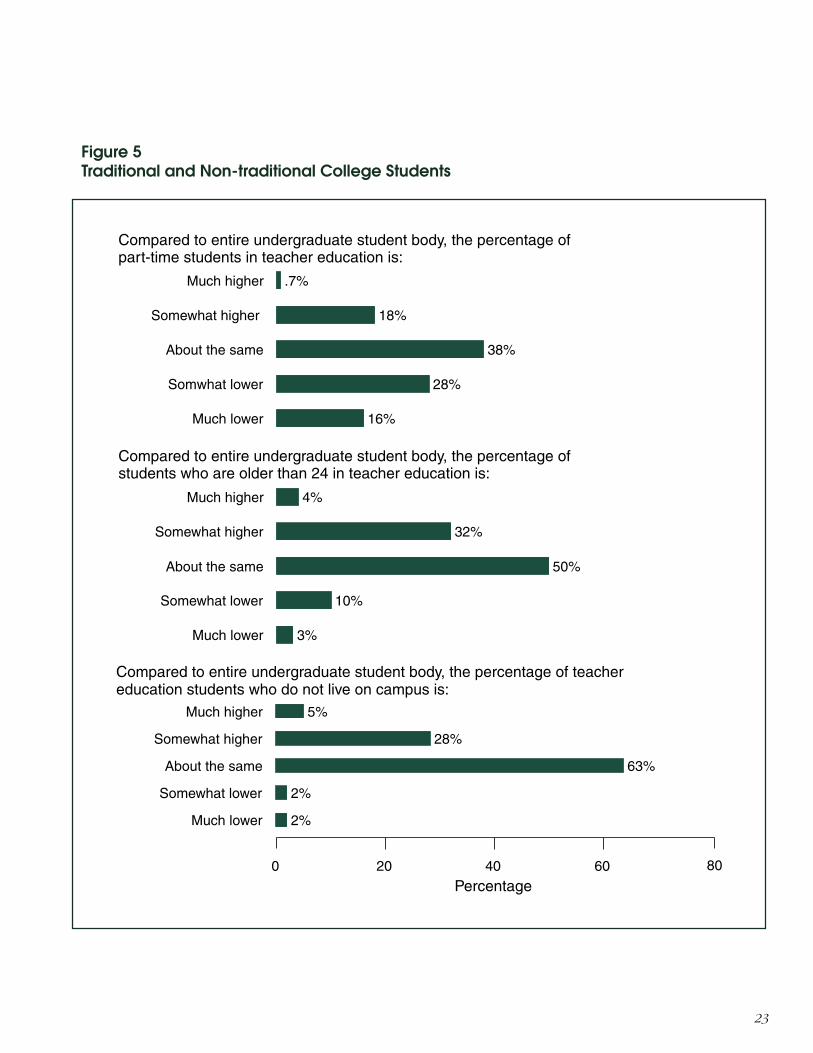
The questionnaire also soughtto determine whether prospectiveteachers were more likely thanother TEI students to be tradi-tional students. Deans of SCDEswere asked to compare to theentire undergraduate student bodythe percentage of students inteacher education who are part-time, more than 24 years old, andliving off campus, attributes ofnontraditional students (Figure 5).The largest share responded thatprospective teachers were similar toother students in these respects.For instance, fully 63 percent ofthe deans reported that the per-centage of teacher educationstudents not living on campus wasabout the same as that of the entireundergraduate student body.
The questionnaire revealedthat most SCDEs are highlyinvolved in their local communi-ties. This phenomenon was
23
Much higher
Somewhat higher
About the same
Somwhat lower
Much lower
Much higher
Somewhat higher
About the same
Somewhat lower
Much lower
0 20 40 60
.7%
18%
38%
28%
16%
4%
32%
50%
10%
3%
Compared to entire undergraduate student body, the percentage ofpart-time students in teacher education is:
Compared to entire undergraduate student body, the percentage ofstudents who are older than 24 in teacher education is:
Percentage
Much higher
Somewhat higher
About the same
Somewhat lower
Much lower
5%
28%
63%
2%
2%
Compared to entire undergraduate student body, the percentage of teachereducation students who do not live on campus is:
80
Figure 5Traditional and Non-traditional College Students
24
None
1-25
26-50
51-75
76-100
None
1-25
26-50
51-75
76-100
Yes
No
Highly influenced
Somewhat influenced
Not influenced
0 20 40 60 80 100
0.2%
9%
10%
40%
40%
1%
60%
34%
4%
2%
90%
10%
93%
7%
0%
Percentage of undergraduate teacher education graduates placed in teachingjobs in the state:
Percentage
Percentage of education faculty who serve on local school boards orcommunity advisory committees:
Does the education department provide in-service training for localschool districts?
To what extent is the undergraduate teacher education curriculuminfluenced by state or local regulations or mandates?
Figure 6Involvement of Education School in the Local Community
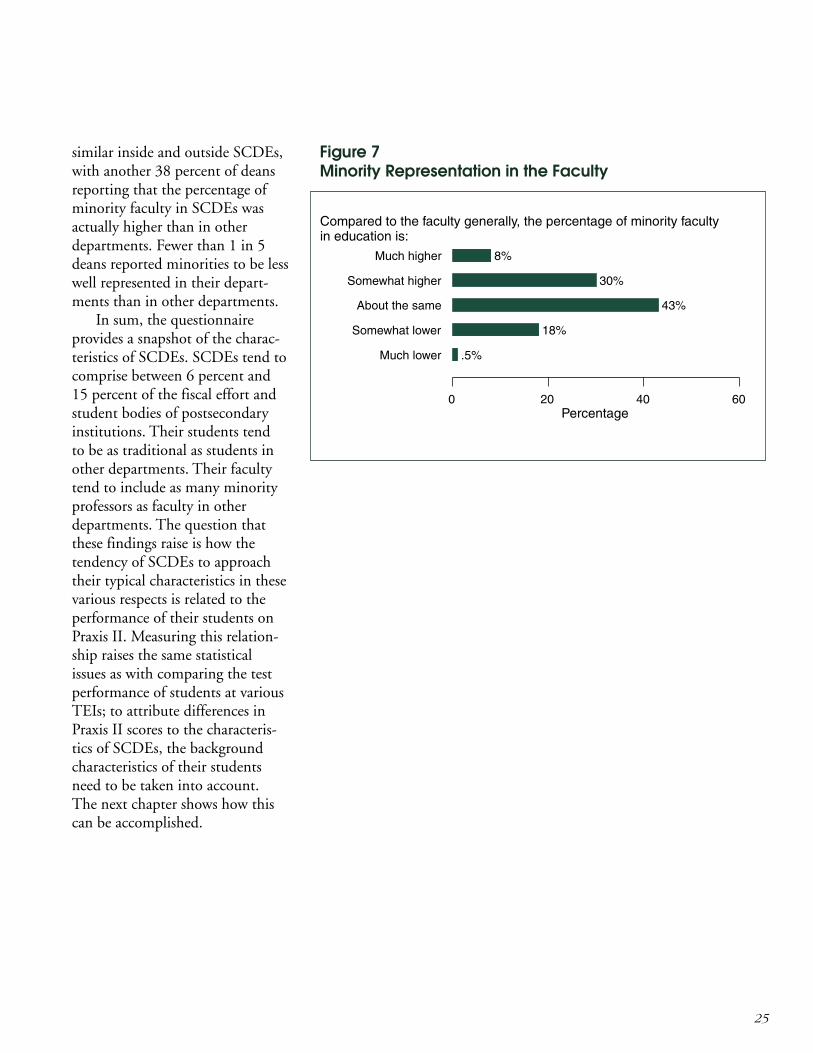
25
similar inside and outside SCDEs,with another 38 percent of deansreporting that the percentage ofminority faculty in SCDEs wasactually higher than in otherdepartments. Fewer than 1 in 5deans reported minorities to be lesswell represented in their depart-ments than in other departments.
In sum, the questionnaireprovides a snapshot of the charac-teristics of SCDEs. SCDEs tend tocomprise between 6 percent and15 percent of the fiscal effort andstudent bodies of postsecondaryinstitutions. Their students tendto be as traditional as students inother departments. Their facultytend to include as many minorityprofessors as faculty in otherdepartments. The question thatthese findings raise is how thetendency of SCDEs to approachtheir typical characteristics in thesevarious respects is related to theperformance of their students onPraxis II. Measuring this relation-ship raises the same statisticalissues as with comparing the testperformance of students at variousTEIs; to attribute differences inPraxis II scores to the characteris-tics of SCDEs, the backgroundcharacteristics of their studentsneed to be taken into account.The next chapter shows how thiscan be accomplished.
Much higher
Somewhat higher
About the same
Somewhat lower
Much lower
0 20 40 60
8%
30%
43%
18%
.5%
Percentage
Compared to the faculty generally, the percentage of minority facultyin education is:
Figure 7Minority Representation in the Faculty
26
CHAPTER FOUR:
HOW CHARACTER-
ISTICS OF EDUCATION
SCHOOLS ARE RELATED
TO LICENSURE
EXAMINATION SCORES
Linking characteristics of TEIs andSCDEs to Praxis II scores raises ahost of methodological issues.These include the need to takeinto account the possible influenceof the background characteristicsof prospective teachers on testperformance; the need to use large-scale data; the multistep nature ofthe teacher preparation process;the need to deal with multiplemeasures of the phenomenon ofinterest; and the multilevel natureof school effects. Fortunately, astatistical technique known asmultilevel structural equationmodeling (MSEM) can addresseach of these issues. An explana-tion of these problems and theproposed solutions follows.
To accurately gauge the impactof school characteristics on licen-sure test results, it is necessary todisentangle the impact of schoolsfrom the impact of studentsattending them. To some degree,the average licensure score of a TEIreflects the caliber of students whoentered the institution in the firstplace; more selective institutionsprobably generate higher scores,purely by virtue of the capabilitiesof their students. Measuring theimpact of an institution on
licensure scores really meansmeasuring the value added by theinstitution above and beyond thebackground characteristics of itsstudents. The data to be analyzedhere need to include studentbackground characteristics, and thestatistical techniques need to takeinto account the influence of thesecharacteristics in isolating theinfluence of school characteristics.
It is also important that databe large-scale in nature. This studyrequires sufficient numbers ofstudents to capture the variety ofbackgrounds that might influencetest scores; there need to be suffi-cient numbers of schools to distin-guish between the impact ofdifferent school characteristics,such as between the size of a schooland the percentage of its studentswho are undergraduates, and thereneed to be sufficient numbers ofstates to ensure that the results arenot idiosyncratic to the policyenvironment of a particular state.
Further, the method pursuedin this study needs to develop aflow chart of influences on PraxisII scores. The links between TEIs,SCDEs, and Praxis II scorespresumably involve a multistepprocess. Not only do TEI andSCDE characteristics influencePraxis II scores, but, presumably,they influence one another. Cer-tain TEIs are probably more likelyto have certain types of SCDEhoused within them. An innova-tive TEI may directly influencelicensure scores, or it may makethe SCDE more innovative, whichin turn may lead to better scores.
Also, the background characteris-tics of students may influence theirchoice of a TEI; perhaps moreaffluent students are more likely toattend the more effective TEIs.Thus, the method for this studyneeds to specify how backgroundcharacteristics of students influencethe type of TEI attended, whichthen influences the type of SCDEand, ultimately, test performance.
Studies of this nature also haveto be able to handle multiplemeasures of the phenomenon ofinterest; to use only a single mea-sure of the phenomenon will makeit highly subject to error. Forinstance, local involvement ismeasured through four question-naire items, namely responsivenessto state and local mandates,in-service training for schooldistricts, placing graduates in jobsin-state, and faculty participationon school boards. Using just one ofthese items rather than all fourmight tap into some phenomenonother than local involvement, thusproducing misleading results. Ifresponsiveness to state and localmandates was used by itself andfound to have a positive impact ontest scores, this relationship couldbe attributable to local involve-ment, but could just as easily beattributable to the content ofthese mandates. Thus, themethod for this study needs totake into account multiple mea-sures in trying to characterize agiven phenomenon.
Finally, this study needs to takeinto account the multilevel natureof its data. The study is attempting
27
to link a characteristic of students,their licensure scores, to character-istics of institutions that areaggregations of students. Thismixture of students and schoolsraises many thorny methodologicalissues. For instance, there are 152institutions and 40,000 students.Is the size of the sample 152 or40,000? Addressing this issuerequires the use of statistical tech-niques that are sensitive to themultilevel nature of the data.
Fortunately, these problemscan be addressed by applying thetechnique of multilevel structuralequation modeling (MSEM) to thedata base discussed above. Thedata include measures of studentbackground, and MSEM can takethese measures into account inmeasuring the impact of schoolcharacteristics on Praxis II scores.The data are large-scale, with40,000 students from 152 schoolsin most Southeastern states.MSEM develops flow charts of thestudent characteristics, schoolcharacteristics, and test scores; itincorporates multiple measures forthe phenomena of interest; and ittakes into account the multilevelnature of the data.6
Using MSEM, this studymeasured relationships among TEIcharacteristics, SCDE characteris-tics, and Praxis II scores in threesteps. First, TEI characteristics
6 The models are similar to most structural equation models (SEMs) in that they combine path and measurement models. Factor models constructvariables representing the phenomena of interest from a series of measures in the observed data. The path models then relate these constructs toone another. These models differ from standard SEMs, however, in that they are multilevel. The covariance matrix is partitioned into between- andwithin-school components. Then the between-school matrix is used to gauge school effects. For full a discussion of MSEM, see Muthen (1994).Two software packages were used for this analysis, AMOS 3.6 and STREAMS 1.8. For a discussion of the software, see Gustafsson & Stahl (1997).
experiences (measured fromwhether students lived on campus,were enrolled full-time, and wereaged 24 or less); the scope of theSCDE (measured from the per-centage of students who majoredor minored in education and thepercentage of the institution’sbudget devoted to the SCDE);and whether there were more orless minority faculty in the SCDEthan in the institution as a whole.Praxis II scores and the back-ground characteristics of studentswere measured as in the first step.Finally, TEI characteristics wererelated to SCDE characteristics toassess the likelihood that certaintypes of TEI would have certaintypes of SCDE associated withthem. The 66 percent subsamplewas again used here, and the samemeasures of student background,TEI characteristics, and SCDEcharacteristics were used.
The first step, relating TEIcharacteristics to Praxis II scores,reveals that two of the threecharacteristics have an impact(Figure 8; see also Appendix,Table 1). The figure shows theimpact of the three TEI character-istics and the two student back-ground characteristics on licensurescores. The numbers should beunderstood as measuring theimpact of each characteristicrelative to the others; the higher
were related to Praxis II scores,taking into account studentbackground. The TEI characteris-tics used were whether the schoolwas public or private, its size, andthe percentage of students whowere undergraduates. The studentbackground characteristics usedhere were prior test performance,as measured from the multiplemeasures of SAT verbal scores,SAT mathematics scores, andscores on the six Praxis I assess-ments; and socioeconomic status,as measured from the educationallevels of the mother and father.A composite Praxis II score wasgenerated from the six assessmentsdescribed in the preceding chapter.Second, SCDE characteristics wererelated to Praxis II scores. Sinceonly 66 percent of the prospectiveteachers attended SCDEs whosedeans responded to the question-naire of SCDE characteristics, thismodel drew on only those 26,000students (although, as mentionedearlier, statistical analyses indicatedthat the results would have beensimilar with all 40,000 students).The SCDE characteristics usedhere were local involvement(measured from in-state jobplacements, responsiveness to stateand local regulations, facultyparticipation in school boards,and in-service training of localschool districts); traditional college
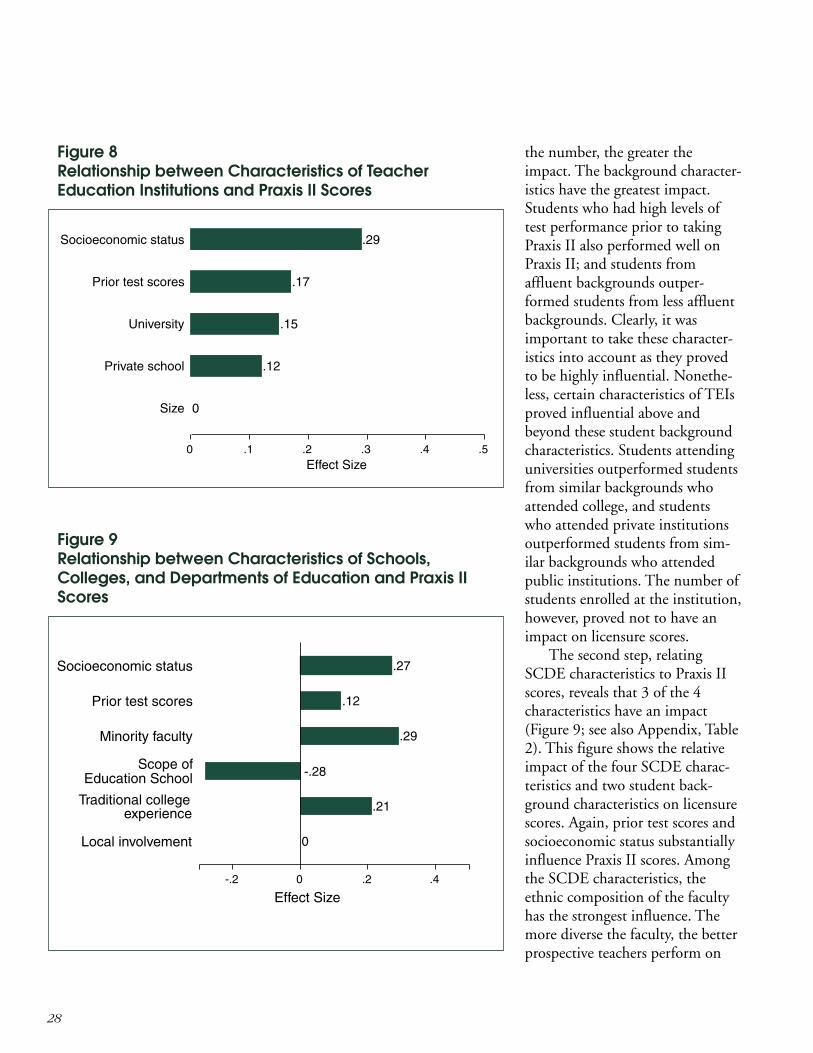
28
Socioeconomic status
Prior test scores
University
Private school
Size
0 .1 .2 .3 .4 .5
.29
.17
.15
.12
0
Effect Size
Socioeconomic status
Prior test scores
Minority faculty
Local involvement
-.2 0 .2 .4
.27
.12
.29
-.28
.21
0
Scope ofEducation School
Traditional collegeexperience
Effect Size
the number, the greater theimpact. The background character-istics have the greatest impact.Students who had high levels oftest performance prior to takingPraxis II also performed well onPraxis II; and students fromaffluent backgrounds outper-formed students from less affluentbackgrounds. Clearly, it wasimportant to take these character-istics into account as they provedto be highly influential. Nonethe-less, certain characteristics of TEIsproved influential above andbeyond these student backgroundcharacteristics. Students attendinguniversities outperformed studentsfrom similar backgrounds whoattended college, and studentswho attended private institutionsoutperformed students from sim-ilar backgrounds who attendedpublic institutions. The number ofstudents enrolled at the institution,however, proved not to have animpact on licensure scores.
The second step, relatingSCDE characteristics to Praxis IIscores, reveals that 3 of the 4characteristics have an impact(Figure 9; see also Appendix, Table2). This figure shows the relativeimpact of the four SCDE charac-teristics and two student back-ground characteristics on licensurescores. Again, prior test scores andsocioeconomic status substantiallyinfluence Praxis II scores. Amongthe SCDE characteristics, theethnic composition of the facultyhas the strongest influence. Themore diverse the faculty, the betterprospective teachers perform on
Figure 8Relationship between Characteristics of TeacherEducation Institutions and Praxis II Scores
Figure 9Relationship between Characteristics of Schools,Colleges, and Departments of Education and Praxis IIScores
29
their licensure tests. The traditionalcollege experience also appears tohave a positive effect on Praxis IIscores; students enrolled in SCDEswith predominantly traditionalstudents outperform their counter-parts in SCDEs with predomi-nantly nontraditional students.Interestingly, the greater the scopeof the SCDE, the lower the licen-sure scores of its teacher candidates.Local involvement proved unre-lated to Praxis II scores.
The third step, relating TEIcharacteristics to SCDE character-istics, reveals substantial inequitiesin access to effective SCDE andTEI characteristics. Back in thefirst step, which had related TEIcharacteristics to Praxis II scores,the tendency of students fromvarious social backgrounds toattend institutions with those TEIcharacteristics was also measured(Appendix, Table 1). It found thatmore affluent students were morelikely to attend private institutionsand universities, precisely theinstitutions most conducive tohigh licensure scores. The thirdstep, linking TEI characteristics toSCDE characteristics, found asimilar phenomenon occurring(Appendix, Table 3). Affluentstudents were more likely to beexposed to diverse faculty andengage in traditional collegeexperiences. While this model
found no link between TEI charac-teristics and the SCDE characteris-tics of faculty diversity and tradi-tional college experiences, it didfind links to the scope of SCDEs.Private and smaller institutionstended to have smaller scopes totheir SCDEs, a practice conduciveto higher licensure scores. Sinceprivate and smaller institutionswere more likely to be attended byaffluent students, affluent studentswould thus also have greater accessto SCDEs of small scope. Thus, inall cases, more affluent studentshad a greater chance to be exposedto the TEI and SCDE characteris-tics most conducive to high PraxisII scores.
In summary, it appears thattwo characteristics of TEIs andthree of SCDEs have an impact onlicensure tests. Private institutionsoutperform public ones; universi-ties outperform colleges; SCDEswith diverse faculty outperformthose that are overwhelminglyWhite; SCDEs with predomi-nantly traditional students outper-form those with fewer traditionalstudents; and SCDEs that are arelatively small part of the overallinstitution outperform those thatare a large part. In addition, thethree steps in the analysis revealdifferences in exposure to thesecharacteristics, based on theeconomic resources of the
students; affluent students aremore likely to attend TEIs andSCDEs with these characteristics.And this is the case even takinginto account prior test perfor-mance, meaning that for twostudents of similar ability, the moreaffluent one will attend the moreeffective institution and SCDE.
These results are rich withimplications for the policy debateson teacher education and itsimpact on teacher quality. Beforeturning to these policy implica-tions, however, it is worthwhile tonote some shortcomings of thisstudy and suggest directions forfurther research.

30
CHAPTER FIVE:IMPLICATIONS FOR
EDUCATIONAL POLICY
AND FUTURE
RESEARCH
While this study breaks newground in linking TEI and SCDEcharacteristics to Praxis II scoresfor a large sample of prospectiveteachers and institutions, muchremains to be done. First, anational study of the impact ofteacher education needs to beundertaken. Because this studyrelied on Praxis II scores as ameasure of teacher effectiveness, itfocused on prospective teachersfrom the region of the countrywhere Praxis II has been mostwidely administered, namely theSoutheast. Thus generalizationsfrom this study are limited to thatregion. To generalize to TEIsoutside of the Southeast willrequire collecting data that repre-sent the entire United States,which means not only collectinginformation on the characteristicsof TEIs and SCDEs from aroundthe country, but also findingmeasures of teacher effectivenessthat are available in all regions.7
Second, better measures ofteacher effectiveness need to be
used. The Praxis II scores used hererepresent some of the knowledgepossessed by prospective teachers.Yet this knowledge may notnecessarily translate into effectiveclassroom practices. It would bebetter to measure teacher effective-ness either from an evaluation ofthe classroom practices of estab-lished teachers, or the impact ofthose practices on students, par-ticularly their academic perfor-mance. For instance, it wouldbe important to identify linksbetween TEIs and scores on PraxisIII, which does assess classroompractices, as well as to measure theimpact of Praxis II scores on thetest performance of K-12 students.Even within the realm of Praxis IIassessments, the current study doesnot utilize scores on subject-specific tests such as biology ormathematics. As the pool ofprospective teachers who havetaken these tests grows, the linkbetween scores on them and TEIand SCDE characteristics shouldbe studied.
Third, more detailed informa-tion about SCDEs needs to becollected and related to teachereffectiveness. The current studychose a few important issues inSCDEs about which to collectdata. But many issues remain,such as the use of technology,
mentoring of student teachers, andthe content of particular profes-sional knowledge courses. Any ofthese may also have an impact onteacher effectiveness, and thisimpact should be gauged. Further,information about SCDEs mayexplain the mechanisms underly-ing this study’s findings. Forinstance, additional informationmight explain why traditionalcollege students perform better onPraxis II.
Fourth, richer measures ofstudent background need to becollected. This study included SATscores, a measure of precollegeability, for about a quarter of theprospective teachers. Subsequentresearch should increase thepercentage of students withprecollege scores by collectingACT scores.8 Further, the measuresof socioeconomic status used here,mother’s and father’s education,should be supplemented withinformation about the parents’occupations, income, and posses-sions in the home. It would alsobe worthwhile to study the impactof gender, ethnicity, and theprimary language in the homeon Praxis II scores.
Finally, it needs to be under-stood that the findings presentedhere regarding the effectiveness ofcertain institutions and programs
7 The differences between the demographics of the Southeast and the U.S. as a whole are not substantial, which makes drawing some inferencesfrom this region legitimate. For instance, the Southeast is 51.3% female, as opposed to 51.1% for the U.S. as a whole, and it is 68% White asopposed to 73% for the U.S. as a whole. There are substantial differences in SAT scores between the Southeast and other regions of the country,but these may be attributable to the relatively small numbers of students taking the SAT in the Southeast (Data from Nettles & Perna, 1997).
8 It should be noted that the same results were obtained for all three steps of the analysis, regardless of whether SAT scores were included, suggestingthat missing precollege measures for three-quarters of the students was adequately addressed through their scores on Praxis I.
31
are based on a relative rather thanan absolute definition of effective-ness. When a characteristic of aninstitution or program is identifiedas “effective” in this study, itsimply means that prospectiveteachers exposed to this character-istic score higher on the Praxis IIexaminations than those notexposed to it. Just because theseprospective teachers are scoringhigher than others does not neces-sarily mean that they are scoringhigh enough to make them effec-tive teachers and thus make itpossible to conclude that theinstitution is producing effectiveteachers. Drawing such a conclu-sion would require scoring testresults in a manner that distin-guished effective teachers fromineffective ones according to someexternal criterion. In the absenceof such an external criterion, it isnonetheless legitimate to infer thatbecause certain teachers are scoringhigher than others, their corre-sponding institutions are moreeffective than others. It is thuspossible to learn from this studywhat makes some institutionsbetter than others, but not whetherany of them meet an absolutestandard of goodness.
With these issues kept inmind, the central conclusion of thestudy is that the effectiveness ofTEIs in preparing teachers variesgreatly. Some policymakers, suchas the signers of the Thomas B.Fordham Foundation Manifesto,contend that TEIs are largelyineffective. Others, such as themembers of the National
Commission on Teaching andAmerica’s Future, contend thatTEIs are largely effective. Thisresearch suggests that the reality issomewhere in the middle. Someinstitutions are more effective thanothers, and the most effective onesrepresent a substantial minority ofinstitutions. Private institutionsseem to be more effective thanpublic ones. Yet these privateinstitutions represent neither a fewexceptional cases, as opponents ofTEIs might think, nor are theytypical, as supporters of TEIsmight think. Rather, they representabout one-fourth of institutionsnationwide. Similarly, universitiesseem to be more effective thancolleges, and universities tooconstitute a substantial minority ofinstitutions. Thus effective TEIsare neither a few deviant cases norare they the norm.
The fact that TEIs are neitheruniformly effective nor ineffectivehas implications for using theseinstitutions to improve teacherquality. Critics of TEIs, becausethey view these institutions largelyas failures, propose reducing theirscope as much as possible. In theirview, policymakers should encour-age alternate certification, wherebyprospective teachers need notattend such institutions at all, andhave to meet only the most mini-mal requirements for a license.Supporters, because they viewthese institutions as largely success-ful, propose increasing their scopeas much as possible. In this view,TEIs should increase courserequirements, moving from
four-year to five-year programs.And prospective teachers shouldnot be able to evade these require-ments, either by pursuing alternatecertification or by attendinginstitutions that lack rigorousrequirements. The only appropri-ate alternative to certificationby an undergraduate teachereducation program is certificationby the same program at thepostbaccalaureate level; and insti-tutions that lack rigorous require-ments should simply be closed.But if TEIs are neither uniformlyeffective nor uniformly ineffective,the strategy for improving thembecomes much different. Theeffective institutions can providemodels of good practice, andineffective institutions can bereformed to conform to thispractice. Public institutions shouldemulate private ones, and collegesshould emulate universities. Thefact that so many TEIs are effectivemakes this reform strategy emi-nently feasible. Ineffective TEIswill not be pursuing utopianvisions of teacher educationattainable in only the most idealcircumstances; rather, they willseek to learn from their neighbor-ing institutions, which educate thesame pool of prospective teachersto better effect.
The findings regarding thecharacteristics of effective SCDEsmake it possible to identify someof the practices that should beemulated by ineffective institu-tions. First, in keeping with theview of the critics that professionalknowledge is overvalued and
32
content knowledge is undervalued,this study finds that the scope ofSCDEs can have a negative impacton teacher effectiveness. Institu-tions with larger percentages ofeducation majors and more moneyspent on SCDEs actually performless well than those with fewereducation majors and less moneyspent on SCDEs. This findingsuggests that the role of SCDEs inpreparing teachers should besomewhat limited. Assuming thatprofessional knowledge courses aretaught primarily in SCDEs, thisfinding implies that teacher candi-dates should have less exposure toprofessional knowledge and moreexposure to content knowledge.This finding holds true for bothelementary and secondary teachers,as students going into both typesof teaching were included in thesample, and the Praxis II testsincluded elementary education aswell as the core battery.9 Second, inkeeping with the view of support-ers that TEIs are the key site forteacher preparation, this studyfinds that prospective teachersperform better on Praxis II exami-nations when they receive a tradi-tional college experience. Havingolder students taking a few highlyfocused courses, the streamlinedapproach touted by TEI critics,seems to be less successful thanhaving college-age students live oncampus and take a complete
academic program full-time. Thisis not to say that policymakersshould turn their backs on pro-spective teachers who, because oftheir age and experience, are notappropriate for college-basedteacher preparation; but for thosewho are appropriate, college-basedteacher preparation can producemore effective teachers thanother sites.
Various findings also have abearing on the issue of equitableaccess to high-quality teacherpreparation, an issue not suffi-ciently touched upon by support-ers and critics of TEIs alike. Thestudy found that affluent studentshave greater access to effectiveTEIs and SCDEs than do studentsfrom less advantaged backgrounds.It is the affluent prospectiveteachers who can afford privateinstitutions and universities, andcan afford the full college experi-ence, including living on campusand being enrolled full-time. Andit is the affluent students who aremore likely to attend institutionsthat limit the scope of SCDEs,increasing student exposure tothe academic disciplines. Lessadvantaged students are deprivedof these opportunities, and conse-quently are less well prepared to beteachers; some may not be able topass their licensure tests, and manythat do may not be ready to teacheffectively. The lower quality of
teacher preparation of lessadvantaged students is of majorconsequence for urban schoolsystems, because such systemsdisproportionately recruit teachersfrom such backgrounds. Thus thelearning gap for teachers is passedon as a learning gap for students.Disadvantaged urban students aremore likely to be taught by teach-ers who were systematicallyunderprepared by TEIs.
In conclusion, this studysuggests a reform strategy thatdraws elements from both critics’and supporters’ approaches. First,institutions of higher education areappropriate as sites for teacherpreparation. The fact that so manyof the institutions are effectivesuggests that it is not necessary togo elsewhere. Further, the studyshows that prospective teachersbenefit from a traditional collegeexperience. Second, TEIs need toplace greater emphasis on prepara-tion in content areas and less onpreparation in professional knowl-edge. While some professionalknowledge preparation is undoubt-edly necessary, this study discov-ered some institutions with morethan 25 percent of their studentswere either majoring or minoringin education. Students attendingthese institutions may just not haveenough exposure to the relevantcontent knowledge to be comfort-able with it in the classroom.
9 The finding could also be interpreted as meaning that students at institutions with large proportions of education majors and minors and whofinancial resources are largely committed to SCDEs have less access to rigorous courses taught by faculty in the departments of academic disci-plines, and that this lack of access lowers student performance on Praxis II.
33
Third, until all TEIs operate at ahigh level, policy-makers need tofacilitate greater access to high-quality TEIs for students from lessadvantaged backgrounds. Thiscould be accomplished throughscholarships or other incentives forlow-income students planning togo into teaching.
Finally, future reform effortsneed to be based on research thatlinks teacher preparation practicesto teacher effectiveness and otherdesired outcomes. All too often,policy prescriptions are producedwithout relying on such informa-tion. Many policymakers call forgreater attention to the inputs ofteacher education programs, suchas more money or licensingrequirements, without knowingmuch about the consequences ofthese inputs for outcomes, suchas teacher effectiveness. Otherpolicymakers call for greaterattention to the outputs of teachereducation programs, such asteacher effectiveness, but withoutconsidering the resources neededby TEIs to produce these outputs.Ideally, policymakers should beattentive to both inputs andoutputs and the links betweenthem. They should focus on thefact that the purpose of TEIs is toproduce the most effective teacherspossible, and then invest in thoseinputs that research demonstratesare systematically related to that
outcome. Failure to do so may leadpolicymakers down blind alleys,leaving our TEIs unreformed, andthus ill-equipped, to meet the keyeducational challenge of the 21stcentury: to prepare an adequatenumber of high-quality teachers.
34
REFERENCES
Ashton, P., & Crocker, L. (1987). Systematic study of planned variations: The essential focus of teacher education reform.Journal of Teacher Education, 38, 2–8.
Ayres, Q. W., & Bennett, R. W. (1983). University characteristics and student achievement. Journal of Higher Education,54(5), 516–532.
Ayres, Q. W. (1983). Student achievement and predominantly White and predominantly Black universities. AmericanEducational Research Journal, 20(2), 291–304.
Bradley, A. (1999). Critics’ study finds flaws in teacher exams. Education Week, 18(23), 3.
Byrne, C. J. (1983). Teacher knowledge and teacher effectiveness: A literature review, theoretical analysis and discussion ofresearch strategy. Paper presented at the meeting of the Northeastern Education Research Association.
Darling-Hammond, L. (1990). Teaching and knowledge: Policy issues posted by alternate certification for teachers.Peabody Journal of Education. 67 (3), 123–154.
Darling-Hammond, L. (2000). Teacher quality and student achievement: A review of state policy evidence. EducationPolicy Analysis Archives, 8(1), 1–50.
Druva, C. A., & Anderson, R. D. (1983). Science teacher characteristics by teacher behavior and by student outcome: Ameta-analysis of research. Journal of Research in Science Teaching, 20(5), 467–479.
Feistritzer, C. E. (1999). The making of a teacher: A report on teacher preparation in the U.S. Washington, D.C.: The Centerfor Education Information.
Gitomer, D. H., Latham, A. S., & Ziomek, R. (1999). The academic quality of prospective teachers: The impact of admissionsand licensure testing. Princeton, NJ: Educational Testing Service.
Goldhaber, D. D., & D.J. Brewer. (1999). Teacher licensing and student achievement. In M. Kanstoroom & C. Finn(Eds.), Better Teachers, Better Schools (pp. 83–102). Washington, D.C.: TBFF.
Goodlad, J. I. (1990). Teachers for Our Nation’s Schools. San Francisco: Jossey-Bass Publishers.
Gustafsson, J. E., & Stahl, P. A. (1997). STREAMS User’s Guide: Version 1.7. Molndal, Sweden: Multivariate Ware.
Kwiatowski, M. (1999). Debating alternative teacher certification: A trial by achievement. In M. Kanstoroom & C. Finn(Eds.) Better Teachers, Better Schools (pp. 215–238). Washington, D.C.: TBFF.
Monk, D. H. (1994). Subject matter preparation of secondary mathematics and science teachers and student achievement.Economics of Education Review, 13 (2), 125–145.
Muthen, B. (1994). Multilevel covariance structure analysis. Sociological Methods and Research, 22 (3), 399–420.
Natriello, G., Zumwalt, K., Hansen, A., & Frisch, A. (1990). Characteristics of entering teachers in New Jersey. Revisedversion of paper presented at the 1988 Annual Meeting of the American Educational Research Association.
35
NCES. (1997). America’s teachers: Profile of a profession, 1993–94. Washington, D.C.: U.S. Department of Education.
NCES. (2000). Progress through the pipeline: 1992–93 college graduates and elementary/secondary school teaching as of 1997.Washington, D.C.: U.S. Department of Education.
NCTAF. (1996). What matters most: Teaching for America’s future. New York: NCTAF.
Nettles, M., & Perna, L. (1997). The African American data book. (Volume 1). Washington, D.C.: Frederick D. PattersonResearch Institute.
Pascarella, E. T., & Terenzini, P. T. (1991). How college affects students: Findings and insights from twenty years of research.San Francisco: Jossey-Bass Publishers.
Smith, J. M. (1990). A comparative study of the state regulations for and the operation of the New Jersey Provisional TeacherCertification Program. Paper presented at the annual meeting of the American Educational Research Association.
TBFF. (1999). The teachers we need and how to get more of them. In M. Kanstoroom & C. Finn (Eds.), Better Teachers,Better Schools (pp. 1–18). Washington, D.C.: TBFF.
Zimpher, N. L., & Sherrill, J. A. (1996). Professions, teachers and leaders in SCDEs. In J. Sikula (Ed.), Handbook ofResearch on Teacher Education, Second Edition (pp. 279–305). New York: Simon and Schuster Macmillan.
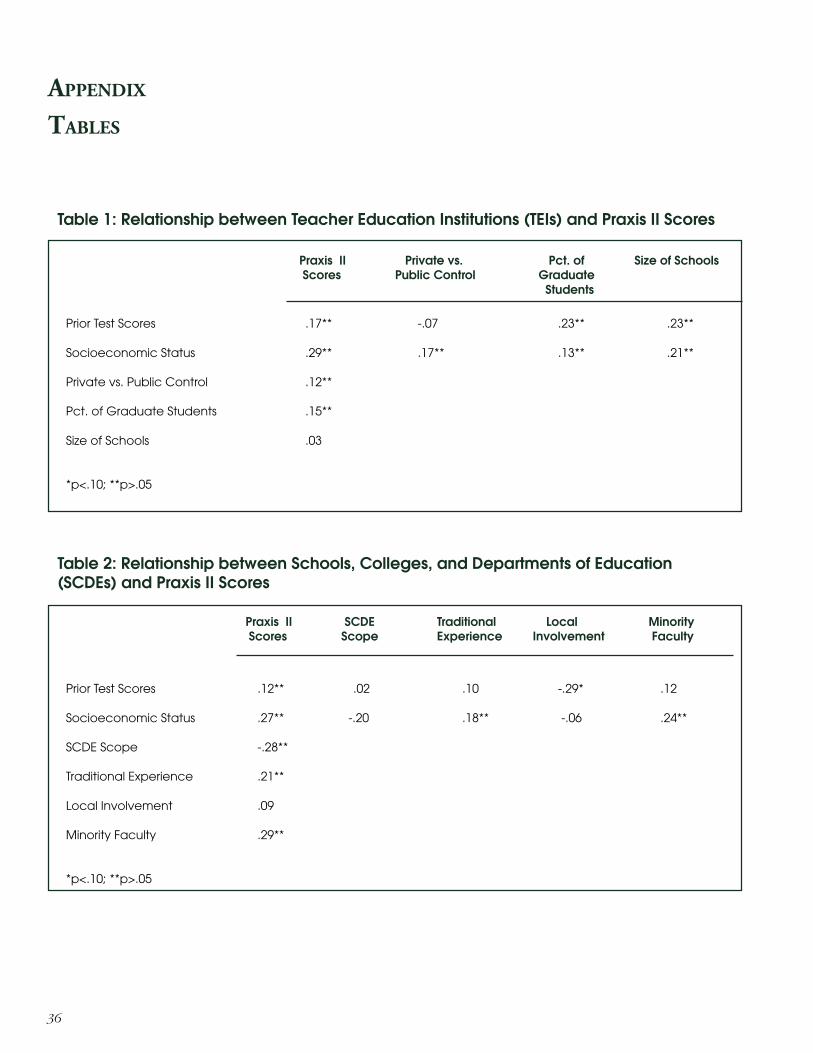
36
APPENDIX
TABLES
Table 1: Relationship between Teacher Education Institutions (TEIs) and Praxis II Scores
Praxis II Private vs. Pct. of Size of Schools Scores Public Control Graduate
Students
Prior Test Scores .17** -.07 .23** .23**
Socioeconomic Status .29** .17** .13** .21**
Private vs. Public Control .12**
Pct. of Graduate Students .15**
Size of Schools .03
*p<.10; **p>.05
Table 2: Relationship between Schools, Colleges, and Departments of Education(SCDEs) and Praxis II Scores
Praxis II SCDE Traditional Local Minority Scores Scope Experience Involvement Faculty
Prior Test Scores .12** .02 .10 -.29* .12
Socioeconomic Status .27** -.20 .18** -.06 .24**
SCDE Scope -.28**
Traditional Experience .21**
Local Involvement .09
Minority Faculty .29**
*p<.10; **p>.05
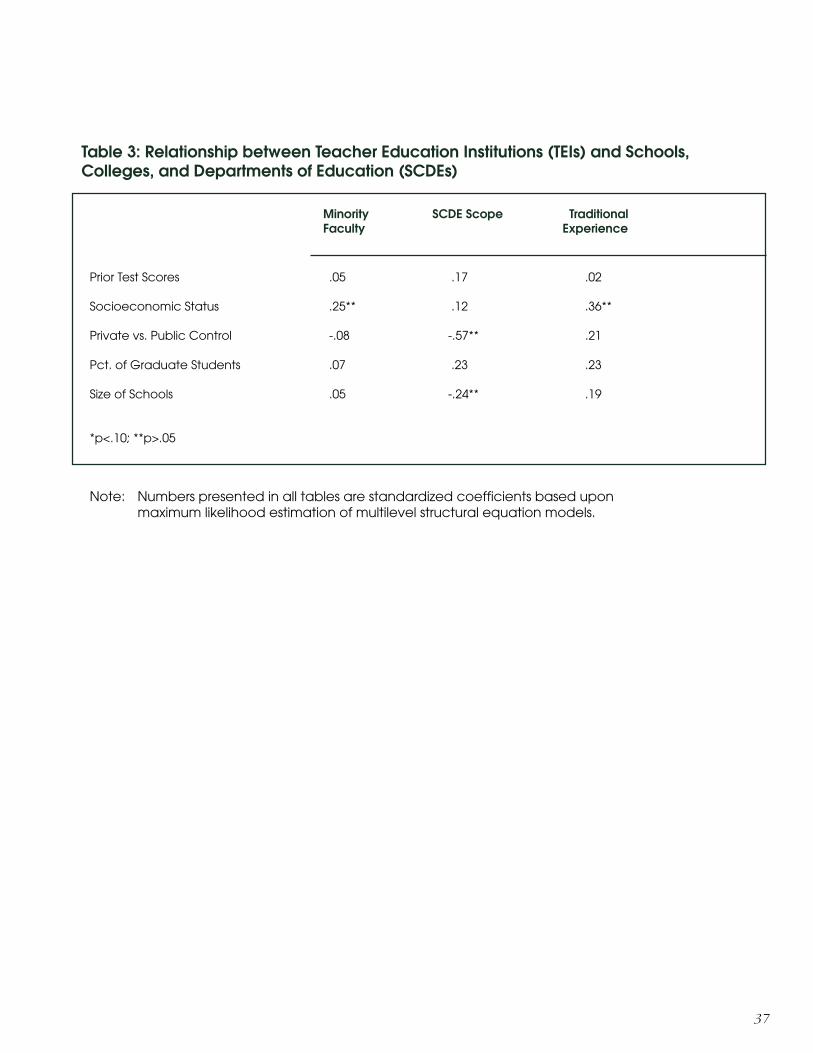
37
Table 3: Relationship between Teacher Education Institutions (TEIs) and Schools,Colleges, and Departments of Education (SCDEs)
Minority SCDE Scope TraditionalFaculty Experience
Prior Test Scores .05 .17 .02
Socioeconomic Status .25** .12 .36**
Private vs. Public Control -.08 -.57** .21
Pct. of Graduate Students .07 .23 .23
Size of Schools .05 -.24** .19
*p<.10; **p>.05
Note: Numbers presented in all tables are standardized coefficients based uponmaximum likelihood estimation of multilevel structural equation models.

88502-005444 • RR80M7
I.N. 988784