Embed Size (px)
Citation preview

TheFindingsofaSurveyon
PoliticalAttitudesofIranians
by
GAMAAN(TheGroupforAnalyzingandMeasuringAttitudesinIRAN)
Gamaan.org
AmmarMalekiAssistantProfessorofComparativePoliticsatTilburgUniversity,TheNetherlands
August2018

2
SummaryoftheSurvey
• Morethan19,000individualsparticipatedinthissurvey.Thissurveyrevealsthe
politicalattitudesof72%ofIranians,thosewhodidnotvoteforEbrahimRaisiinIran’s2017presidentialelection.ThesurveytriestosystematicallymeasureandcapturesomeofthepoliticalattitudesthatIranianscannotfreelyexpressinIran.
• Atleast70%ofIranianswouldvote“NO”toIslamicRepublicifafreereferendumweretobeheldtoday.
• Onthequestionofwhichpoliticalorientationtheymostidentifywith,37.8%saidthey would want the regime to be toppled (Overthrowers), 30.6% stated theywould seek radical changes (Transformists) while only 3.6% identified asReformistswhoemphasizeonpreservingthecurrentIslamicRepublicregime.
• On the question ofwhichpolitical system ismost appropriate for Iran, 42%ofIranians would favour a secular republic whereas 15% were proponents ofconstitutionalmonarchy.
• Atleast25%ofIranianswouldfavourtheestablishmentofafederalsystemforthefutureofIran,while33%saidthattheydonothaveenoughinformationtostateanopiniononwhetheraunitaryorfederalformofstatewouldbebetter.
• Amongst 17 figures renowned for political or civil rights activity, Reza Pahlavienjoysthehighestpopularitywith37.9%.HeisfollowedbyNasrinSotoudehwith8.1%,whereasMirHosseinMoussaviobtains4.6%popularity.
• Althoughalmost38%ofIranianswouldgiveachancetoRezaPahlavi,only15%ofIranianswouldfavouraconstitutionalmonarchy.ItcouldbededucedthatsupportforRezaPahlavidoesnotnecessarilytranslateforsupportformonarchy.
• 43%ofthosewhovotedforRouhaniin2017presidentialelectionwouldconsider
themselves as Overthrowers (seeking regime change); 50% of them areTransformists(seekingradicalchangesandafreereferendum).Only7%ofthemidentified as Reformists (i.e., preserving the Islamic Republic). Based on thesefindings it is important to realize thatvoting forRouhani cannotnecessarilybetranslatedtoaYesvotetoIslamicRepublicregime.
• Onthequestionof(symbolic)politicalpartiesinafreeelection,amonarchistpartywouldgarner20.1%ofthevotes.Asocialdemocraticpartywouldreceive16.3%whereasJebheyehMelli(TheNationalFront)wouldget8.3%ofthevotes.ItseemsthatnosinglepartyorpoliticalideologyenjoysthemajorityamongstIranians.

3
PartOne:CharacteristicsoftheSampleandtheResearchMethodology
1-1Characteristicsofthesurveyandrawstatisticalsample
• Thesurveyof “PoliticalAttitudesof Iranians”hasbeenconductedonlinebyGAMAAN (TheGroup forAnalyzing andMeasuringAttitudes in IRAN) for aperiodofaweekfromApril24thtoApril30thof2018,using“SurveyMonkey”whichisasecureandreliableplatformforconductingonlinesurveys.Forthissurveythe“VirtualSnowballSampling”waspickedasthesamplingmethodonsocial networks (Telegram, Instagram, Twitter, and Facebook), and 19,386individuals participated. The survey was conducted before the nationwidefilteringofTelegraminIran;therefore,thegovernment-imposedfilterdidnothaveanyeffectontheresults.
• According to the topmanager of Telegram, around 40million Iranians use
Telegram within the country. More than 41 million have access to mobileInternetandcloseto57millionhaveaccesstotheInternet.Inotherwords,ahuge part of the Iranian population can be reached using different onlinemeans.
• Thesurveyincludes21questions.Thelast7questionsweregeneralquestions
(Region,Age,Education,Economicstatus,GenderandMaritalstatus)
• Inaverage,ittook5minutestoanswerallthequestions. • All participantswere completely anonymouswhich helped them to express
theirbeliefs/preferencessecurelyandwithoutfears.
• 88%ofparticipantspickedIranastheircountryofresidence.Usingthevaliditychecks(throughcheckingtheIP locationof therespondents),wefoundthatabout6%oftherespondentsmightprovideafalselocationwhichcannotaffecttheoverallresults.
• Eachparticipant could onlyparticipate once fromeach computer ormobile
device. Our analyses show that less than 2% of participants seem to haveparticipated in thesurveymorethanonce.However,giventhe largesamplesize,thisfigurehasanegligibleimpactontheoverallresults.
• Participants from inside Iran were from all 31 provinces while overseas
participantslivedin69differentcountries. 1-2Preparationprocessofthefinalstatisticalsample • Among all the questions, one question was designed to filter out all random
answersaswellasbotactivities.Inaddition,anyconflictinganswerresultedinthe

4
eliminationoftheparticipant(likethosewhoclaimedtheyhadnotyetreachedthevotingagein2013,butthattheyhadvotedin2009).
• The main goal of this survey was to identify the ‘non-conservative’ or ‘non-
fundamentalist’politicalattitudesoftheIranianpopulation,i.e.thesegmentoftheIraniansocietythatneithervotesforconservativecandidates,ornorparticipatesintheelectionsatall.Asamatteroffact,untilnow,thepoliticalattitudesoftheaforementionedsegmentoftheIraniansociety,whichconstitutesmorethan70%ofthepopulation,hasbeenlargelyunderstudiedandunaccountedfor.Theinitialassumptionwasthatthissurveywouldbe less likelytoreachsupportersoftheconservatives,oreveniftheyweretoseethesurvey,theywouldmostprobablynot take part in it. Nevertheless, the survey and the questions were designedwithout any biases andwere aimed to be inclusive of all political inclinations,includingconservatives.
• Theinitialassumptionwithregardstothetargetedpopulationisconfirmedbythe
dataobtainedintheoutcomeofthesurvey.Theanswertothefirstquestion(whodidyouvotefor inthe2017presidentialelection?)showsthatabout2%oftheparticipantsvotedforEbrahimRaisi,whileonthebasisofthe"officialresults"ofthe election, about 28% of the voteswere for Raisi. The results of the secondquestion(Whodidyouvoteforinthe2013presidentialelection?)alsoindicatethat about 4% of the respondents voted for conservative candidates (Jalili,Velayati,Ghalibaf,andRezaei),whilethe“officialresults”oftheelectionshowthatthecombinedvoteshareof the fourcandidates in theelectionwas32%.Theseresults confirm our initial hypothesis that conservatives (including some whovotedfortheconservativesduetoeconomicmotivations)didnotparticipate inthissurvey.Accordingly,wewithdrewsampledatarepresentingthosewhovotedfor Ebrahim Raisi in the 2017 presidential election, because of the lowparticipationrateoftheconservativesocialbaseinthissurvey.Thisapproachisinlinewiththesurvey'smainpurpose,which is toanalyzetheweightofdifferentpolitical orientations amongst "non-conservative" citizens. The report's targetpopulation,therefore,isthe72%oftheIranianpopulationwhodidnotvoteforRaisiinthe2017presidentialelection.
• After some refinements, the final sample size for the respondents inside the
countryis15,972.Also,thesamplesizeusedfortheparticipantslivingabroadis2,267.
• Inthisreport,wherevertheterm"statisticalsample"isused,itmeanstherefined
sampleandnotthe"rawsample"ofthesurvey.Ingeneral, thestatisticalsampleofonlinesurveys isusuallynotcompletelyconsistentwith the characteristics of the target population. Therefore, to have a representativesample,aweightingmethodisusedtobalancethestatisticalsampleandtomatchitwiththemaincharacteristicsofthetargetpopulation.InAppendix1,themethodofweighting,thedemographiccharacteristicsofthestatisticalsample,thecharacteristicsofthetargetpopulation,andthemethodologicalchallengesofthesurveyarediscussed.

5
PartTwo:MainFindingsoftheSurvey
Inthisreportallthechartsandfindingsarebasedonthe“weightedsamples”frominsidethecountry.Thesefindingsrepresenttheattitudesof72%ofthepopulationanddonotcounttheviewsandpositionsoftheother28%(i.e.thosewhovotedforRaisiin2017’sElection).Accordingly,inthefiguresweusetheterm“unknown”regardingtheattitudesofthis28%.TocomparethedifferencesbetweenIranianattitudesinsideandoutsidethecountry, the unweighted sample is used for overseas participants (since we have nodemographicaldataoftheIranianslivingabroad). 2-1Inafreereferendum,atleast70%ofIranianswouldsay“No”tothe“IslamicRepublic”. ChartNo.1showstheanswertothequestionof“YesorNo”totheIslamicRepublicregimeforthepopulationinsideIran.Keepinginmindthatfrompreviousanalysisweknowthatsome of Raisi’s supporters are “economic voters” and do not truly belong to the“Conservative”socialbase,wecanconcludethatinafreereferendum“atleast”70%ofIraniansinsidethecountrywouldsayNOtotheIslamicRepublic. ItshouldalsobementionedthattheproportionofIraniansoutsidethecountrywhosay“No”totheIslamicRepublicis1.8%morethantherespondentsfrominsideIran.
Figure1
No to Islamic Republic
69.8%
Yes to Islamic Republic
2.2%
Unknown (those who voted for Raisi in 2017 elections-not covered
in this survey)28.0%
What is your choice in a free referendum on the Islamic Republic?
gamaan.org

6
2-2ASecularRepublichasthemostpopularityasadesirablepoliticalsystemforafreeIran Figure2 shows thepopularityofdifferentpolitical systemsamong Iranians.Themostpopular system isa “SecularPresidentialRepublic”witha24.3%approval rating, andleastpopularisa“SecularParliamentaryRepublic”with5.4%ofvotes(notconsideringtheIslamicRepublic,whichistheleastacceptedsystemofgovernanceamongthese72%of thepopulation).Thepopularityofa “SecularConstitutionalMonarchy” is15%. It isworthmentioningthat15%oftheparticipantsvotedfornoneof themastheydidnothaveenoughknowledgeonthematter.Also,theattitudesofalargesegmentofthesociety(28%)remainunknownandthereforetheiropinionsarenotaccountedfor.Ingeneral,theresultsofthesurveyshowthatasecularrepublicismorepopularthanaconstitutionalmonarchy.
Figure2
Whenaskedaboutthemostdesirablepoliticalsystem,theanswersfromIraniansoutsidethecountrywerealmostidenticaltoopinionsofpeopleinsidethecountrywithavarianceof less than1%,except for thechoicesofa “SecularParliamentaryRepublic”and“Nothaving enough knowledge”. The interesting finding is that people outside the countryfavour“SecularParliamentaryRepublic”10%morethanthoseinsidethecountry.Also,thenumberofthosewhochose“Nothavingenoughknowledge”outsidethecountrywas10%less thanthose insidethecountry.Thisdifference is foreseeableconsideringthatmostIraniansoutsidethecountryliveindemocraticcountriesandhavebeenexposedtogreaterpoliticalknowledgewhileenjoyingfreeaccesstoinformation.
Secular Presidential
Republic, 24.3%
Do not know, 15.0%
Secular Constituional Monarchy ,
14.6%
Secular Semi-presidential
Republic, 12.2%
Secular Parliamentary
Republic5.4%
Islamic Republic
0.5%
Unknown (those who voted for Raisi in 2017 elections-not covered
in this survey)28.0%
Which political system is most appropriate for Iran?
gamaan.org

7
2-3Desirablepoliticalstructure:FederalorUnitary? Figure3showstheopinionofparticipantsonthemostdesirablepoliticalstructureforthefutureofIran.Asseen,around33%oftheparticipantsdidnotanswerthisquestionduetotheirlackofknowledgeonthetopic.Ontheotherhand,aFederalPoliticalSystemispopularamongstatleastaquarter(25%)oftheIraniansociety. WhenitcomestocomparingtheviewsofIranianslivinginsidethecountryversusthoseresidingabroad, theinsiders,24%morethantheoutsiders,reportedthattheydonothave enough information to answer this question. The result shows that this topicrequiresmoredebatesinthepublicsphere.
Figure3
2-4Iranianpoliticalorientations:OverthrowersandTransformistsconstitutethemajorityofthesociety. Figure 4 shows the different political orientations of people in Iran (with definitionsexplainedinparentheses).About38%ofIraniansconsiderthemselves“Overthrowers”andaround31%“Transformists”.OverthrowersarethosewhoseekaseculardemocracyandbelievethattheprerequisiteforanychangeinIranistheoverthrowofthecurrentIslamic Republic regime. Transformists also seek a secular democracy throughfundamentalandconstitutionalchanges;however,unliketheOverthrowers,theystruggleforeachandeverycivil rights inparallel to theirstruggle forstructuralchanges.Theybelieve in a peaceful transition and that people should mobilise to impose a freereferendumonthecurrentregime.
Do not know32.8%
Federal system25.0%
Unitary system14.1%
Unknown (those who voted for Raisi in 2017
elections-not covered in this survey)
28.0%
Which political structure is most appropriate for Iran?
gamaan.org

8
The point worth considering is that a small portion of the population, about 3.6%,considerthemselves“Reformists”.I.e.,theyareforgradualreformswhilepreservingtheIslamicRepublicasaregime”.Basedonthisexplanation,eventhoughReformistsseekgradualchanges,theyinsistonpreservingtheIslamicregime.Inreality,theresultsshowthatlessthan4%ofthecountryisinfavourofso-calledReformists.Itseemsthatmostofthepeoplewhopreviouslyvoted forReformists in electionsnowconsider themselvesTransformistsratherthanReformists,becauseunliketheso-called“Reformists”,theyarenotconcernedaboutkeepingthecurrentIslamicRepublicsystemintact.Thisfindingisconsistentwiththeresultsobtainedinthereferendumquestion(Figure1)andshowsthatthe majority of voters who vote for “Reformists” are not supporters of the IslamicRepublicregime.
Figure4
In Iranian politics after the revolution, two political attitudes 1) Conservatives (Pro-RegimeFundamentalists)and2)Reformists(so-calledModerates),havedominatedthepoliticalsphereinthepastdecades.However,observationsintherecentyearsshowthatthemajorityofpeopleinIrandonotconsiderthemselvesasbelongingtoeitherfaction. PreviousstudiesontheresultsoftherecentelectionsinIranshowedthatinadditiontoConservatives and so-called Reformists, two other political orientations can berecognized:“Transformists”and“Overthrowers”.Tothebestofourknowledge,therehasbeennoindependentstudythatquantifiesthepopularityoftheReformists,TransformistsandOverthrowersintheIraniansociety.Theresults of elections in Iran under the Islamic Republic regime cannot be used todistinguishamongthesethreefactions.Infact,theexistingelectionscanonlygaugethepopularity of Conservatives, while being unable to account for the weight of the
Unknown (those who voted for Raisi in 2017
elections-not covered in this survey)
28.0%
Reformist (with emphasis on keeping
Islamic republic)3.6%
Transformist (seeking radical changes and a
free refrendum)30.6%
Overthrower (seeking regime change)
37.8%
What political orientation can better describe you?
gamaan.org

9
aforementionedthreepoliticalfactions.SinceinsuchelectionssomeTransformistsandevenOverthrowerswouldvoteforReformistcandidatesasatacticalvotetochoosethe“lesserevil”,asapopularIranianadagegoes,somemightbetemptedtoassertthatanyvotecast forso-calledReformist/ModeratecandidatesshowstheactualextentoftheirpopularityintheIraniansociety.ThissurveyhasshedlightonthisambiguityandrejectsthefacileassociationthatanyvotecastforReformistsisinfactinfavourofReformists.ComparingIranianswholiveinsideandoutsidethecountry,wediscoveredthatcontrarytothecommonmisperception,Iranianswholiveinsidethecountryare2%morelikelytoapproveoverthrowingtheregime.Moreover,theReformistsare1.5%lesspopularandTransformistsare3.5%morepopularamongIranianswholiveabroadthanthoselivinginsidethecountry. 2-5 Popularity of political figures: Who would Reformists, Transformists andOverthrowersvoteforinafreeelection? In this survey,weprovided a list of prominent political and civil figures representingdifferent political factions. The participantswere asked to pick their first and secondchoicesinafreeelection.Needlesstosay,thelistdoesnotincludeallthepotentialchoicesforvariouspoliticaltastesoftheIranianpopulation.Thisbeingsaid,wehaveincluded“theother”option(openanswer)tocompensateforthat.Inthelist,weincludedthoseindividualswhoare(relatively)popularandareagedbelow80. The list includes figures from all fourmajor political orientations (Conservatives,Reformists, Transformists, and Overthrowers), and holding secular and non-secularviews.Moreover,theyalsorepresentleftandrighteconomicorientations,andbelongtodifferentethnicgroupsinIran.
Figure5
Figure 5 shows the popularity of the individuals in the list as the “first choice”. RezaPahlavi is themost popular personwith 37.9% of the vote. He is followed byNasrin
Reza Pahlavi37.9%
Others8.4%
Nasrin Sotoudeh
8.1%
Mir Hossein Mousavi4.6%
Mohammad Khatami4.4%
Fariborz Rais-dana1.6%
Mohammad Javad Zarif1.4%
Ahmad Zeidabadi1.4%
Hassan Shariatmadari0.9%
Maryam Rajavi0.6%
Abdollah Mohtadi0.5%
Ali Khamenei0.5%
Molavi Abdolhamid0.4%
Mahmoud Ahmadinejad0.4%
Koroush Zaim0.4%
Qasem Soleimani0.2%
Yusef Azizi Banitaraf0.2%
Mehdi Karoubi0.1%
Unknown (those who voted for Raisi in 2017
elections-not covered in this survey)
28.0%
To whom do you vote in a free election as a president or the leader of a political party?
gamaan.org

10
Sotoudehwith8.1%,MirhosseinMousaviwith4.6%,MohammadKhatamiwith4.4%andFariborz Raisdana, Mohammad-Javad Zarif and Ahmad Zeidabadi with approximately1.5%each. Since thesampledoesnot includetheelectoralbaseof theConservatives, thepoliticalfiguresclose to this faction(e.g.AliKhameneiandGhasemSoleimani)havereceivedaverylowsupport.However,thisdoesnotmeanthatthispoliticalfactionhasnegligiblesocial base in the Iranian society. Previous estimates show that they representapproximately20%oftheIraniansociety.ComparingtheresponsesofthoseIranianswhoresideinsidethecountrytothoselivingabroad,wecanseethatRezaPahlaviis15%morepopularamongstthosewhoarelivinginsidethecountry.Ontheotherhand,NassrinSotoudeh(9%)andAhmadZeidabadi(3%)more popular amongst Iranians living abroad. As for other political/civil figures, thedifferenceislessthan1%. It shouldbenoted that among the figuresprovidedby the respondents aspart of the“other choice”, those with a minimum of 20 votes are (in the order of vote share):AbolhassanBanisadr,SadeghZibakalam,MohammadNourizad,MohammadHosseini(thehost of a TV show called Restart), Mostafa Tajzadeh, Masih Alinejad, Shirin Ebadi,GhassemSholesadi,BahramMoshiriandHeshmatTabarzadi. To identifywhichof these individualshave commonelectoralbases,we lookedat thesecondchoices.Table1showssecondchoicescorrespondingtoeveryfirstchoice.
Table1First choices Second choices (in order of vote share) Reza Pahlavi Nasrin Sotoudeh MirHossein Mousavi Nasrin Sotoudeh Reza Pahlavi Ahmad Zeidabadi MirHossein Mousavi Mohammad Khatami Reza Pahlavi Mohammad Khatami MirHossein Mousavi Mohammad Javad Zarif Fariborz Raisdana Nasrin Sotoudeh Ahmad Zeidabadi Mohammad Javad Zarif Mohammad Khatami MirHossein Mousavi Ahmas Zeidabadi Nasrin Sotoudeh Fariborz Raisdana Hassan Shariatmadari Nasrin Sotoudeh Reza Pahlavi Maryam Rajavi Nasrin Sotoudeh Fariborz Raisdana Abdollah Mohtadi Nasrin Sotoudeh Reza Pahlavi Ali Khamenei Qasem Soleimani Mohammad Khatami Molavi Abdolhamid MirHossein Mousavi Reza Pahlavi Mahmood Ahmadinejad Reza Pahlavi Qasem Soleimani Koroush Zaim Fariborz Raisdana MirHossein Mousavi Qasem Soleimani Mohammad Khatami Mohammad Javad Zarif
Yusef Azizi Banitaraf Reza Pahlavi Molavi Abdolhamid
Mehdi Karoubi MirHossein Mousavi Nasrin Sotoudeh

11
Figure6showsthepoliticalorientationsofthosewhovotedfortheeightmostpopularindividuals. It shows that 68% of those who chose Reza Pahlavi as their first choiceconsider themselves asOverthrowerwhile31%areTransformists. 54%of thosewhochoseNasrin Sotoudeh consider themselves to be Transformist and 45%of them areOverthrowers.Only1%oftheirsupportersconsiderthemselvesReformist.Mohammad Khatami, Mohammad-Javad Zarif and Mirhossein Mousavi are the mostpopularcandidatesamong thosewho identified themselvesasReformist.Nonetheless,most of thosewhose first choice was one of these three individuals have consideredthemselvestobeTransformist.
Figure6
Figure7summarizestheabove-mentionedanalysisandotherfindingsfromthesurvey.Thefigureshowsthecommonelectoralbaseamongpoliticalfigures.Thecommonalitiesbetweenpoliticalfactionsexplainwhysomeindividualshaveaconsiderablenumberofvotesintwooreventhreedifferentpoliticalvotebases(seeFigure6). It shouldbenoted that thepositionsofpolitical figuresonFigure7merelyreflect theresultsofthesurveyandthechoicesoftherespondents.Theseindividualsmayidentifywithdifferentpoliticalfactionsfromthosepresentedinthefigure.
Figure7
1% 1% 2% 2% 2% 15%
29% 30% 31%
54% 59% 69% 70%
63%
59% 63% 68%
45% 39% 29% 28% 21%
12% 7%
0% 10% 20% 30% 40% 50% 60% 70% 80% 90%
100%
Reza Pahlavi Nasrin Sotoudeh
Hassan Shariatmadari
Fariborz Raisdana
Ahmad Zeidabadi
MirHossein Mousavi
Mohammad Javad Zarif
Mohammad Khatami
political orientations of those who voted for the eight most popular individuals
Reformist Transformist Overthrowergamaan.org
12
UsingFigure7andtakingintoaccounttheobservedcommonalityoftheelectoralbasesofthepoliticalfigures(Table1),wecanaddthetotalpercentageofvotesforindividualswithineachorientation,plusone-thirdofthe"OtherOption",asanestimationofthepossiblevoteshareforasinglecandidateforeachofthethreeorientationsofReformists,TransformistsandOverthrowers.UsingtheresultsofFigure5,itisestimatedthatthesinglecandidatefortheReformistfaction has about 14% of the vote base. Meanwhile, the single candidate for theTransformist faction has about 15% of votes whereas the single candidate for theOverthrowersaccountsforabout40%ofthevotebase.Withregardtothefactthatonly3.6%ofthepopulationconsideredtheirpoliticalorientationasReformist(Figure4), itseemsthatabout10%ofthosewhovoteforReformistcandidatesconsiderthemselvesTransformist.
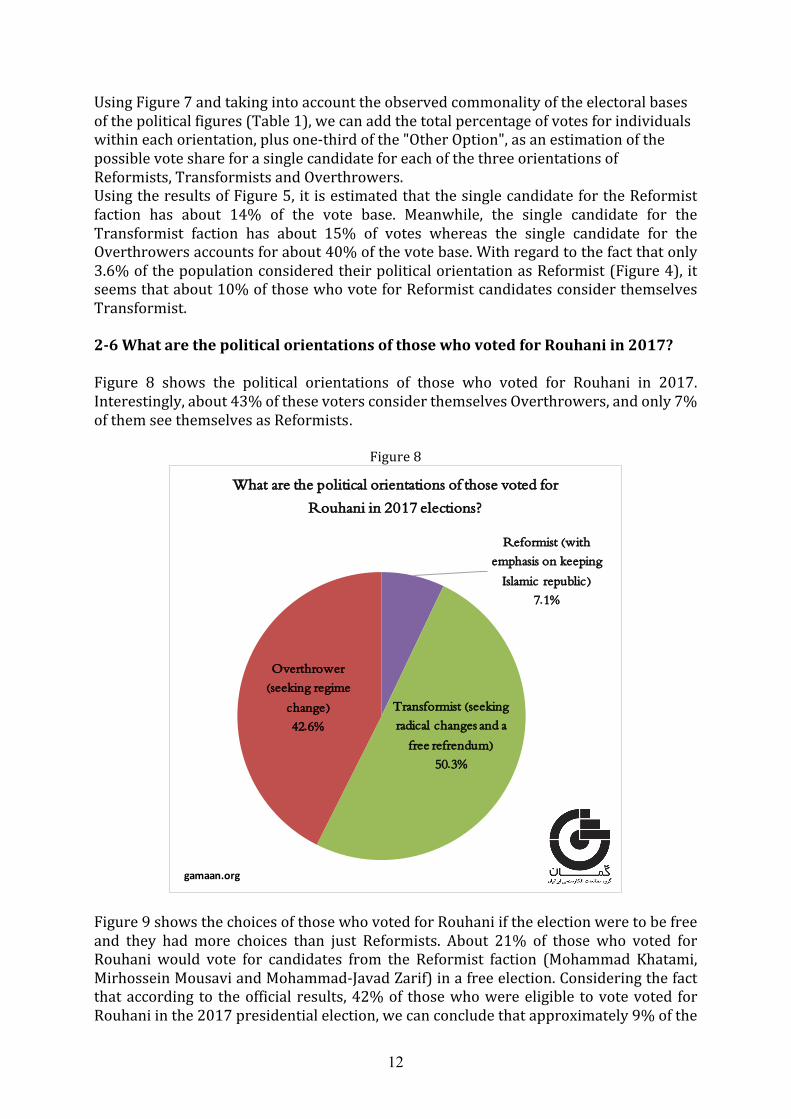
2-6WhatarethepoliticalorientationsofthosewhovotedforRouhaniin2017?Figure 8 shows the political orientations of those who voted for Rouhani in 2017.Interestingly,about43%ofthesevotersconsiderthemselvesOverthrowers,andonly7%ofthemseethemselvesasReformists.
Figure8
Figure9showsthechoicesofthosewhovotedforRouhaniiftheelectionweretobefreeand they had more choices than just Reformists. About 21% of those who voted forRouhani would vote for candidates from the Reformist faction (Mohammad Khatami,MirhosseinMousaviandMohammad-JavadZarif)inafreeelection.Consideringthefactthataccording to theofficial results,42%of thosewhowereeligible tovotevoted forRouhaniinthe2017presidentialelection,wecanconcludethatapproximately9%ofthe
Reformist (with emphasis on keeping
Islamic republic)7.1%
Transformist (seeking radical changes and a
free refrendum)50.3%
Overthrower (seeking regime
change)42.6%
What are the political orientations of those voted for Rouhani in 2017 elections?
gamaan.org

13
populationbelongedtotheReformistcampandtherestofthosewhovotedforRouhanitacticallyvotedfor“thelesseroftwoevils”,astheadagegoes.
Figure9
2-7WhichpoliticalpartiesandideologiesarefavouredintheIraniansociety? In this survey the participantswere askedwhich party theywould vote for in a freeelection.Theparticipantswereprovidedwitha(symbolic) listofpoliticalpartieswithdifferentpoliticalideologies.Figure10showsthepopularityofeachofthesepartiesinsociety.Ascanbeseen,theconstitutionalmonarchistpartygarners20%ofthevotes.ThisisfollowedbytheSocial-Democraticpartywith16.3%,NationalFront(Jebhe-Melli)partywith8.3%,andtheReformistpartywith7.5%.ThefigureshowsthattheIraniansocietyispluralisticandnopoliticalpartyorideologyhasthesupportoftheabsolutemajority. Comparing the attitudes of Iranians living inside and outside the country about thepreferred political parties sheds light on some interesting facts. The ConstitutionalmonarchistpartyandtheReformistpartyhaverespectively10%and6%lesssupportamong Iranians living abroad. On the other hand, Social-Democratic party and Social-Liberal party have respectively 12% and 8%more support among Iranians who liveabroad.
Reza Pahlavi, 48.0%
Nasrin Sotoudeh, 11.6%
Mirhossein Mousavi, 9.2%
Mohammad Khatami, 9.0%
Fariborz Raisdana2.6%
Mohammad Javad Zarif2.6%
Ahmad Zeidabadi2.4%
Hassan Shariatmadari1.3%
Others, 13.4%
In a free election, who is the faviorate candidate of those who voted for Rouhani in 2017 elections?
gamaan.org

14
Figure10
*** The team of Gamaan expresses their gratitude to all Iranians who trusted them andexpressedtheirviewsandattitudesinthissurvey.WehopethatinthefuturewecanstillbetrustedbytheIranianpeopletoexpresstheirrealviewsondifferentareasandissues.
Gamaanalsowelcomesallcomments,criticisms,questionsandsuggestionsonthissurveyand its findings. The raw data of the survey will be accessible to researchers andinternationalacademicinstitutionsunderspecificlegalconditions,afterremovalofthepersonalinformationofparticipants(i.e.IPaddresses).
Finally,wewouldliketosincerelythankthosevolounteerswhohelpusintranslatingandeditingtheEnglishversionofthisreport.
Monarchist party, 20.1%
Social-democratic party, 16.3%
National front party, 8.3%Party of
reformists, 7.5%
Others, 5.9%Social-liberal party
4.9%
Liberal party2.6%
Melli-Mazhabi party2.5%
Ethnic parties2.2%
Marxists party1.2%
Mojahedin-e Khalgh (MEK) party0.5%
Unknown (those who voted for Raisi in 2017
elections-not covered in this survey)
28.0%
If these (hypothetical )parties would compete in a free election, which one do you vote for?
gamaan.org

15
Appendix1 DemographiccharacteristicsofthesurveysampleandbalancingthesamplewiththetargetpopulationTo turn the sample of this survey into a representative sample,we have used awell-knownweightingmethodcalled‘Raking’(Alsocalled‘rakingrationestimation’).Arecentworkpublishedby“PewResearchCentre”hasshownthatbytakingintoaccountsomepropervariables,thismethodisoneofthemostefficientandtrustablemethodsofsamplebalancing.ItshouldbenotedthataccordingtotheworkofPewCentre,onlinesurveys,duetostructuralreasons,haveanerrorrateof6%atleast,demandingcautionwhenitcomestotheirgeneralizability.To create a representative sample (from respondents living inside the country), thestatisticalsampleofthesurveywasweightedtoadjustfordisparitiesindistributionofgender, age, educational level, and provincial population. The results of the officialpopulation census of 2016 and the labourmarket census of 2015 have been used toextractthedemographiccharacteristicsofthecountry.Figure11comparesthedistributionofgenderinthestatisticalsamplewiththeresultsofthe2016census.
Figure11
Figure12showstheagedistributionofthestatisticalsampleversustheagedistributionaccordingtothe2016census.Asexpected,peopleolderthan60areunder-representedinthesampleofthesurvey,butotheragegroupscloselymatchthoseofthecensus.
30%
70%
49% 51%
0%
10%
20%
30%
40%
50%
60%
70%
80%
Women Men
Gender Distribution
original sample weighted sample Iranian national census 2016gamaan.org

16
Figure12
Figure 13 shows the regional distribution of the survey sample versus the targetpopulationofeachprovince.Ascanbeseen,allprovincesarerepresentedinthesurvey.Asthetargetpopulationof thissurvey is72%of the Iranianpopulationwhoareatorolderthan18yearsofage,anddidnotvoteforRaisiinthe2017presidentialelection,thetargetpopulation ineachprovince is calculatedas thenumberof individualswhoareeligibletovote,minusthosewhovotedforRaisiinthatprovince.
Figure13
30%
40%
18%
9%
3%
31% 28%
17%
12% 12%
0%
5%
10%
15%
20%
25%
30%
35%
40%
45%
18-29 30-39 40-49 50-59 60+
Age Distribution
original sample weighted sample Iranian national census 2016gamaan.org
0%
5%
10%
15%
20%
25%
30%
35%
40%
Alb
orz
Ard
ebil
Bus
hehr
Cha
har m
ahal
va b
akht
iari
East
Aze
rbai
jan
Fars
Gila
n
Gol
esta
n
Ham
edan
Hor
moz
gan
ilam
Isfa
han
Kah
gelu
ye v
a bo
yer a
hmad
Ker
man
Ker
man
shah
Kho
rasa
n R
azav
i
Kho
zesta
n
Kur
dista
n
Lore
stan
Mar
kazi
Maz
anda
ran
Nor
th K
hora
san
Qaz
vin
Qom
Sem
nan
Sista
n va
bal
uche
stan
Sout
h K
hora
san
Teh
ran
Wes
t Aze
rbai
jan
Yaz
d
Zan
jan
Provincial Distribution of Population
original sample weighted sample eligible voters in 2017 minus who voted for Raisi in the province
gamaan.org

17
Figure 14 shows the education level distribution of the sample versus the targetpopulation.Asexpected,peoplewithhighereducationareover-representedinthesurveysampleanddemographicallyitislessconsistentwiththetargetpopulation.Nevertheless,thankstothelargesizesample,thesamplepopulationconsistsofpeoplewithallpossibleeducation levels (primary school, high school diploma, associate degree, Bacherol’sdegree,Master’sdegree,andPhD).
Figure14
Figure 15 shows the economic classes of the survey participants. About 64% of theweightedsamplebelongtoalow-incomegroup,while7%arefromahigh-incomegroup.Considering the official statistics released by the “Statistical Center of Iran” on thehousehold income decile distributions, there is an acceptable match between theeconomicstatusoftheweightedsampleandthatoftheIraniansocietyingeneral.
Figure15
24%
76% 79%
21%
0%
10%
20%
30%
40%
50%
60%
70%
80%
90%
Associtate's degree or lower Bachelor's degree or higher
Education Level Distribution
original sample weighted sample Iranian national labour census 2015gamaan.org
low income (less than 750 $)64%
middle income (between 750 $ and 1500 $)
29%
high income (higher than 1500 $)
7%
Income Distribution in the Weighted Sample
gamaan.org

18
Validationoftheweightedsample One of the methods by which the reliability of the statistical sample and itsgeneralizability can be assessed is the extent to which the results of the survey arematchedwiththeexternalevidence(externalvalidity).Byanalysingtheanswertothefirstquestionofthesurvey(Whodidyouvoteforinthe2017election?),onenoticeshowthefindingsoftheweightedsamplearematchedtotheofficialresultsoftheelection.Figure16comparesthe“officialresults”of thepresidentialElectionsof2017withtheresultsoftheweightedsample. ItcanbeseenthatthedifferencebetweenthevotesofRouhanionthebasisoftheweightedsampleandtheofficialelectionresultsisonlyabout3%.Thisdifferenceisabout1%forthosewhohavenotvotedorhavevotedblank.Thiscomparisonshowsthataweightedsampleisverywellmatchedtothetargetpopulation.
Figure16
Withregardtowhatissaidinthisappendix,itseemsthattheweightedsampleconsideredinthisreportcanadequatelyrepresent72%oftheIraniansociety;thus,thefindingsofthis report canbe (with scientific considerations) generalized to this largepartof theIraniansociety. MethodologicalchallengesofthesurveyThissurveyand its analysesdisplay thesamemethodologicalshortcomingswhichareinherenttoeveryonlinesurveysampling.Oneoftheseshortcomingsarisesfromtheso-calledNetworkEffect,thatisthesurveywouldmostlyreach thenetworkofitsorganizers.Toovercomethischallenge,wehavetriedtosharethesurveyamongstindividualsandgroups belonging toall threepolitical orientations (i.e.Reformists,Transformists, andOverthrowers).Moreover,using theVirtualSnowballSampling technique,andsharingthesurveyondifferent socialnetworkingplatforms(i.e.Telegram, Instagram,Twitter,andFacebook),wetriedtoincreasethenumberofrespondentstoovercomethebiasescausedbytheNetworkEffect.
45%
26%
1%
42%
27%
2%
0%
5%
10%
15%
20%
25%
30%
35%
40%
45%
50%
Hassan Rouhani Did not vote Blank vote
Who did you vote for in the 2017 presidential election?
weighted sample official results of the 2017 presidential electiongamaan.org

19
The fact that the findings from the sample match the official results of the 2017presidential election in Iran shows that these efforts have managed to mitigate theNetworkEffect,althoughwedonotclaimthatwecouldfullyovercometothischallenge.Repeatingsuchpollsinfuturestudiesandusingamoreinclusivesamplepopulationcanhelptoovercomesuchchallenges.