Embed Size (px)
Citation preview

Political Economy and the Hydrogen Revolution David G. Victor, Thomas C. Heller, Nadeja M. Victor
Working Paper # 17 September 2003

The Program on Energy and Sustainable Development at Stanford University is an interdisciplinary research program focused on the economic and environmental consequences of global energy consumption. Its studies examine the development of global natural gas markets, reform of electric power markets, and how the availability of modern energy services, such as electricity, can affect the process of economic growth in the world’s poorest regions. The Program, established in September 2001, includes a global network of scholars—based at centers of excellence on four continents—in law, political science, economics and engineering. It is based at the Center for Environmental Science and Policy, at the Institute for International Studies.
Program on Energy and Sustainable Development At the Center for Environmental Science and Policy
Encina Hall East, Room 415 Stanford University
Stanford, CA 94305-6055
http://pesd.stanford.edu

About the Authors
David G. Victor is the Director of the Program on Energy and Sustainable Development at Stanford University. His research interests include energy policy, genetically modified foods and related trade policy, climate change policy, the role of technology and innovation in development and forest policy. His publications include: The Collapse of the Kyoto Protocol and the Struggle to Slow Global Warming (Princeton University Press, April 2001), and Technological Innovation and Economic Performance (Princeton University Press, January 2002, co-edited with Benn Steil and Richard Nelson). Dr. Victor holds a Bachelor’s degree from Harvard University and a Ph.D. in Political Science from MIT. Thomas C. Heller is the Lewis Talbot and Nadine Hearn Shelton Professor of International Legal Studies at Stanford Law School. His research interests include international law and political economy, legal theory and environmental law. In addition to publishing widely on these topics he has consulted for several international organizations, including the Intergovernmental Panel of Climate Change, the Electric Power Research Institute and the World Business Council for Sustainable Development. Prof. Heller holds a Bachelor’s degree from Princeton University and a LLB from Yale Law School. Nadejda M. Victor is the Cowles Foundation Research Associate of Economics at Yale University and a Research Fellow of the Program on Energy and Sustainable Development at Stanford University. Her research interests include environmental and energy system projections at both global and national levels and modeling technological changes. Her publications include: Global Energy Perspectives (Cambridge University Press, 1998) and IPCC Special Report on Emissions Scenarios (Cambridge University Press, 2000). She is also the author of more than 30 essays and articles in scholarly journals, magazines and newspapers, including Climatic Change, Technological Forecasting and Social Change and Foreign Affairs.


1
Political Economy and the Hydrogen Revolution
David G. Victor, Thomas C. Heller, Nadejda M. Victor*
H2 ASCENDING?
In recent years, the professional punditry has lofted hydrogen into the firmament of technological wonders. A “hydrogen revolution” is now the most often touted remedy to threats to energy security and the specter of climate change and other environmental harms caused by burning fossil fuels the old fashioned way—combustion. Even as a few doubters question the economics and wisdom of this revolution, today’s stewards of conventional wisdom question not whether the hydrogen revolution will occur but, rather, the exact timing and sequence of events what will propel modern society to that shining hydrogenous city on the hill.
Hydrogen is not only the much hoped for fuel of the future but is also a fuel of the
past and the present. Town gas—a brew of hydrogen, carbon monoxide, methane and other flammable aromatics that was produced by heating coal—once lit major industrial cities before electrons shunted gas aside as the energy carrier of choice. Today, hydrogen is ascendant again. Synthesis gas—consisting mainly of carbon monoxide and hydrogen gas—is an intermediate product in plans for cutting edge power plants that would gasify coal and produce electricity as well as a concentrated stream of CO2 that could be sequestered under ground. Syngas is also a key intermediate product in chemical processes that convert coal and gas into liquid fuel. The German war machine, which was rich in coal and starved of oil, deployed this chemistry to keep its aircraft aloft and its tanks and trucks on the roll. South Africa, also awash in coal, deployed this process for creating liquid fuel when apartheid era sanctions cut off the hard currency and import rights that would be needed to buy petroleum overseas. The United States government invested in the same process in a quixotic effort to obtain “energy independence,” and abandoned the scheme in the 1980s when a pilot plant confirmed, at vast cost, what was already known: independence from oil through production of oil substitutes is expensive.
Although attempts to make and utilize hydrogen feedstocks have required
swimming against the economic tide when the objective was to replace petroleum, other uses have been commercially more viable. By 1997 production of pure hydrogen totalled about 35 million tons worldwide, with the U.S. accounting for about one-third of the total (Hart,D.,1997). Pure hydrogen was originally manufactured for use primarily in the production of ammonia (an ingredient in fertilizer) and methanol (a solvent and feedstock for producing other chemicals). The largest current use of hydrogen is in refineries, where
* Draft (September 2003), not for citation or quotation. We acknowledge many collaborations with Nebojša Nakićenović and Arnulf Grübler (IIASA), Holger Rogner (IAEA), Jesse Ausubel (Rockefeller University) and are grateful to David Keith and Granger Morgan (Carnegie Mellon) and Dale Simbeck (SFA Pacific) for assistance in understanding the technologies and to EPRI for support.

2
it allows production of larger quantities of light fractions—such as gasoline and jet fuel—from heavy crude oil feedstocks. Other uses are in metallurgy, hydrogenation of edible fats and oils, space and weather programs, fuel cells and in the manufacture of high quality electronic components. Nearly all hydrogen is produced by steam reforming of natural gas—a process that involves reacting natural methane and water at high temperatures, usually over a nickel-based catalyst.
The experience today already reveals the issues that will arise if the envisioned
hydrogen revolution is really to unfold. Figure 1 shows our estimates for the price of hydrogen (per GJ), compared with other energy carriers such as refined petroleum products and electricity. One point stands out: today, with real costs based on real technologies, the cost of hydrogen is in the same ballpark as the cost of other major energy carriers. This fact reflects the attractive economics of steam reforming. Production of hydrogen by gasification of coal is about twice the cost of steam reforming methane—despite the fact that coal itself is less than half the cost of gas. Production of hydrogen by electrolysis of water is twice again the cost of coal gasification—four times the cost of steam reforming—which suggests that with today’s technological suite the only way that electricity will be deployed via electrolysis to hydrogen is at sites that are blessed with vast quantities of stranded electric resources. If the economics of transporting bulk hydrogen improve dramatically then it might be profitable to build large dams on the many still untouched sites for hydroelectric dams—gigawatts of Amazonian flow remain untapped, and there are still great potentials on the Congo River (one site alone offers perhaps 70 GW of electric potential), Iceland, and others. However, even in these cases hydrogen is not the ordained product. Electric-hungry industries, such as aluminum smelters, may deliver more value by smelting bauxite to aluminum than in ripping the hydrogen from water. Politically, it is getting harder to site large dams because of growing concern about the environmental consequences. Beyond hydroelectricity, other possible sources of stranded electricity might include remote solar stations in desert regions or offshore wind. But technological changes are shrinking the areas on Earth where untapped hydroelectric resources are truly stranded—the economics of long-distance electric transmission are constantly improving, with the prospect of continental scale supergrids moving from science fiction to hard-nosed possibility.
All this suggests that it is not the price of the energy carrier that will be the main
factor in the hydrogen revolution because the cost of creating hydrogen is already in the noise of all the major energy carriers. Rather, the key question is what will make users switch from today’s carriers—refined petroleum and electricity—to something new? The incumbents are locked in to the current technological suite, and lock-in effects can be powerful deterrents to new competitors.
We address this question—the prospects for technological change by users—from
three perspectives. First, we examine the rates of change that are typically observed in technological systems. There has been much ambiguity in the discussion of a hydrogen revolution about how rapidly the revolution could unfold. That ambiguity, in turn, has led to wildly unrealistic expectations and perhaps also implausible research and development

3
strategies. Second, we examine the responses by competitors—notably petroleum and electricity—to a new entrant that tries to steal their market. Past technological transformations have seen ugly replies by the incumbent. Will those replies be fatal to the upstart hydrogen? Third, we examine the crucial role of niche markets. New technologies rarely arise de novo in the mass market. Rather, they are improved and tailored in niche markets, from which they gain a foothold for broader diffusion. What are the possible niche markets for hydrogen, and how might those markets be constructed and protected?
Figure 1. US Prices for major energy carriers and fuels (1996$). Hydrogen prices estimated from data on the value and volume of hydrogen shipments. Conversion of hydrogen shipments value from cubic feet into energy units is based on 1PJ= 3 billion cubic feet of H2, implying an average of LHV (1PJ= 3.3 billion cubic feet) and HHV (1PJ= 2.8 billion cubic feet). Hydrogen prices were estimated from US Government Bureau of Census, United States Department of Commerce (various years) and CEH Report, Hydrogen, by Bala Suresh with Ralf Gubler and Tadahisa Sasano, July 2001. All other fuels from EIA: http://www.eia.doe.gov/emeu/aer/txt/ptb0303.html
_____
USA: Prices for Major Fuels and Energy Carriers, 1970-1999
0
5
10
15
20
25
1970 1975 1980 1985 1990 1995 2000
1996
Dol
lars
per
GJ
Hydrogen
Retail Electricity(Industry prices)
Gasoline
Jet FuelOil
Gas
Coal

4
CADENCE
How rapidly could a hydrogen revolution unfold? Two examples help to bound the possibilities. Figure 2 shows the rate of change for generations of dynamic random access memory (DRAM) chips. The top panel shows the change measured in units—as computers have become more pervasive so have memory chips, and thus each generation Figure 2. DRAMs generations shipments in million units (top) and DRAMs generations shipment as a shares of total shipments. Sources of data: Victor, N. and Ausubel, J. (2002) _____ (except for 1 MB chips) has yielded an increase in total shipments. The bottom panel shows the fraction of market share and reveals the regular pattern of innovation, diffusion, saturation and replacement. 4K chips had the entire market to themselves, but after that hurrah each new chip class has competed with at least two other chips during its market
0%
20%
40%
60%
80%
100%
1974 1978 1982 1986 1990 1994 1998
Shar
e of
DR
AM
gen
erat
ion
in to
tal (
%)
4K
16K
64K
256K
1M
4M
16M
64M
0
500
1000
1500
2000
2500
1974 1978 1982 1986 1990 1994 1998
DR
AM
Shi
pmen
ts (M
illio
n Un
its)
4K
16K
64K
256K
1M
4M
16M
64M

5
lifetime. Victor and Ausubel (2002) called DRAMs the Drosophila of technological change. Each new generation is so frequent and fast—typically about five years between peaks on figure 2b—making DRAMs an excellent testbed for measuring patterns of technological change.
DRAMs have demonstrated rapid change not just because memory technology
itself has been a frontier for prodigious innovation, just as new methods for hydrogen production—such as through bioengineering—may also open a frontier for rapid innovation. Rather, the main reason for rapid technological change is that each generation of DRAMs required little change in infrastructure. Demand for DRAMs was linked closely with PC and memory upgrade sales where the expected life time of the products was short. New generations of chips, to be sure, required complementary changes in the PC and operating systems—clearing the 640K barrier in addressable memory under MS-DOS and early versions of Windows was particularly wrenching and may help explain why 1MB DRAMs never reached their potential. But power supplies, monitors, internet protocols, printers, and sundry other elements of the computer system were relatively unaffected—to them, memory in the user’s box was a scalable commodity.
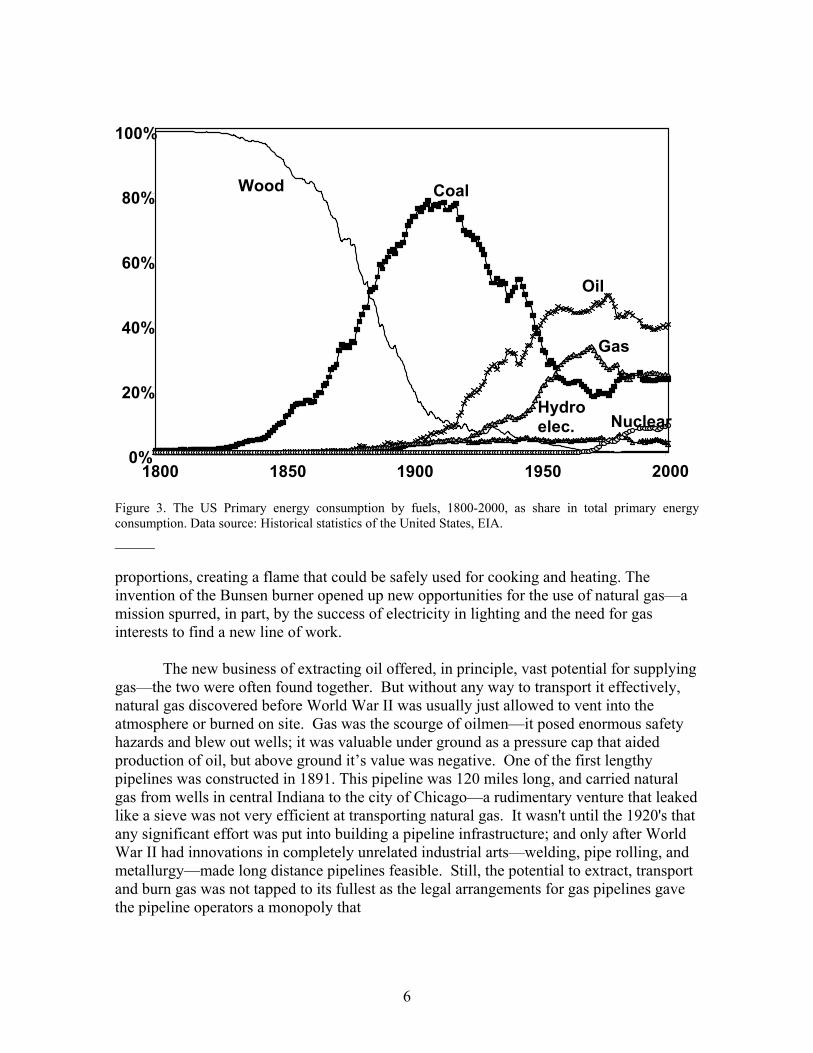
Figure 3 shows the opposite extreme: rates of change in primary fuels. (We use the United States as an example because the data sets are particularly good, but efforts to compile similar data in other countries reveal similar patterns.) It took 200 years for coal to rise from 10% to 80%--coal was used first on a large scale in industrial plants and for railroads and enjoyed a second wind in the electric power system. Hydroelectricity grew more rapidly—at the same pace as the expansion of the electric power system. The rise of oil was more rapid still—aided by the quick expansion and turnover in oil-powered automobiles. The diffusion has been even swifter. From the 1940s until its peak share in the early 1970s, gas first diffused rapidly for use in industry and to a lesser degree for heating; a second (smaller) wave has seen gas resurge as the fuel of choice for power generation in the 1990s. Whereas with DRAMs we observed changes in a particular technology, when looking at primary fuels we are observing change in a whole system—where the fuel used by the system is a function of the interactions between end use technologies and the infrastructures for supply and interlocking effects explain why change is usually slow (Grübler et al., 1999).
Looking forward, engineers often see enormous potential for a technology and
imagine that the market, too, will observe and seize the potential. But much of the history of technological change is stagnation and dead ends. Natural gas, for example, was discovered and identified in the US as early as 1626. In 1821—two hundred years later—William Hart sank the first well specifically intended to obtain natural gas, in Fredonia, New York. Expanding on Hart's work, the Fredonia Gas Light Company was eventually formed as the first US natural gas company. Lacking any form of elaborate infrastructure, however, it was difficult to transport the gas very far, or into homes to be used for heating or cooking—the dominant residential uses of natural gas today. Only in 1885 did Robert Bunsen invent a device that mixed natural gas with air in the right
6
Figure 3. The US Primary energy consumption by fuels, 1800-2000, as share in total primary energy consumption. Data source: Historical statistics of the United States, EIA. _____ proportions, creating a flame that could be safely used for cooking and heating. The invention of the Bunsen burner opened up new opportunities for the use of natural gas—a mission spurred, in part, by the success of electricity in lighting and the need for gas interests to find a new line of work.
The new business of extracting oil offered, in principle, vast potential for supplying gas—the two were often found together. But without any way to transport it effectively, natural gas discovered before World War II was usually just allowed to vent into the atmosphere or burned on site. Gas was the scourge of oilmen—it posed enormous safety hazards and blew out wells; it was valuable under ground as a pressure cap that aided production of oil, but above ground it’s value was negative. One of the first lengthy pipelines was constructed in 1891. This pipeline was 120 miles long, and carried natural gas from wells in central Indiana to the city of Chicago—a rudimentary venture that leaked like a sieve was not very efficient at transporting natural gas. It wasn't until the 1920's that any significant effort was put into building a pipeline infrastructure; and only after World War II had innovations in completely unrelated industrial arts—welding, pipe rolling, and metallurgy—made long distance pipelines feasible. Still, the potential to extract, transport and burn gas was not tapped to its fullest as the legal arrangements for gas pipelines gave the pipeline operators a monopoly that
0%
20%
40%
60%
80%
100%
1800 1850 1900 1950 2000
Wood
Nuclear
Gas
Oil
Coal
Hydro elec.
7
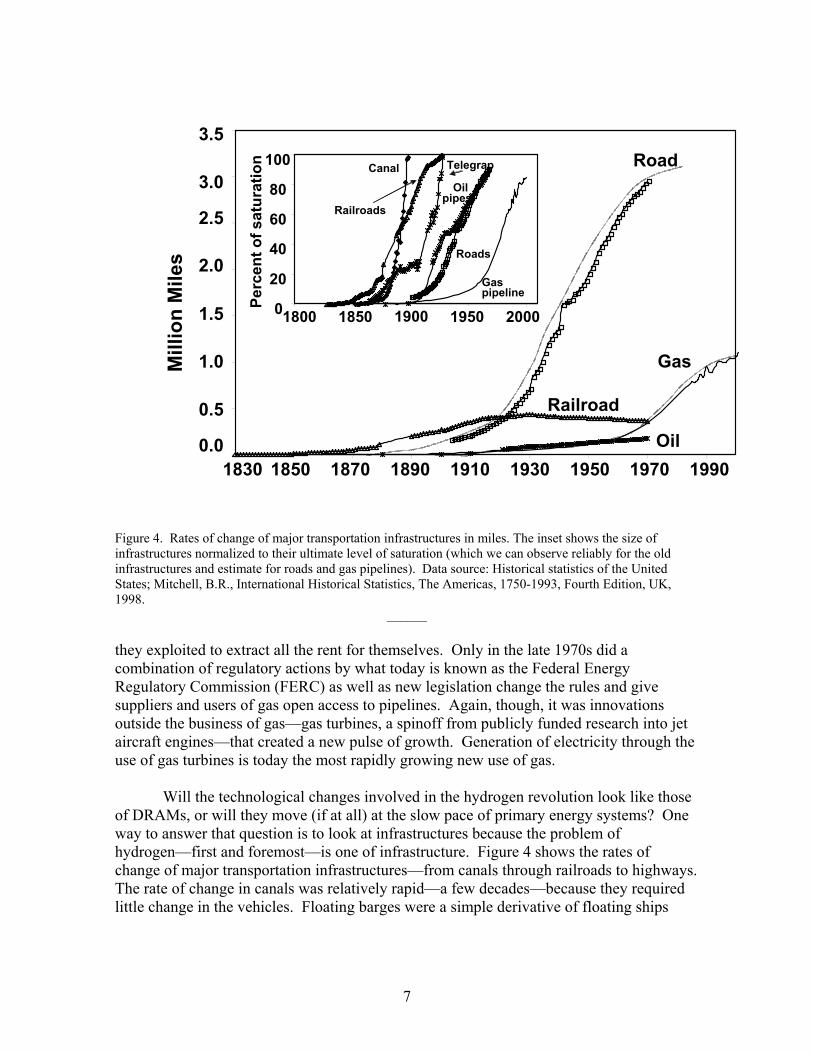
Figure 4. Rates of change of major transportation infrastructures in miles. The inset shows the size of infrastructures normalized to their ultimate level of saturation (which we can observe reliably for the old infrastructures and estimate for roads and gas pipelines). Data source: Historical statistics of the United States; Mitchell, B.R., International Historical Statistics, The Americas, 1750-1993, Fourth Edition, UK, 1998.
______
they exploited to extract all the rent for themselves. Only in the late 1970s did a combination of regulatory actions by what today is known as the Federal Energy Regulatory Commission (FERC) as well as new legislation change the rules and give suppliers and users of gas open access to pipelines. Again, though, it was innovations outside the business of gas—gas turbines, a spinoff from publicly funded research into jet aircraft engines—that created a new pulse of growth. Generation of electricity through the use of gas turbines is today the most rapidly growing new use of gas.
Will the technological changes involved in the hydrogen revolution look like those
of DRAMs, or will they move (if at all) at the slow pace of primary energy systems? One way to answer that question is to look at infrastructures because the problem of hydrogen—first and foremost—is one of infrastructure. Figure 4 shows the rates of change of major transportation infrastructures—from canals through railroads to highways. The rate of change in canals was relatively rapid—a few decades—because they required little change in the vehicles. Floating barges were a simple derivative of floating ships
0.0 0.5
1.0
1.5
2.0
2.5 3.0
3.5
1830 1850 1870 1890 1910 1930 1950 1970 1990
Mill
ion
Mile
s
0
20
40
60
80
100
1800 1850 1900 1950 2000
Perc
ent o
f sat
urat
ion
Railroads
Telegrap
Oilpipes
Roads
Gas pipeline
Canal
Gas
Oil
Road
Railroad

8
already in use, and horses (also abundantly in use) were often deployed with ropes to tow the barge down the canal. Railroads took much longer as the infrastructure required not only the physical creation of the rails themselves but also complementary changes in steam locomotives and regulation, which followed massive speculation and a crash in railroad stocks reminiscent of our most recent crash in .com investments and in broadband. The first wave of railroad building was plagued with problems of standardization—rail systems were built to different gauge and operated, literally, in their own time zones. Financial crashes and physical crashes, though painful and even lethal to those in the epicenter, were vital to the continued buildout of this fragmented system—new integrated owners and new regulation created a more stable environment for investors.
Telegraphs, by contrast, diffused rapidly within networks (the rights of way along
railroads) that already existed. Telegraph found difficulties where the rail network ended and it was harder to string wires. The first successful transatlantic telegraph, more than 2000 miles long and (of course) under water demanded costly trial and error to find the right combination of huge ships and special cables—and the entrepreneurial talents of financier Cyrus Field as the whole venture was funded privately. Conceived in the 1850s, the first signal was not transmitted until 1866.
Would the shift to hydrogen infrastructures follow the pattern established by
telegraphs—rapid diffusion within an existing rights-of-way infrastructure? Or will a hydrogen infrastructure follow the slower diffusion illustrated by most other transportation infrastructures, including railroads, automobile roads and gas pipelines? All told, the historical experience with infrastructures suggests that it is unlikely that hydrogen will diffuse as a dominant energy carrier more rapidly than about four decades—about the same time scale as the railroads or the natural gas system. (The standard measures of diffusion are the time required to shift from 10% to 90% of eventual saturation.) Even that could be too rapid if hydrogen penetrates the parts of the energy system—such as transportation—where it would be forced to compete with an existing infrastructure. Hydrogen for electric power could diffuse more rapidly than four decades on the back of the existing power grid; however, the main benefits of generating power from hydrogen come from digitally managed “micropower” generators. Those generators seem unlikely to appear on a large scale without a digitally controlled “smart grid” that, at present, doesn’t exist and may prove technically and institutionally difficult to graft on top of the existing power grid.
THE EMPIRE STRIKES BACK
The factors that determine the diffusion of a new technology lie not only in the
intrinsic properties of the technology itself—such as the needs for complementary innovations in the infrastructure and the end uses, which would tend to slow down the rate of diffusion—but also at the incumbents. Diffusion of the telegraph required scaling up a technology and the invention of complementary devices such as amplifiers, but the equipment at both ends of telegraph wires remained relatively simple and was operated by

9
professional crews that could be trained for the needs. Telegraph companies competed against ocean-going ships, pony express and the railroads themselves for carrying mail, but mainly the telegraph supplied a new service that nothing else on the market could offer: instantaneous delivery of high value information, such as stock tickers.
Here we focus on two of hydrogen’s likely competitors: electricity (for stationary
uses) and petroleum (for transportation). Measured by the sheer volume of business, hydrogen is a mouse in this game. Figure 5 shows for the U.S. the value of these three industries—hydrogen (top), petroleum (middle), and electricity (bottom). As a measure of lobbying power, hydrogen producers are a $1billion per year business. Oil producers generate about $50 billion per year in revenues, a number that more than doubles when imports are included. (The total value of gas production in 2001 was about $70b—even larger than U.S. oil production.) The wholesale value of all electricity generated in the U.S. is about $250b. From 1971 to 1999 the value of the U.S. hydrogen production business tripled in real terms, but the pricing power created by OPEC also multiplied the value of oil production by nearly as much—even though the volume of U.S. oil production is one-third lower today than it was in the peak production year of 1971.
The incumbents can respond in at least two ways. Politically, they could respond
by organizing themselves, and one of the few “rules” of political science that most political scientists actually think is robust is that concentrated, existing interests tend to organize more readily than those that are diffuse and hypothetical. Thus even if society may benefit from a shift to hydrogen, the individual beneficiaries today are unknown and few. In contrast, the possible losers are already known and already well organized through industrial organizations. Indeed, some of the “losers” may transform themselves into winners, and thus large energy companies are today also dabbling in hydrogen. But that dabbling makes sense not only as positioning for future commercial benefits but also to gain the inside knowledge needed to mount a defense. From the perspective of an incumbent, what could be done?
Incumbents can organize legal responses to hobble if not fatally wound the
incumbent. The most famous example is automobile regulation in the UK. The Locomotive Act of 1861 restricted the weight of steam engines to 12 tonnes and limited speeds to less than 12 miles per hour. With blood in the water, interests opposed to mobile engines—including operators of horse-drawn carriages—organized to support a tightening of the Act in 1865 (known as the “Red Flag Act”), which imposed a 2 mph speed limit on locomotives in any urban agglomeration and 4 mph elsewhere. It also required a pedestrian carry a red flag 60 yards in front of the vehicle and required 3 drivers be on board the vehicle—today, fewer people are needed to pilot a widebody jet. The Red Flag Act was modified 13 years later, but in deference to what today would be called the “subsidiarity principle,” the new Act still required waving a red flag at walking speed (though only 20 yards in front of the train) where local sensibilities demanded a leisurely pace. The effect of these rules was not only to stigmatize the new technology but also to assure that locomotives could deliver mobility no more rapidly than a man could walk—eliminating the key advantage (speed) of railroads over coaches. Only in

10
Figure 5: Total Value of U.S. energy production: hydrogen (top), oil (middle) and electricity (bottom).
0
1
2
3
4
5
6
7
8
9
10
700 1200 1700 2200 2700 3200 3700USA Electricity Generation (Billion Kilowatthours)
Ave
rage
Ret
ail P
rices
of E
lect
ricity
(96'
US
Cen
ts p
er K
ilow
atth
our)
220 Billion '96US$/year
180 Billon '96US$/year
1960
1973
1983
1979
2000
1994
2001
US Electricity Generation, 1960-2001
0500
1000150020002500300035004000
1960 1980 2000
Bill
ion
Kilo
wat
thou
rs
60 Billion '96US$/year
100 Billion '96US$/year
140 Billion '96US$/year
0.0
1 .0
2 .0
3 .0
4 .0
5 .0
6 .0
7 .0
8 .0
0 .00 0.10 0 .20 0.30 0 .40 0 .50 0.60
US A Hydrogen P roduction (T rillion C ub ic Fe et/yea r)
Hyd
roge
n Pr
ice
(96'
US$
per
Tho
usan
d C
ubic
Fee
t)
1 B illion '96U S $ /year
0 .5 B illio n '96U S $/year
0 .1 B illio n '96U S$ /year
1971
1979
1984
1974
1998
1987
1994
1991
U S H ydrogen Production, 1971-1998
0
100
200
300
400
500
600
1970 1980 1990 2000
Bill
ion
cubi
c fe
et
0
10
20
30
40
50
60
4 5 6 7 8 9 10
USA Crude O il Production (Millions barrels daily)
Cru
de O
il Pr
ice
(96'
US
$ pe
r per
Bar
rel)
10 Billion '96US$/year
90 Billion '96US$/year
30 Billion '96US$/year
50 Billion '96US$/year
70 Billion '96US$/year
1949
2001
1986
1990
1970
1975
1998
1981
110 Billion '96US$/year
130 Billion '96US$/year
150 Billion '96US$/year
170 Billion '96US$/year
US O il M arket, 1949-2001
0
2
4
6
8
10
12
1949 1959 1969 1979 1989 1999
Mill
ion
barr
els
daily

11
1895 was the Red Flag Act repealed for small vehicles weighing less than three tonnes, and the speed was lifted to 14 mph. A modern sport utility vehicle operating 100 years ago would exceed the weigh exemption and require a flag bearer to warn of its arrival! Throughout this period the incumbents were much better organized than the new entrants; only in 1897 did the users of these small vehicles—known by then as “automobiles”—organized into the Automobile Club that offered a political voice for the newcomer.
Often the incumbents respond through a combination of legal and political
maneuvering. Thomas Edison, celebrated as innovator, was equally adept at political scaremongering. When electric light was battling gas for illumination Edison was a big funder of propaganda (some of it actually true) about the dangers of gas light. After triumph over gas, Edison then locked into battle with AC power transmission—the rival to Edison’s DC. Edison himself built a miniature device that electrocuted cats and dogs with AC in roadshows intended to show the danger of AC (and, by default, extol the safety of DC power). The Edison company also helped the New York prison system install the first electric chair—also AC-powered. Edison, of course, lost the “battle of the currents” but probably helped to delay the entry of AC power by perhaps a decade, which benefited his firm financially and cost his rival Westinghouse, who held the patents for AC motors, meters and many other AC-based innovations. Edison himself never gave up the fight. His laboratory in West Orange, New Jersey, remained DC-powered until the 1920s—long after US industry had gone AC. A one-cubic-foot block of solid copper sits in his library—a gift from copper wire manufacturers for “service to the industry” and testimony to what could have been. Compared with AC, a DC system would have required much larger volumes of wire and sundry technologies—paths never taken. Edison’s win over gas and his loss to AC are usually viewed (by engineers) as hope that the superior technology wins, but even in this case the real lesson is that the incumbent’s response can have a large effect on timing if not the entire direction of a technological system. Paul David’s well-known work on path dependence—starting with the choice of QWERTY keyboards—illustrates perhaps the more extreme case where early choices are actually locked into place even when supposedly superior alternatives exist.
Finally, incumbents might respond by becoming more efficient themselves—in an
attempt to run the new entrant out of business. When steam power arrived to the high seas the incumbent—sailing ships—fought to the death. Indeed, the era of greatest innovation over the shortest period of time for sailing ships occurred when steam ships were literally on the horizon. The era of multi-masted clipper ships, what today are viewed as the icons of the sailing age, in fact arose only after steam and sails were battling each other for share of the open ocean transportation market. Steam was faster through the water and allowed direct travel, which were decisive for passengers and time-sensitive freight. But sailing ships had lower operating costs and held on—in part as conveyance for the less valuable cargos, including coal for delivery at ports where it would be shoveled into steam ships. Today, a redux of the sails versus steam has played out with aircraft and ships. Most high value cargo travels by air, but bulky volumes—even jet fuel for the airplanes—still moves by ship.

12
These historical responses by incumbents help us frame how today’s incumbents may respond with hydrogen on the horizon. First, they could organize politically and use their clout to raise hurdles for hydrogen systems. If the threat from hydrogen arises in the electric sector, for example, the incumbents will work to alter dispatch rules so that large centralized power plants retain their advantage. The Program on Energy and Sustainable Development at Stanford, where we work, is just finishing a large five country study of electricity market reform in developing countries and has found ample evidence of tuning rules in response to other incumbents. For example, in Brazil the dispatch system is managed to confer advantage to the operators of hydroelectric dams, making it nearly impossible for gas-fired facilities (which are badly needed, especially as a hedge against drought) to make a profit. (Only the gas plants that have special interruptible gas supply contracts with another politically well connected incumbent in the Brazilian energy system—Petrobras—have actually been profitable.) Another locus for retaliation against hydrogen will be in material handling and safety; pipeline safety rules offer ample opportunity for a crafty incumbent to hobble the upstart. A few choice accidents will aid in the effort of mobilizing public opinion.
Second, the incumbents could respond by cutting prices and lifting efficiency—
making it harder for hydrogen to compete. Presumably it would be harder for OPEC to sustain the cartel that keeps oil prices higher than in an open market if key OPEC members decided that high prices were speeding their assets to irrelevance. Similarly, end use applications could cut the cost of operation—probably dramatically. The U.S. National Academy of Sciences found that the efficiency of new U.S. vehicles could be doubled over a decade at little cost; a study by MIT and Charles River Associates with the World Business Council for Sustainable Development (2001) identifies even more dramatic potentials for lifting efficiency. The recent appearance of commercially viable hybrid vehicles underscores that a wide range of technologies could emerge where incumbents had a strong incentive to protect their position.
We close this section on responses by incumbents by exploring the political and
economic options for the new entrant. When steam locomotives first entered the UK market they had few allies. They were noisy, dangerous and expensive, and the market itself was not yet segmented into usable small vehicles that could be owned by individuals (albeit individuals with technological prowess, surplus cash, tolerant families, and weekends free for tinkering—the mass automobile did not come until the early 20th century). There was no automatic political coalition in favor of automobiles, and that helps to explain the slow pace at which offending rules were dismantled and the slow pace in identifying a segment of the market (small vehicles less than 3 tonnes) that could move ahead with its own politically constructed rules that were more permissive of innovation and diffusion. Hydrogen may be in a similar situation today. Who might be the lead members of a hydrogen coalition?
• Environmentalists. This group favors reductions in carbon and can help
create rules that could encourage investment in hydrogen R&D programs. But their interests do not lie with hydrogen, per se, but with
13
reduction in primary energy consumption and its environmental footprint. For them, energy efficiency and renewable power are the watchwords—and those missions may work quite against hydrogen. Renewable power—such as wind and solar—are unattractive economically for hydrogen production, at least for now. And in transportation the environmental community will rightly favor the immediate benefits of energy efficiency over speculative long-term prospects of switching from petroleum energy carriers to hydrogen.
• Gas. If modern society were suddenly to switch to hydrogen as an energy carrier with today’s available suite of technologies, in effect we would be switching to gas—a trend that is already evident in recent decades (see figure 3). Already in the U.S. nearly all hydrogen is produced from fossil fuels, and 95% of that is generated by steam reforming of methane in natural gas. No other method of creating hydrogen is cheaper than steam reforming methane. One might expect, therefore, to find gas companies lined up behind this transformation. And since some of the largest gas companies are also oil companies—BP, ExxonMobil and Shell are all placing big bets on gas in addition to their futures in oil—this could be a powerful coalition indeed. But the problem with this future is that a massive technological change if usually bad news for the incumbent, and the oil and gas companies are not only the new entrants but also the incumbents. In tough times, which roll through the industry every few years, these organizations are likely to favor today’s suite of technologies over hypothetical futures—as any complex organization would—making, perhaps, big oil and gas fickle partners. On the time time periods relevant for a shift to a hydrogen economy (four decades) it is likely that gas will face stiff competition from a next generation of high temperature nuclear reactors as sites for making hydrogen. If these reactors are successful then gas would be relegated to a minor role as feedstock while the reactor itself would be used to supply most of the primary energy needed to run the steam reform process for making hydrogen. For too long the conventional wisdom has discounted a nuclear resurgence; indeed, already the immediately available generation of reactors is nearly competitive with coal and gas in the U.S. (Deutch and Moniz, co-chairs, 2003).
• Coal. Ironically, coal may be a leading ally in the shift to hydrogen. Although gasification of coal is not at present the most cost-effective way to create hydrogen, it is one of the options and coal is abundant—notably in the U.S., which is the world’s leading center of innovation and thus policy in the US is likely to affect the fate of hydrogen more than policy in any other nation. But the problem in relying on Big Carbon as the core of a hydrogen coalition is that the interests of coal producers are tight even more tightly to the fate of electricity as an energy carrier. Dale Simbeck and others have convinced us that it is

14
possible, at remarkably low cost, to eliminate carbon completely from electric power generation by switching to coal gasification, producing syngas as an intermediate product and then collecting and sequestering the high pressure stream of pure CO2 that is easily separated along the way. That is an electric economy in which hydrogen does not leave the plant and not the same vision of a “hydrogen economy”—in which hydrogen itself is delivered as the energy carrier—that Big Green and Big Gas have in mind. Moreover, Big Carbon has already proved adept at squandering vast amounts of public R&D for “clean coal” technologies, suggesting that a public strategy toward a hydrogen future could, with Big Carbon in its midst, become a black hole for public money. Our own view is that a coal-electric future is highly likely—based on the long-term shift to electricity already evident over the last century (Figure 7). But that leaves aside one-third or more of U.S. primary energy in transportation, where despite repeated efforts electricity remains on the sidelines
• Automobiles. Finally, the makers and users of automobiles might be members of a hydrogen coalition. But as with other candidates, these potential new entrants are also incumbents—they might dabble at the margins with new methods of propulsion. But when Ford or the other big players face hard times (in the U.S., at least) their strategy for recovery involves making more SUVs with bigger internal combustion engines. The wave of interest in hybrid vehicles is often seen as evidence that fundamental change is afoot in the auto industry. But another interpretation is more plausible: hybrids offer a way to preserve the incumbent system—based on internal combustion and petroleum products—while meeting new mandates for fuel efficiency, pollution control, and green labeling. Indeed, advancements in electric drives and systems design through hybrids might ease the entry of hydrogen vehicles, but they could also facilitate a further shift to electric hybrid vehicles, in which bigger batteries and at-home charging account for more of the energy stored on board and smaller internal combustion engines provide additional power when needed.
• Electric Power. One of the hoped for applications of hydrogen is in distributed generation of electricity. Would existing electric power suppliers perhaps form part of a coalition for hydrogen as a way to secure their position in the market for high quality (“nine-nines,” meaning 99.9999999% reliable) electricity? Again, we see broad interest in hydrogen for these purposes but probably splintering of the coalition as one looks to the details.
This discussion of political coalitions should underscore two simple points. First, it would be useful for advocates of hydrogen to “game” some scenarios for the coalitions of powerful interests that might arise to support a hydrogen future. Second, the coalitions

15
involving incumbents may be a lot more fragile and conflicted in their interests—especially as one moves beyond broad visions to serious R&D and diffusion of technologies into practice—than is implied by the apparent groundswell of interest in hydrogen today. Mindful of these observations, coalition management may be as important as identifying the members—so that a hydrogen coalition anchored around coal, for example, does not become transformed into just another clean coal program. Moreover, the time required to build these coalitions may be much longer than one expects today when dreaming of the potentials. Early coalition partners, such as coal and gas, may prove to be liabilities in the future; the Darwinian search mechanism for viable coalitions anchored around specific products is a slow process. The Red Flag Act persisted for more than a decade until users of automobiles found a way to carve themselves out from the oppression of red flags and stagecoach incumbents. Even then, it took years for automobile users to police themselves to make the new technology safer and more acceptable. Running lights and horns were required of all vehicles only in 1896; the first road signs in the UK appeared only in 1904.
NICHE MARKETS
The keys to wider success with hydrogen lie, we think, in niche markets where real hydrogen products are used, where the benefits are demonstrated and where general purpose technologies such as valves, pipes, membranes and sundry other technologies that could have broader application are perfected.
We begin with the basics and then focus on scenarios for niche markets. The
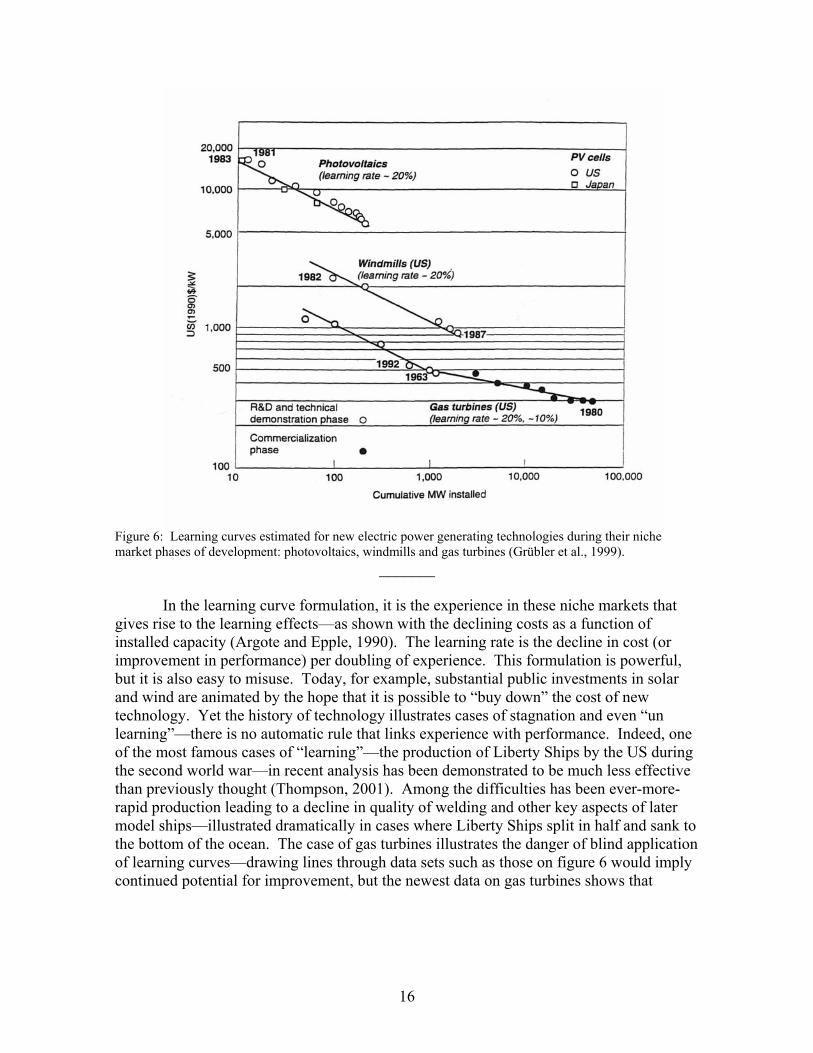
fundamental importance of niche markets is illustrated in Figure 6, which shows “learning curves” for new electric power generating technologies—solar, wind, and gas turbines. Until recently, all three of these were more expensive than the incumbents—mainly steam generators powered by coal and nuclear heat. But all three of these new technologies have improved through service in niche markets. Photovoltaics made a living in remote areas—such as in high altitude mountain huts, remote road signs, and in rural areas such as in Kenya where distances from the grid were prohibitive, power demands were small, and the incumbent utility (Kenya Power and Lighting Company) was incompetent and uninterested in service. Wind also served remote power generation and was protected by subsidies that allowed it to flourish. Gas turbines, the product initially of jet engine research, were improved through special applications, reducing the capital cost for turbines and making this technology today the choice for peak power. Despite the high fuel cost of gas relative to coal, the low capital cost of gas turbines makes them attractive peakers, especially when located near urban load centers where a small footprint and low pollution are essential attributes.
16
Figure 6: Learning curves estimated for new electric power generating technologies during their niche market phases of development: photovoltaics, windmills and gas turbines (Grübler et al., 1999).
_______ In the learning curve formulation, it is the experience in these niche markets that
gives rise to the learning effects—as shown with the declining costs as a function of installed capacity (Argote and Epple, 1990). The learning rate is the decline in cost (or improvement in performance) per doubling of experience. This formulation is powerful, but it is also easy to misuse. Today, for example, substantial public investments in solar and wind are animated by the hope that it is possible to “buy down” the cost of new technology. Yet the history of technology illustrates cases of stagnation and even “un learning”—there is no automatic rule that links experience with performance. Indeed, one of the most famous cases of “learning”—the production of Liberty Ships by the US during the second world war—in recent analysis has been demonstrated to be much less effective than previously thought (Thompson, 2001). Among the difficulties has been ever-more-rapid production leading to a decline in quality of welding and other key aspects of later model ships—illustrated dramatically in cases where Liberty Ships split in half and sank to the bottom of the ocean. The case of gas turbines illustrates the danger of blind application of learning curves—drawing lines through data sets such as those on figure 6 would imply continued potential for improvement, but the newest data on gas turbines shows that

17
learning has stalled (and reversed, in some cases) over the last decade (Colpier and Cornland, 2002).
What might be the initial niche markets for hydrogen, and how might those markets arise? We consider four possibilities—as illustrations, not an exhaustive list—and urge others to develop alternative storylines that present their own visions of viable hydrogen niches. We focus on transportation technologies, although some stationary uses (e.g., electric power generation) may also present niche opportunities.
First, most futuristic visions of a hydrogen economy focus on automobiles and fuel
cells. We are convinced that for the next decades those visions seem implausible because of the huge infrastructure challenges in converting the entire fleet to a new fuel and because it is much easier for the incumbents to meet similar goals of fuel efficiency, lower pollution and carbon abatement with less radical technological changes (Keith and Farrell, 2003). Similar visions were presented for natural gas powered vehicles, and they have fallen flat in most markets for the same reason—fueling infrastructure did not follow. Except where protected by special tax or regulatory arrangements, gas vehicles generally did not offer a competitive advantage.
Second, hydrogen power might first have special application in fleet vehicles, such
as taxis or delivery vehicles. This niche offers technical and organizational advantages and helps to blunt some of the difficulties with building infrastructures—fleet vehicles usually return to a home base for regular refueling and are maintained by professional crews. But such vehicles are usually operated by firms that are quite sensitive to cost—normally they use the fleet program to extract the minimum price from vendors, not to select vehicles that are technologically a generation or two beyond all others on the road and thus commercially risky to operate. Thus governments that have sought to create niche markets usually do it with their own vehicles—buses, which have larger engines and more space for bulky fuel tanks, are a perennial favorite. The problem with buses, however, is that they are a technology in decline across the advanced industrialized world where personal incomes are high and thus travelers favor convenience and speed over mass transit (Schafer and Victor, 1997). Some cities still offer busing opportunities, but the niche market is probably not large enough to have much effect on technological learning. In every industrialized region the share of passenger miles supplied by buses is in decline. In low-income regions of the world buses are still rising in share, but countries in those nations are unlikely to invest in a costly venture such as fuel cell buses.
Third, Farrell et al. (2003) have suggested that ships could be an attractive niche for
introducing hydrogen propulsion. Ships have very large engines and space for bulk hydrogen storage and are managed by professional crews; many ply the same point-to-point routes between harbors where refineries are also located (and thus convenient to an existing source of hydrogen). Ships are a perennial source of air pollution woes, and thus regulators already must give closer attention to finding ways of cutting effluents. In a few countries, such as Iceland, ships account for a substantial fraction of total energy demand. The problem, however, is that ships—like fleets—are run by firms that operate on very

18
thin margins and have a track record of cutting costs (and rules) wherever possible. Very costly ships such as LNG tankers, which are run by elite crews and scrupulously maintained, are a potential option—except that such tankers have a ready source of fuel on board already. Oil tankers, especially those that operate near sensitive areas, are another option—although the safety concerns surrounding the co-location of large hydrogen and crude cargos have not (to our knowledge) been examined in detail.
Fourth, aircraft offer the most rapidly growing of the major transportation modes.
Already in North America aircraft account for nearly one-fifth of all passenger miles traveled, and the share of all other human transport modes (automobiles, railroads and buses) is in decline. But airplanes are cramped and require fuels with high power density—a gas, like hydrogen at reasonable temperatures and pressures. A few decades ago Soviet engineers converted a passenger jet to fly on hydrogen—but nearly the entire passenger section was filled with a tank, and hoses that snaked outside along the fuselage to one of the engines made the craft a sorry sight. Working with hydrogen in aviation will require redesigning the airplane completely. If liquefied and cooled, hydrogen offers interesting advantages over jet fuel—supercooling the wings could allow for low-drag laminar flow. But such advantages will be worth the cost only for supersonic and perhaps hypersonic vessels—the fate of Concorde is a reminder that the market is not yet ready to invest in such a costly niche.
CONCLUSIONS
Inventors, by nature, must be optimistic about the technological frontier on which they toil. Where invention intersects with public policy, however, we must be sober and cautious about the real potentials. Today, the shift to an elusive “hydrogen economy” is touted as the solution to an endless array of energy problems—notably the threats of climate change. What, really, are the prospects for a hydrogen economy, and what can be done to advance or shape the innovations and technological diffusion that must occur for hydrogen visions to become reality?
We have suggested that the time scale required for diffusion of hydrogen
technologies from niche markets to widespread use—from about 10% to 90% of their eventual saturation—is perhaps about four decades. That is longer than the time required for diffusion of the early mass automobile technologies and associated fuels. It is shorter than the long wave of diffusion that, over more than a century, brought coal into widespread use in industrial economies. For many markets hydrogen will have the advantage of working with existing infrastructures—in transportation, for example, hydrogen buses and cars can use the same roads traveled by their petroleum cousins. In electricity, hydrogen micropower can supply a similar service as the one delivered today through the electric power grid. But in crucial ways the hydrogen infrastructures must be different—notably for fuel production, bulk transportation and delivery. These novel infrastructure requirements will slow diffusion.

19
The influence of infrastructure on rates of diffusion is a well known phenomenon in the history of technology, although often forgotten when analysts envision future energy systems. We suggest that it is equally important to examine the political, legal and institutional factors that will affect rates and patterns of diffusion. Incumbents are unlikely to take the hydrogen revolution in stride—they will fight back, creating regulatory rules and stigma that make it hard for the upstart to secure a foothold. Incumbents such as the petroleum powered automobile system will also retaliate by improving their own performance, making it harder for hydrogen to compete.
We suggest that it is crucially important to develop coherent storylines for the niche
markets in which the cluster of complementary hydrogen technologies could be improved with experience. In turn, public policy could be usefully focused on supporting not just the basic research needed for hydrogen systems but also the technologies and contexts needed to protect those niche markets. None of the logical niche markets are ideal—all are laden, already, with competitors—but other successful technologies have emerged from a cloud of similar pessimism.
20
REFERENCES Argote, L. & Epple, D., 1990. Learning curves in manufacturing. Science 247, 920-924. Annual Energy Review 2001, The Energy Information Administration (EIA), of the U.S. Department of Energy, Washington, DC Colpier and Cornland, 2002. “The Economics of the Combined Cycle Gas Turbine – An Experience Curve Analysis.” Energy Policy 30: 309-316. Bureau of Census, United States Department of Commerce (various years), Current Industrial Reports. Deutch, John and Ernest Moniz, co-chairs. 2003. The Future of Nuclear Power: An Interdisciplinary MIT Study. Cambridge: Massachusetts Institute of Technology. Energy in the United States: 1635-2000, The Energy Information Administration (EIA), of the U.S. Department of Energy, Washington, DC Farrell, Alexander E., David W. Keith and James J. Corbett (2003). “A strategy for introducing hydrogen into transportation.” Energy Policy. 31: 1357-1367. Grubler, A., N. Nakicenovic, and D. Victor (1999). “Dynamics of Energy Technologies and Global Change.” Energy Policy 27: 247-280. Hart, D, “Hydrogen power - the commercial future of the ‘ultimate fuel’” (Financial Times Energy Publications, London) 1997 Keith, David W. and Alexander E. Farrell (2003). Rethinking Hydrogen Cars. Science, 301, p. 315-316. Mitchell, B.R., International Historical Statistics, The Americas, 1750-1993, Fourth Edition, UK, 1998. World Business Council for Sustainable Development, 2001. World Mobility at the end of the 20th Century and its Sustainability. Cambridge: Laboratory for Energy and the Environment. Simbeck, D. 2003. “Hydrogen Production and Infrastructure Economics: The Biggest Challenge for Fuel Cell Vehicle Commercialization,” Presentation to the National Academies’ Committee on Alternatives and Strategies for Future Hydrogen Production and Use, Washington, D.C. (January 23).

21
Schafer, Andreas and David Victor, (1997). “The Past and Future of Global Mobility”. Scientific American, October 1997. Suresh, B., Hydrogen, Chemical Economics Handbook (CEH) Report, SRI Consulting, July 2001. Thompson, Peter (2001). “How Much Did the Liberty Shipbuilders Learn? New Evidence for an Old Case Study.” Journal of Political Economy, vol. 109, no. 1. Victor, N. M. and Ausubel, J.H., ‘DRAMs as Model Organisms for Study of Technological Evolution,' Technological Forecasting and Social Change’, 69:243-262, 2002.