Embed Size (px)
Citation preview
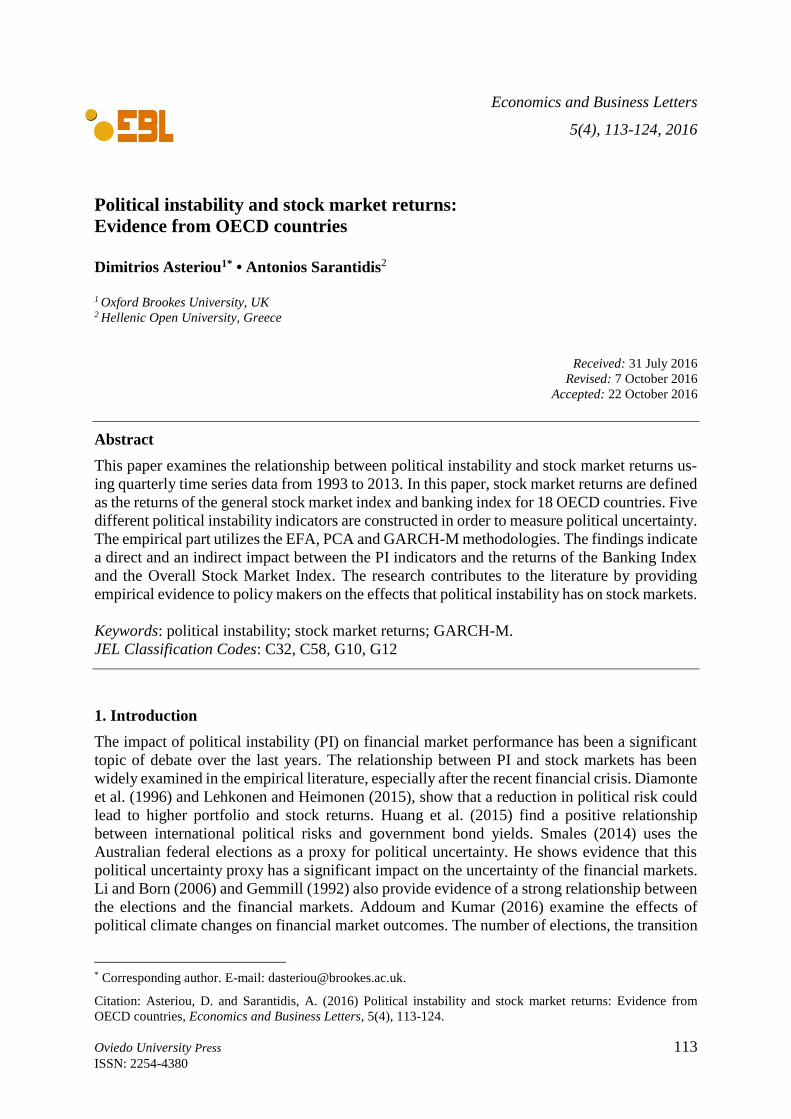
Oviedo University Press 113 ISSN: 2254-4380
Economics and Business Letters
5(4), 113-124, 2016
Political instability and stock market returns:
Evidence from OECD countries
Dimitrios Asteriou1* • Antonios Sarantidis2
1 Oxford Brookes University, UK 2 Hellenic Open University, Greece
Received: 31 July 2016
Revised: 7 October 2016
Accepted: 22 October 2016
Abstract
This paper examines the relationship between political instability and stock market returns us-
ing quarterly time series data from 1993 to 2013. In this paper, stock market returns are defined
as the returns of the general stock market index and banking index for 18 OECD countries. Five
different political instability indicators are constructed in order to measure political uncertainty.
The empirical part utilizes the EFA, PCA and GARCH-M methodologies. The findings indicate
a direct and an indirect impact between the PI indicators and the returns of the Banking Index
and the Overall Stock Market Index. The research contributes to the literature by providing
empirical evidence to policy makers on the effects that political instability has on stock markets.
Keywords: political instability; stock market returns; GARCH-M.
JEL Classification Codes: C32, C58, G10, G12
1. Introduction
The impact of political instability (PI) on financial market performance has been a significant
topic of debate over the last years. The relationship between PI and stock markets has been
widely examined in the empirical literature, especially after the recent financial crisis. Diamonte
et al. (1996) and Lehkonen and Heimonen (2015), show that a reduction in political risk could
lead to higher portfolio and stock returns. Huang et al. (2015) find a positive relationship
between international political risks and government bond yields. Smales (2014) uses the
Australian federal elections as a proxy for political uncertainty. He shows evidence that this
political uncertainty proxy has a significant impact on the uncertainty of the financial markets.
Li and Born (2006) and Gemmill (1992) also provide evidence of a strong relationship between
the elections and the financial markets. Addoum and Kumar (2016) examine the effects of
political climate changes on financial market outcomes. The number of elections, the transition
* Corresponding author. E-mail: [email protected].
Citation: Asteriou, D. and Sarantidis, A. (2016) Political instability and stock market returns: Evidence from
OECD countries, Economics and Business Letters, 5(4), 113-124.

D. Asteriou and A. Sarantidi Political instability and stock market returns
114 5(4), 113-124, 2016
between the power of political parties and the political alignment index (PAI) are used as PI
variables. They show that the investor demand is influenced by the shifts in the political climate.
Moreover, these changes affect the returns of firms and industries that are politically sensitive.
Some other studies use as PI variables or as a part of those, terrorism actions and events. That
studies shows evidence of a strong negative relationship between terrorism actions/events and
financial markets (Jackson, 2008; Chesney at al., 2011).
While the theoretical part of PI has been widely studied the empirical part seems to have
space for further research. The multidimensionality of PI is a topic that has not been studied
enough. There are only a few studies that examine this issue. For example, Bussiere and Mulder
(1999) used various indicators that quantify PI during the crisis episodes of 1994 and 1997 in
order to examine the effects of PI on economic vulnerability. Additionally, Jong-A-Pin (2009)
examined the impact of 25 different PI indicators on economic growth. However the first study
is largely outdated, while Jong-A-Pin’s (2009) study – as most PI related studies – provides
similar measures for a large set of countries that are being examined all together in a panel. We
believe that PI is a very complex issue to be examined in a way that aggregates data for many
countries with different characteristics, both market/economy related but also political
environment related. Therefore, in this paper we are trying to fill this gap by examining the
multidimensionality of PI on a country level with time series data that allow for different PI
indicators for each country. We aim to reanalyze the notion of PI and to estimate its impact on
the returns and the variance (volatility) of the banking and general stock market indices. In
order to achieve this, we construct five different PI indicators by using 27 different PI variables.
These variables are mentioned in the corresponding empirical literature of political uncertainty.
We apply Exploratory Factor Analysis (hereafter EFA), Principal Components Analysis
(hereafter PCA) and the econometric method of GARCH-M, in order to examine for possible
negative effects between PI, banking stock returns and overall stock market returns. We use
quarterly time series data for 18 OECD countries from 1993 to 2013. By using time series data
we can test for possible PI effects on the conditional variance of the banking stock returns and
the overall stock market returns. Our results – contrary to most studies that simply quantify the
negative effects of PI – show that not all political PI indicators have the same importance with
regards to stock market and banking sector returns and volatilities. In fact while in general we
find a direct/indirect negative impact of the five PI indicators on the banking and general stock
market returns/on the variance of banking and general stock market returns, some PI indicators
are non-significant, while some others suggest the possibility of a positive effect coming from
some PI indicators. Finally, we also observe that there are different effects from different PI
indicators to market stock returns and banking returns which makes the issue even more
complicated. Therefore, from this more analytical, country focused time series approach, the
current research contributes to the literature by providing to policy makers a deeper
understanding of the possible effects that PI has on stock markets producing some new results.
The rest of the paper is organized as follows. Section 2 presents the proposed methodology.
Section 3 describes the dataset, and Section 4 reports and analyzes the empirical results.
Finally, Section 5 concludes.
2. Methodology
For the empirical part of this paper, we first employ the EFA. This statistical technique is used
in order to reduce a large set of variables into a smaller set of variables and to indentify the
structure of their relationship (Fabriger and Wegener, 2011). Next, we use the EFA in order to
sort the 27 PI variables and to obtain for each country the most significant variables according
to their loadings. Furthermore, we determine the PI indicators (hereafter PI indicators) and
specify the variables by which each indicator consists. After this variable separation we employ
D. Asteriou and A. Sarantidi Political instability and stock market returns
115 5(4), 113-124, 2016
the PCA in order to construct the PI indicators from the variables obtained from the EFA
procedure. These new indicators are constructed from an initial set of variables (𝑋𝑗, 𝑗 =
1,2, … , 𝑘). The PCA transforms the data in that way that the greatest variance comes to lie on
the first principal component and the second greatest variance on the second principal
component. The same procedure is followed for the third greatest variance, and so on.
Before proceeding with our methodology, we test for possible correlations between the PI
indicators. The coefficients show us how strongly pairs of indicators are related. After this
procedure some of the indicators are excluded from the further analysis of specific countries
because of their high correlation. For the main empirical part we focus at the uncertainty that
PI indicators have. Thus we look at the conditional variance of the output. Moreover, if we
want to allow uncertainty to affect stock market or banking stock returns directly, then we
estimate the GARCH-M model. This model allows us to test if the uncertainty in the returns
could affect the returns of the stock market and banking indices and if the PI indicators could
affect the returns of the indices separately. The econometric model of GARCH-M (1,1) (Engle
et al., 1987; Enders, 1995) takes the following form:
𝛥𝑙𝑜𝑔(𝑌𝑡) = 𝑎0 +∑𝑎𝑖𝛥𝑙𝑜𝑔(𝑦𝑡−1
𝑝
𝑖=0
) + 𝛾ℎ𝑡 + 𝑒𝑡, (1)
𝑒𝑡~𝑁(0, ℎ𝑡), (2)
ℎ𝑡 = 𝑏1𝑒𝑡−12 + 𝑏2ℎ𝑡−1 +∑𝑏𝑖𝑋𝑡−1
𝑝
𝑖=1
(3)
As in the GARCH (1,1) model above, the overall stock market returns and banking stock
returns are modeled as an AR (1) process, including the overall stock market returns and
banking stock returns and the variance of the error term. The variance of the error term (ℎ𝑡) is
an equation of the lagged variance, the lagged squared residuals and the PI indicators (𝑋𝑡−1).
3. Data
Data on the economic and political variables are collected for 18 OECD countries; the time
period covers the years from 1993-2013, using quarterly time series data. The countries
included in the analysis are Australia, Austria, Belgium, Canada, Denmark, Finland, France,
Germany, Greece, Ireland, Japan, Italy, the Netherlands, Portugal, Spain, Sweden, United
Kingdom and the United States.
We test the hypothesis that PI affects stock returns by estimating time series regressions for
the overall stock market index (general index of each country) and the banking index. Data on
the two stock market indices are obtained from Thompson Reuters Datastream. Summary
statistics and unit root tests are presented in Table 1 and 2 for the prices and returns of the
banking index and the overall stock market index.
The unit root tests in Table 1 and 2 show that the prices of the indices are non-stationary; i.e.
they contain a unit root. In contrast to the prices, the returns of the indices are stationary and do
not contain a unit root (the null of unit root is clearly rejected in all cases).
The innovation in this paper is that we are using 27 different PI indicators that are mentioned
in the literature in order to construct five different PI indicators. The aforementioned variables
are presented in Table 3.

D. Asteriou and A. Sarantidi Political instability and stock market returns
116 5(4), 113-124, 2016
Table 1. Summary statistics and unit root tests for Banking Index/Returns.
Banking Index-Prices Banking Index-Returns
Countries Mean Min ADF-stat. Mean Min ADF-stat
(St. Dev.) Max (p-value) (St. Dev.) Max (p-value)
Australia 1.326,45 379,43 -0,32 2,24 -23,82 -4,43
(560.36) 2.322,47 (0.37) (8.16) 25,25 (0.00)
Austria 310,94 117,46 -0,53 0,93 -53,96 -5,04
(202.78) 896,27 (0.29) (15.88) 42,44 (0.00)
Belgium 835,78 92,92 0,81 -0,76 -110,22 -3,83
(481.87) 1.787,19 (0.79) (22.49) 49,67 0,0001
Canada 1.450,79 300,19 -0,18 2,75 -33,22 -5,98
(765.93) 2.705,25 (0.43) (9.60) 25,66 (0.00)
Denmark 1.790,44 425,74 -0,71 1,90 -77,72 -5,89
(1073.63) 4.596,88 (0.24) (17.88) 72,83 (0.00)
Finland 175,40 16,99 0,17 3,83 -51,93 -3,81
(102.76) 377,14 (0.57) (15.98) 53,29 (0.00)
France 460,60 158,70 -0,15 0,78 -66,68 -4,92
(244.88) 1.054,48 (0.44) (19.01) 54,87 (0.00)
Germany 322,20 146,37 0,14 -0,22 -54,17 -4,27
(137.02) 673,94 (0.56) (17.15) 46,49 (0.00)
Greece 1.282,15 59,23 0,29 -2,00 -75,04 -3,26
(958.22) 3.377,96 (0.61) (23.26) 52,73 0,0006
Ireland 2.788,69 48,89 0,66 -2,50 -175,69 -4,01
(2231.43) 8.057,36 (0.75) (30.29) 62,41 (0.00)
Italy 1.462,02 431,24 0,24 -0,36 -44,24 -4,55
(719.79) 2.945,44 (0.59) (14.92) 51,38 (0.00)
Japan 322,20 94,43 -0,64 -1,88 -39,58 -5,12
(175.65) 691,77 (0.26) (14.07) 35,45 (0.00)
Netherlands 2.160,10 117,65 0,64 -2,59 -141,57 -3,03
(1384.15) 4.695,06 (0.74) (21.89) 37,74 (0.00)
Portugal 145,09 17,84 0,52 -1,30 -45,32 -3,71
(72.75) 345,51 (0.69) (16.40) 50,90 (0.00)
Spain 283,77 72,41 -0,45 1,36 -53,84 -5,00
(128.28) 544,52 (0.33) (15.33) 43,50 (0.00)
Sweden 1.642,08 94,42 -0,96 4,06 -41,52 -4,72
(774.37) 3.210,01 (0.17) (16.36) 64,81 (0.00)
UK 5.555,80 1.720,19 -0,55 1,02 -28,63 -4,33
(2303.04) 9.476,01 (0.29) (12.28) 34,00 (0.00)
US 235,85 75,71 0,02 0,52 -59,69 -4,89
(96.74) 407,26 (0.51) (13.44) 34,58 (0.00)
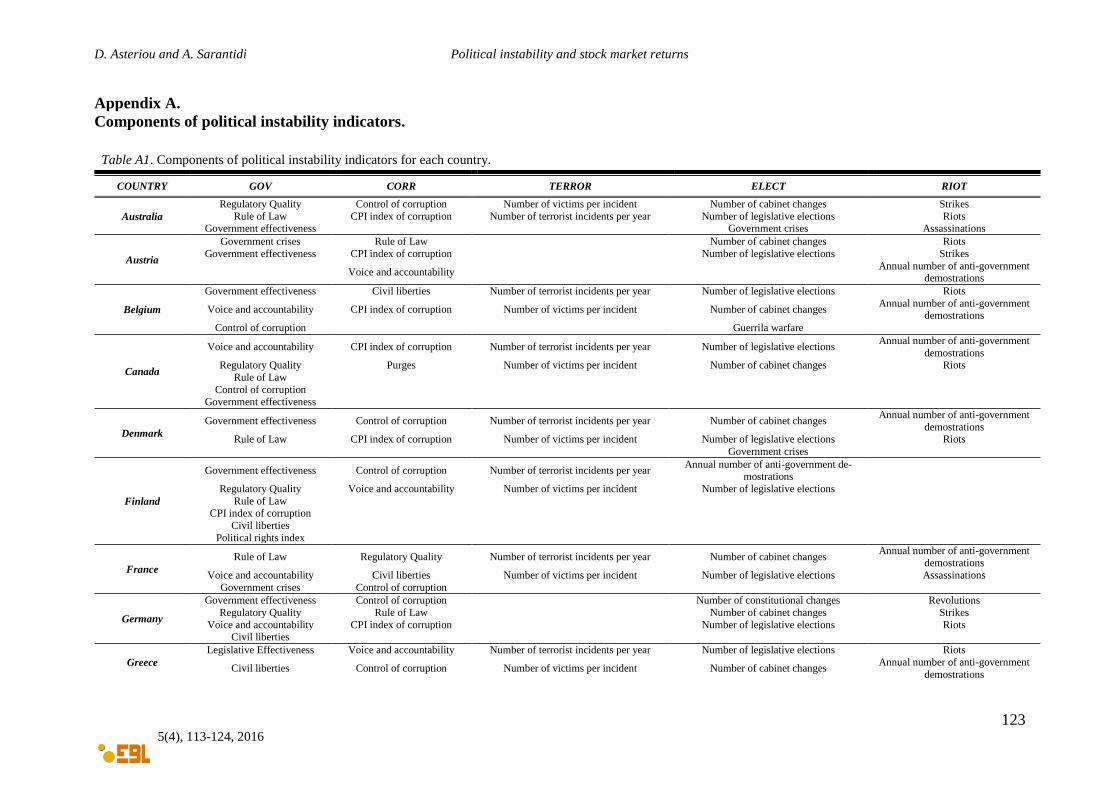
We used the EFA method to sort these variables and then the PCA method in order to
construct the five factor variables for our sample. These five PI indicators are named CORR,
which contains variables that are closely related with corruption; ELECT, which contains
variables that are closely related with elections and the electoral system; GOV, which contains
variables that are closely related to the government; RIOT, which contains variables that are
closely related to riots; and TERROR, which contains variables that are closely related to
terrorism. For Austria and Germany no data were available for the TERROR indicator and for
Finland for the RIOT indicator, respectively. The Table A1 in the Appendix A gives information
about the components for each country by which each PI indicator consist.

D. Asteriou and A. Sarantidi Political instability and stock market returns
117 5(4), 113-124, 2016
Table 2. Summary statistics and unit root tests for General Stock Market Index/Returns.
General Stock Market Index-Prices General Stock Market Index-Returns
Countries Mean Min ADF-stat. Mean Min ADF-stat
(St. Dev.) Max (p-value) (St. Dev.) Max (p-value)
Australia 3.593,00 1.794,00 -0,62 1,31 -33,68 -4,93
(1199.34) 6.432,80 (0.27) (6.97) 16,47 (0.00)*
Austria 1.952,55 730,96 -0,46 1,53 -43,18 -4,53
(1111.25) 4.971,37 (0.32) (12.46) 25,21 (0.00)*
Belgium 2.563,72 1.127,02 -0,28 1,00 -32,49 -3,35
(843.06) 4.591,71 (0.39) (10.42) 24,92 (0.00)*
Canada 8.727,21 3.305,50 -0,78 1,68 -33,10 -5,16
(3176.17) 14.625,00 (0.22) (8.27) 15,60 (0.00)*
Denmark 280,66 82,12 0,09 2,39 -45,89 -5,19
(127.34) 556,56 (0.54) (10.69 25,19 (0.00)*
Finland 6.213,31 829,00 -0,75 2,48 -42,02 -4,11
(3461.98) 16.045,05 (0.23) (17.19) 68,57 (0.00)*
France 3.715,07 1.785,71 -0,43 0,87 -36,30 -4,26
(1253.98) 6.565,97 (0.33) (11.25) 31,67 (0.00)*
Germany 4.845,57 1.684,21 -0,32 1,92 -45,91 -4,29
(1837.63) 8.067,32 (0.38) (13.09) 30,09 (0.00)*
Greece 2.309,14 611,16 -0,21 0,11 -47,12 -3,83
(1369.22) 5.877,90 (0.42) (16.67) 38,28 (0.00)*
Ireland 4.325,05 1.275,28 -0,16 1,26 -45,51 -3,52
(2030.59) 9.432,84 (0.44) (12.28) 29,54 (0.00)*
Italy 1.198,24 446,33 -0,35 0,84 -29,68 -4,78
(460.97) 2.058,23 (0.36) (12.00) 39,59 (0.00)*
Japan 14.236,56 8.017,75 -0,96 -0,61 -25,58 -5,73
(4118.01) 22.379,02 (0.17) (11.05) 22,51 (0.00)*
Netherlands 374,47 129,71 -0,28 1,24 -38,19 -4,34
(138.73) 675,44 (0.39) (12.47) 33,51 (0.00)*
Portugal 7.602,52 3.187,65 -0,43 0,75 -29,64 -4,36
(2685.05) 13.384,90 (0.33) (12.36) 37,68 (0.00)*
Spain 7.191,65 230,76 -0,62 0,89 -38,89 -4,59
(3720.31) 14.974,90 (0.27) (12.41) 39,91 (0.00)*
Sweden 759,66 179,63 -0,82 2,30 -34,81 -3,88
(315.65) 1.368,99 (0.21) (12.31) 37,23 (0.00)*
UK 2.467,17 1.356,35 -0,62 1,07 -30,52 -4,56
(576.31) 3.422,92 (0.27) (8.27) 23,04 (0.00)*
US 1.064,36 444,27 -0,30 1,56 -25,56 -4,06
(320.00) 1.569,19 (0.38) (8.51) 18,95 (0.00)*
Note: * indicates the rejection of the null of a unit root for the 95% significance level.
Table 3. Political instability variables.
Number of cabinet changes Strikes
Number of constitutional change Guerrilla warfare
Number of legislative elections Riots
Legislative Effectiveness Revolutions
Regulatory Quality Coups D'état
Rule of Law Number of terrorist incidents per year
Government crises Number of victims per incident
Purges CPI index of corruption
Annual number of anti-government demonstrations Political rights index

D. Asteriou and A. Sarantidi Political instability and stock market returns
118 5(4), 113-124, 2016
Voice and accountability Civil liberties
Political stability and absence of violence Control of corruption
Government effectiveness Degree of openness
Government (% GDP) Polity scale
Assassinations
Source: WDI (World Development Indicators), CNTS (Cross National Time Series), Kaufmann et al. (2004), GTD
(Global Terrorism Database), Transparency International, Freedom House International, Penn World Tables, Pol-
ity IV.
As mentioned in the methodology section, we estimated the correlation technique in order
to find the indicator pairs that are related. The PI indicators that are correlated are excluded for
further analysis. These are CORR for Australia, Belgium, Canada, Germany, Greece, Japan,
Portugal, UK and the US; and ELECT and GOV for France and Ireland, respectively.
4. Empirical results
Table 4 and Table 5 presents the estimation results regarding the effects of PI indicators on
the banking sector returns and the overall stock market returns, respectively. In both tables the
first section presents the mean equation and the second section the variance equation of the
GARCH-M model. This model allows for testing whether the uncertainty affects Banking
returns / Stock market returns directly and whether the PI indicators affect Banking returns /
Stock market returns separately.
According to the results of Table 4, the Bank returns (GARCH) variable is significant for
Finland, Germany and Sweden showing that the uncertainty of Bank Returns does itself affects
Bank Returns, while for the rest of the countries the variable is insignificant showing that the
uncertainty of Bank Returns does not itself affect Bank Returns. This fact, if viewed in
conjunction with the fact that some PI indicators are significant means that PI is sometimes
more important explaining returns than the inherent uncertainty (volatility from the GARCH
model) of the returns themselves. In the mean equation the PI indicators that are negative and
significant are ELECT for Denmark (-27.57) and Germany (-23.68) and RIOT for France (-
23.32) and Greece (-141.66). Positive and significant are the GOV indicator for Belgium (35.38)
and Portugal (14.64), ELECT for UK (10.86) and TERROR for Sweden (29.55). These results,
showing that PI indicators are affecting Bank Returns not only negatively but sometimes with
a positive impact indicate that the issue of PI is rather complex and does not provide all
necessary information when viewed in aggregation. Therefore, the fact that all PI is not ‘bad’
for returns, requires from financial analysts to explore further what particular
types/characteristics of PI might affect one country compared to another. Furthermore, we
tested for possible autocorrelation of higher order by using the Ljung-box test and for possible
ARCH effects. The results of Table 2 are very satisfactory and show that there are no signs of
autocorrelation and ARCH effects in the data.
In the variance equation the PI indicators that are negative and significant are CORR for
Ireland (-325.85), ELECT for Greece (-504.26), Japan (-87.04) and Portugal (-616.85), GOV
for Japan (-57.29) and Portugal (-82.30), RIOT for the US (-168.47) and TERROR for Japan (-
143.02), affecting so the variance of Bank Returns. Thus, we conclude first, that the PI
indicators have a direct effect on Bank Returns for Belgium, Denmark, Finland, France,
Germany, Sweden and the UK while they do not have an indirect effect on the variance of Bank
Returns; second, that the PI indicators have not a direct effect on Bank Returns for Ireland,
Japan and the US while they do have an indirect effect on the variance of Bank Returns; and
third, the PI indicators have both an direct effect on Bank Returns and indirect effect on the
variance of Bank Returns for Greece and Portugal. Thus, again these results suggest that PI is
D. Asteriou and A. Sarantidi Political instability and stock market returns
119 5(4), 113-124, 2016
rather complex and cannot be viewed in isolation of the particularities of every country case.
Similar to Table 4, Table 5 shows that the Stock Market Returns (GARCH) variable is
significant for Austria, Japan and Portugal showing that the uncertainty of Stock Market Returns
does itself affect Stock Market Returns, while for the rest of the countries the variable is
insignificant showing that the uncertainty of Stock Market Returns does not itself affect Stock
Market Returns. In the mean equation the PI indicators that are negative and significant are
ELECT for Denmark (-28.02) and the US (-22.52), GOV for Sweden (-5.69) and RIOT for
Greece (-65.06) and Italy (-121.71). Positive and significant are the GOV indicator for Belgium
(16.79) and Japan (9.80) and TERROR for Greece (57.88). These results are showing that the
PI indicators can affect Stock Market Returns both negatively and/or positively.
In the variance equation the PI indicators that are negative and significant are ELECT for
Belgium (-53.52), GOV for Belgium (-60.66) and the UK (-46.32), RIOT for the France (-
121.22) and Germany (-220.38) and TERROR for Ireland (-86.75) and Portugal (-832.31)
affecting so the variance of Stock Market Returns. Furthermore, two indicators, the CORR for
France (90.19) and the GOV for Germany (15.95) are positive and significant affecting also the
variance of Stock Market Returns. Thus, we conclude first, that the PI indicators have a direct
effect on Stock Market Returns for Austria, Denmark, Greece, Italy, Japan, Sweden and the US
while they do not have an indirect effect on the variance of Stock Market Returns; second, that
the PI indicators have not a direct effect on Stock Market Returns for France, Germany, and
Ireland while they do have an indirect effect on the variance of Stock Market Returns; and third,
the PI indicators have both an direct effect on Stock Market Returns and indirect effect on the
variance of Stock Market Returns for Belgium, Portugal and the UK. Here, again the results of
the Ljung-box test of autocorrelation and the ARCH effects test are satisfactory and show that
there are no signs of autocorrelation and ARCH effects.
Furthermore, from table 4 and 5 it is possible to compare the effects that each indicator has
on each country and among countries. For example, in the mean equation of table 2 the RIOT
indicator shows to have a negative impact in France while the other indicators did not have
neither a positive or negative impact. If the RIOT indicator is compared among countries then
only Greece shows to be negatively affected while other countries are not.1
5. Conclusions
The present paper empirically examines the relationship between PI, banking stock returns
and the overall stock market returns during the period of 1993-2013 using time series data at
country level. We constructed five PI indicators from 27 different PI variables that are
mentioned in the empirical literature. From the overall results of our study, although we provide
strong evidence for the existence of a direct negative relationship between the PI indicators and
Bank Returns / Stock Market Returns and an indirect negative relationship between the PI
indicators and the variance of the Banking returns and the Overall Stock Market returns (as
most other studies do), there are a few additional outcomes that need to be carefully considered.
Particularly, we find that not all PI indicators have negative effects and there are some with
non-significant and also sometimes positive results. Thus, not all PI is bad for market and
banking returns. Even more, various PI indicators are affecting differently some countries
compared to others, while the effect of PI indicators is not always the same for stock market
and banking returns. These findings show clearly that the issue of PI is rather complex and
1 Further to our initial analysis that includes all political instability indicators, the models reported in Tables 4 and
5 were re-estimated with the significant indicators only. The results were not different from the ones reported and
therefore, for reasons of economy of space are not reported here. Tables and results are available from authors
upon request.

D. Asteriou and A. Sarantidi Political instability and stock market returns
120 5(4), 113-124, 2016
when viewed in aggregation does not provide clear results for particular country cases. We
believe that studying PI in a country context allowing for idiosyncrasies for every particular
country are of major importance in understanding the role of PI on stock market stability and
are of great significance to investors and market regulators. Obviously, the topic is open for
further research in order to understand the deeper effects of PI on returns and examine in particular
what are those idiosyncrasies that differentiate the effects for different country cases.
References
Addoum, J.M. and Kumar, A. (2016) Political Sentiment and Predictable Returns, The Review
of Financial Studies, forthcoming.
Bussiere, M. and Mulder, C. (1999) Political instability and economic vulnerability, IMF Work-
ing Papers, No. 9946.
Chesney, M., Reshetarb, G., Karamana, M. (2011) The impact of terrorism on financial mar-
kets: an empirical study, Journal of Banking and Finance, 35(2), 253–267.
Diamonte, R.L., Liew, J.M., Stevens, R.L. (1996) Political risk in emerging and developed
markets, Financial Analysts Journal, 52(3), 71-76.
Enders, W. (1995) Applied econometric time series, New York: Wiley.
Engle, R.F., Lilien, D.M., and Robins, R.P. (1987) Estimating Time Varying Risk Premia in
the Term Structure: The ARCH -M Model, Econometrica, March, 55, 391–407.
Fabriger, L.R. and Wegener, D.T. (2011) Exploratory Factor Analysis Understanding Statis-
tics, Oxford University Press: New York.
Gemmill, G., (1992) Political risk and market efficiency: tests based in British stock and options
markets in the 1987 election, Journal of Banking and Finance, 16, 211–231.
Huang, T., Wu, F., Yu, J. and Zhang, B. (2015), International political risk and government
bond pricing, Journal of Banking & Finance, 55, 393-405.
Jackson, A.O. (2008) The impact of the 9/11 terrorist attacks on the US economy, Workings
Papers of the Florida Memorial University.
Jong-a-Pin, R. (2009) On the measurement of political instability and its impact on economic
growth, European Journal of Political Economy, 25, 15–29.
Lehkonen, H. and Heimonen, K. (2015) Democracy, political risks and stock market perfor-
mance, Journal of International Money and Finance, 59, 77-99.
Li, J., Born, J.A. (2006) Presidential election uncertainty and common stock returns in the
United States, Journal of Financial Research, 29, 609–622.
Smales, A.L. (2014) Political uncertainty and financial market uncertainty in an Australian con-
text, Journal of International Financial Markets, Institutions and Money 32, 415-435.

Oviedo University Press 121 ISSN: 2254-4380
Table 4. GARCH-M (1,1) estimates of Bank Returns with political instability indicators in mean and variance, dependent variable Bank Returns.
Parameter Australia Austria Belgium Canada Denmark Finland France Germany Greece Ireland Italy Japan Netherlands Portugal Spain Sweden UK US
Mean equation constant 0.239 -0.812 -23.284* -1.188 7.133 -18.821 12.245+ 19.329* -5.841 4.198 11.231 -1.845 -8.781 -15.636 -1.653 8.459 -1.587 -2.815
(0.052) (-0.128) (-2.159) (-0.166) (1.026) (-1.211) -1.945 (2.262) (-0.194) (0.228) (0.499) (-0.224) (-1.006) (-0.767) (-0.159) (0.456) (-0.247) (-0.488)
Bank Returns 0.137 0.162* -0.226+ -0.068 -0.143 -0.067 0.023 -0.196+ 0.065 -0.214 -0.027 0.132 0.252 -0.030 -0.114 -0.116 0.109 -0.154
(0.875) (2.065) (-1.731) (-0.404) (-0.578) (-0.527) (0.218) (-1.905) (0.536) (-0.686) (-0.186) (1.143) (1.604) (-0.288) (-0.669) (-0.585) (0.624) (-0.961)
Bank Returns (GARCH) -0.006 0,01 0.005 0.025 0.002 0.084+ 0.008 -0.071** -0.018 -0.000 0.004 -0.039 0.004 -0.001 0.017 0.061** -0.022 0.010
(-0.114) (0.594) (1.284) (0.764) (0.507) (1.966) (0.724) (-3.095) (-0.431) (-0.163) (1.094) (-1.589) (0.334) (-0.224) (1.029) (2.904) (-1.428) (0.438)
CORR 3.361 -0.061 4.458 -8.782 -5.019 1.278 -1.491 -33.307 -18.345 (0.542) (-0.008) (0.509) (-1.090) (-0.503) (0.118) (0.206) (-0.507) (-0.894) ELECT -7.948 -0.794 2.237 -0.350 -27.569* -2.149 -23.682** 3.076 2.979 3.806 -0.703 12.714 1.105 -5.843 10.859** -6.206
(-1.399) (-0.073) (0.239) (-0.039) (-2.792) (-0.346) (-24.164) (0.164) (0.151) (0.342) (-0.069) (0.557) (0.113) (-0.788) (18.552) (-0.319)
GOV 0.093 -3.271 35.383** 5.468 -1.476 5.919 4.486 3.183 10.599 6.407 20.106 14.642* 4.383 -10.269 5.706 3.956
(0.019) (-0.466) (14.376) (1.041) (-0.192) (0.522) (0.789) (0.022) (1.577) (1.300) (1.487) (2.249) (0.432) (-1.472) (1.004) (0.609)
RIOT 2.344 7.387 7.877 10.078 2.767 -23.321+ -83.322 -141.660* 5.915 -94.756 -22.063 -54.698 -406.369 -21.444 16.398 -1.289 12.473
(0.370) (1.142) (0.839) (0.496) (0.443) (-1.856) (-1.305) (-2.917) (0.248) (-1.178) (-0.749) (-1.412) (-1.307) (-0.451) (1.522) (-0.059) (1.049)
TERROR 8.448 -1.805 -4.801 19.136 -10.822 17.545 53.318 12.178 -38.455 15.001 8.524 -63.676 8.778 29.551* -4.688 -1.924
(0.909) (-0.040) (-0.353) (1.445) (-0.959) (0.625) (1.535) (0.223) (-0.363) (2.271 (1.064) (-1.489) (0.696) (2.242) (-0.329) (-0.245
Variance equation constant 29.147 101.649* 341.730+ 81.117 170,245 175.799* 85.051 274.771 398.435** 828.568 167.851 143.037** 99.145 645.878** 169.319 106.889 170.362 66.739
(0.480) (2.287) (1.773) (1.093) (0.942) (2.045) (0.773) (1.575) (3.750) (1.551) (0.812) (11.879) (0.761) (5.965) (1.191) (0.295) (1.029) (1.308)
ARCH(1) 0.080 0,073 0.882* -0.019 0,422 -0.087+ 1.341** -0.148+ -0.101+ 0.838 0.022 -0.221** 0.751 -0.055* 0.099 -0.042 0.605 0.107
(0.491) (1.032) (2.139) (-0.154) (0.988) (-1.938) (-2.725) (-1.822) (-1.849) (1.164) (0.334) (-3.155) (3.151) (-2.207) (0.560) (90.423) (1.632) (1.183)
GARCH(1) 0.566 0.703** 0.069 0.457 0,102 0.743** 0.180 0.406 0.556* 0.358 0.532 0.962** -0.012 0.816** 0.555+ -0.002 -0.200 0.811**
(0.479) (7.929) (0.696) (0.843) (0.401) (4.565) (1.132) (0.837) (2.401) (1.303) (1.358) (12.474) (-1.019) (8.736) (1.675) (-0.021) (-0.777) (6.186)
CORR 40.584 -31.803 -80.735 -6.126 -325.857+ -31.167 184.883 -746.573 113.452
(1.009) (-0.179) (-1.322) (-0.041) (-1.908) (-0.459) (1.164) (-0.904) (0.257)
ELECT -22.557 -164.524 -181.902 0.005 -280.839 -41.986 -1.349 -504.262** 1.588 -87.049** 24.856 -616.858** -44.678 26.637 -23.234 57.156
(-0.481) (-1.528) (-1.265) (0.001) (-1.296) (-1.103) (-0.005) (-2.869) (0.010) (-22.418) (0.129) (4.838) (-0.319) (0.213) (-0.128) (0.672)
GOV 16.070 -56.818 -307.993 -52.218 106.791 -91.019 -245.187 -0.959 -57.297** -119.999 -82.305** 16.150) -40.535 -102.505 -69.111
(0.237) (-0.979) (-1.367) (-1.313) (1.159) (-1.057) -181.002 (-1.200) (-0.016) (-10.899) (-0.694) (-3.850) (0.169) (-0.297) (-0.619) (-1.486)
RIOT 12.012 -53.211 -90.742 -0.296 56.784 -157.746 (-1.604) 2895.932 -824.900 -8.018 -111.259 -64.589 32.334 19.946 -43.219 -278.265 -168.478**
(-0.183) (-0.986) (-0.629) (-0.002) (0.369) (-0.505) -32.151 (1.192) (-1.321) (-0.009) (-1.114) (-0.075) (0.017) (0.048) (-0.221) (-0.657) (-3.856)
TERROR -17.930 24.170 -0.136 -14.013 -40.380 107.393 (-0.034) -7.674 -118.419 -1607.973 -143.029** -94.649 25.170 -28.155 -229.109 181.935 11.473
(-0.270) (0.078) (-0.001) (-0.074) (-1.174) (0.157) (-0.027) (-0.126) (-1.163) (-21.987) (-0.497) (0.294) (-0.266) (-1.666) (0.546) (0.312)
Diagnostics R-squared 0.085 0,045 -0.001 -0.034 0,037 0,109 -0.056 0.143 0.158 -0.158 0,121 0,022 0,133 0,180 0,074 0,298 0,090 0,025
Adj R-squared 0.009 -0,035 -0.084 -0.120 -0,058 0,035 -0.129 0.84 0.088 -0.237 0,035 -0,592 0,047 0,112 -0,017 0,228 0,015 -0,057
DW stat 2.054 1,821 1.362 1.688 1,734 1,939 1.946 1.731 1.827 1.314 1,728 1,987 1,738 1,929 1,893 1,908 1,802 1,550
Ljung-Box (4) 0,417 1,184 2,930 1.278 1,558 1,424 0,458 2.1949 2,061 9,412 3,686 5,398 0,735 1,523 1,445 0,880 5,312 3,398
(0.981) (0.881) (0.570) (0.120) (0.816) (0.84) (0.977) (0.700) (0.725) (0.152) (0.45) (0.249) (0.947) (0.823) (0.836) (0.927) (0.257) (0.493)
Arch (4) -0,663 0,256 -0,529 -0,364 -0,269 -0,837 0,152 -0,521 0,753 -0,001 -1,241 -1,489 -1,395 -0,100 -0,138 -1,424 0,062 0,531
(0.509) (0.799) (0.598) (0.717) (0.788) (0.406) (0.879) (0.604) (0.454) (0.999) (0.218) (0.141) (0.168) (0.919) (0.891) (0.159) (0.951) (0.597)
Notes: Values of t-statistics are in parentheses. Bold figures indicate statistical significant coefficients, ** denotes statistical significance at the 1% level (p<0.01), * denotes
statistical significance at the 5% level (p<0.05), + denotes statistical significance at the 10% level (p<0.1)

D. Asteriou and A. Sarantidi Political instability and stock market returns
122 5(4), 113-124, 2016
Table 5. GARCH-M (1,1) estimates of Stock Market Returns with political instability indicators in mean and variance, dependent variable Stock Market Returns.
Parameter Australia Austria Belgium Canada Denmark Finland France Germany Greece Ireland Italy Japan Netherlands Portugal Spain Sweden UK US
Mean equation constant -0.383 18.53** -4.961 6.950 15.349** 14.073 1.155 4.888 -31.792+ -0.668 25.255+ 6.289 0.614 10.492 1.913 23.202+ 1.402 7.267
(-0.118) (6.204) (-1.068) (1.449) (2.720) (0.855) (0.219) (0.681) (-1.689) (-0.103) (1.902) (1.010) (0.051) (0.299) (0.275) (1.731) (0.368) (1.627)
Stock Market Returns 0.026 0.048 0.040 0.223 0.041 0.012 0.189 -0.078 0.225** 0.004 0.020 0.117 -0.144 -0.142 -0.066 0.002 0.092 -0.015
(0.133) (0.399) (0.282) (1.605) (0.319) (0.074) (1.229) (-0.622) (2.654) (0.027) (0.126) (0.957) (-0.492) (-0.837) (-0.430) (0.011) (0.789) (-0.086)
Stock Market Returns (GARCH) -0.009 -0.143** 0.006 -0.062 -0.003 -0.002 0.007 -0.008 0.031 -0.005 0.035 -0.113* 0.006 -0.206+ 0.009 0.0145 0.007 -0.002
(-0.206) (-4.934) (0.336) (-1.527) (-0.348) (-0.115) (0.490) (-0.275) (1.038) (-0.340) (0.925) (-2.002) (0.340) (-1.779) (0.845) (0.454) (0.754) (-0.060)
CORR 15.795* -6.962 -8.785 -1.997 2.661 -3.519 -14.662 -58.281 -28.855
(2.047) (-1.027) (-0.576) (-0.297) (0.507) (-0.537) (-0.912) (-0.984) (-1.539)
ELECT -7.744 -7.158 9.953 3.627 -28.021** 5.994 0.899 10.151 -9.962 5.175 -9.632 22.375 2.719 -3.307 8.153* -22.523**
(-1.524) (-1.443) (1.411) (0.795) (-4.607) (0.598) (0.054) (0.804) (-0.839) (0.547) (-0.876) (0.715) (0.414) (-0.463) (2.367) (-3.747)
GOV 5.319 -7.723 16.791 0.553 -3.651 -9.514 -0.502 25.262 1.475 9.806* 17.166 8.662 8.677 -5.690* 0.049 -0.205
(1.482) (-0.898) (3.479) (0.187) (-0.686) (-0.467) (-0.095) (0.294) (0.380) (2.139) (1.448) (1.254) (1.256) (-2.311) (0.013) (-0.041)
RIOT -3.957 -1.346 6.055 -16.575 5.650 4.254 -22.951 -65.067+ 5.228 -121.712* -12.884 -87.888 -210.876 -13.513 11.684 -13.553 -0.638
(-0.487) (-0.256) (0.689) (-1.266) (1.137) (0.376) (-0.666) (-1.824) (0.447) (-2.146) (-0.475) (-1.194) (-0.990) (-0.563) (0.583) (-0.974) (-0.103)
TERROR 6.259 -31.491 -0.137 3.956 -21.683 5.578 57.886* 4.320 -82.918 2.949 8.167 -34.324 8.768 15.274 -1.544 -6.692
(1.010) (-11.654) (-0.014) (0.445) (-0.928) (0.210) (2.143) (0.271) (-1.228) (0.376) (0.665) (-0.778) (0.621) (0.821) (-0.362) (-0.825)
Variance equation
constant 11.259 68.302 21.354 55.538 32.659 190.596 13.162 5.548 231.302 59.374 131.236 91.79 128.996 128.369 63.019 133.464 29.596 21.275
(0.539) (1.333) (0.539) (0.863) (0.931) (0.532) (0.488) (0.555) (0.982) (0.955) (0.522) (1.099) (0.873) (0.545) (0.826) (0.899) (1.476) (0.996)
ARCH(1) 0.380** -0.103 0.201 -0.073 -0.106 -0.106 0.161** -0.123** -0.188** 0.299* 0.243 -0.194 0.131 -0.161** 0.060 0.128 0.685** 0.236
(2.537) (-1.534) (1.034) (-0.331) (-0.991) (-1.364) (159.319) (-4.839) (-3.057) (2.117) (0.863) (-1.308) (0.347) (-3.307) (0.573) (0.629) (2.608) (1.569)
GARCH(1) 0.426+ 0.568 0.590** 0.434 0.534 0.567 0.620** 1.087** 0.322 0.555** 0.002 0.227 0.590 0.404 0.520 0.403 0.374* 0.745**
(1.684) (0.977) (2.943) (0.609) (1.357) (0.833) (4.982) (2122.842) (0.586) (2.682) (0.004) (1.185) (1.444) (1.300) (0.795) (2.330) (5.321)
CORR 26.041 -36.139 -3.008 90.195+ -19.925 -121.393 -0.977 -1.994 4.143
(0.454) (-0.863) (-0.022) (1.780) (-0.530) (-1.379) (0.204) (-0.006) (-0.005) (0.019)
ELECT 37.155 -50.219 -53.529+ -62.089 2.562 -2.889 -8.711 -132.542 -114.569 32.028 -0.004 -6.559 -16.052 38.712 24.788 -26.898
(0.988) (-0.827) (-1.845) (-0.858) (0.061) (-0.021) (-0.133) (-0.655) (-0.583) (0.216) (-0.002) (-0.030) (-0.240) (0.504) (1.335) (-1.231)
GOV -5.230 33.406 -60.662+ 14.466 146.509 -5.555 15.950* 35.716 17.262 -6.277 -0.797 12.039 11.975 -138.028 -46.329+ -10.387
(-0.262) (0.307) (-1.696) (0.565) (1.209) (-0.025) (2.504) (0.023) (0.306) (-0.121) (-0.006) (0.315) (0.189) (-1.090) (-1.816) (-0.436)
RIOT 27.141 -44.671 34.908 8.693 10.426 -121.229* -220.385** 78.831 -43.625 515.438 -0.971 -66.310 -3.956 -51.383 -39.712 52.792 -51.679
(0.623) (-0.505) (0.498) (0.587) (0.318) (-2.003) (-4.550) (0.227) (-0.658) (0.614) (-0.003) (-0.071) (-0.002) (-0.201) (-0.441) (0.560) (-1.636)
TERROR -25.547 175.859 -19.653 3.692 -43.450 -109.979 2.969 -86.755* 97.849 -6.435 -182.941 -832.315** -71.080 1.504 23.601 -9.793
(-0.575) (1.215) (-0.227) (0.092) (-0.136) (-0.869) (0.008) (-2.049) (0.229) (-0.526) (-1.134) (-2.687) (-1.190) (0.012) (0.889) (-0.169)
Diagnostics
R-squared 0.056 0.144 -0.004 0.039 0.137 0.052 -0.026 -0.023 0.121 0.005 0.018 0.112 0.112 0.073 0.054 0.106 -0.039 0.011
Adj R-squared -0.022 0.073 -0.088 -0.040 0.052 -0.027 -0.096 -0.093 0.047 -0.062 -0.079 0.038 0.025 -0.005 -0.039 0.018 -0.125 -0.071
DW stat 1.631 1.669 1.859 2.221 1.909 2.154 2.177 1.845 2.165 1.791 1.817 1.969 1.819 1.602 2.086 1.984 1.897 1.847
Ljung-Box (4) 0.855 1.645 3.377 4.244 3.341 1.768 26.786 1.127 1.738 2.459 0.699 8.269 1.599 3.438 1.579 1.930 1.804 1.131
(0.931) (0.801) (0.497) (0.374) (0.503) (0.778) (0.141) (0.890) (0.784) (0.652) (0.951) (0.142) (0.809) (0.487) (0.813) (0.749) (0.772) (0.889)
Arch (4) -1.407 0.488 -1.262 -0.735 -1.161 0.607 -1.161 -0.751 1.369 -0.554 -1.003 -1.495 0.100 0.019 -1.095 0.015 -0.218 -0.905
(0.164) (0.627) (0.211) (0.466) (0.249) (0.546) (0.247) (0.455) (0.175) (0.581) (0.319) (0.139) (0.920) (0.984) (0.277) (0.988) (0.828) (0.368)
Notes: Values of t-statistics are in parentheses. Bold figures indicate statistical significant coefficients, ** denotes statistical significance at the 1% level (p<0.01), * denotes
statistical significance at the 5% level (p<0.05), + denotes statistical significance at the 10% level (p<0.1)
D. Asteriou and A. Sarantidi Political instability and stock market returns
123 5(4), 113-124, 2016
Appendix A.
Components of political instability indicators.
Table A1. Components of political instability indicators for each country.
COUNTRY GOV CORR TERROR ELECT RIOT
Australia
Regulatory Quality Control of corruption Number of victims per incident Number of cabinet changes Strikes
Rule of Law CPI index of corruption Number of terrorist incidents per year Number of legislative elections Riots Government effectiveness Government crises Assassinations
Austria
Government crises Rule of Law Number of cabinet changes Riots
Government effectiveness CPI index of corruption Number of legislative elections Strikes
Voice and accountability Annual number of anti-government
demostrations
Belgium
Government effectiveness Civil liberties Number of terrorist incidents per year Number of legislative elections Riots
Voice and accountability CPI index of corruption Number of victims per incident Number of cabinet changes Annual number of anti-government
demostrations
Control of corruption Guerrila warfare
Canada
Voice and accountability CPI index of corruption Number of terrorist incidents per year Number of legislative elections Annual number of anti-government
demostrations Regulatory Quality Purges Number of victims per incident Number of cabinet changes Riots
Rule of Law
Control of corruption
Government effectiveness
Denmark
Government effectiveness Control of corruption Number of terrorist incidents per year Number of cabinet changes Annual number of anti-government
demostrations Rule of Law CPI index of corruption Number of victims per incident Number of legislative elections Riots
Government crises
Finland
Government effectiveness Control of corruption Number of terrorist incidents per year Annual number of anti-government de-
mostrations
Regulatory Quality Voice and accountability Number of victims per incident Number of legislative elections
Rule of Law CPI index of corruption
Civil liberties
Political rights index
France
Rule of Law Regulatory Quality Number of terrorist incidents per year Number of cabinet changes Annual number of anti-government
demostrations
Voice and accountability Civil liberties Number of victims per incident Number of legislative elections Assassinations
Government crises Control of corruption
Germany
Government effectiveness Control of corruption Number of constitutional changes Revolutions
Regulatory Quality Rule of Law Number of cabinet changes Strikes
Voice and accountability CPI index of corruption Number of legislative elections Riots Civil liberties
Greece
Legislative Effectiveness Voice and accountability Number of terrorist incidents per year Number of legislative elections Riots
Civil liberties Control of corruption Number of victims per incident Number of cabinet changes Annual number of anti-government
demostrations

D. Asteriou and A. Sarantidi Political instability and stock market returns
124 5(4), 113-124, 2016
Political rights index Government effectiveness Strikes Purges CPI index of corruption
Ireland
Rule of Law CPI index of corruption Assassinations Number of cabinet changes Annual number of anti-government
demostrations
Government effectiveness Control of corruption Number of terrorist incidents per year Number of legislative elections Government crises Regulatory Quality Number of victims per incident
Italy
Rule of Law CPI index of corruption Revolutions Number of cabinet changes Riots
Government effectiveness Regulatory Quality Assassinations Government crises Annual number of anti-government
demostrations
Voice and accountability Number of terrorist incidents per year Number of legislative elections Purges
Japan
Regulatory Quality Control of corruption Assassinations Number of legislative elections Strikes
Government effectiveness CPI index of corruption Number of victims per incident Guerrila warfare
Voice and accountability Civil liberties Annual number of anti-government
demostrations
Riots
Netherlands
Government effectiveness Regulatory Quality Number of terrorist incidents per year Number of legislative elections Annual number of anti-government
demostrations
Rule of Law Control of corruption Number of victims per incident Number of cabinet changes Riots Voice and accountability CPI index of corruption Government crises
Portugal
Voice and accountability Control of corruption Number of terrorist incidents per year Legislative Effectiveness Political rights index
Rule of Law Coups D'etat Number of victims per incident Number of legislative elections Annual number of anti-government
demostrations Regulatory Quality Purges Assassinations Riots
Government effectiveness Government crises
Spain
Legislative Effectiveness Political rights index Revolutions Number of cabinet changes Purges Civil liberties Control of corruption Number of victims per incident Number of legislative elections Strikes
Voice and accountability Regulatory Quality Assassinations
Rule of Law Government effectiveness
Sweden
Regulatory Quality Voice and accountability Number of terrorist incidents per year Number of cabinet changes Strikes
Rule of Law CPI index of corruption Number of victims per incident Number of legislative elections Annual number of anti-government
demostrations
Government crises Control of corruption Assassinations Number of constitutional changes
Government effectiveness
United Kingdom
Government effectiveness Control of corruption Revolutions Number of legislative elections Riots Regulatory Quality CPI index of corruption Guerrila warfare Number of cabinet changes Assassinations
Voice and accountability Number of terrorist incidents per year Government crises Annual number of anti-government
demostrations Number of victims per incident Strikes
United States
Voice and accountability CPI index of corruption Guerrila warfare Number of cabinet changes Strikes
Government effectiveness Control of corruption Number of terrorist incidents per year Number of legislative elections Riots
Rule of Law Number of victims per incident Government crises Annual number of anti-government
demostrations
Regulatory Quality Assassinations