Embed Size (px)
Citation preview

Pollution, Identification and Correction Program
Photo credit: Karleigh Gomez; Hans Daubenberger extracting water sample at Duckabush River flow wire below Collins
Campground.
Final Report
2017
CFDA # 66.123 Puget Sound Action Agenda: Technical Investigations and Implementation Assistance
Program DOH Contract N20718WDOH and Ecology Pathogens Prevention, Reduction, and Control PIC
Programs Port Gamble Bay/Hood Canal PIC Program

Port Gamble S’Klallam Pollution, Identification, and Correction Final Report 2017
Page 1
Acknowledgements
This Pollution Identification and Correction (PIC) Program document was developed by staff of the Port Gamble S’Klallam Tribe (PGST).
PGST PIC Program was made possible through funding from the Washington State Department of Health (WDOH) and the United States Environmental Protection Agency (USEPA) National Estuary Program (NEP), with significant coordination with Washington State Department of Ecology (Ecology).
Photo Credit: Devon Hayes, PGST reservation shellfish opening during sampling event on June 19, 2015

Port Gamble S’Klallam Pollution, Identification, and Correction Final Report 2017
Page 2
Contents Acknowledgements ....................................................................................................................................... 1
1 Introduction ............................................................................................................................................... 4
2 Regulatory Criteria Standards .................................................................................................................... 5
Non-tribal lands .................................................................................................................................... 5
PGST Tribal Lands .................................................................................................................................. 6
Project Administration and Management ............................................................................................ 6
3 Project Descriptions ................................................................................................................................... 7
Shoreline Surveys .................................................................................................................................. 7
MST Literature Review and Study ......................................................................................................... 8
Temporal Investigation ......................................................................................................................... 8
Tryptophan and Optical Brighteners ..................................................................................................... 8
Implementation Summary .................................................................................................................... 9
4 Education and Outreach ............................................................................................................................ 9
5 References ............................................................................................................................................... 10
Photo Credit: Courtney Ewing, Aurora Robles digging clams for the Port Gamble S’Klallam Early Childhood Program Yearly Celebration Clam
Bake.

Port Gamble S’Klallam Pollution, Identification, and Correction Final Report 2017
Page 3
Acronyms and Abbreviations
autosampler Hach Sigma SD 900 Portable Sampler
cfu colony forming units
CDX Central Data Exchange
EC Escherichia coli bacteria
E. coli Escherichia coli bacteria
Ecology Washington State Department of Ecology
FC fecal coliform bacteria
FEATS Financial and Ecosystem Accounting Tracking System
GIS Geographic Information System software
GMV geometric mean value
GPS Global Positioning System
HCCC Hood Canal Coordinating Council
HCRPIC Hood Canal Regional Pollution Identification and Control Program
KPHD Kitsap Public Health District
MCPH Mason County Public Health
NPDES National Pollution Discharge Elimination System (permitting program)
NTR National Toxics Rule
OSS onsite sewage system
PGST Port Gamble S’Klallam Tribe
PIC Pollution Identification and Correction
PSAMP Puget Sound Assessment and Monitoring Program
QA Quality assurance
QAPP Quality Assurance Project Plan
QC Quality control
RPD Relative percent difference
RSD Relative standard deviation
SOP Standard Operating Procedure
STORET USEPA Storage and Retrieval database
TMDL total maximum daily value
TOD time of day
Tribe Port Gamble S’Klallam Tribe
USEPA U.S. Environmental Protection Agency
WAC Washington Administrative Code
WDFW Washington Department of Fish and Wildlife
WDOH Washington Department of Health
WRIA Water Resources Inventory Area
WSTMP Washington State Toxics Monitoring Program
YSI Yellow Springs Instruments

Port Gamble S’Klallam Pollution, Identification, and Correction Final Report 2017
Page 4
1 Introduction
The Port Gamble S’Klallam Tribe’s reservation is home to more than 1,200 tribal members. Located near
the northern end of the Kitsap Peninsula (Figure 1), the reservation lands rise from Admiralty Inlet and
Port Gamble Bay. The reservation is mostly forested, contains approximately 2.5 miles of marine
shoreline, and receives approximately 20 inches of rain per year. Port Gamble Bay is one of the largest
and most productive marine areas open for commercial and recreational shellfish harvest in Kitsap
County (see WA DOH shellfish harvest area classification map
https://fortress.wa.gov/doh/eh/maps/biotoxin/biotoxin.html).
Figure 1. Overview maps of the Kitsap Peninsula and the PGST Reservation
Shellfish and other aquatic organisms along streams and shorelines within the PGST Usual and
Accustomed Areas (U&A, Appendix A) have been negatively affected by nutrient and fecal pollution
from failing onsite sewage systems (OSS) and other sources. Closure of shellfish beds due to fecal
pollution, in particular, has prompted PGST and local governments to develop and implement marine
and freshwater monitoring programs.
Pollution Identification and Control (PIC) programs in the Hood Canal region monitor marine and fresh
water bodies, mainly for fecal coliform (FC) and/or Escherichia coli (EC) bacteria. Some of these
programs also measure nutrient concentrations and ancillary environmental parameters such as
temperature, salinity, specific conductance, pH, turbidity, and dissolved oxygen.
PGST is a member of the Hood Canal Coordinating Council (HCCC), whose mission is to protect and
enhance the environmental and economic health of the Hood Canal and to support the Puget Sound

Port Gamble S’Klallam Pollution, Identification, and Correction Final Report 2017
Page 5
Action Agenda (PSP, 2014). The HCCC more
recently developed the Hood Canal Regional
Pollution, Identification and Control
Program (HCRPIC) to monitor water quality.
PGST serves on the HCRPIC Pilot Guidance
Group to provide oversight, guidance and
structure for consistent procedures and
technical assistance for the HCRPIC program
(Banigan, 2015).
PGST’s main role in the HCRPIC program is
to research data gaps identified at HCRPIC
meetings and during discussions of data
submitted by its members. To do this, the
PGST developed its own Pollution,
Identification, and Correction program. This
report describes PIC-related activities that have occurred at freshwater sites, both upland and near
marine shorelines, within the reservation and throughout the Hood Canal including Water Resource
Inventory Areas (WRIAs) 14-17. The study area and its surroundings are U&A harvest areas of the Port
Gamble S’Klallam Tribe protected by the Point-No-Point Treaty of 1855.
Recent HCCC meetings and discussions about data shared by its members, identified issues that needed
to be addressed by literature reviews or conducting “gap” analyses related to identifying sources of E.
coli or fecal coliform bacteria.
This report and appendices describe PGST’s PIC program development including wet and dry season
sampling, literature reviews, a microbial source tracking (MST) study, and a temporal sampling
investigation.
2 Regulatory Criteria Standards
Non-tribal lands Washington State delegates the responsibility for identifying and correcting nonpoint pollution to local
governments (KPHD, 2014a/b). The regulatory authorities in the Hood Canal region include Jefferson
County Public Health (JCPH), Kitsap Public Health District (KPHD), and Mason County Public Health and
Human Services (MCPH). These jurisdictions are given flexibility to implement water quality protection
programs, e.g., PIC programs, using different tools. For example, these regulatory authorities may
choose to measure EC, FC and/or nutrients as indicators of fecal pollution. FC is still a common analysis,
but federal guidance suggests EC (a species of FC bacteria specific to humans and other warm-blooded
animals) and enterococci are better indicators of health risk from water contact (USEPA, 2012).
Staff from local governments compared PIC monitoring results to current Washington State water
quality standards to determine appropriate response actions. HCRPIC guidance and regional agreements
Photo Credit: Katy Davis, Hans Daubenberger taking water sample at the
marine sample stations outside the Duckabush River Estuary.

Port Gamble S’Klallam Pollution, Identification, and Correction Final Report 2017
Page 6
state that Hood Canal drainages with FC exceeding 200 colony forming units (cfu) per 100 milliliters (mL)
or EC exceeding 100 cfu/100 mL, must be sampled at least two additional times for confirmation. The
Geometric Mean Value (GMV) of the three (or more) sample results is then calculated. If the GMV for FC
exceeds 500 cfu/100mL or 320 cfu/100mL for EC, further investigation is required.
PGST Tribal Lands The Port Gamble S’Klallam Tribe is responsible for identifying and correcting nonpoint pollution on tribal
lands. To this end, PGST collects and analyzes water
samples from the reservation for EC concentrations.
Collection and analysis methods are comparable to those
used by other Hood Canal Regional PIC programs (Banigan,
2015). PGST staff compared its EC results to Tribal Water
Quality Standards adopted to afford stringent levels of
protection within the reservation (PGST, 2002):
Waters designated for recreational and cultural use shall
not contain concentrations of EC bacteria exceeding a 30-
day GMV of 126 cfu / 100 mL (based on a minimum of 5
samples).
Water designated for shellfish and crustacean spawning,
rearing, and harvesting shall not contain FC levels
exceeding a GMV of 14 cfu / 100 mL and no more than 10
percent of the samples used to calculate the GMV shall
contain 43 cfu / 100 mL.
Project Administration and Management PGST Natural Resources staff was primarily responsible for managing and implementing the PGST PIC
program. PGST prepared and submitted necessary documentation for planning and reporting, submitted
semi-annual reports to the USEPA Puget Sound Financial and Ecosystem Tracking System (FEATS), and
facilitated data reporting to USEPA’s STOrage and RETrieval (STORET) website through the tribe’s
network node.
PGST administrated the PIC Program on the reservation and worked closely with Kitsap County Public
Health District (KPHD) to plan and conduct Shoreline Surveys in the wet and dry seasons, as well as
respond to elevated bacteria levels. PGST coordinated contracts with Spectra Laboratories – Kitsap, LLC
for sample analysis and an environmental contractor for assistance with sampling and other program
needs.
PGST led planning for regional gap studies based on available pollution trend analyses. PGST worked
with county staff to prioritize sample locations for the temporal investigation, MST study, and the
optical brightener and tryptophan evaluation.
Photo Credit: Courtney Ewing, Therron Sullivan digs
cockles at Point Julia for Port Gamble S’Klallam Early
Childhood Program’s Yearly Celebration Clam Bake.

Port Gamble S’Klallam Pollution, Identification, and Correction Final Report 2017
Page 7
3 Project Descriptions
The Port Gamble S’Klallam Tribe (PGST) has traditionally harvested shellfish for commercial, subsistence,
and ceremonial purposes within areas that are currently prohibited and unclassified for harvest by State
and Federal programs. PGST developed coordinated strategies to improve local PIC programs’ ability to
effectively protect shellfish beds within the tribal U&A harvest areas in Port Gamble Bay and the
northern Hood Canal region. The following actions are the result of this undertaking.
Shoreline Surveys PGST PIC Program conducted wet and dry season shoreline surveys on the PGST reservation in 2015. The
wet season survey was conducted on February 24 and the dry season survey on September 25. KPHD
was a critical partner for the shoreline surveys and provided valuable support to PGST personnel and
contractors throughout the planning, field work, laboratory coordination, sample results review. PGST
reservation shoreline survey results filled a lingering data gap in water quality records and allowed KPHD
to assess and account for all shorelines in Kitsap County.
The wet season shoreline survey results led to one hotspot confirmation. PGST coordinated with KPHD
on response. KPHD and PGST staff led a home visit and dye test in April 2015. The results of this dye test
were negative, meaning the source of pollution remained unconfirmed, and subsequent monitoring
results showed that water quality improved. Dry season shoreline survey bacteria results yielded no
hotspot confirmation and required no investigation (See Appendix B).
A second hotspot investigation was initiated in response to a
sewer overflow on the PGST reservation sewer system. PGST
determined the source of the spill to be near Bud Purser Lane
and began sampling streams in the vicinity. PGST worked with
KPHD to confirm the hotspot and began a dye testing strategy
for the neighborhood. As part of this ongoing investigation,
PGST deployed charcoal filters in the impacted stream to test
background conditions. After this, PGST deployed new
charcoal filters and conducted dye tests in the lowest
elevation houses. After the first dye test period, new charcoal
filters were deployed and dye tests conducted on a new set of
houses at the next higher elevation in the neighborhood.
PGST then continued weekly sampling and coordinated with
US Health and Human Services (USHHS). PGST closed the
associated beach to shellfish harvest to protect tribal members until water quality improves sufficiently.
As of March 2017, correcting this pollution source on the reservation is an ongoing effort.
Photo Credit: Devon Hayes, Due to elevated levels
of FC and EC detected in Bud Purser Lane stream
this popular shellfish harvest location was forced
to close.

Port Gamble S’Klallam Pollution, Identification, and Correction Final Report 2017
Page 8
MST Literature Review and Study
To date, water quality monitoring and management practices have relied heavily on fecal
indicator bacteria (FIB), including Escherichia coli and Enterococcus, which have low pathogenic
potential but abundant presence in sewage and feces. FIB are therefore suggestive of pathogen
presence. However, conventional indicators cannot discern between human and animal sources
because FIB are present in the feces of most mammals and birds. It is important to distinguish
between human and animal derived fecal pollution because of the heightened health risks
associated with human sewage and the different remediation strategies for mitigating
contamination from sewage versus surface runoff carrying animal waste. PGST conducted a
literature review of published methods which have been used to identify microbial sources (see
Appendix C). This resulted in the development of a DNA-based microbial source tracking study
utilizing PCR and high throughput sequencing. Results of the microbial source tracking study are
expected to be available Spring 2017.
Temporal Investigation
PGST coordinated sample collection of EC over a 24-hour period, to test for temporal variation
in sample results. PGST collected water samples using a Hach Sigma SD 900 Portable Sampler
(autosampler) which collected one sample per hour during the 24-hour sampling periods.
Variability in results between samples was enough to warrant a second test, to determine the
range of variability between split and replicate samples. A second collection period was
coordinated with personnel collecting samples by hand four times a day over 72 hours.
Temporal studies were conducted on the PGST Reservation, and in Jefferson County at Irondale
Creek and the Duckabush River. A time of day study was planned at Lofall Creek in Kitsap
County during the wet season of 2015-2016 however was eventually canceled after excessive
rainfall. Results showed that EC levels did vary significantly with time of day, beyond the
variability found between split and replicate samples.
PGST recommends that future projects looking to utilize an autosampler should consider a
model which can be easily dismantled and autoclaved. Additionally, unless the autosampler is
going to be deployed regularly at a set location with proper infrastructure to house the
equipment, using personnel to collect samples by hand is likely the more practical approach. For
detailed methods and results of the temporal investigation, see Appendix D.
Tryptophan and Optical Brighteners
PGST used a Turner Designs Cyclops 7 Submersible Fluorometer with tryptophan and optical
brightener sensors to determine if in situ measurements of tryptophan and optical brighteners are
a useful proxy for identifying EC hotspots. Results showed no correlation between optical
brighteners and EC at the three temporal investigation sites where the fluorometer was deployed.
At one of the three sites, there was a weak correlation between EC and tryptophan (See
Appendix D).

Port Gamble S’Klallam Pollution, Identification, and Correction Final Report 2017
Page 9
Implementation Summary Table 1: Number of samples analyzed at each survey site
Shellfish
Growing
Area &
County
Site PGST
Shoreline
Survey
24-Hour EC
Sampling
72-Hour EC
Sampling
DNA Total
EC and
FC
Port Gamble
Bay, Kitsap
PGST
Reservation 70 17 99 1 120
Port
Townsend,
Jefferson
Irondale Creek
- 14 - 1 16
Hood Canal
2, Kitsap
Lofall Creek
- - - 2 14
Hood Canal
3, Jefferson
Dosewallips
River - - - 8 14
Hood Canal 3
Jefferson
Duckabush
River - - 104 12 122
Totals 70 31 203 24 286
4 Education and Outreach
Attending Puget Sound PIC workshops and regional meetings was valuable to PGST Natural Resources
personnel to understand the broad program opportunities and educational options available. PGST
maintained records of meeting agendas and notes in the Tribe’s project files. With the understanding
gained from these networking opportunities, PGST was able to consider the best ways to reach its
audience.
PGST identified two priority audiences, tribal members, and regional policy-makers. To engage with
these audiences, PGST developed its own outreach materials. This encouraged PGST to increase its field
documentation, associated training and photographs of relevant field activities in U&A areas with actual
PGST tribal members and personnel. PGST prepared outreach materials for social media, such as the
PGST website and Facebook page. The materials are PowerPoint slides that stand alone to introduce
PGST PIC priorities. Additionally, PGST created two PowerPoint presentations that are tailored to the
tribal members and policy-makers.
PGST and KPHD conducted outreach and education with property owners and onlookers during field
sampling events. Natural Resources Department staff offered presentations to college and grade school
students on the reservation. The newly strengthened relationship with KPHD provided excellent
networking opportunities for engaging with local policy-makers.

Port Gamble S’Klallam Pollution, Identification, and Correction Final Report 2017
Page 10
5 References
Banigan, L., 2015. Quality Assurance Project Plan: Hood Canal Regional Pollution Identification
and Correction Phase 2 – Implementation. Prepared for: Hood Canal Coordinating Council
and Washington State Department of Health. Available: This document can be obtained
from Hood Canal Coordinating Council 17791 Fjord Drive NE, Suite 122 Poulsbo, WA
98370.
Kitsap Public Health District (KPHD), et al., 2014a. Pollution Identification and Correction
(PIC) Program Guidance. Prepared in coordination with Washington State Departments of
Health and Ecology. February.
Available: http://hccc.wa.gov/AquaticRehabilitation/Regional+PIC/.
Kitsap Public Health District (KPHD), 2014b. Kitsap County Shoreline Pollution Identification and
Correction. Prepared for Ecology, October.
Port Gamble S’Klallam Tribe (PGST), 2002. Water Quality Standards for Surface Waters Resolution
Number 02-A-088. Adopted August 13, 2002.
Available: https://www.pgst.nsn.us/images/law-and-order/water-quality-standards.pdf.
Puget Sound Partnership (PSP), 2014. The 2015/2015 Action Agenda for Puget Sound.
Available: http://www.psp.wa.gov/2014_action_agenda_download.php.
U.S. Environmental Protection Agency (USEPA), 2012. Water Monitoring and Assessment: 5.11
Fecal Bacteria. March 6. Available: http://water.epa.gov/type/rsl/monitoring/vms511.cfm.


Appendix B. Shorelines Surveys
Station Date Time E.coli Lat Long
(units) inches inches inches
MPN/10
0ml
(Standard) 24hr 48hr 72 hr 126.0
#PGS1 02/24/2015 11:56 1.0 47.83886 -122.56671
#PGS1 09/25/2015 08:33 9.5 47.83886 -122.56671
#PGS10 02/24/2015 12:46 11.0 47.84202 -122.56722
#PGS10 02/24/2015 12:46 3.1 47.84202 -122.56722
#PGS11 02/24/2015 12:51 1.0 47.84221 -122.56745
#PGS11 09/25/2015 09:01 6.1 47.84221 -122.56745
#PGS12 02/24/2015 12:56 64.4 47.84257 -122.56768
#PGS12 09/25/2015 09:09 12.0 47.84257 -122.56768
#PGS13 02/24/2015 13:05 4.1 47.84310 -122.56783
#PGS13 09/25/2015 09:16 2.0 47.84310 -122.56783
#PGS14 02/24/2015 13:14 0.5 47.84395 -122.56814
#PGS15 02/24/2015 13:20 14.5 47.84428 -122.56817
#PGS15 09/25/2015 09:30 31.3 47.84428 -122.56817
#PGS16 02/24/2015 13:27 2.0 47.84506 -122.56823
#PGS16 09/25/2015 09:34 21.6 47.84506 -122.56823
#PGS17 02/24/2015 13:33 4.1 47.84520 -122.56827
#PGS17 09/25/2015 09:41 1.0 47.84520 -122.56827
#PGS18 02/24/2015 13:40 26.2 47.84572 -122.56856
#PGS19 02/24/2015 13:50 4.1 47.84699 -122.56920
#PGS19 09/25/2015 09:56 10.8 47.84699 -122.56920
#PGS19 09/25/2015 09:56 13.2 47.84699 -122.56920
#PGS2 02/24/2015 12:03 2.0 47.83921 -122.56658
#PGS20 02/24/2015 13:57 27.5 47.84787 -122.56989
#PGS21 02/24/2015 14:07 2.0 47.84926 -122.57054
#PGS21 09/25/2015 10:06 7.2 47.84926 -122.57054
#PGS22 02/24/2015 14:13 52.0 47.84998 -122.57047
#PGS22 09/25/2015 10:14 21.1 47.84998 -122.57047
#PGS23 02/24/2015 14:18 2.0 47.85051 -122.57041
#PGS23 09/25/2015 10:21 3.0 47.85051 -122.57041
#PGS24 02/24/2015 14:22 461.1 47.85069 -122.57050
#PGS24 03/26/2015 13:13 410.6 47.85069 -122.57050
#PGS24 03/26/2015 13:25 686.8 47.85069 -122.57050
#PGS24 04/21/2015 13:11 4.1 47.85069 -122.57050
#PGS24 09/25/2015 10:26 48.9 47.85069 -122.57050
#PGS25 02/24/2015 14:27 2.0 47.85098 -122.57069
#PGS25 09/25/2015 10:31 5.2 47.85098 -122.57069
#PGS26 02/24/2015 14:30 9.6 47.85123 -122.57074
#PGS26 09/25/2015 10:35 114.5 47.85123 -122.57074
#PGS27 02/24/2015 14:39 74.8 47.85123 -122.57074
#PGS27 09/25/2015 10:39 9.6 47.85123 -122.57074
#PGS28 02/24/2015 14:42 7.4 47.85261 -122.57131
#PGS28 09/25/2015 10:44 3.1 47.85261 -122.57131
#PGS29 02/24/2015 14:49 2.0 47.85416 -122.57242
#PGS29 02/24/2015 14:49 5.2 47.85416 -122.57242
#PGS29 09/25/2015 10:50 34.1 47.85416 -122.57242
#PGS29 09/25/2015 10:50 59.1 47.85416 -122.57242
#PGS3 02/24/2015 12:12 3.1 47.83959 -122.56668
#PGS30 02/24/2015 14:50 6.3 47.85421 -122.57253
#PGS31 02/24/2015 15:00 1.0 47.85543 -122.57543
#PGS31 09/25/2015 11:02 2420.0 47.85543 -122.57543
#PGS32 02/24/2015 15:09 4.0 47.85833 -122.57380
#PGS33 02/24/2015 15:14 4.0 47.85985 -122.57347
#PGS33 09/25/2015 11:15 10.0 47.85985 -122.57347
#PGS34 02/24/2015 15:18 1.0 47.86066 -122.57322
#PGS34 09/25/2015 11:21 7.3 47.86066 -122.57322
#PGS35 02/24/2015 15:24 0.5 47.86298 -122.57254
#PGS35 09/25/2015 11:30 2.0 47.86298 -122.57254
#PGS36 02/24/2015 15:27 0.5 47.86372 -122.57255
#PGS36 09/25/2015 11:36 9.7 47.86372 -122.57255
#PGS4 02/24/2015 12:18 3.1 47.83996 -122.56669
#PGS5 02/24/2015 12:23 45.9 47.84015 -122.56680
#PGS6 02/24/2015 12:27 9.7 47.84038 -122.56692
#PGS7 02/24/2015 12:33 150.0 47.84061 -122.56700
#PGS8 02/24/2015 12:38 3.1 47.84109 -122.56719
#PGS9 02/24/2015 12:42 12.1 47.84157 -122.56708
#PGS9 09/25/2015 08:50 57.3 47.84157 -122.56708
Large flow under blackberries /
Small creek, flows east to west /
Composite-2 white PVC pipes /
Bank flow, trees above /
Small creek at bridge /
Little Boston Creek /
Bank flow, blackberries, lots of wood /
Seep under alders /
Small flow next to large tree /
Small seep, big stump, alders /
Seep under alders /
Composite (2 flows)-Either side of cedar /
Small creek, flowing north to south along beach /
Flow parallel to beach, cedars /
Wetland drain-blue A-frame-salinity 21 / Salinity-21-Ran as marine water
Wetland drain-salinity 35 / Salinity-35-Ran as marine water
Bank flow under blackberries /
Seep from bank, alders /
Small creek, downed trees /
Bank flow, blackberries, lots of wood /
Bank flow under blackberries /
Flow over alder roots off bank /
Seep under clay bank, blackberries /
Flow under large, downed alder /
Small stream, root ball. /
Bank flow near tire /
Composite (2)-Flow under alders & flow to west /
Flow down clay bank, cars above /
Flow over clay bank, downed tree /
Small creek, flows east to west /
Middle Creek /
Little Boston Creek /
Small flow near roots /
Flow over clay bank, downed tree /
Small flow next to large tree /
Small creek, downed trees /
Small creek, stairs to west /
Small creek, downed trees /
Seep from bank, alders /
Wetland drain-blue A-frame-salinity 21 /
Small seep, roots, concrete blocks /
Flow down bank, reeds, horsetail /
Bank flow near tire /
Bank flow under blackberries / 2nd Confirmation
Little Boston Creek /
Composite (2 flows)-Either side of cedar /
Flow over clay bank, algae /
Flow parallel to beach, cedars /
Bank seep, alders above /
Small stream, root ball. /
Bank flow, trees above /
Hill flow & flow to west, either side of tree /
Flow under large, downed alder /
Seep under clay bank, blue tarp above /
Small creek at bridge /
Flow down clay bank, cars above /
Composite (2)-Flow under alders & flow to west /
Bank flow under blackberries / 1st Confirmations
Little Boston Creek /
Shoreline Monitoring Results and Rainfall Data
Seep under clay bank, blackberries /
Middle Creek /
Bank flow under blackberries /
Rainfall totals
Small creek, flowing north to south along beach /
(Use Ctrl-Shift-D to toggle)
Flow over clay bank, algae /
Duplicates Displayed
Flow under blackberries, black flex /
Flow over alder roots off bank /
Notes

Station: #PGS1-N47.83886° W122.56671°
Description: Seep under clay bank, blackberries
Date EC/100 ml Sample type
2/24/2015 1 Routine
Station: #PGS2-N47.83921° W122.56658°
Description: Seep under clay bank, blue tarp above
Date EC/100 ml Sample type
2/24/2015 2 Routine
Station: #PGS3-N47.83959° W122.56668°

Description: Small flow near roots
Date EC/100 ml Sample type
2/24/2015 3.1 Routine
Station: #PGS4-N47.83996° W122.56669°
Description: Small seep, big stump, alders
Date EC/100 ml Sample type
2/24/2015 3.1 Routine
Station: #PGS5-N47.84015° W122.56680°

Description: Small seep, roots, concrete blocks
Date EC/100 ml Sample type
2/24/2015 45.9 Routine
Station: #PGS6-N47.84038° W122.56692°
Description:
Date EC/100 ml Sample type
2/24/2015 9.7 Routine
Station: #PGS7-N47.84061° W122.56700°

Description: Large flow under blackberries
Date EC/100 ml Sample type
2/24/2015 150 Routine
Station: #PGS8-N47.84109° W122.56719°
Description: Flow down bank, reeds, horsetail
Date EC/100 ml Sample type
2/24/2015 3.1 Routine
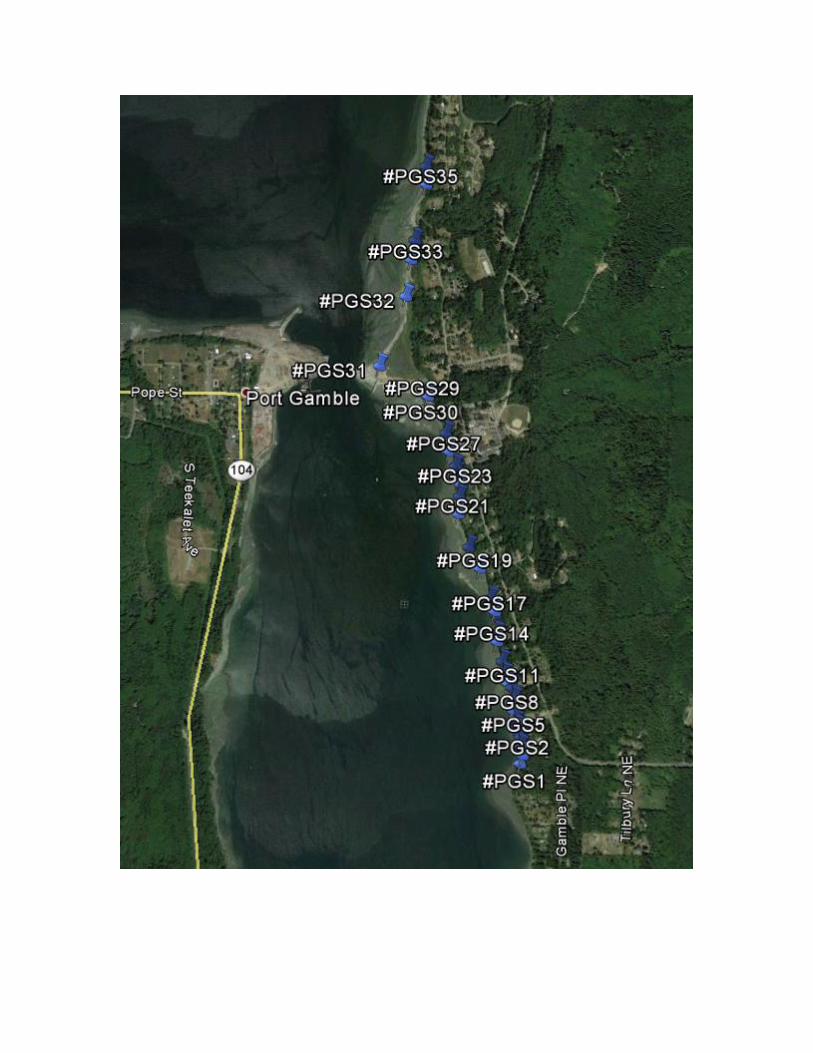
Station: #PGS9-N47.84157° W122.56708°
Description: Middle Creek
Date EC/100 ml Sample type
2/24/2015 12.1 Routine
Station: #PGS10-N47.84202° W122.56722°
NO PHOTO
Description: Flow over alder roots off bank
Date EC/100 ml Sample type
2/24/2015 11/3.1 Routine
Station: #PGS11-N47.84221° W122.56745°
Description: Flow over clay bank, downed tree
Date EC/100 ml Sample type
2/24/2015 1 Routine
Station: #PGS12-N47.84257° W122.56768°

Description: Bank flow near tire
Date EC/100 ml Sample type
2/24/2015 64.4 Routine
Station: #PGS13-N47.84310° W122.56783°
Description: Small stream, root ball
Date EC/100 ml Sample type
2/24/2015 4.1 Routine
Station: #PGS14-N47.84395° W122.56814°

Description: Bank seep, alders above
Date EC/100 ml Sample type
2/24/2015 <1 Routine
Station: #PGS15-N47.84428° W122.56817°
Description: Flow over clay bank, algae
Date EC/100 ml Sample type
2/24/2015 14.5 Routine
Station: #PGS16-N47.84506° W122.56823°

Description: Composite (2)-flow under alders & flow to west
Date EC/100 ml Sample type
2/24/2015 2 Routine
Station: #PGS17-N47.84520° W122.56827°
Description: Flow down clay bank, cars above
Date EC/100 ml Sample type
2/24/2015 4.1 Routine
Station: #PGS18-N47.84572° W122.56856°
NO PHOTO
Description: Flow under blackberries, black flex
Date EC/100 ml Sample type
2/24/2015 26.2 Routine
Station: #PGS19-N47.84699° W122.56920°

Description: Small creek, downed trees
Date EC/100 ml Sample type
2/24/2015 4.1 Routine
Station: #PGS20-N47.84787° W122.56989°
Description: Small creek, stairs to west
Date EC/100 ml Sample type
2/24/2015 27.5 Routine
Station: #PGS21-N47.84926° W122.57054°
Description: Small creek, flows east to west

Date EC/100 ml Sample type
2/24/2015 2 Routine
Station: #PGS22-N47.84998° W122.57047°
Description: Flow under large, downed cedar
Date EC/100 ml Sample type
2/24/2015 52 Routine
Station: #PGS23-N47.85051° W122.57041°
Description: Seep from bank, alders
Date EC/100 ml Sample type
2/24/2015 2 Routine
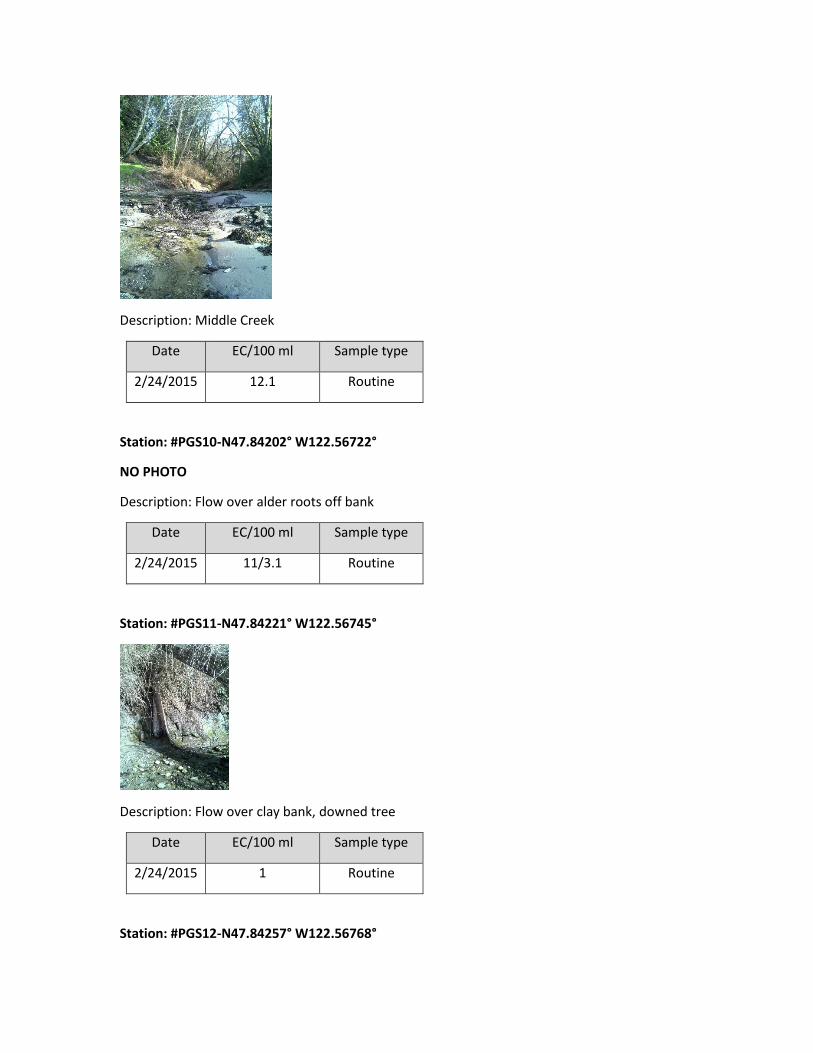
Station: #PGS24-N47.85069° W122.57050°
Description: Bank flow under blackberries
Date EC/100 ml Sample type
2/24/2015 461.1 Routine
3/26/2015 410.6 Confirmation
3/26/2015 686.8 Confirmation
Station: #PGS25-N47.85098° W122.57069°
Description: Bank flow, blackberries, lots of wood
Date EC/100 ml Sample type
2/24/2015 2 Routine
Station: #PGS26-N47.85123° W122.57074°

Description: Bank flow, trees above
Date EC/100 ml Sample type
2/24/2015 9.6 Routine
Station: #PGS27-N47.85123° W122.57074°
Description: Small flow next to large tree
Date EC/100 ml Sample type
2/24/2015 74.8 Routine
Station: #PGS28-N47.85261° W122.57131°

Description: Composite-2 flows-either side of cedar
Date EC/100 ml Sample type
2/24/2015 7.4 Routine
Station: #PGS29-N47.85416° W122.57242°
Description: Little Boston Creek
Date EC/100 ml Sample type
2/24/2015 2/5.2 Routine
Station: #PGS30-N47.85421° W122.57253°
Description: Composite 2 white PVC pipes
Date EC/100 ml Sample type
2/24/2015 6.3 Routine

Station: #PGS31-N47.85543° W122.57543°
Description: Small creek at bridge
Date EC/100 ml Sample type
2/24/2015 1 Routine
Station: #PGS32-N47.85833° W122.57380°
Description: Wetland drain-salinity 35
Date EC/100 ml Sample type
2/24/2015 <10 Routine
Station: #PGS33-N47.85985° W122.57347°

Description: Wet land drain-blue A-frame-salinity 21
Date EC/100 ml Sample type
2/24/2015 <10 Routine
Station: #PGS34-N47.86066° W122.57322°
Description: Small creek, flowing north to south along beach
Date EC/100 ml Sample type
2/24/2015 1 Routine
Station: #PGS35-N47.86298° W122.57254°

Description: Flow parallel to beach, cedars
Date EC/100 ml Sample type
2/24/2015 <1 Routine
Station: #PGS36-N47.86372° W122.57255°
Description: Seep under alders
Date EC/100 ml Sample type
2/24/2015 <1 Routine

2015 E.Coli Bacteria (EC) Hotspot at Station: #PGS24-N47.85069° W122.57050°
Description: Bank flow under blackberries (looking east)
EC counts at or above100 EC/100 mL are resampled two times to confirm. A geometric mean
value (GMV) of the three sample results over 320 EC/100mL leads to investigation.
GMV calculated by the Kitsap County database for PGS24 is 506. Sampling, photo, and GPS
coordinates by Kitsap Public Health District: Kim Jones; Accompanied by Devon Hayes for PGST;
EC Results by Twiss Analytical Laboratory, Poulsbo, WA, according to Hood Canal Regional PIC
guidance.
Next Steps: Contact adjacent property owner(s) with information and obtain permission to
access stream area and yard, Contact PGST Utilities for map of septic connections,
By 4/24/15: Sample site for EC and investigate area with Kitsap Public Health to identify
potential fecal pollution sources including animal waste, septic system, or other.
4/27-29: Kitsap and PGST review lab results, determine if indoor dye test is needed, and plan
next steps. “Dry Season” shoreline survey will occur before the end of Oct.
Date EC/100 ml Sample type
2/24/2015 461.1 Routine
3/26/2015 410.6 Confirmation
3/26/2015 686.8 Confirmation

2016 E. coli Bacteria (EC) Hotspot at Station: #PGS19- N47.84699° W122.56920°
PIC Station 19 Stream Data
Date EC/100 mL Sample Type
2/24/15 4.1 Shoreline Survey
8/17/16 218 Stream-Response, >100EC/100mL
8/22/16 1,483 Stream-Confirmation 1/2,
>100EC/100mL
9/7/16 3,255 Stream-Confirmation 2/2,
>100EC/100mL
9/13/16
Data
Review
1,017 Stream-Geometric Mean Value
>320 EC/100mL = Investigation
Next: Request Utilities and Septic Map, Request access permission as needed, Sample upstream
for EC within dry season, Inspect connections, Map Hotspot area with 200-foot buffer, Decide
on coordination with KPH and dye testing needs.
References:
2015 Shoreline Survey by Kitsap Public Health, and Devon Hayes for PGST
2016 Sampling by PGST Natural Resources (SP, HD)
EC Results by SPECTRA Lab, Poulsbo, WA
Hood Canal Regional PIC Guidance:
http://www.hccc.wa.gov/sites/default/files/resources/downloads/HCR_PIC_Program_Guidance_3-10-
14_Final.pdf

Appendix C. Review of Methods and Markers for Microbial Source
Tracking
Introduction
Fecal material containing pathogenic viruses, bacteria, and protozoa creates a
public health risk in contaminated environmental water. Sources of fecal pollution in a
watershed can be both point and non-point, from diverse human, agricultural and
wildlife origins. The ability to track the fate and transport of fecal pollution and
distinguish between sources is particularly important for mitigating and managing water
quality and waterborne diseases. At present, monitoring for all waterborne pathogens is
unrealistic due to the diversity present in sewage and the broad range of costly or
challenging methods used to collect and identify pathogenic organisms in environmental
samples.
To date, water quality monitoring and management practices have relied heavily
on fecal indicator bacteria (FIB), including Escherichia coli and Enterococcus, which
have low pathogenic potential but abundant presence in sewage and feces. FIB are
therefore suggestive of pathogen presence. Studies have shown, however, that
pathogen presence does not always co-vary strongly and consistently with FIB
concentrations since the ecology and fate of FIB outside a host can vary widely
(Anderson et al. 2005, Harwood et al. 2005, Colford et al. 2007, McQuaig et al. 2009).
FIB can be native or adapted to stream, estuary, and bay habitats and some are shown
to persist or even grow in association with aquatic sediments, aquatic vegetation, and
terrestrial soils (Whitman et al. 2003, Ishii et al. 2006, Badgley et al. 2011).
Furthermore, conventional indicators cannot discern between human and animal
sources because FIB are present in the feces of most mammals and birds (Harwood et
al., 1999; Souza et al., 1999; Leclerc et al., 2001). It is important to distinguish between
human and animal derived fecal pollution because of the heightened health risks
associated with human sewage and the different remediation strategies for mitigating
contamination from sewage versus surface runoff carrying animal waste. As our
knowledge of zoonotic disease potential increases, the need to identify specific sources
of animal waste in contaminated water bodies also intensifies.
Despite the limitations of FIB methods, they continue to be broadly used because
they offer fast, easy, inexpensive detection. Alternative indicators for waterborne fecal
pollution also exist, including viruses, caffeine, and optical brighteners, and molecular
markers (Noble et al. 2003, Buerge et al. 2003, Dixon et al. 2005; Glassmeyer et al.
2005, Hagedorn and Weisberg 2009). Using molecular markers to target DNA
sequences from host-associated microorganisms or sequences derived directly from the

host offers an analytical approach with unprecedented specificity, sensitivity, and
quantitative capacity. Differences in gut conditions such as temperature, diet, and type
of digestive system shape the intestinal microbiota and select for microbial communities
unique to their respective human or animal host (Sekelja et al. 2011, Shanks et al.
2011). Microbial source tracking (MST) relies on bacterial taxa or genetic markers that
occur preferentially or exclusively in the intestinal system of a target host population and
are excreted in high abundance through the host feces (Field and Samadpour, 2007).
Ideally, MST markers are also directly correlated with public health risks and provide
quantitative data for determining total daily maximum loads (TDML) of pollution in water
bodies in accordance with state regulations and the federal Clean Water Act (US EPA
CWA 303(d)). Advances in next-generation sequencing technologies and microbiome
research have resulted in comprehensive inventories of microbial communities
associated with a wide range of hosts and environments allowing rapid development
and application of targeted genetic markers for microbial source tracking (MST)
(Robinson et al. 2010, Lozupone et al. 2012, Quast et al. 2013, McLellan and Eren,
2014).
Overview of Methods
Techniques for MST can be generally divided into two categories, library-
dependent and library-independent, with a focus on genetic or phenotypic traits.
Phenotypic analyses measure expressed traits of microorganisms whereas genotypic
methods detect a specific gene sequence or evaluate genetic polymorphisms
(differences) in DNA.
Library-Dependent
Library-dependent techniques require a cultivation step to generate the library of
known bacterial isolates from water sources and fecal samples, to which unknown
bacterial isolates from environmental samples can be compared. The library of isolate
bacteria is characterized by an identifying attribute such as genetic signature, antibiotic
resistance or carbon source utilization (Hagedorn et al. 1999, Moore et al. 2005).
Phenotypic analyses like antibiotic resistance and carbon source utilization assume that
selective pressure alters the antibiotic resistance or metabolic profile of fecal bacteria
from different animals and humans because they are likely exposed to different types of
antibiotics or organic substrates. Therefore, antibiotic resistance or carbon utilization
profiles of easily cultured FIB bacteria from known fecal samples can be used to classify
unidentified environmental isolates based on profile similarity. Genotypic library-
dependent analyses generally discriminate between E. coli or Enterococcus spp. based
on the assumption that these organisms are uniquely adapted to their known host
environment therefore differ genetically from other strains found in other host species.

Ribotyping and Pulsed Field Gel Electrophoresis (PFGE) are commonly used library-
dependent genetic techniques (Carson et al. 2001, Stoeckel et al. 2004). Both methods
use restriction enzymes to cut bacterial DNA into fragments that are separated by size
and visualized as unique banding patterns, or fingerprints, that can be compared to a
library of characterized DNA from known fecal bacteria. PFGE digests whole genomic
DNA of bacterial isolates and visualizes large DNA fragments on a specialized gel.
Ribotyping is based on differences in the genomic sequences within 16S ribosomal
ribonucleic acid (rRNA) gene, a gene that is universally present in bacterial genomes
and contains hyper-variable regions that are widely used for taxonomic classification of
bacterial communities (Chakravorty et al. 2007).
In a comparison of phenotypic and genotypic library-dependent techniques using
blind samples containing one to three of five possible fecal sources (human, dog, cattle,
seagull, or sewage) all methods could correctly identify the dominant source in most
samples (Harwood et al. 2003, Myoda et al. 2003). Overall, the genotypic library-based
techniques performed better than the phenotypic techniques (Stoeckel and Harwood,
2007, Sargeant et al. 2011). While the phenotypic methods had high false positive rates
(i.e. a source was identified when it was not actually present) the genotypic analyses
showed variable sensitivity (Myoda et al. 2003). Issues with all methods were attributed
to the statistical tests used to match patterns from blind sample isolates with the host
library database and the limited representativeness of libraries (Stoeckel and Harwood,
2007, Sargeant et al. 2011). In order to establish a comprehensive library, observational
knowledge of potential sources of fecal contamination is required and many
representative fecal samples from target organisms across all geographic sites of
interest must be collected. In general, the accuracy of with which environmental
samples are classified into fecal source categories varies widely with library size and
representativeness (Stoeckel and Harwood, 2007). The need to develop large site-
specific libraries (>1000 isolates), that are both time and labor intensive, has decreased
interest in using library-dependent approaches (Johnson et al. 2004, Santo Domingo et
al. 2011).
Library-Independent
In contrast, library-independent techniques do not require the development of a
source library database. These techniques rely on a species-specific genotype or
characteristic detected within a mixed environmental sample. Nucleic acid replication
via polymerase chain reaction (PCR) is an important genetic tool in library-independent
approaches that can be applied to both laboratory-cultivated bacteria and DNA
sequences obtained directly from environmental samples. PCR facilitates rapid,
preferential amplification of specific nucleotide sequences from a mixture of non-target
sequences. As a result, PCR allows detection and examination of gene targets that are
strong indicators of fecal source DNA and only requires a small amount of starting

material from cultured bacterial cells or environmental DNA. PCR protocols that detect
the presence or absence of a gene sequence are referred to as end-point PCR.
In one of the first library-independent studies, Bernhard and Field demonstrated
the use of end-point PCR of the 16S rRNA gene of human-associated Bacteroidales to
detect human fecal contamination (Bernhard and Field, 2000). This method served as a
precursor for many other library-independent gene-specific PCR analyses (reviewed in
Harwood et al. 2013). A common end-point PCR method for identifying human fecal
pollution not based on the 16S rRNA gene, uses a culture step to enrich for target
Enterococcus faecium cells and then amplifies and detects the enterococcal surface
protein (esp) gene (Scott et al. 2005, Ahmed et al. 2008). Both methods have been
shown to be highly sensitive and specific (>90%) (Ahmed et al. 2009, Boehm et al.
2013, Harwood et al. 2013) although additional studies have detected some level of E.
faecium and human-associated Bacteroidales in the feces of animals (Kildare et al.
2007, Whitman et al. 2007; Layton et al., 2009; Boehm et al. 2013). In addition to
human-associated microbial gene targets, many PCR methods have been developed to
detect common animal sources including dogs, pigs, cows, poultry, gulls and other wild
birds. These, and other gene-specific PCR targets discussed below, are adequate to
determine the source of fecal microbial pollution in the environment, however, they
cannot be used to quantify the amount the fecal pollution and evaluate associated
public health risks.
Recently, quantitative real-time PCR (qPCR) assays which allow for more rapid
detection of markers, as well as determination of their relative concentrations, have
been developed (Dick and Field 2004, Seurinck et al. 2005). qPCR works much like
end-point PCR but the accumulation of PCR products is quantified with each reaction
cycle using a fluorescence detector. The strength of the fluorescent signal indicates the
relative amount of a specific target DNA sequence in a sample (Walker, 2002) and thus
can be used in TMDL analysis and subsequent management decisions. In many studies
of human and animal-associated gene targets, qPCR methods have been found to
more precisely correlate with pathogen presence compared to end-point PCR or other
MST methods (Savichtcheva et al. 2007; Walters et al. 2009; Harwood et al. 2013). It
should be noted that correlations between MST markers and pathogens have not been
found in all studies yet the general conclusion in the field is that Bacteroidales markers
have a comparable or better ability to predict pathogens compared with conventional
FIB methods (Fremaux et al. 2009; Schriewer, et al. 2010).
Oligotyping is a recently introduced computational method that allows the
identification of closely related but distinct bacterial strains that would normally be
classified as one taxonomic unit. Variations within a single bacterial taxa can result in
differential distribution patterns between geographically distinct host populations that
can then be used to identify a source population. Eren and colleagues (2015) identified
host-specific oligotypes of the bacterial taxon Blautia that occurred exclusively in fecal

samples of humans, swine, cows, deer or chickens. Oligotyping has also been used to
distinguish between members of the taxon Helicobacter found in the gut and feces of
wild and domestic animals including seabirds, marine mammals, and dogs (Oxley and
McKay 2005).
Whole-community analysis based on bacterial 16S rRNA gene sequencing of
fecal and environmental microbial communities demonstrate evidence of host patterns
in entire bacterial assemblages. Early studies using whole bacterial communities
demonstrated that the native microbial communities in water are changed by the
addition of fecal contamination from bovine or equine sources (Cho and Kim 2000,
Simpson et al., 2004). More recently, Newton and colleagues (2013) used community
sequencing of bacterial 16S rRNA gene to describe three sewer infrastructure-
associated bacterial genera and five fecal-associated bacterial families that served as
signatures of sewer and fecal contamination in urban rivers and lakes. Other studies
have found that microbial communities from the same fecal origin were highly similar
and could be used to determine the dominant sources of fecal contamination in water
samples (Lee et al. 2011, Cao et al. 2013).
Microarray technology provides high-throughput comprehensive screening of
whole microbial communities or targeted MST markers. Microarray platforms contain
thousands of short gene sequences for classes of markers specific to indicator
organisms, pathogens, and source identifiers that hybridize with PCR products or whole
genomic DNA in samples. Multiple microarrays have been designed and used to
specifically detect waterborne bacterial pathogens (Miller et al. 2008, Gomes et al.
2015). Specifically for MST applications, the Phylochip microarray for 16S rRNA
bacterial community analysis was modified by Dubinsky and colleagues (2016) to detect
and distinguish fecal bacteria from humans, birds, ruminants, horses, pigs and dogs.
Also, Li and colleagues (2015) developed a custom microarray targeting waterborne
viral, bacterial, and protozoan pathogens, well-studied fecal indicator bacteria and
markers, antibiotic resistance genes, as well as universal bacterial probes for whole
community characterization. While microarray tests can be used to rapidly screen for
multiple sources of fecal contamination and identify human health risks, they do not
provide quantitative information about the identified sources that may be critical for
environmental monitoring applications.
Microbial Targets
Recent MST research has focused on fecal anaerobe markers because of the
unlikelihood that these organisms will successfully grow and reproduce outside their
host. They are either specifically adapted to or selected for by the host gut, and
consequently will be more tightly associated with fecal pathogen presence in the
environment. Fecal anaerobes of the taxonomic order Bacteroidales have received the

majority of MST research effort (Bernhard and Field, 2000, and reviewed in Harwood et
al. 2013); other potential indicators include members of Clostridiales and direct
pathogen detection.
Bacteriodes
Selected for its high concentrations in feces and tendency to coevolve with its
host, the Bacteroides-Prevotella taxon was one of the first targets of library-independent
detection based on the HF183 end-point PCR of the 16S rRNA gene (Bernhard and
Field, 2000). Bacteroidales are gram-negative, obligate anaerobes that occur in human
and animal feces at concentrations from 109 to 1011 cells · g-1 and at concentrations of
109 cells · 100ml-1 in sewage (Holdeman et al. 1976, Wexler 2007) compared to
traditional FIB that exist at orders of magnitude lower concentrations (106 to 107 CFU ·
100ml-1 in sewage) (Harwood et al. 2005, Converse et al. 2009). Many studies have
confirmed the high sensitivity and general specificity of HF183 and related Bacteroides
markers for human and animal targets (Kildare et al., 2007, Harwood et al. 2013,
Boehm et al. 2013).
Clostridiales
Obligate anaerobes of the phylum Firmicutes, members of the Clostridiales are
commonly found in the gut of humans and animals. Within this group of organisms,
MST focus has been on Lachnospiraceae, one of the most abundant groups of faecal
bacteria in sewage (McLellan et al. 2013). A strong correlation was observed between
between Lachnospiraceae and adenovirus, indicating a link between these markers and
human pathogen presence (Newton et al. 2011). Members of Clostridiales have also
been found in high abundance in avian and marine mammal hosts and feces and
subsequently been developed as MST markers for these organisms (Oxley and McKay
2005, Green et al. 2012, Koskey et al. 2014).
Pathogens
Direct detection of pathogens in watersheds is beneficial for assessing public
health risk. The Centers for Disease Control and Prevention (CDC) has found fecal
pathogens shiga-toxin producing E. coli, Shigella, Salmonella, and Campylobacter as
the dominant sources of fecal-associated waterborne disease (Lee et al. 2002). Among
the fecal coliform bacteria strains of shiga-toxin producing E. coli O157:H7 and the
pathogen Shigella sonnei both cause a range of intestinal illnesses. The E. coli O157
serotype and other pathogenic E. coli can be identified by the PCR detection of specific
shiga-toxin genes and surface proteins (Maurer 1999, Osek 2003, Duris et al. 2009).
Certain E. coli toxin genes can also distinguish between cattle and swine fecal pollution
presence (Duris et al. 2011). Campylobacter is another leading cause of bacterial
gastroenteritis in developed regions. Wild birds and poultry are recognized as sources

of the Campylobacter taxa, C. jejuni, C. coli and C. lari, frequently implicated in human
illness (Butzler 2004). Campylobacter qPCR markers can discern between pathogenic
and non-pathogenic strains and have been used to inform public health risk assessment
from gull fecal pollution (Lu et al 2011). The issue with direct detection is pathogen
strains are normally found in low densities in environmental water, and a cultivation step
is required to increase the sensitivity of the assays (Duris et al. 2011).
Non-Bacterial Targets
Viruses
Monitoring for human viruses has been suggested as an alternate approach to
assess human health risks in environmental waters. Viruses are generally highly host-
specific and do not multiply in the environment or readily degrade under environmental
stressors, such as UV irradiance and water treatment processes, unlike traditional FIBs.
However, pathogenic viruses usually infect a small percentage of any given population,
making them relatively rare targets (and thus more difficult to detect) (Pina et al. 1998).
Certain non-pathogenic human viruses have a wider distribution in human populations
than pathogenic viruses and their stable nature makes them ideal indicators of other
viral pathogens, such as noroviruses and hepatitis A viruses, persistent in the
environment (McQuaig et al. 2009). The human adenovirus (HAdV) and human
polyomavirus (HPyV) are promising as human fecal indicators, as they are frequently
excreted in the feces or urine of humans both with and without clinical symptoms and
they are commonly detected in urban wastewater (Bofill-Mas et al., 2001). Certain
adenoviruses exist that are specific to livestock as well providing distinction between
human or animal-derived fecal pollution (Rusinol et al. 2014). Studies have
demonstrated HPyV targets to be 100% specific, showing no cross-reactivity to animal
fecal samples (Harwood et al. 2009, McQuaig et al. 2009, Ballesete et. al. 2010)
Archaea
Archaeal methanogens are commonly associated with the oral, vaginal, and
intestinal mucosa of mammals (Belay et al. 1998, Belay et al. 1990, Miller et al. 1982,
Miller et al. 1986). Methanobrevibacter ruminantium and M. smithii have been tested for
possibilities as ruminant and human markers, respectively (Ufnar et al. 2006, Ufnar et
al. 2007). M. smithii a methanogenic archaeon found exclusively and abundantly in the
human gut and human fecal samples (Lin and Miller 1998, Dridi et al., 2009). Likewise,
M. ruminantium is specific to the rumen of domesticated animals (Smith and Hungate
1958). The nifH gene is targeted in archaeal indicators because it is a predominantly
methanogen-specific gene with sequence differences that can be used to discriminate
between methanogen groups. The M. ruminantium nifH assay is shown to be successful
at detecting cattle, sheep, and goat feces and contamination by agricultural lagoon

waste in environmental water samples (Ufnar et al. 2007). The M. smithii marker has
high sensitivity against human sewage pollution especially in coastal waters but did
show some cross-reactivity with bird feces (Ufnar et al. 2006, Johnston et al. 2010).
Direct source detection
The first fecal source tracking method based on a eukaryotic genetic marker was
the end-point PCR assay targeting the human mitochondrial DNA (mtDNA) NADH
dehydrogenase subunit (Martellini et al., 2005). mtDNA was proposed as a marker
based upon the premise that it should be abundant in feces and especially host-specific.
Other studies have used qPCR probes to target human, bovine, ovine and swine
mtDNA for use as indicators in source tracking studies of shellfish harvesting areas
(Baker-Austin et al. 2010). Developments in biodiversity monitoring using environmental
DNA (eDNA), genetic material obtained directly from environmental samples from any
organism, have also found application in fecal source tracking. Utilization and
contamination of waterbodies by various wildlife, human, and domesticated animals can
be detected through eDNA markers (Thomsen and Willerslev 2015).
Evaluation of Source Tracking Methods
Any satisfactory MST method must comply with a set of performance criteria
(Stoeckel and Harwood, 2007). Some performance criteria are universally applicable
while others depend on the objectives of a particular study (Santo Domingo et al. 2007).
The key universal criteria are described here.
Sensitivity
The sensitivity of a MST method is defined by the percentage of true positive
results detected. Sensitivity indicates the robustness of an assay provided that targets
are present at or above detection levels. Samples spiked with fecal material or other
known contaminated samples are used to directly test the number of positive controls
correctly identified as positive by the assay. Physical or chemical properties of the water
matrix or sample type may impair the sensitivity of certain methods (Siefring et al.
2008).
Specificity
The specificity of a MST marker is represented by the rate of false positive
results or the percentage of negative results correctly ascribed to samples known to
lack the host target in question (Stoeckel and Harwood, 2007). A highly-specific MST
marker should not cross-react with unintended targets and accurately identify only
target source species. It is desirable that a marker is tested against as many nontarget

fecal samples as possible to better constrain limitations of method specificity (Harwood
and Stoeckel, 2011)
Stability
The stability criteria dictates that changes in environmental or biological
conditions due to seasonal or regional differences should not affect the presence of
MST targets in host feces. A stable marker does not vary in frequency or concentration
over time at the population level, has consistent detection across all geographic regions
of the host range, and exhibits predictable rates decay in all habitats and water matrices
(Sargeant et al. 2011).
Challenges for stream, river, and estuarine systems
Understanding eDNA detection rates in lotic systems is critical for inclusion of
eDNA analysis as a reliable survey method in fecal source tracking. The concentration
of DNA in rivers and streams depends on dynamics between eDNA released into the
water, downstream transport and losses to the system through physical, chemical and
biological processes. The contribution and rate of production of eDNA by various
organisms has been the focus of only a few studies (Pilliod et al. 2014, Thomsen et al.
2012, Klymus et al. 2015) and is likely influenced by the size, sex, health, and density of
members in a population. Difficulty measuring the transport and residence time of eDNA
in riverine systems also poses challenges to describing the geographic origin of eDNA
and making spatial interference about the source organism(s). A study by Deiner and
Altermatt (2014) observed movement of eDNA five to ten kilometers downstream of the
source population within a 24hr sampling period, indicating that eDNA can persist over
relatively large distances in a river system. It has been shown, however, that eDNA
concentrations are generally localized and do not appear to accumulate downstream
(Deiner and Altermatt 2014, Pilliod et al. 2013, Laramie et al. 2015). Dilution and
removal processes such as settling and degradation, likely reduce the amount of
detectable eDNA over time and as it travels downstream thereby limiting accumulation
(Dejean et al. 2011, Jane et al. 2014).
Recommendations In a review and critique of MST methods, the Washington State Department of
Ecology highlighted the lack of standardized, validated, promulgated, and U.S.
Environmental Protection Agency approved molecular MST methods. Sargeant and
colleagues (2011) proposed the following quality assurance sampling for substantiation
of results: 1) Field samples duplicated for reproducibility information; 2) Preliminary
testing of source feces from the study area to confirm the source-specific MST indicator
or marker is present; 3) Samples spiked with fecal material from each potential source
per study as positive controls; 4) Samples from presumably uncontaminated sites as

field negative controls. The use of multiple MST techniques in parallel, was also
recommended to overcome the experimental nature of fecal source tracking methods
and to produce acceptable levels of accuracy, reproducibility, and investigation of
numerous potential source types. Furthermore, library-independent methods are
recommended over library-dependent methods because they typically have a lower cost
and provide much faster results (Sargeant et al. 2011).
The Toolbox Approach
Because rivers, streams and estuaries can have considerable temporal and
spatial variability in microbial water quality from a multitude of human and animal-
derived sources, a monitoring strategy that captures data about all potential sources is
optimal. No one marker has all the requisite performance qualities for identifying and
quantifying the source and magnitude of fecal pollution in water. Thus, a toolbox
approach using a suite of techniques and molecular markers, producing multiple lines of
evidence, is considered important to effective microbial source tracking (Harwood et al.
2013).
Monitoring, mitigation, and management of fecal pollution can be costly to
coastal communities, which depend on uncontaminated water bodies for tourism,
recreation, and fisheries (Rabinovici et al. 2004). Most public advisories and closures in
recreation areas and shellfisheries are posted without specific knowledge of the type
and source of fecal contamination (NRDC, 2006). A better understanding and
implementation of MST will facilitate targeted remediation, enhance protection of public
health, and minimize economic costs associated with fecal pollution in water systems.

References
Anderson, K. L., Whitlock, J. E., & Harwood, V. J. (2005). Persistence and differential
survival of fecal indicator bacteria in subtropical waters and sediments. Applied and
environmental microbiology, 71(6), 3041-3048.
Badgley, B. D., Thomas, F. I., & Harwood, V. J. (2011). Quantifying environmental
reservoirs of fecal indicator bacteria associated with sediment and submerged aquatic
vegetation. Environmental microbiology, 13(4), 932-942.
Baker-Austin, C., Rangdale, R., Lowther, J., & Lees, D. N. (2010). Application of
mitochondrial DNA analysis for microbial source tracking purposes in shellfish
harvesting waters. Water Science and Technology, 61(1), 1-7.
Ballesté, E., Bonjoch, X., Belanche, L. A., & Blanch, A. R. (2010). Molecular indicators
used in the development of predictive models for microbial source tracking. Applied and
environmental microbiology, 76(6), 1789-1795.
Belay, N., Johnson, R., Rajagopal, B. S., De Macario, E. C., & Daniels, L. (1988).
Methanogenic bacteria from human dental plaque. Applied and environmental
microbiology, 54(2), 600-603.
Belay, N., Mukhopadhyay, B., De Macario, E. C., Galask, R., & Daniels, L. (1990).
Methanogenic bacteria in human vaginal samples. Journal of clinical microbiology,
28(7), 1666-1668.
Bernhard, A. E., & Field, K. G. (2000). A PCR assay to discriminate human and
ruminant feces on the basis of host differences in Bacteroides-Prevotella genes
encoding 16S rRNA. Applied and environmental microbiology, 66(10), 4571-4574.
Bertke, E. E. (2007) Composite analysis for Escherichia coli at coastal beaches. J.
Great Lakes Res. 33, 335 – 341
Bofill-Mas, S., Pina, S., & Girones, R. (2000). Documenting the epidemiologic patterns
of polyomaviruses in human populations by studying their presence in urban sewage.
Applied and environmental microbiology, 66(1), 238-245.
Buerge, I. J., Poiger, T., Müller, M. D., & Buser, H. R. (2003). Caffeine, an
anthropogenic marker for wastewater contamination of surface waters. Environmental
science & technology, 37(4), 691-700.

Butzler, J. P. (2004). Campylobacter, from obscurity to celebrity. Clinical microbiology
and infection, 10(10), 868-876.
Carson, C. A., Shear, B. L., Ellersieck, M. R., & Asfaw, A. (2001). Identification of fecal
Escherichia colifrom humans and animals by ribotyping. Applied and Environmental
Microbiology, 67(4), 1503-1507.
Chakravorty, S., Helb, D., Burday, M., Connell, N., & Alland, D. (2007). A detailed
analysis of 16S ribosomal RNA gene segments for the diagnosis of pathogenic bacteria.
Journal of microbiological methods, 69(2), 330-339.
Cho, J. C., & Kim, S. J. (2000). Increase in bacterial community diversity in subsurface
aquifers receiving livestock wastewater input. Applied and Environmental Microbiology,
66(3), 956-965.
Colford Jr, J. M., Wade, T. J., Schiff, K. C., Wright, C. C., Griffith, J. F., Sandhu, S. K., ...
& Weisberg, S. B. (2007). Water quality indicators and the risk of illness at beaches with
nonpoint sources of fecal contamination. Epidemiology, 27-35.
Copeland, C. (2003, February). Clean Water Act and Total Maximum Daily Loads
(TMLDs) of Pollutants. Washington, DC: Congressional Research Service, Library of
Congress.
Deiner, K., & Altermatt, F. (2014). Transport distance of invertebrate environmental
DNA in a natural river. PLoS One, 9(2), e88786.
Dejean, T., Valentini, A., Duparc, A., Pellier-Cuit, S., Pompanon, F., Taberlet, P., &
Miaud, C. (2011). Persistence of environmental DNA in freshwater ecosystems. PloS
one, 6(8), e23398.
Dick, L. K., & Field, K. G. (2004). Rapid estimation of numbers of fecal Bacteroidetes by
use of a quantitative PCR assay for 16S rRNA genes. Applied and environmental
microbiology, 70(9), 5695-5697.
Dixon L.K., Taylor, H.M.,Staugler, E., & Scudera, J.O. (2005) Development of a
fluorescence
method to detect optical brighteners in the presence of varying concentrations of
fluorescent
humic substances: identifying regions influenced by OSTDS in the estuarine waters of
Charlotte
Harbor. Mote Marine Laboratory Technical Report No. 1045.

Dridi, B., Henry, M., El Khechine, A., Raoult, D., & Drancourt, M. (2009). High
prevalence of Methanobrevibacter smithii and Methanosphaera stadtmanae detected in
the human gut using an improved DNA detection protocol. PloS one, 4(9), e7063.
Dubinsky, E. A., Esmaili, L., Hulls, J. R., Cao, Y., Griffith, J. F., & Andersen, G. L.
(2012). Application of phylogenetic microarray analysis to discriminate sources of fecal
pollution. Environmental science & technology, 46(8), 4340-4347.
Duris, J. W., Haack, S. K., & Fogarty, L. R. (2009). Gene and Antigen Markers of Shiga-
toxin Producing from Michigan and Indiana River Water: Occurrence and Relation to
Recreational Water Quality Criteria. Journal of environmental quality, 38(5), 1878-1886.
Duris, J. W., Reif, A. G., Olson, L. E., & Johnson, H. E. (2011). Pathogenic bacteria and
microbial-source tracking markers in Brandywine Creek Basin, Pennsylvania and
Delaware, 2009-10 (No. 2011-5164, pp. i-27). US Geological Survey.
Eren, A. M., Sogin, M. L., Morrison, H. G., Vineis, J. H., Fisher, J. C., Newton, R. J., &
McLellan, S. L. (2015). A single genus in the gut microbiome reflects host preference
and specificity. The ISME journal, 9(1), 90-100.
Field, K. G., & Samadpour, M. (2007). Fecal source tracking, the indicator paradigm,
and managing water quality. Water research, 41(16), 3517-3538.
Fremaux, B., Gritzfeld, J., Boa, T., & Yost, C. K. (2009). Evaluation of host-specific
Bacteroidales 16S rRNA gene markers as a complementary tool for detecting fecal
pollution in a prairie watershed. Water research, 43(19), 4838-4849.
Glassmeyer, S., Furlong, E., Kolpin, D., Cahill, J., Zaugg, S., Werner, S., Meyer, M. T.,
& Kryak, D. (2005). Transport of chemical and microbial compounds from known
wastewater discharges: potential for use as indicators of human fecal contamination.
USGS Staff--Published Research, 66.
Green, H. C., Dick, L. K., Gilpin, B., Samadpour, M., & Field, K. G. (2012). Genetic
markers for rapid PCR-based identification of gull, Canada goose, duck, and chicken
fecal contamination in water. Applied and environmental microbiology, 78(2), 503-510.
Hagedorn, C., Robinson, S. L., Filtz, J. R., Grubbs, S. M., Angier, T. A., & Reneau, R. B.
(1999). Determining sources of fecal pollution in a rural Virginia watershed with
antibiotic resistance patterns in fecal streptococci. Applied and Environmental
Microbiology, 65(12), 5522-5531.

Hagedorn, C., & Weisberg, S. B. (2009). Chemical-based fecal source tracking
methods: current status and guidelines for evaluation. Reviews in Environmental
Science and Bio/Technology, 8(3), 275-287.
Harwood, V. J., Wiggins, B., Hagedorn, C., Ellender, R. D., Gooch, J., Kern, J.,
Samadpour, M., Chapman, A. C. H., Robinson, B. J., & Thompson, B. C. (2003).
Phenotypic library-based microbial source tracking methods: efficacy in the California
collaborative study. Journal of Water and Health, 1(4), 153-166.
Harwood, V. J., Levine, A. D., Scott, T. M., Chivukula, V., Lukasik, J., Farrah, S. R., &
Rose, J. B. (2005). Validity of the indicator organism paradigm for pathogen reduction in
reclaimed water and public health protection. Applied and Environmental Microbiology,
71(6), 3163-3170.
Harwood, V. J., Staley, C., Badgley, B. D., Borges, K., & Korajkic, A. (2013). Microbial
source tracking markers for detection of fecal contamination in environmental waters:
relationships between pathogens and human health outcomes. FEMS microbiology
reviews, 38(1), 1-40.
Ishii, S., Ksoll, W. B., Hicks, R. E., & Sadowsky, M. J. (2006). Presence and growth of
naturalized Escherichia coli in temperate soils from Lake Superior watersheds. Applied
and environmental microbiology, 72(1), 612-621.
Jane, S. F., Wilcox, T. M., McKelvey, K. S., Young, M. K., Schwartz, M. K., Lowe, W. H.,
... & Whiteley, A. R. (2015). Distance, flow and PCR inhibition: eDNA dynamics in two
headwater streams. Molecular Ecology Resources, 15(1), 216-227.
Johnson, L. K., Brown, M. B., Carruthers, E. A., Ferguson, J. A., Dombek, P. E., &
Sadowsky, M. J. (2004). Sample size, library composition, and genotypic diversity
among natural populations of Escherichia coli from different animals influence accuracy
of determining sources of fecal pollution. Applied and environmental microbiology,
70(8), 4478-4485.
Johnston, C., Ufnar, J. A., Griffith, J. F., Gooch, J. A., & Stewart, J. R. (2010). A real‐
time qPCR assay for the detection of the nifH gene of Methanobrevibacter smithii, a
potential indicator of sewage pollution. Journal of applied microbiology, 109(6), 1946-
1956.

Kildare, B. J., Leutenegger, C. M., McSwain, B. S., Bambic, D. G., Rajal, V. B., &
Wuertz, S. (2007). 16S rRNA-based assays for quantitative detection of universal,
human-, cow-, and dog-specific fecal Bacteroidales: a Bayesian approach. Water
research, 41(16), 3701-3715.
Klymus, K. E., Richter, C. A., Chapman, D. C., & Paukert, C. (2015). Quantification of
eDNA shedding rates from invasive bighead carp Hypophthalmichthys nobilis and silver
carp Hypophthalmichthys molitrix. Biological Conservation, 183, 77-84.
Koskey, A. M., Fisher, J. C., Traudt, M. F., Newton, R. J., & McLellan, S. L. (2014).
Analysis of the gull fecal microbial community reveals the dominance of Catellicoccus
marimammalium in relation to culturable Enterococci. Applied and environmental
microbiology, 80(2), 757-765.
Laramie, M. B., Pilliod, D. S., & Goldberg, C. S. (2015). Characterizing the distribution of
an endangered salmonid using environmental DNA analysis. Biological Conservation,
183, 29-37.
Layton, B. A., Walters, S. P., & Boehm, A. B. (2009). Distribution and diversity of the
enterococcal surface protein (esp) gene in animal hosts and the Pacific coast
environment. Journal of applied microbiology, 106(5), 1521-1531.
Lee, J. E., Lee, S., Sung, J., & Ko, G. (2011). Analysis of human and animal fecal
microbiota for microbial source tracking. The ISME journal, 5(2), 362-365.
Li, X., Harwood, V. J., Nayak, B., Staley, C., Sadowsky, M. J., & Weidhaas, J. (2015). A
novel microbial source tracking microarray for pathogen detection and fecal source
identification in environmental systems. Environmental science & technology, 49(12),
7319-7329.
Lin, C., & Miller, T. L. (1998). Phylogenetic analysis of Methanobrevibacter isolated from
feces of humans and other animals. Archives of microbiology, 169(5), 397-403.
Lozupone, C. A., Stombaugh, J. I., Gordon, J. I., Jansson, J. K., & Knight, R. (2012).
Diversity, stability and resilience of the human gut microbiota. Nature, 489(7415), 220-
230.
Lu, J., Ryu, H., Santo Domingo, J. W., Griffith, J. F., & Ashbolt, N. (2011). Molecular
detection of Campylobacter spp. in California gull (Larus californicus) excreta. Applied
and environmental microbiology, 77(14), 5034-5039.

Martellini, A., Payment, P., & Villemur, R. (2005). Use of eukaryotic mitochondrial DNA
to differentiate human, bovine, porcine and ovine sources in fecally contaminated
surface water. Water research, 39(4), 541-548.
Maurer, J. J., Schmidt, D., Petrosko, P., Sanchez, S., Bolton, L., & Lee, M. D. (1999).
Development of primers to O-antigen biosynthesis genes for specific detection of
Escherichia coli O157 by PCR. Applied and environmental microbiology, 65(7), 2954-
2960.
McLellan, S. L., Newton, R. J., Vandewalle, J. L., Shanks, O. C., Huse, S. M., Eren, A.
M., & Sogin, M. L. (2013). Sewage reflects the distribution of human faecal
Lachnospiraceae. Environmental microbiology, 15(8), 2213-2227.
McLellan, S. L., & Eren, A. M. (2014). Discovering new indicators of fecal pollution.
Trends in microbiology, 22(12), 697-706.
McQuaig, S. M., Scott, T. M., Lukasik, J. O., Paul, J. H., & Harwood, V. J. (2009).
Quantification of human polyomaviruses JC virus and BK virus by TaqMan quantitative
PCR and comparison to other water quality indicators in water and fecal samples.
Applied and environmental microbiology, 75(11), 3379-3388.
Miller, T.L., Wolin, M.J., de Macario, E.C., & Macario A.J. (1982) Isolation of
Methanobrevibacter smithii from human feces. Appl Environ Microbiol 43: 227–232
Miller, T.L., Wolin, M.J., & Kusel, E.A. (1986) Isolation and characterization of
methanogens from animal feces. Syst Appl Microbiol 8, 234–238.
Miller, S. M., Tourlousse, D. M., Stedtfeld, R. D., Baushke, S. W., Herzog, A. B., Wick,
L. M., Rouillard, J.M., Gulari, E., Tiedje, J.M., & Hashsham, S. A. (2008). In situ-
synthesized virulence and marker gene biochip for detection of bacterial pathogens in
water. Applied and environmental microbiology, 74(7), 2200-2209.
Moore, D. F., Harwood, V. J., Ferguson, D. M., Lukasik, J., Hannah, P., Getrich, M., &
Brownell, M. (2005). Evaluation of antibiotic resistance analysis and ribotyping for
identification of faecal pollution sources in an urban watershed. Journal of Applied
Microbiology, 99(3), 618-628.
Myoda, S. P., Carson, C. A., Fuhrmann, J. J., Hahm, B. K., Hartel, P. G., Yampara-
Iquise, H., Johnson, L., Kuntz, R.L., Nakatsu, C.H., Sadowsky, M.J., & Samadpour, M.
(2003). Comparison of genotypic-based microbial source tracking methods requiring a
host origin database. Journal of water and health, 1(4), 167-180.

Newton, R. J., Bootsma, M. J., Morrison, H. G., Sogin, M. L., & McLellan, S. L. (2013). A
microbial signature approach to identify fecal pollution in the waters off an urbanized
coast of Lake Michigan. Microbial ecology, 65(4), 1011-1023.
Noble, R. T., Allen, S. M., Blackwood, A. D., Chu, W., Jiang, S. C., Lovelace, G. L.,
Sobsey, M.D., Stewart, J.R., & Wait, D. A. (2003). Use of viral pathogens and indicators
to differentiate between human and non-human fecal contamination in a microbial
source tracking comparison study. Journal of water and health, 1(4), 195-207.
Osek, J. (2003). Development of a multiplex PCR approach for the identification of
Shiga toxin‐producing Escherichia coli strains and their major virulence factor genes.
Journal of Applied Microbiology, 95(6), 1217-1225.
Oxley, A. P., & McKay, D. B. (2005). Comparison of Helicobacter spp. genetic
sequences in wild and captive seals, and gulls. Diseases of aquatic organisms, 65(2),
99-105.
Pilliod, D. S., Goldberg, C. S., Arkle, R. S., & Waits, L. P. (2014). Factors influencing
detection of eDNA from a stream‐dwelling amphibian. Molecular Ecology Resources,
14(1), 109-116.
Pilliod, D. S., Goldberg, C. S., Arkle, R. S., & Waits, L. P. (2013). Estimating occupancy
and abundance of stream amphibians using environmental DNA from filtered water
samples. Canadian Journal of Fisheries and Aquatic Sciences, 70(8), 1123-1130.
Pina, S., Puig, M., Lucena, F., Jofre, J., & Girones, R. (1998). Viral pollution in the
environment and in shellfish: human adenovirus detection by PCR as an index of
human viruses. Applied and Environmental Microbiology, 64(9), 3376-3382.
Quast, C., Pruesse, E., Yilmaz, P., Gerken, J., Schweer, T., Yarza, P., Peplies, J., &
Glöckner, F. O. (2012). The SILVA ribosomal RNA gene database project: improved
data processing and web-based tools. Nucleic acids research, gks1219.
Rabinovici, S. J., Bernknopf, R. L., Wein, A. M., Coursey, D. L., & Whitman, R. L.
(2004). Economic and health risk trade-offs of swim closures at a Lake Michigan beach.
Robinson, C. J., Bohannan, B. J., & Young, V. B. (2010). From structure to function: the
ecology of host-associated microbial communities. Microbiology and Molecular Biology
Reviews, 74(3), 453-476.
Rusinol, M., Fernandez-Cassi, X., Hundesa, A., Vieira, C., Kern, A., Eriksson, I., Ziros,
P., Kay, D., Miagostovich, M., Vargha, M., & Allard, A. (2014). Application of human and
animal viral microbial source tracking tools in fresh and marine waters from five different
geographical areas. water research, 59, 119-129.
Santo Domingo, J. W., Bambic, D. G., Edge, T. A., & Wuertz, S. (2007). Quo vadis
source tracking? Towards a strategic framework for environmental monitoring of fecal
pollution. Water Research, 41(16), 3539-3552.
Savichtcheva, O., Okayama, N., & Okabe, S. (2007). Relationships between
Bacteroides 16S rRNA genetic markers and presence of bacterial enteric pathogens
and conventional fecal indicators. Water research, 41(16), 3615-3628.
Schriewer, A., Miller, W. A., Byrne, B. A., Miller, M. A., Oates, S., Conrad, P. A., Hardin,
D., Yang, H.H., Chouicha, N., Melli, A., & Jessup, D. (2010). Presence of Bacteroidales
as a predictor of pathogens in surface waters of the central California coast. Applied
and Environmental Microbiology, 76(17), 5802-5814.
Sekelja, M., Berget, I., Næs, T., & Rudi, K. (2011). Unveiling an abundant core
microbiota in the human adult colon by a phylogroup-independent searching approach.
The ISME journal, 5(3), 519-531.
Seurinck, S., Defoirdt, T., Verstraete, W., & Siciliano, S. D. (2005). Detection and
quantification of the human‐specific HF183 Bacteroides 16S rRNA genetic marker with
real‐time PCR for assessment of human faecal pollution in freshwater. Environmental
Microbiology, 7(2), 249-259.
Shanks, O. C., Kelty, C. A., Archibeque, S., Jenkins, M., Newton, R. J., McLellan, S. L.,
Huse, S. M., & Sogin, M. L. (2011). Community structures of fecal bacteria in cattle from
different animal feeding operations. Applied and environmental microbiology, 77(9),
2992-3001.
Siefring, S., Varma, M., Atikovic, E., Wymer, L., & Haugland, R. A. (2008). Improved
real-time PCR assays for the detection of fecal indicator bacteria in surface waters with
different instrument and reagent systems. Journal of Water and Health, 6(2), 225-237.
Simpson, J. M., Santo Domingo, J. W., & Reasoner, D. J. (2004). Assessment of equine
fecal contamination: the search for alternative bacterial source-tracking targets. FEMS
microbiology ecology, 47(1), 65-75.

Smith, P. H., & Hungate, R. E. (1958). Isolation and characterization of
Methanobacterium ruminantium n. sp. Journal of Bacteriology, 75(6), 713.
Stoeckel, D. M., Mathes, M. V., Hyer, K. E., Hagedorn, C., Kator, H., Lukasik, J.,
O’Brien, T. L., Fenger, T. W, Strickler, K. M. & Wiggins, B. A. (2004). Comparison of
seven protocols to identify fecal contamination sources using Escherichia coli.
Environmental science & technology, 38(22), 6109-6117.
Stoeckel, D. M., & Harwood, V. J. (2007). Performance, design, and analysis in
microbial source tracking studies. Applied and Environmental Microbiology, 73(8), 2405-
2415.
Thomsen, P., Kielgast, J. O. S., Iversen, L. L., Wiuf, C., Rasmussen, M., Gilbert, M. T.
P., Ludovic, O. & Willerslev, E. (2012). Monitoring endangered freshwater biodiversity
using environmental DNA. Molecular ecology, 21(11), 2565-2573.
Thomsen, P. F., & Willerslev, E. (2015). Environmental DNA–an emerging tool in
conservation for monitoring past and present biodiversity. Biological Conservation, 183,
4-18.
Ufnar, J. A., Wang, S. Y., Christiansen, J. M., Yampara‐Iquise, H., Carson, C. A., &
Ellender, R. D. (2006). Detection of the nifH gene of Methanobrevibacter smithii: a
potential tool to identify sewage pollution in recreational waters. Journal of applied
microbiology, 101(1), 44-52.
Ufnar, J. A., Wang, S. Y., Ufnar, D. F., & Ellender, R. D. (2007). Methanobrevibacter
ruminantium as an indicator of domesticated-ruminant fecal pollution in surface waters.
Applied and environmental microbiology, 73(21), 7118-7121.
Walker, N. J. (2002). A technique whose time has come. Science, 296(5567), 557-559.
Walters, S. P., Gannon, V. P., & Field, K. G. (2007). Detection of Bacteroidales fecal
indicators and the zoonotic pathogens E. coli O157: H7, Salmonella, and
Campylobacter in river water. Environmental science & technology, 41(6), 1856-1862.
Walters, S. P., Yamahara, K. M., & Boehm, A. B. (2009). Persistence of nucleic acid
markers of health-relevant organisms in seawater microcosms: implications for their use
in assessing risk in recreational waters. Water Research, 43(19), 4929-4939.

Whitman, R. L., Shively, D. A., Pawlik, H., Nevers, M. B., & Byappanahalli, M. N. (2003).
Occurrence of Escherichia coli and enterococci in Cladophora (Chlorophyta) in
nearshore water and beach sand of Lake Michigan. Applied and Environmental
Microbiology, 69(8), 4714-4719.
Whitman, R. L., Przybyla-Kelly, K., Shively, D. A., & Byappanahalli, M. N. (2007).
Incidence of the enterococcal surface protein (esp) gene in human and animal fecal
sources. Environmental science & technology, 41(17), 6090-6095.

Appendix D. Temporal Studies, Tryptophan, and Optical Brighteners
PGST coordinated sample collection of EC over a 24-hour period, to test if there are advantages
to sampling at certain times of day. PGST collected water samples using a Hach Sigma SD 900
Portable Sampler (autosampler) which collected one sample per hour during the 24-hour
sampling periods. Variability in results between samples was enough to warrant a second test, to
determine the range of variability between split and replicate samples. A second collection
period was coordinated with personnel collecting samples by hand four times a day over 72
hours.
Temporal studies were conducted on the PGST Reservation, and in Jefferson County at Irondale
Creek and the Duckabush River. A temporal study was planned at Lofall Creek in Kitsap
County during the wet season of 2015-2016 however was eventually canceled after excessive
rainfall. Results showed that EC levels did vary significantly temporally, beyond the variability
found between split and replicate samples.
PGST recommends that future projects looking to utilize an autosampler should consider a
model which can be easily dismantled and autoclaved. Additionally, unless the autosampler is
going to be deployed regularly at a set location with proper infrastructure to house the
equipment, using personnel to collect samples by hand is likely the more practical approach.
Additionally, PGST used a Turner Designs Cyclops 7 Submersible Fluorometer with tryptophan
and optical brightener sensors to determine if in situ measurements of tryptophan and optical
brighteners are a useful proxy for identifying EC hotspots. Results showed no correlation
between optical brighteners and EC at the three time of day study sites where the fluorometer
was deployed. At one of the three sites, there was a weak correlation between EC and
tryptophan.
24-Hour Sampling- Preliminary Temporal Study
24-hour sampling was conducted between April 21 and 22nd
2015 on the PGST Reservation at Shoreline Survey Station
PGS 24, which was a confirmed hotspot from the wet season
survey. 24-hour sampling was also conducted in Jefferson
County at the Irondale Creek PIC monitoring station PH028
between August 26 and 27th 2015.
PGST staff used a programmable Hach Sigma SD 900 Portable
Sampler (autosampler), set up with a (24) 575mL Bottle Kit for
automated sampling. The autosampler was programmed to
automatically collect discrete water samples at preset or fixed-
interval times over no more than a 24-hour period. These
containers were cleaned and decontaminated between 24-hour
sampling events. At the end of the 24-hour test, PGST
personnel transferred water samples into 110 milliliter bottles
Photo Credit: Devon Hayes, Hans Daubenberger
deploying autosampler and optical brightener
probe at Irondale Creek.

and immediately delivered them to the laboratory for analysis. Two to three blind split replicates
were also delivered to the lab to examine variation. PGST staff programmed the autosampler to
pump water through the tubing between samples to prevent bacteria growth and potential bias in
analytical results.
PGST also collected discrete grab samples at the beginning before installing the autosampler and
the end of the sampling period. This was to ensure samples were representative of the stream
conditions at the time period and not potentially contaminated by bacteria from previous
collection events, or otherwise influenced by the holding time or sampling system.
Results from the Reservation ranged between 1.0 and 248.1 mpn/100mL. The standard deviation
was 63.7 and the coefficient of variation was 2.08, showing that results were disperse between
samples taken at different times of day at this site. Irondale Creek yielded higher EC levels with
a lower variation. Results ranged between 7701 and 24196 mpn/100mL with a standard deviation
of 5750.1 and a coefficient of variation of 0.33.
During the 24hr sampling period of Irondale Creek, a Turner Designs Cyclops 7 Submersible
Fluorometer was also deployed, to sample tryptophan and optical brightener levels at 15 minute
intervals. Results showed a minor correlation between EC levels and tryptophan (r = 0.2453,
Figure 1), but much less association with optical brighteners (r = 0.1662).
Figure 1. Tryptophan and EC levels at Irondale Creek
72-Hour Sampling
This sampling design was intended to determine variation between different temporal samples
and single events (collected within 20 minutes). Greater variation between single event samples
than the variation amongst different temporal samples would suggest there is no benefit to
implementing temporal sampling, however if variation between single event samples is
-
5,000
10,000
15,000
20,000
25,000
30,000
0
2
4
6
8
10
12
14
16
EC (
mp
n/1
00
mL)
Tryp
top
han
(R
FU)
Time of Day
Tryptophan RFU Ecoli Poly. (Tryptophan RFU) Poly. (Ecoli)

significantly less than variation between temporal samples, then temporal sampling may improve
hotspot identification.
72-hour sampling was conducted on the PGST Reservation upstream of Shoreline Survey station
PGS 19, near Bud Purser Lane. The other 72-hour test location was at the Duckabush River
tributary (also known as Pierce Creek) next to the Brinnon Volunteer Fire Station (42). The
PGST Environmental Contractor (Devon Hayes) collected the water samples by hand during the
72hr test according to standard operating procedures for collection and handling EC samples.
Methods
Collection events took place at 8am, 12pm, 3pm, and 8pm on Oct. 31st-Nov. 2nd at the PGST
Reservation site and on Nov. 14th-16th at the Duckabush River. Two 100 mL and three 50 mL
samples were collected from the stream within 30 seconds of one another. Next, the first 100 mL
sample was gently agitated and 50 mL was poured into the sixth sample bottle to produce a split
replicate. This process was repeated for the second 100 mL sample to create a second split
replicate, for a total of seven samples to be delivered to the lab.
At 3pm, three additional replicates were collected and held overnight, to determine whether
longer holding time affected results of sample analysis. Field blank samples consisting of
distilled water were submitted blind to the laboratory at a rate of one per sample batch. Salinity
analysis was conducted on Duckabush River samples to test for effects of high tide on the site.
Sampling on the PGST Reservation was located in a stream well above the high tide line and
therefore did not require salinity analysis.
Samples were delivered to the laboratory immediately following collection at 8am, 12pm, and
3pm, excepting the three additional field replicates collected at 3pm. 8pm samples were
submitted to the laboratory immediately following the 8am sample collection, with the 8am
samples and the select replicates from 3pm the day before.
The Turner Designs Cyclops 7 Submersible Fluorometer was deployed at the PGST Reservation
site just downstream of the EC sampling location on Oct. 30th and retrieved on Nov. 3rd. The
fluorometer was deployed at the Duckabush River just after the 12pm measurement on Nov. 14th,
and retrieved on Nov 18th. Optical brighteners and amino acid tryptophan measurements were set
to be taken every 15min. The values recorded 15min before, during, and 15min after the EC
sampling event times were averaged to give corresponding tryptophan and optical brightener
values.
Results
A total of 99 water samples were collected over 72hrs for PGST Reservation EC analysis,
including 6 blanks of distilled water. The first 7 samples were collected at the shoreline, and the
rest upstream primarily for safe access, and a more controlled environment that adequately
represented site conditions. Analytical results for EC ranged between less than 10 mpn/100mL
to 783 mpn/100mL, which was detected at 8pm on 10/31/16 (Figure 2).

For the Duckabush River 72-hour test, 104 water samples were collected for EC analysis,
including 12 distilled water blanks. 10 water samples were analyzed for salinity after the sample
station was found inundated by king tides. EC results ranged from less than 10 mpn/100mL to 63
mpn/100mL, which was detected at 3pm on the third day (Figure 2).
Figure 2. Results of 72-hr E. coli test. Results of primary samples (n = 5 for each sampling event, no splits or blanks
included) were averaged for each sampling event.
In the Duckabush River, E. coli values were highest at 8:00am on each of the three days
sampled. At 8:00pm on October 31st, E. coli values at Bud Purser were approximately 4x higher
than results from any other sampling event at that site during the 3 days studied. EC values
varied significantly with time of day, in both systems, for each day sampled (Table 1). Samples
did not vary notably within a single sampling event, however variance did increase as EC values
increased.
Table 1. P-values for analysis of variance between EC sampling events (TOD) for Bud Purser and Duckabush
(Single Factor Anova). *indicates a significant result
Bud Purser Duckabush
Date P-value Date P-value
31-Oct 3.38E-15* 14-Nov 0.012226*
1-Nov 1.3E-05* 15-Nov 0.046141*
2-Nov 0.008859* 16-Nov 0.000164*
Split samples were not significantly different from their counterparts in either system (BP p =
0.8178, DB p = 0.7489, Anova: Two-Factor without Replication). Holding samples on ice for 6-
17.5hrs before delivering them to the lab did not significantly alter results (BP p = 0.8025, DB p
= 0.4770 Anova: Two-Factor without Replication).
At both sites Tryptophan and Optical Brightener values varied significantly between days
(Tryptophan: DB p = 0.036616, BP p = 5.13E-07, Optical Brighteners: DB p = 4.62E-09, BP p
=1.63E-15). Time of day had varied results (Tables 2 and 3).
0
100
200
300
400
500
600
Day 1
8am
Day 1
12pm
Day 1
3pm
Day 1
8pm
Day 2
8am
Day 2
12pm
Day 2
3pm
Day 2
8pm
Day 3
8am
Day 3
12pm
Day 3
3pm
Day 3
8pm
EC
(m
pn/1
00
mL
)
Time
PGST Reservation EC
Duckabush River EC

Table 2. P-values for analysis of variance between Tryptophan sampling events for Bud Purser and Duckabush
(Single Factor Anova, except 14-Nov which was a t-Test paired two sample for means). *indicates a significant
result
Bud Purser Duckabush
Date P-value Date P-value
31-Oct 5.87E-10* 14-Nov 0.97613
1-Nov 0.081139 15-Nov 0.065428
2-Nov 0.074953 16-Nov 0.177793
Table 3. P-values for analysis of variance between Optical Brighteners sampling events for Bud Purser and
Duckabush (Single Factor Anova, except 14-Nov which was a t-Test paired two sample for means). *indicates a
significant result
Bud Purser Duckabush
Date P-value Date P-value
31-Oct 0.026521* 14-Nov 0.076448
1-Nov 0.001722* 15-Nov 1.01E-05*
2-Nov 0.349408 16-Nov 4.13E-07*
Despite the variability, both Tryptophan, and Optical Brighteners were significantly higher in
Bud Purser than in the Duckabush River (p = 4.49E-05, p = 1.38E-27 respectively). Optical
brighteners were highest at Bud Purser on Nov 1st, and Tryptophan was highest on October 31st
(Figure 3, Figure 4). There was no correlation between Tryptophan or Optical Brightener values
and E. coli levels, suggesting that neither can serve as a sufficient proxy for EC at the two sites
tested.
Figure 3. Results of the 72-hr optical brighteners data collection. Values are an average of results collected within a
30-min time window of corresponding EC sampling event times (n=3 for each sampling event).
Figure 4. Results of the 72-hr tryptophan data collection. Values are an average of results collected within a 30-min
time window of corresponding EC sampling event times (n = 3 for each sampling event).
0.00
100.00
200.00
300.00
400.00
500.00
Day 1
8am
Day 1
12pm
Day 1
3pm
Day 1
8pm
Day 2
8am
Day 2
12pm
Day 2
3pm
Day 2
8pm
Day 3
8am
Day 3
12pm
Day 3
3pm
Day 3
8pm
Flu
ore
scen
ce r
esp
onse
(R
FU
)
Time
PGST Reservation
Duckabush River
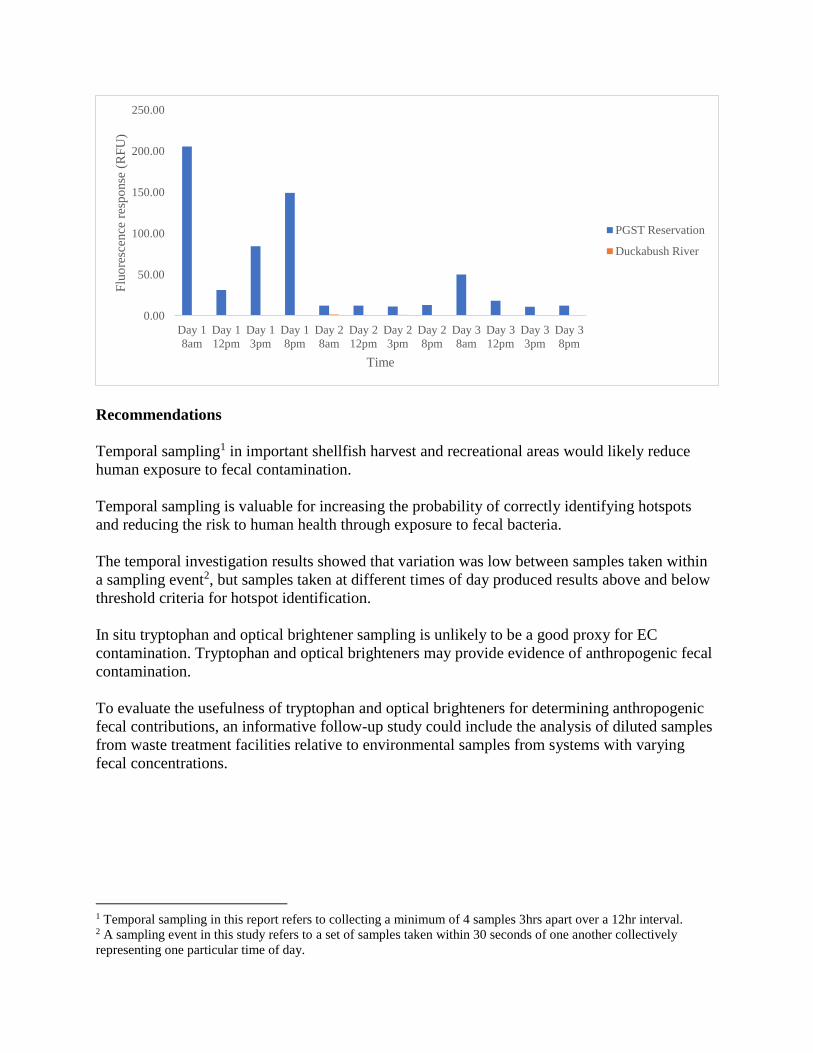
Recommendations
Temporal sampling1 in important shellfish harvest and recreational areas would likely reduce
human exposure to fecal contamination.
Temporal sampling is valuable for increasing the probability of correctly identifying hotspots
and reducing the risk to human health through exposure to fecal bacteria.
The temporal investigation results showed that variation was low between samples taken within
a sampling event2, but samples taken at different times of day produced results above and below
threshold criteria for hotspot identification.
In situ tryptophan and optical brightener sampling is unlikely to be a good proxy for EC
contamination. Tryptophan and optical brighteners may provide evidence of anthropogenic fecal
contamination.
To evaluate the usefulness of tryptophan and optical brighteners for determining anthropogenic
fecal contributions, an informative follow-up study could include the analysis of diluted samples
from waste treatment facilities relative to environmental samples from systems with varying
fecal concentrations.
1 Temporal sampling in this report refers to collecting a minimum of 4 samples 3hrs apart over a 12hr interval. 2 A sampling event in this study refers to a set of samples taken within 30 seconds of one another collectively
representing one particular time of day.
0.00
50.00
100.00
150.00
200.00
250.00
Day 1
8am
Day 1
12pm
Day 1
3pm
Day 1
8pm
Day 2
8am
Day 2
12pm
Day 2
3pm
Day 2
8pm
Day 3
8am
Day 3
12pm
Day 3
3pm
Day 3
8pm
Flu
ore
scen
ce r
esp
onse
(R
FU
)
Time
PGST Reservation
Duckabush River