Embed Size (px)
Citation preview
Polyamide & Intermediates
Darrel Collier
Tecnon OrbiChem Seminar at KICHEM 2012Seoul - 2 November, 2012
Source: Tecnon OrbiChem
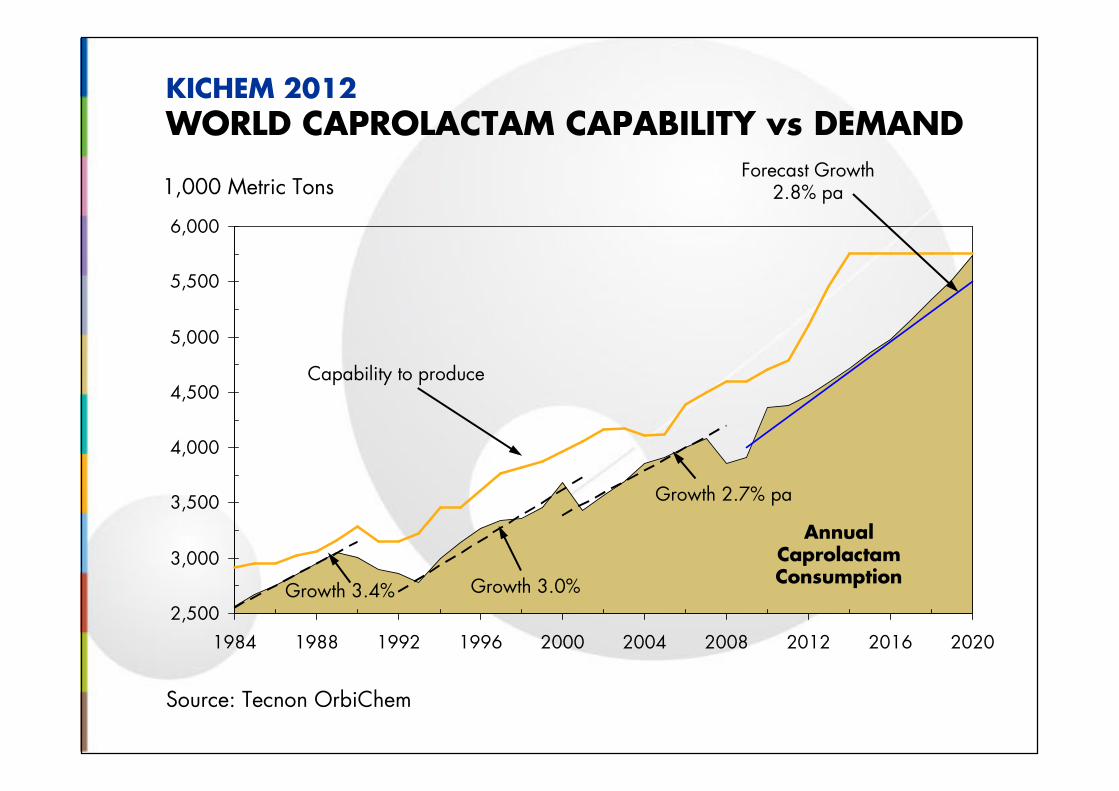
KICHEM 2012WORLD CAPROLACTAM CAPABILITY vs DEMAND
2,500
3,000
3,500
4,000
4,500
5,000
5,500
6,000
1984 1988 1992 1996 2000 2004 2008 2012 2016 2020
Forecast Growth 2.8% pa
Growth 3.4% Growth 3.0%
Growth 2.7% pa
Capability to produce
Annual CaprolactamConsumption
1,000 Metric Tons
2,500
3,000
3,500
4,000
4,500
5,000
5,500
6,000
1984 1988 1992 1996 2000 2004 2008 2012 2016 2020
Source: Tecnon OrbiChem
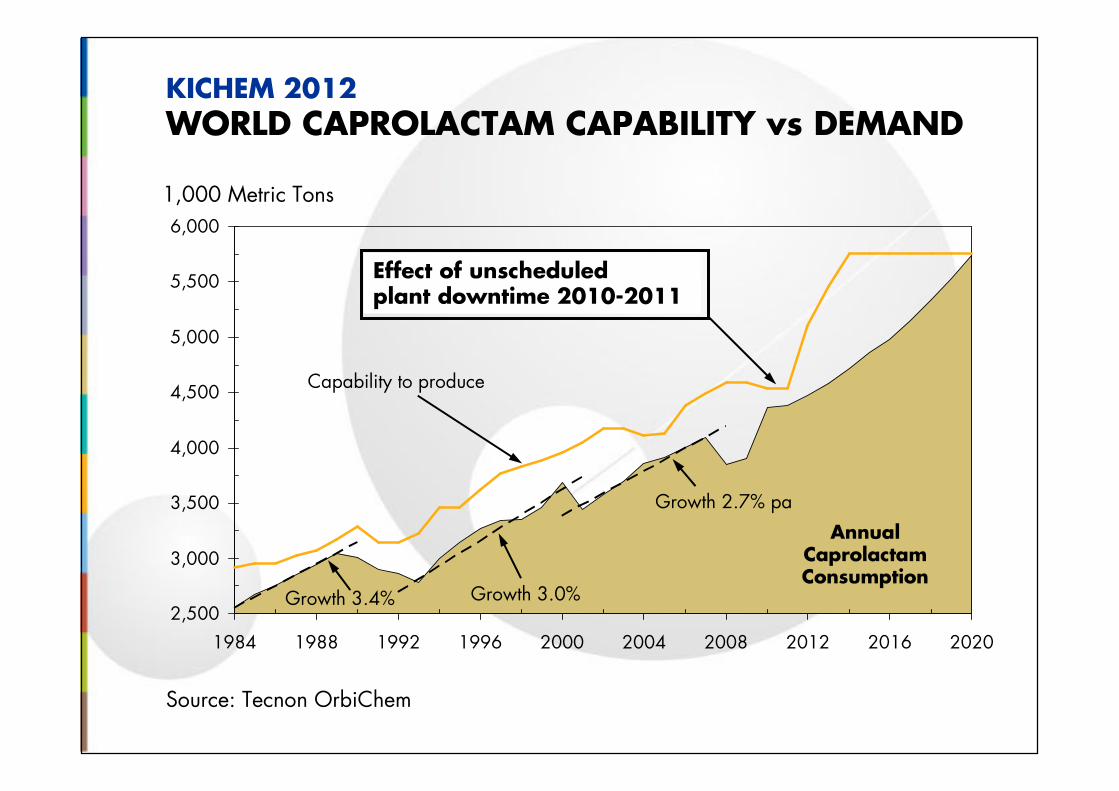
KICHEM 2012WORLD CAPROLACTAM CAPABILITY vs DEMAND
Growth 3.4% Growth 3.0%
Growth 2.7% pa
Capability to produce
Annual CaprolactamConsumption
1,000 Metric Tons
Effect of unscheduledplant downtime 2010-2011
BA
SF
DSM
Ub
e
Honeyw
ell
CPD
C
Ca
pro
Corp
Sum
itom
o
Lanx
ess
Leuna
C.I
.S
Pola
nd
Oth
ers
Bra
skem
MCC
Sin
op
ec
Bohui G
roup
Sha
nd
ong H
ongye-200
300
800
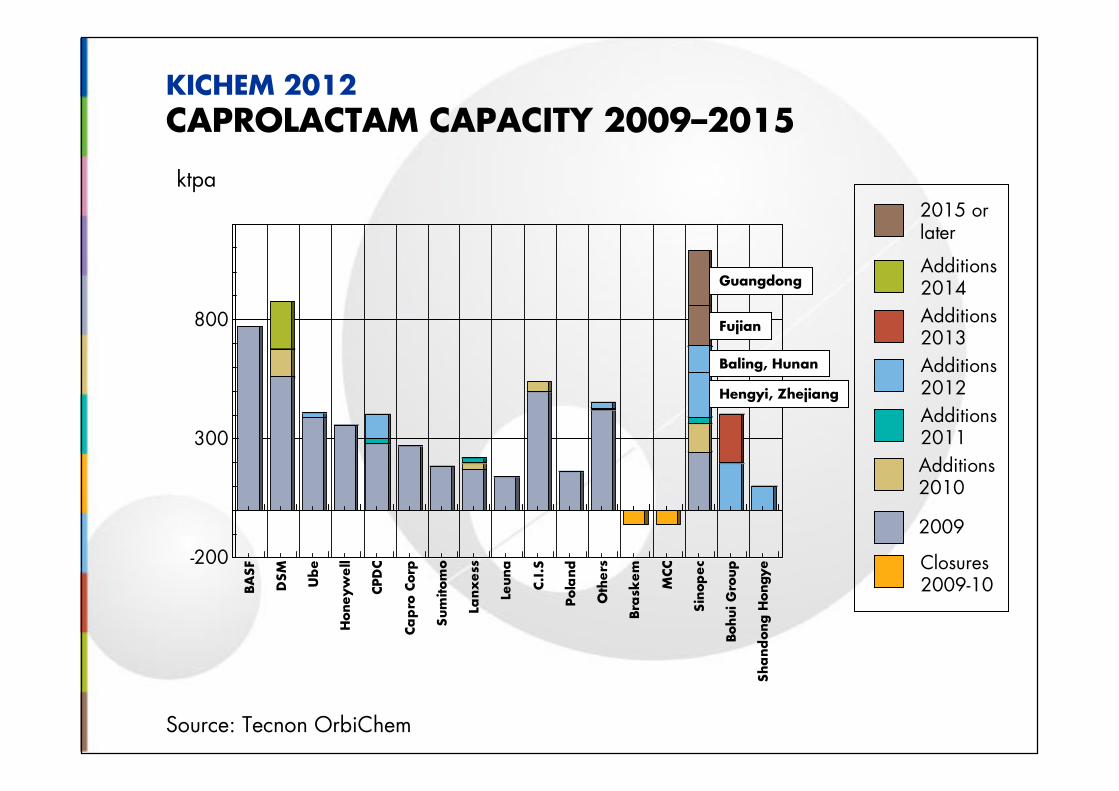
Baling, Hunan
Guangdong
Hengyi, Zhejiang
Fujian
KICHEM 2012CAPROLACTAM CAPACITY 2009–2015
Source: Tecnon OrbiChem
ktpa
Additions 2010
2009
Closures 2009-10
Additions 2011
Additions 2012
Additions 2013
Additions 2014
2015 orlater
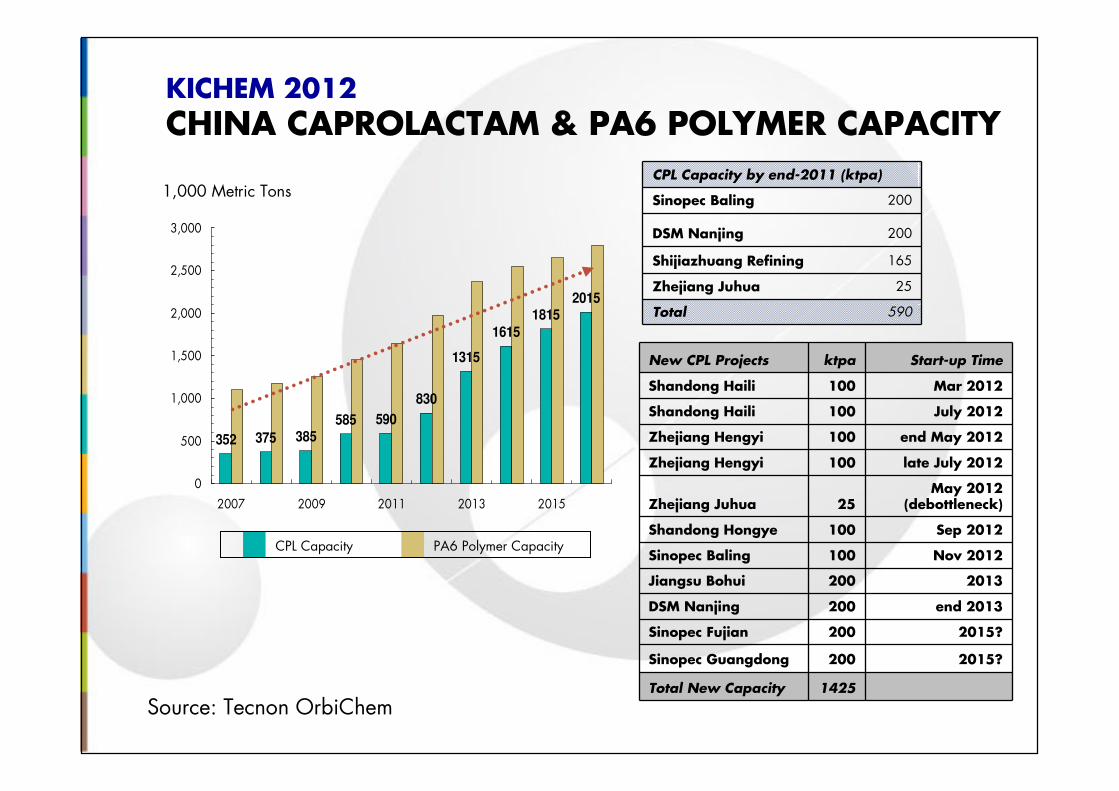
KICHEM 2012CHINA CAPROLACTAM & PA6 POLYMER CAPACITY
Source: Tecnon OrbiChem
1,000 Metric TonsCPL Capacity by end-2011 (ktpa)
Sinopec Baling 200
DSM Nanjing 200
Shijiazhuang Refining 165
Zhejiang Juhua 25
Total 590
352 375 385
585 590
830
1315
1615
1815
2015
0
500
1,000
1,500
2,000
2,500
3,000
2007 2009 2011 2013 2015
CPL Capacity PA6 Polymer Capacity
New CPL Projects ktpa Start-up Time
Shandong Haili 100 Mar 2012
Shandong Haili 100 July 2012
Zhejiang Hengyi 100 end May 2012
Zhejiang Hengyi 100 late July 2012
Zhejiang Juhua 25May 2012
(debottleneck)
Shandong Hongye 100 Sep 2012
Sinopec Baling 100 Nov 2012
Jiangsu Bohui 200 2013
DSM Nanjing 200 end 2013
Sinopec Fujian 200 2015?
Sinopec Guangdong 200 2015?
Total New Capacity 1425
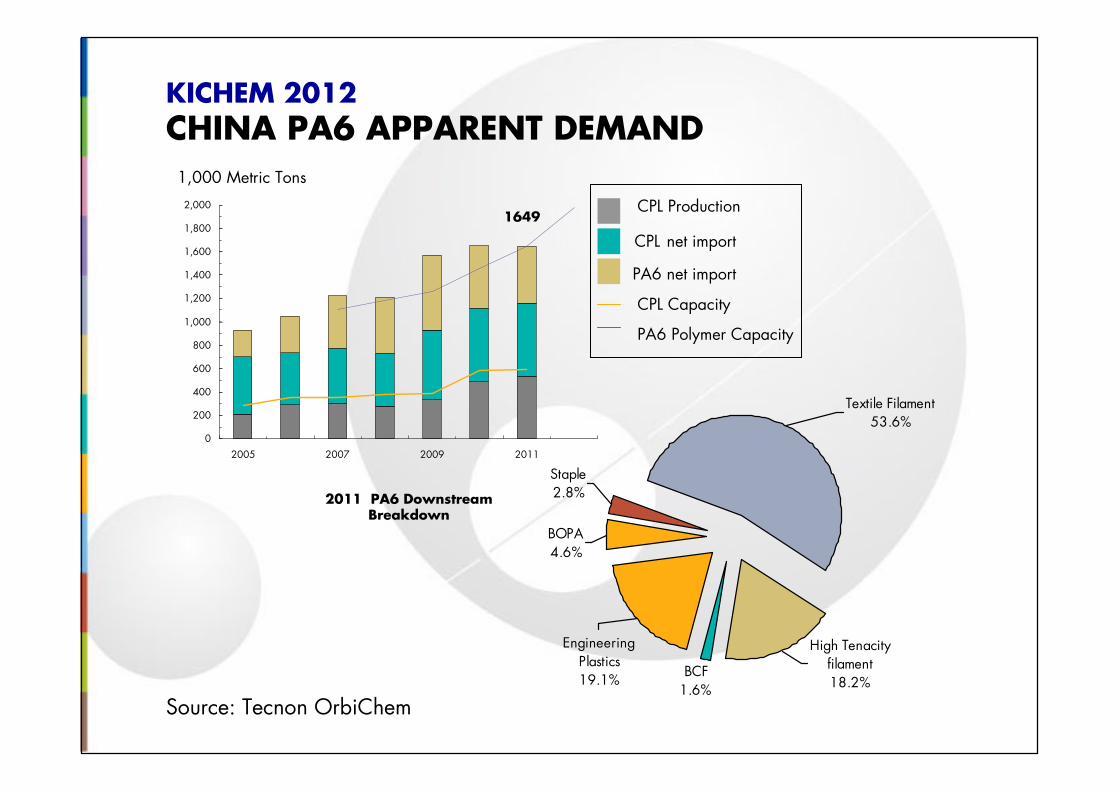
KICHEM 2012CHINA PA6 APPARENT DEMAND
Source: Tecnon OrbiChem
1,000 Metric Tons
0
200
400
600
800
1,000
1,200
1,400
1,600
1,800
2,000
2005 2007 2009 2011
1649
BOPA4.6%
EngineeringPlastics19.1%
Textile Filament53.6%
High Tenacityfilament18.2%
Staple2.8%
BCF1.6%
2011 PA6 Downstream Breakdown
PA6 net import
CPL net import
CPL Production
CPL Capacity
PA6 Polymer Capacity
KICHEM 2012
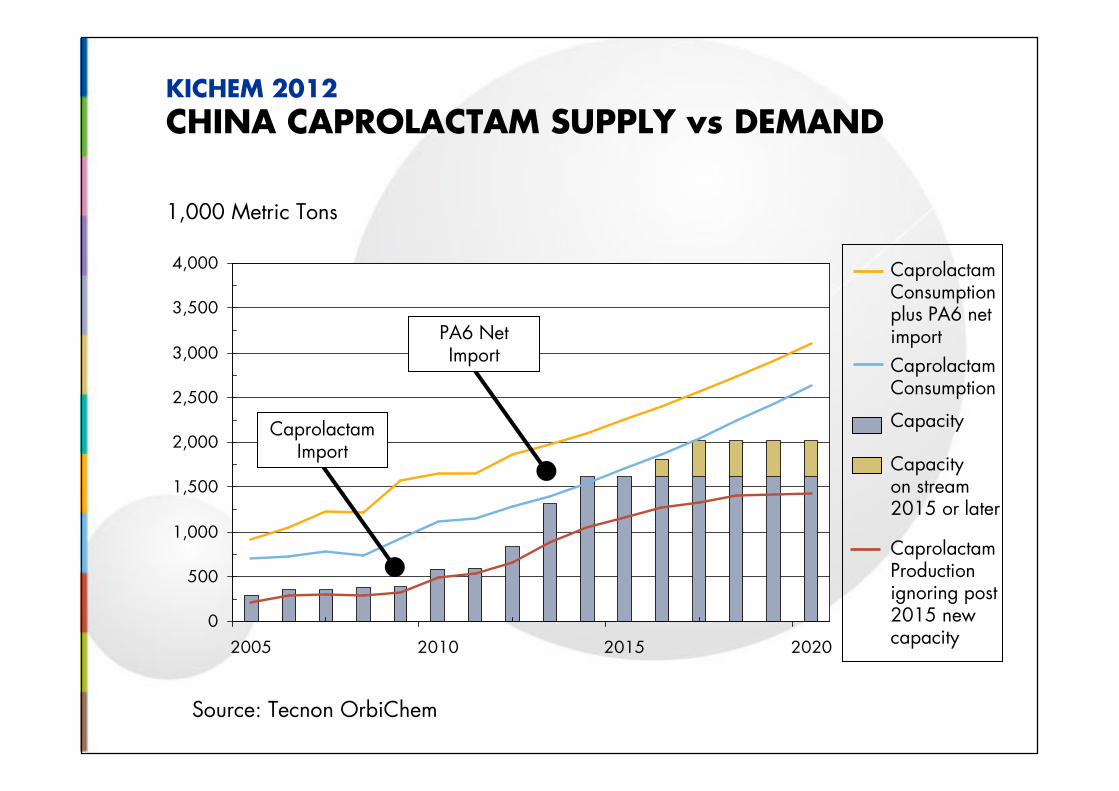
CHINA CAPROLACTAM SUPPLY vs DEMAND
Source: Tecnon OrbiChem
CaprolactamConsumption
CaprolactamConsumptionplus PA6 netimport
Capacity on stream2015 or later
Capacity
CaprolactamProductionignoring post 2015 new capacity
1,000 Metric Tons
0
500
1,000
1,500
2,000
2,500
3,000
3,500
4,000
2005 2010 2015 2020
CaprolactamImport
PA6 NetImport
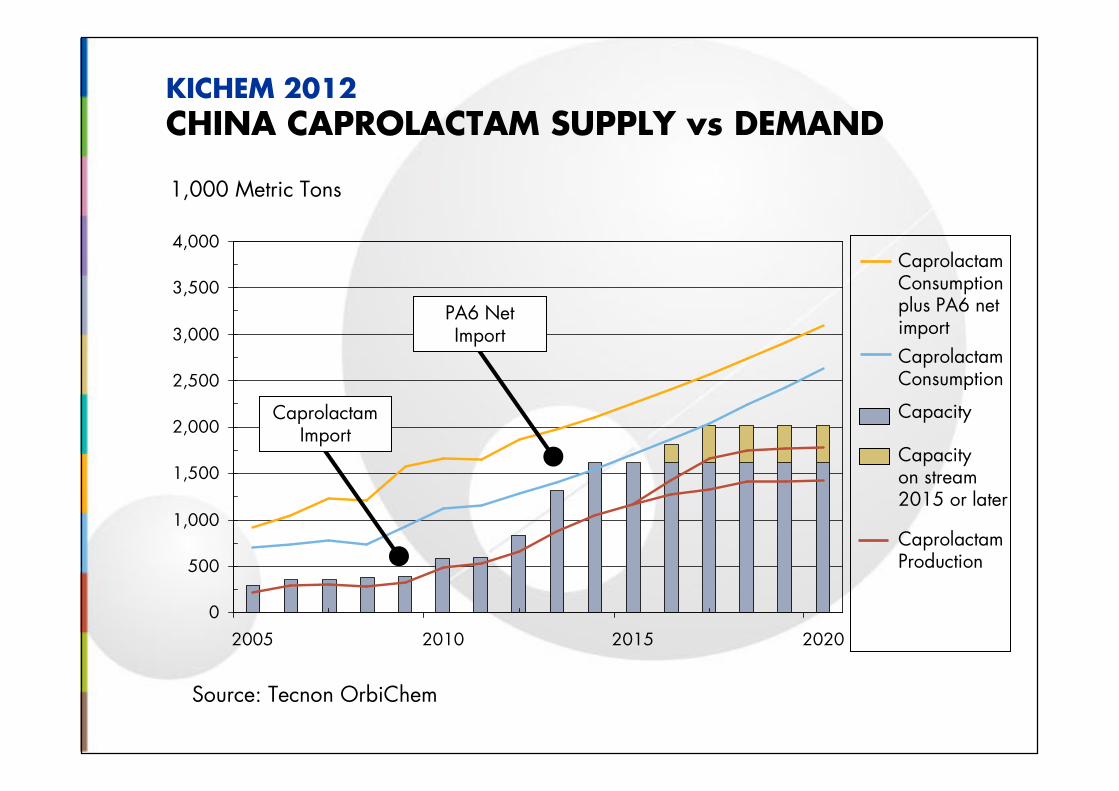
KICHEM 2012CHINA CAPROLACTAM SUPPLY vs DEMAND
Source: Tecnon OrbiChem
1,000 Metric Tons
0
500
1,000
1,500
2,000
2,500
3,000
3,500
4,000
2005 2010 2015 2020
CaprolactamImport
PA6 NetImport
CaprolactamConsumption
CaprolactamConsumptionplus PA6 netimport
Capacity on stream2015 or later
Capacity
CaprolactamProduction
ktpa
Source: Tecnon OrbiChem
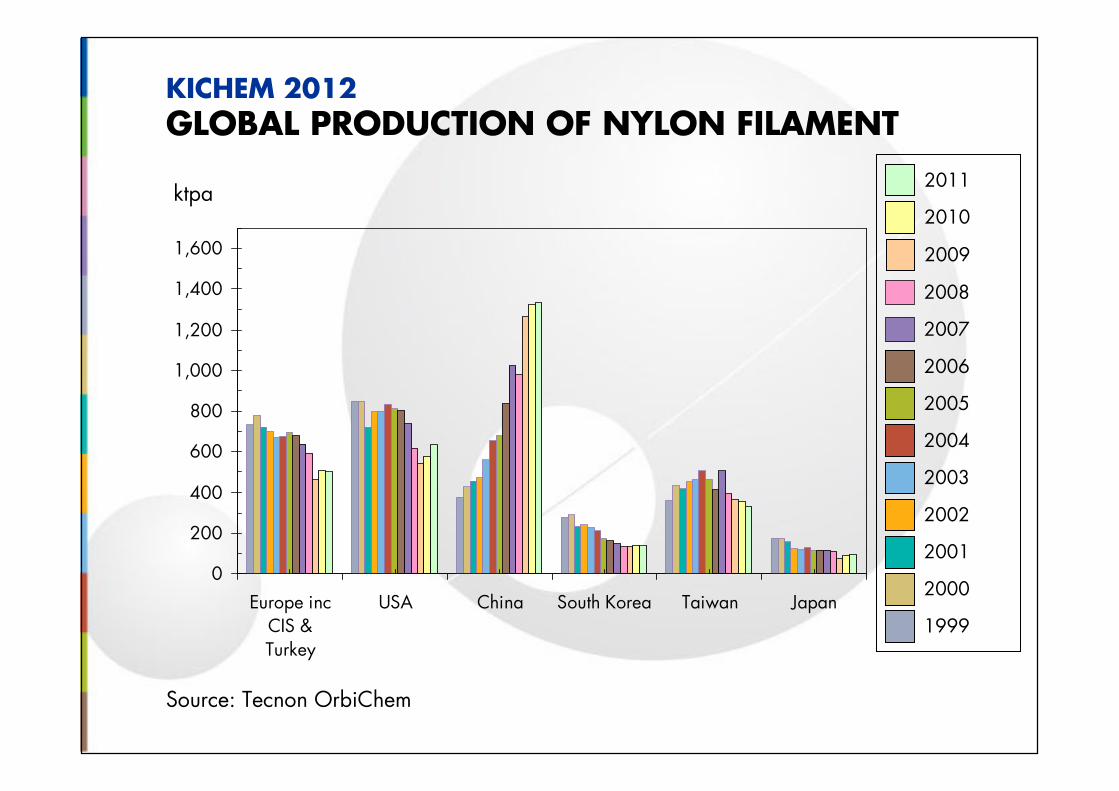
KICHEM 2012GLOBAL PRODUCTION OF NYLON FILAMENT
0
200
400
600
800
1,000
1,200
1,400
1,600
Europe incCIS &Turkey
USA China South Korea Taiwan Japan
2003
2004
2005
2006
1999
2000
2001
2002
2008
2009
2010
2011
2007
0
500
1,000
1,500
2,000
2,500
3,000
3,500
4,000
4,500
2000
2005
2010
2015
2020
Rest of the World
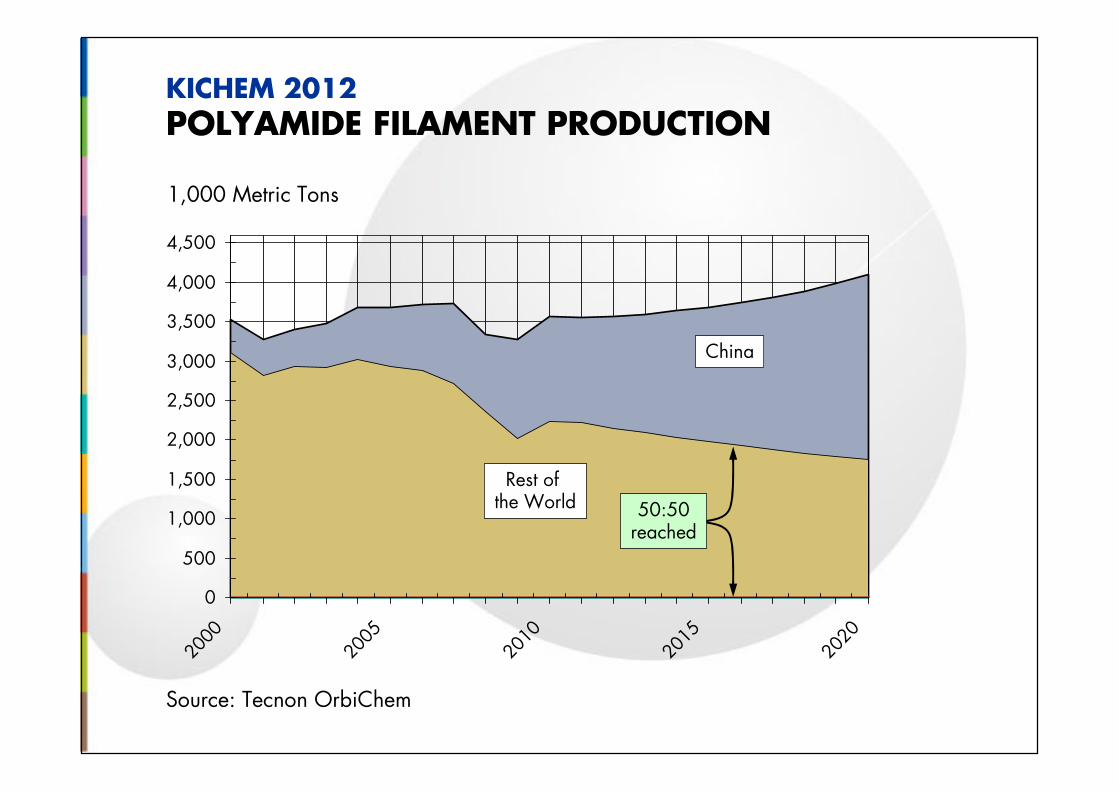
KICHEM 2012POLYAMIDE FILAMENT PRODUCTION
Source: Tecnon OrbiChem
China
50:50reached
1,000 Metric Tons
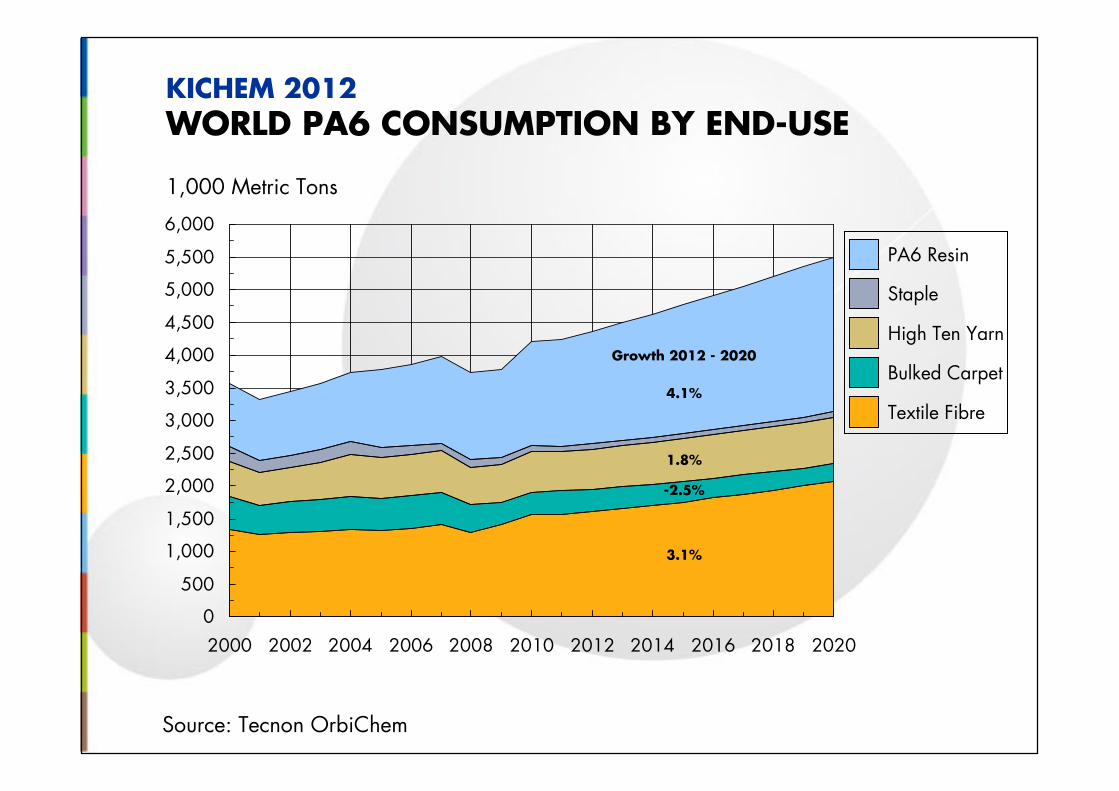
KICHEM 2012WORLD PA6 CONSUMPTION BY END-USE
Source: Tecnon OrbiChem
1,000 Metric Tons
0
500
1,000
1,500
2,000
2,500
3,000
3,500
4,000
4,500
5,000
5,500
6,000
2000 2002 2004 2006 2008 2010 2012 2014 2016 2018 2020
Textile Fibre
Bulked Carpet
High Ten Yarn
Staple
PA6 Resin
Growth 2012 - 2020
3.1%
1.8%
4.1%
-2.5%
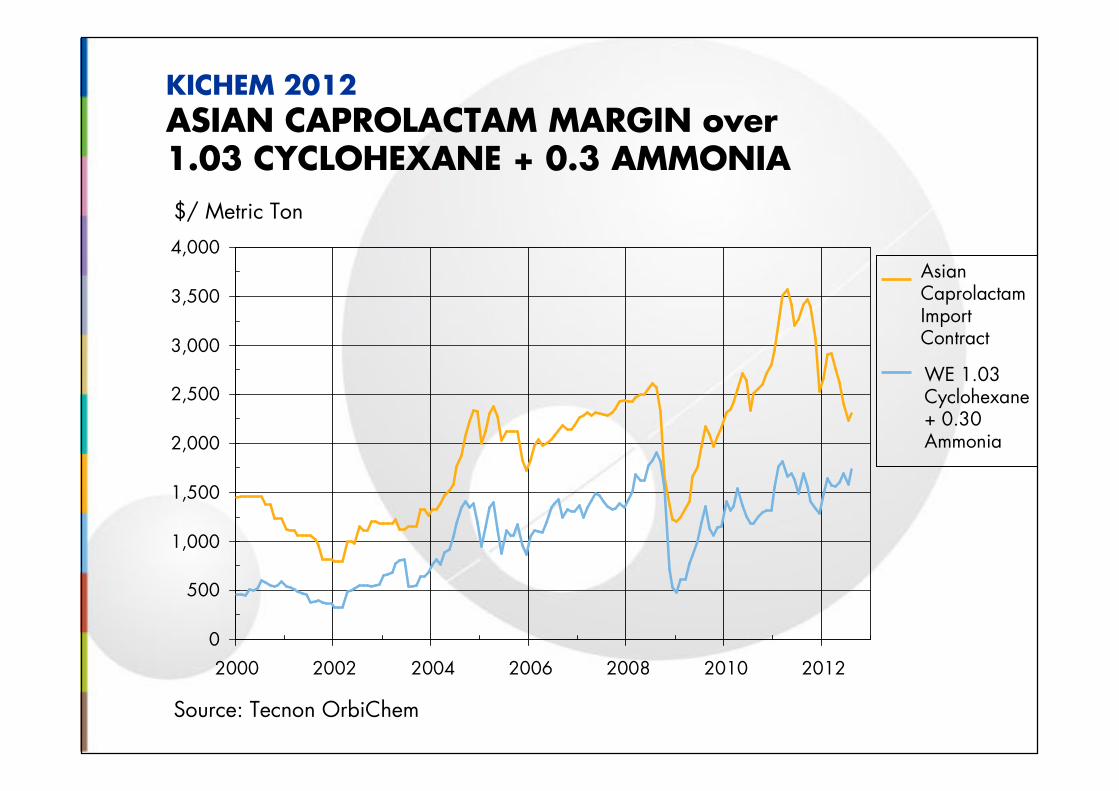
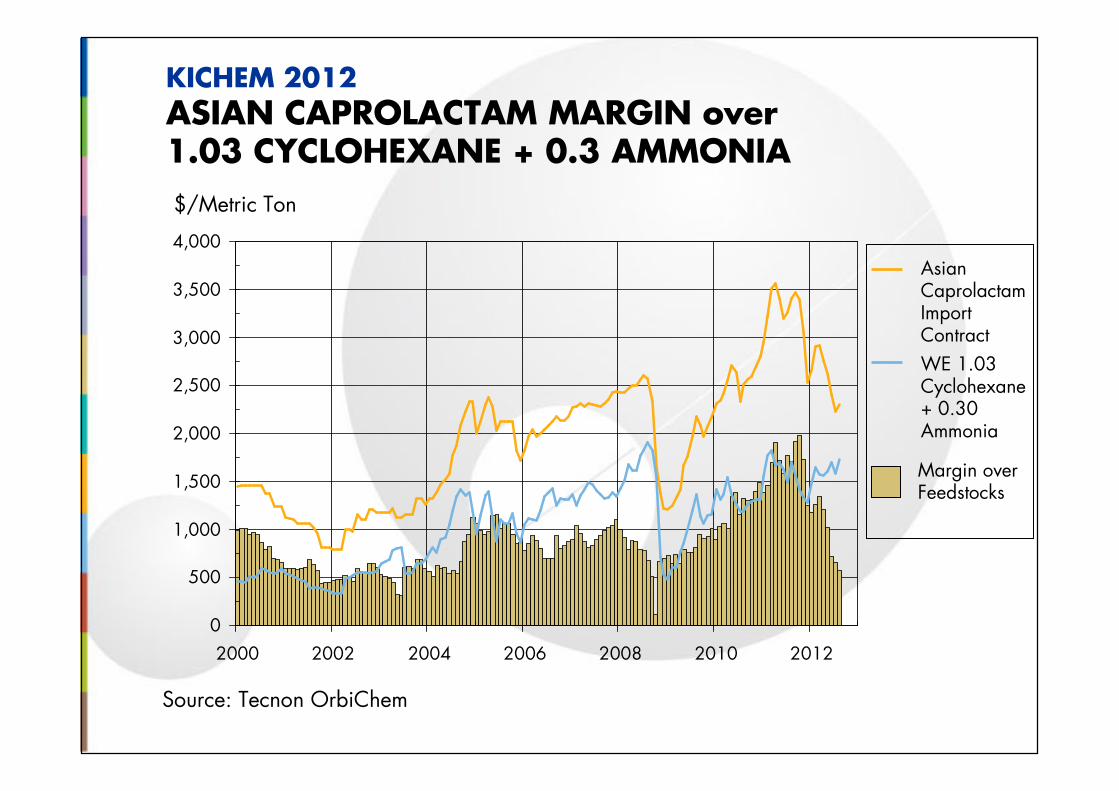
KICHEM 2012ASIAN CAPROLACTAM MARGIN over 1.03 CYCLOHEXANE + 0.3 AMMONIA
0
500
1,000
1,500
2,000
2,500
3,000
3,500
4,000
2000 2002 2004 2006 2008 2010 2012
$/ Metric Ton
WE 1.03 Cyclohexane+ 0.30 Ammonia
Asian CaprolactamImport Contract
Source: Tecnon OrbiChem
0
500
1,000
1,500
2,000
2,500
3,000
3,500
4,000
2000 2002 2004 2006 2008 2010 2012
$/Metric Ton
KICHEM 2012ASIAN CAPROLACTAM MARGIN over 1.03 CYCLOHEXANE + 0.3 AMMONIA
Margin over Feedstocks
WE 1.03 Cyclohexane+ 0.30 Ammonia
Asian CaprolactamImport Contract
Source: Tecnon OrbiChem
0
500
1,000
1,500
2,000
2,500
3,000
3,500
4,000
2000 2002 2004 2006 2008 2010 2012
$/Metric Ton
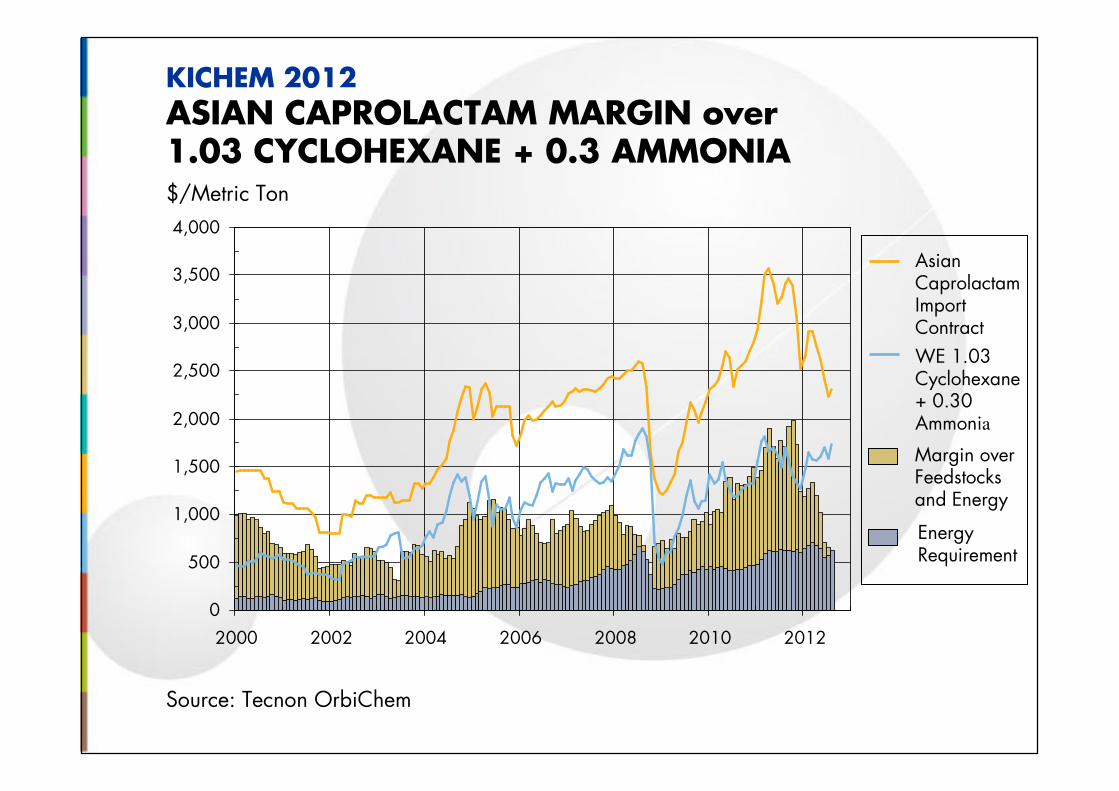
KICHEM 2012ASIAN CAPROLACTAM MARGIN over 1.03 CYCLOHEXANE + 0.3 AMMONIA
Source: Tecnon OrbiChem
WE 1.03 Cyclohexane+ 0.30 Ammonia
Asian CaprolactamImport Contract
Margin overFeedstocksand Energy
Energy Requirement
0
500
1,000
1,500
2,000
2,500
3,000
3,500
4,000
2000 2002 2004 2006 2008 2010 2012
$/Metric Ton
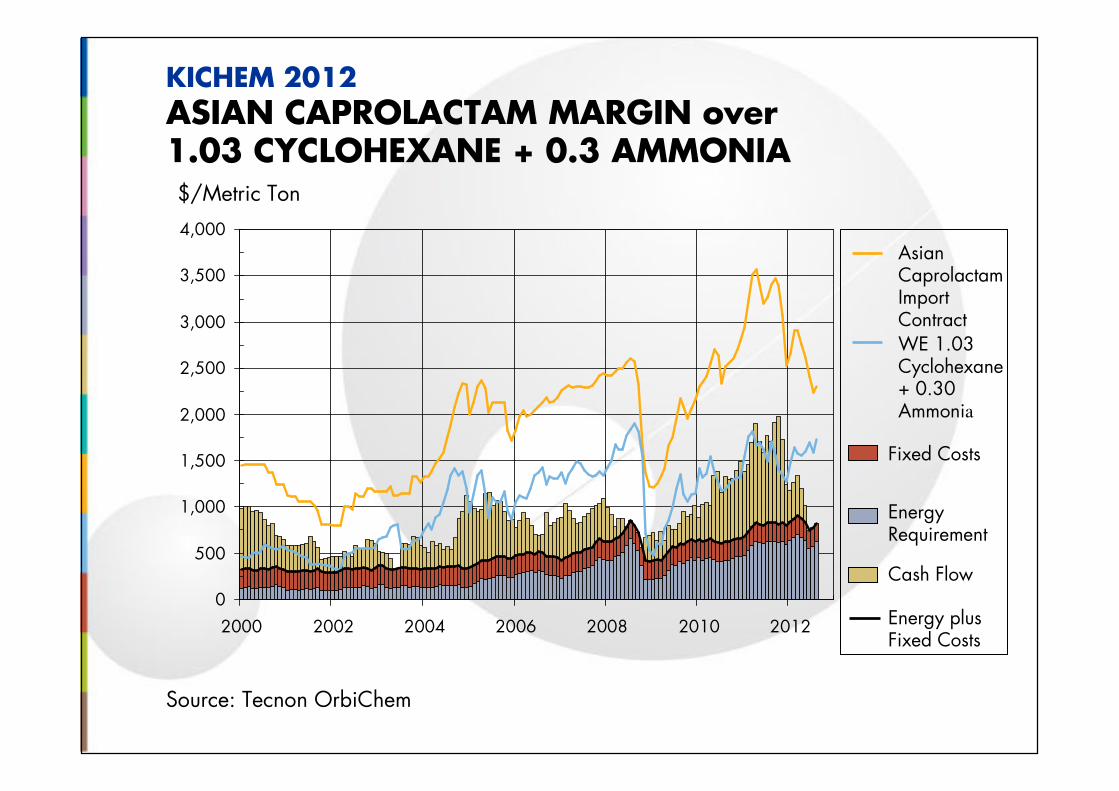
KICHEM 2012ASIAN CAPROLACTAM MARGIN over 1.03 CYCLOHEXANE + 0.3 AMMONIA
Source: Tecnon OrbiChem
WE 1.03 Cyclohexane+ 0.30 Ammonia
Asian CaprolactamImport Contract
Fixed Costs
Energy Requirement
Energy plus Fixed Costs
Cash Flow
-500
0
500
1,000
1,500
2,000
2,500
3,000
3,500
4,000
2000 2002 2004 2006 2008 2010 2012
$/Metric Ton
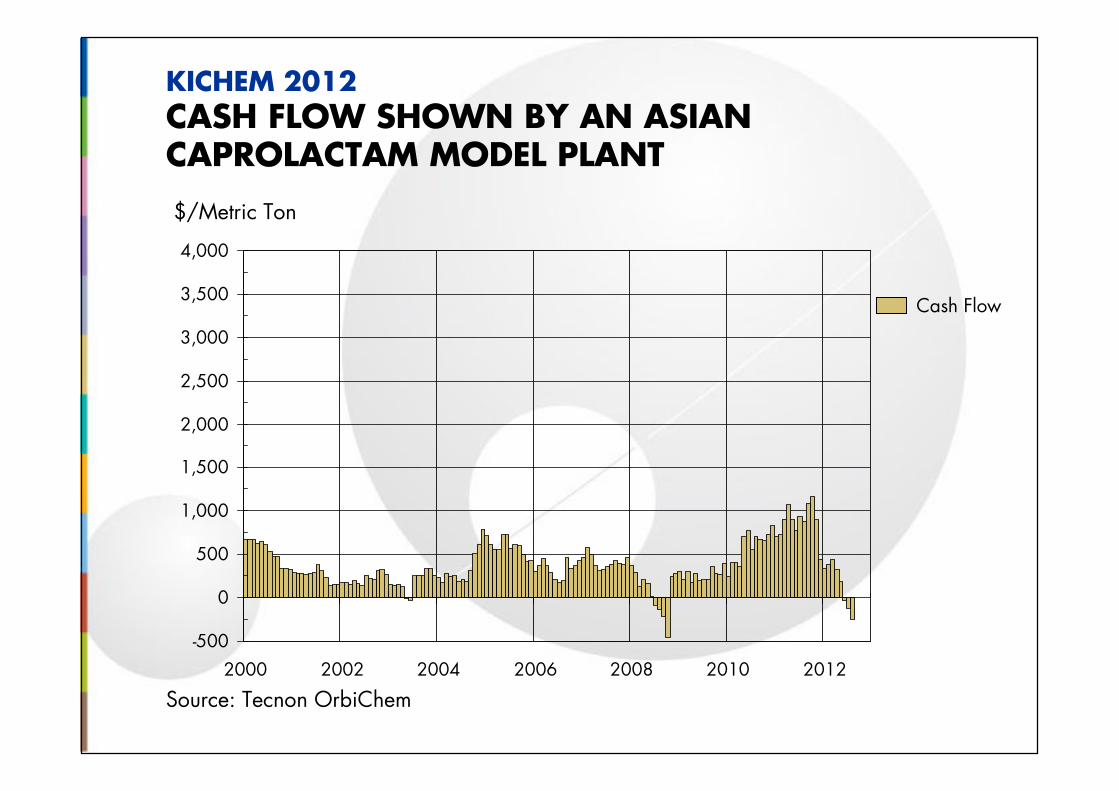
KICHEM 2012CASH FLOW SHOWN BY AN ASIANCAPROLACTAM MODEL PLANT
Source: Tecnon OrbiChem
Cash Flow
Source: Tecnon OrbiChem
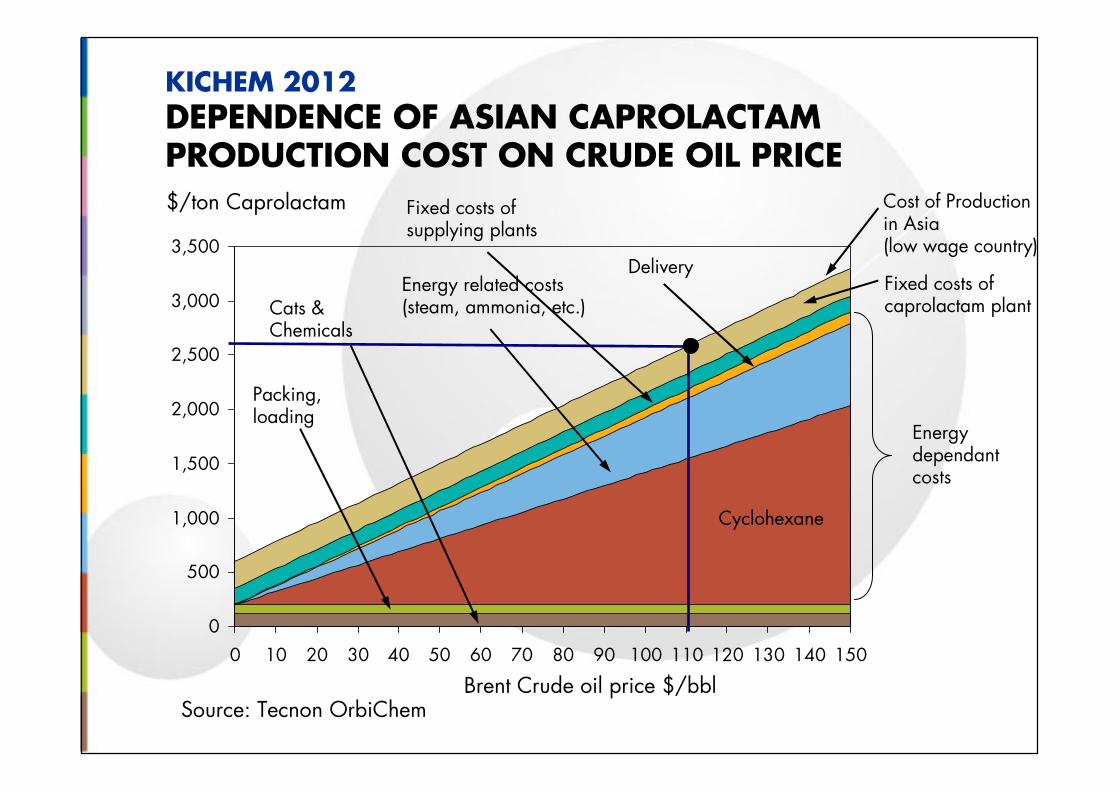
KICHEM 2012DEPENDENCE OF ASIAN CAPROLACTAM PRODUCTION COST ON CRUDE OIL PRICE
0
500
1,000
1,500
2,000
2,500
3,000
3,500
0 10 20 30 40 50 60 70 80 90 100 110 120 130 140 150
$/ton Caprolactam
Brent Crude oil price $/bbl
Cyclohexane
Energy related costs (steam, ammonia, etc.)
Delivery
Energy dependant costs
Packing, loading
Fixed costs of supplying plants
Cats & Chemicals
Fixed costs of caprolactam plant
Cost of Production in Asia (low wage country)
Source: Tecnon OrbiChem
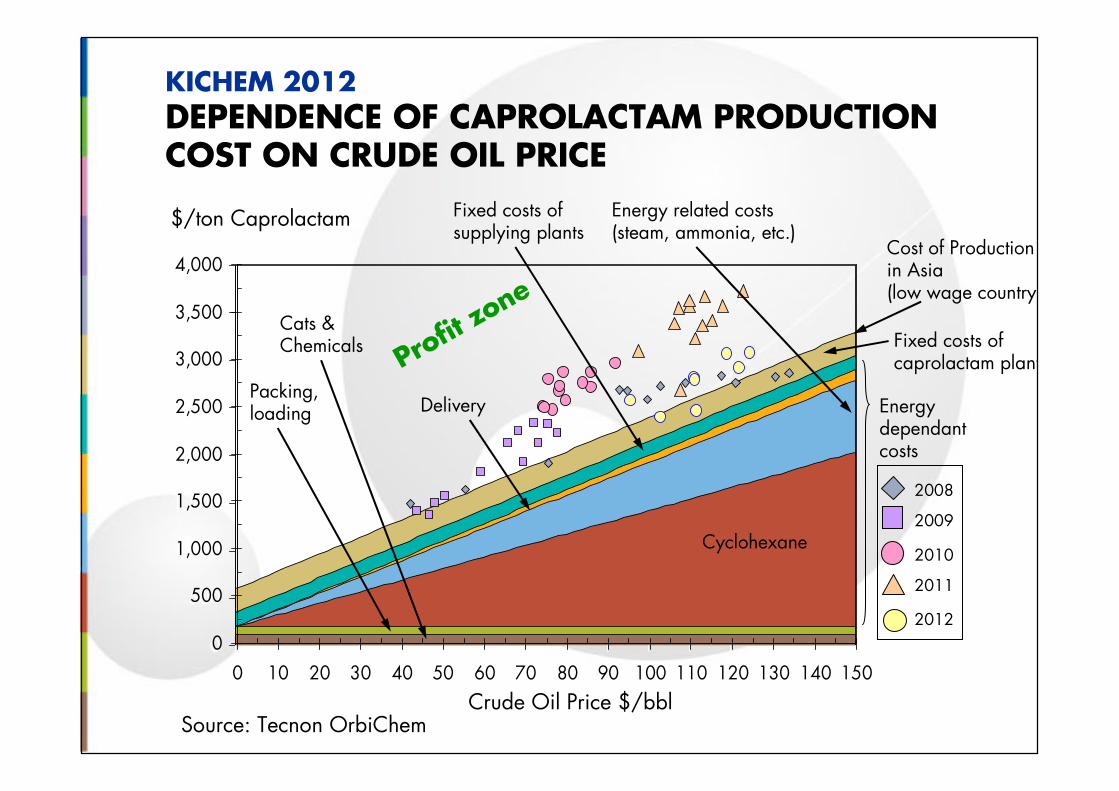
KICHEM 2012DEPENDENCE OF CAPROLACTAM PRODUCTION COST ON CRUDE OIL PRICE
0
500
1,000
1,500
2,000
2,500
3,000
3,500
4,000
0 10 20 30 40 50 60 70 80 90 100 110 120 130 140 150
0
500
1,000
1,500
2,000
2,500
3,000
3,500
4,000
0 10 20 30 40 50 60 70 80 90 100 110 120 130 140 150
$/ton Caprolactam
Cyclohexane
Packing, loading
Fixed costs of supplying plants
Cats & Chemicals Fixed costs of
caprolactam plant
Cost of Production in Asia (low wage country)
Energy dependant costs
Crude Oil Price $/bbl
Delivery
Energy related costs (steam, ammonia, etc.)
Profit zo
ne
2009
2008
2010
2011
2012
0
500
1000
1500
2000
2500
3000
3500
0 500 1000 1500 2000 2500 3000 3500 4000Cumulative Capacity (ktpa)
Cash Cost ($/ton)
Source: Tecnon OrbiChem
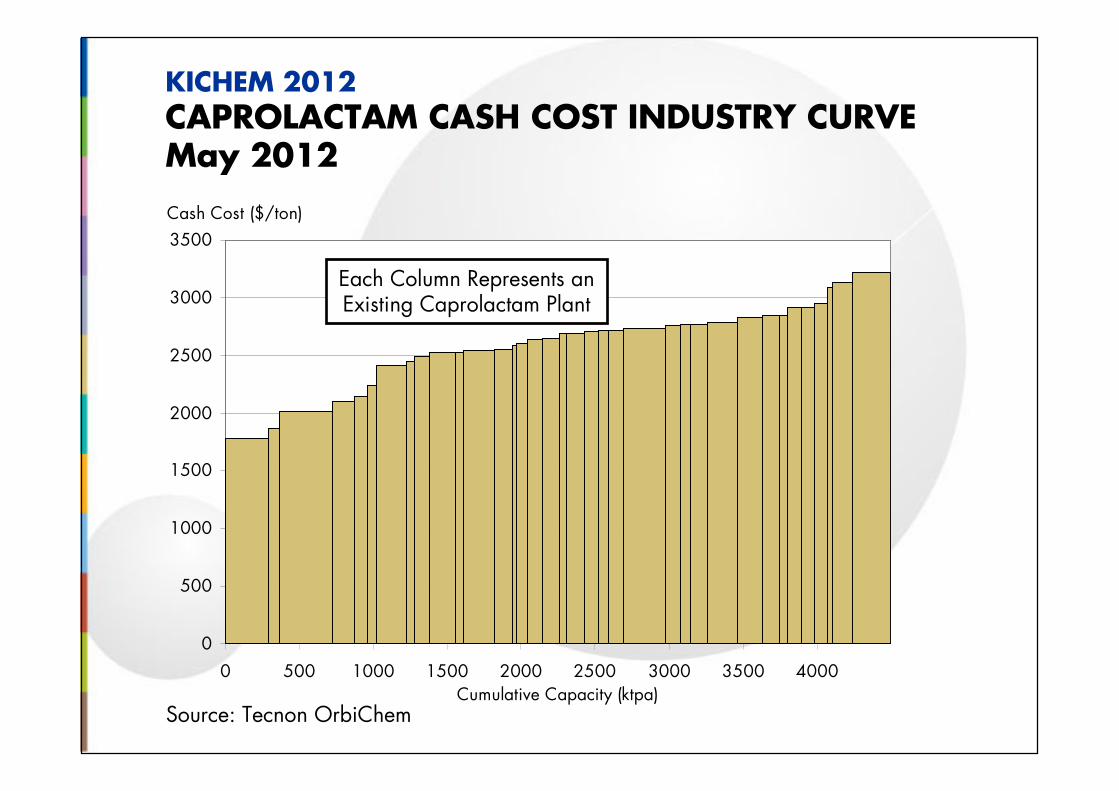
KICHEM 2012CAPROLACTAM CASH COST INDUSTRY CURVEMay 2012
Each Column Represents an Existing Caprolactam Plant
0
500
1,000
1,500
2,000
2,500
3,000
3,500
4,000
0 10 20 30 40 50 60 70 80 90 100 110 120 130 140 150
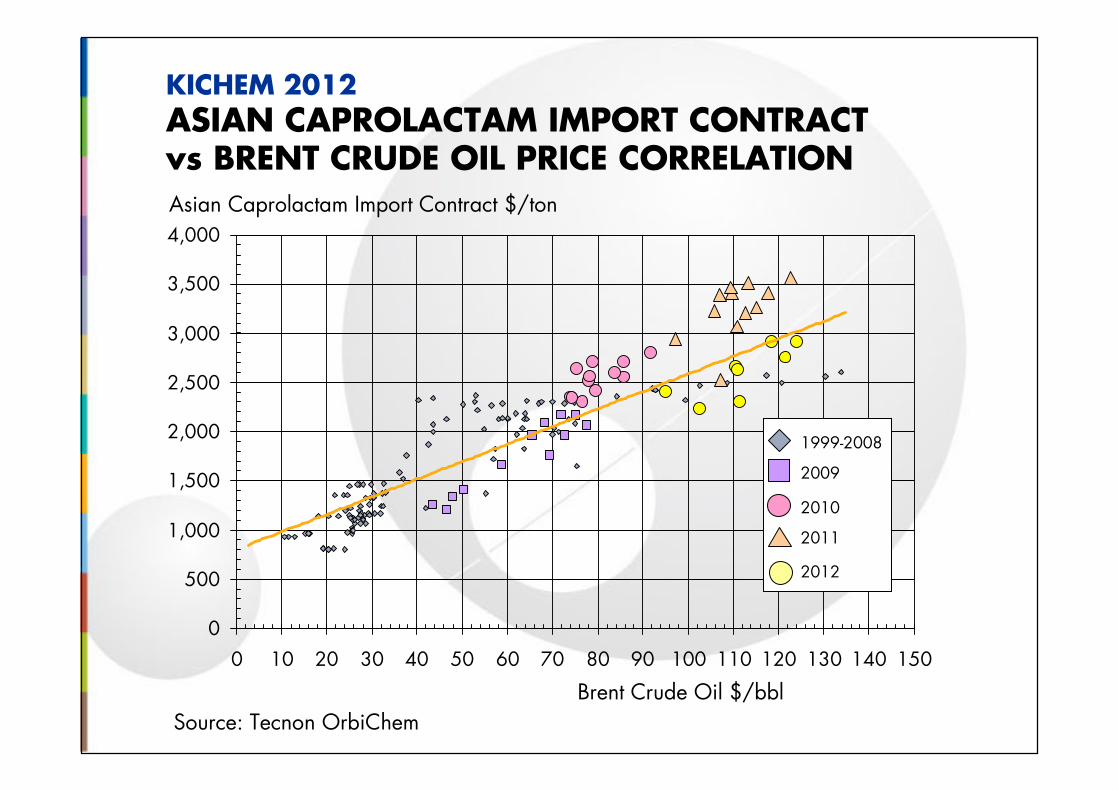
KICHEM 2012ASIAN CAPROLACTAM IMPORT CONTRACTvs BRENT CRUDE OIL PRICE CORRELATION
Source: Tecnon OrbiChem
Brent Crude Oil $/bbl
Asian Caprolactam Import Contract $/ton
2009
1999-2008
2010
2011
2012
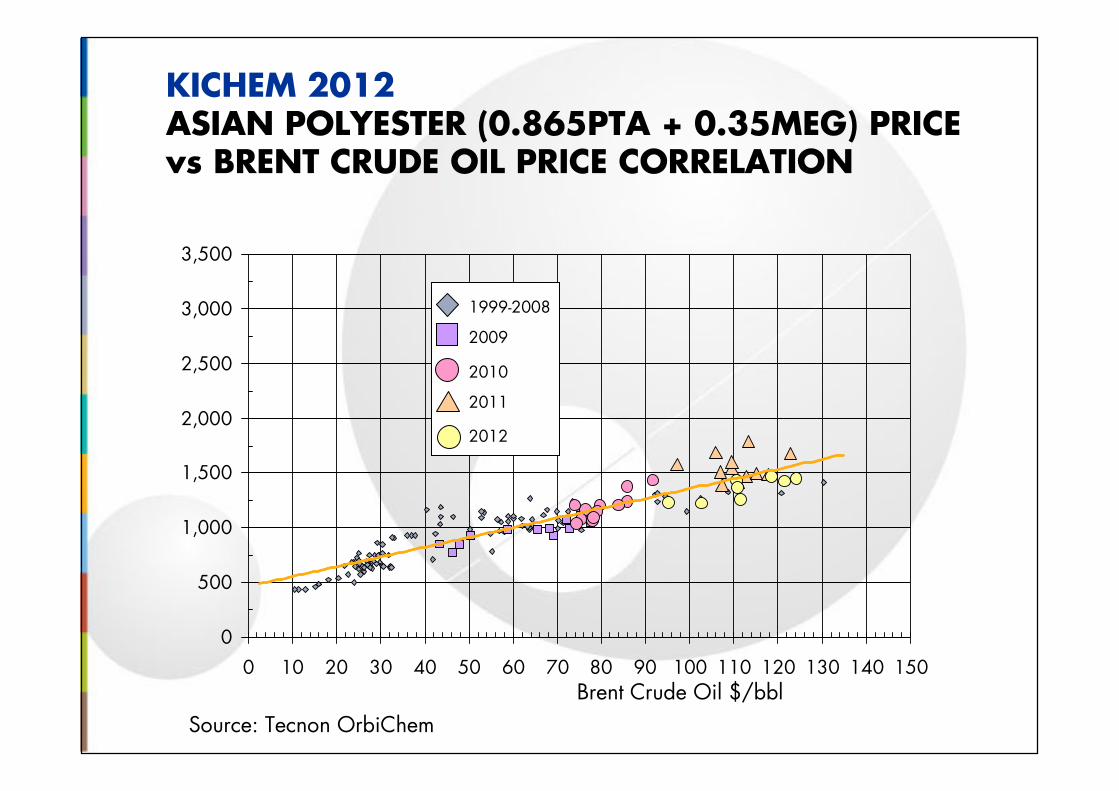
KICHEM 2012ASIAN POLYESTER (0.865PTA + 0.35MEG) PRICEvs BRENT CRUDE OIL PRICE CORRELATION
Source: Tecnon OrbiChem
0
500
1,000
1,500
2,000
2,500
3,000
3,500
0 10 20 30 40 50 60 70 80 90 100 110 120 130 140 150Brent Crude Oil $/bbl
2009
1999-2008
2010
2011
2012
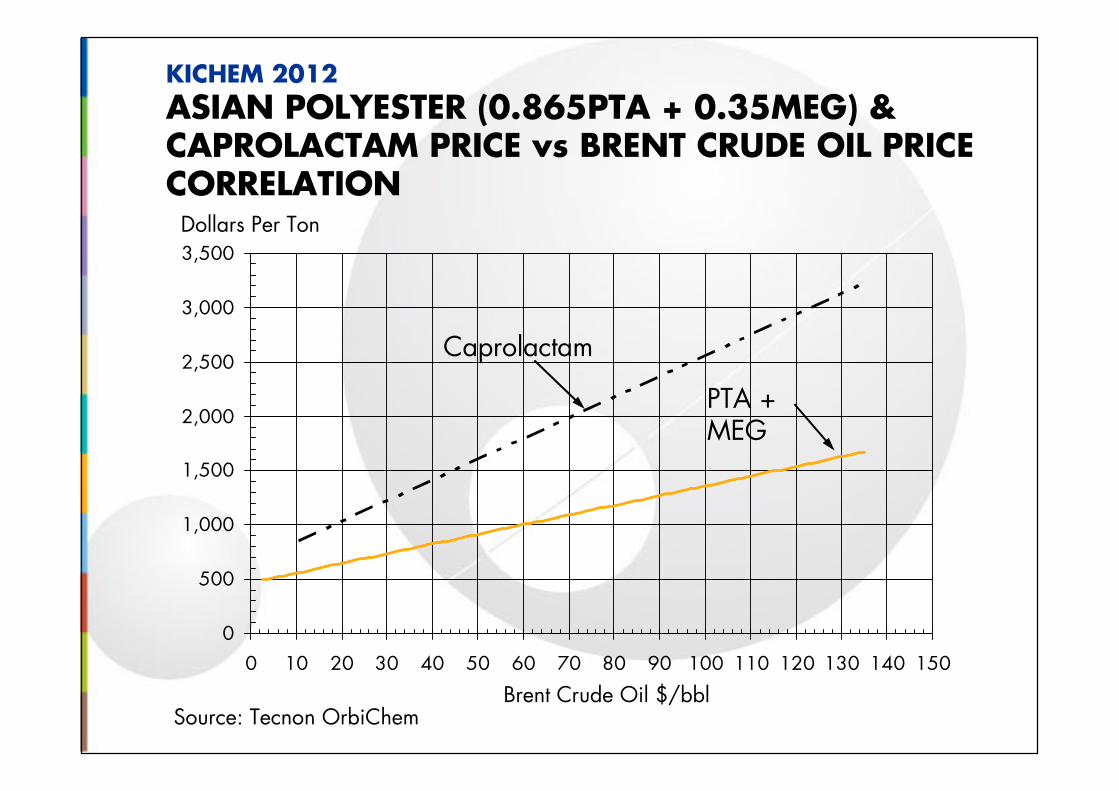
KICHEM 2012
ASIAN POLYESTER (0.865PTA + 0.35MEG) & CAPROLACTAM PRICE vs BRENT CRUDE OIL PRICE CORRELATION
Source: Tecnon OrbiChem
0
500
1,000
1,500
2,000
2,500
3,000
3,500
0 10 20 30 40 50 60 70 80 90 100 110 120 130 140 150
Brent Crude Oil $/bbl
Caprolactam
PTA + MEG
Dollars Per Ton
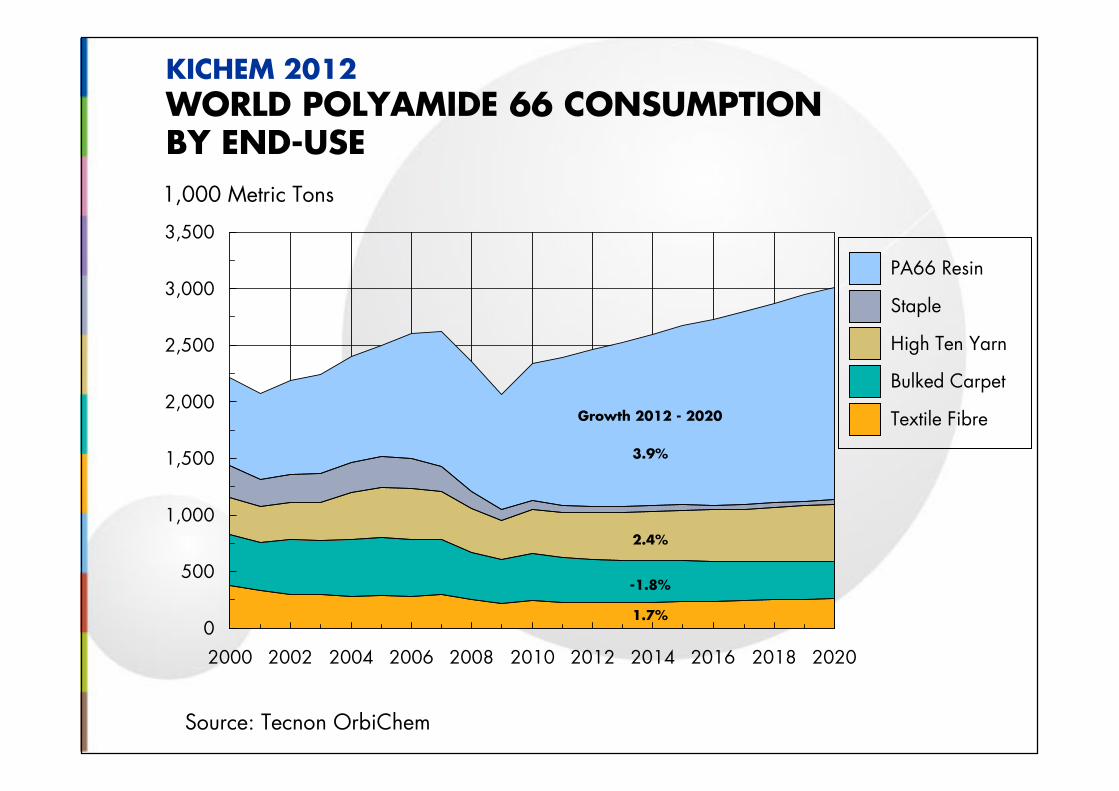
KICHEM 2012 WORLD POLYAMIDE 66 CONSUMPTIONBY END-USE
0
500
1,000
1,500
2,000
2,500
3,000
3,500
2000 2002 2004 2006 2008 2010 2012 2014 2016 2018 2020
Source: Tecnon OrbiChem
1,000 Metric Tons
Textile Fibre
Bulked Carpet
High Ten Yarn
Staple
PA66 Resin
Growth 2012 - 2020
1.7%
2.4%
3.9%
-1.8%
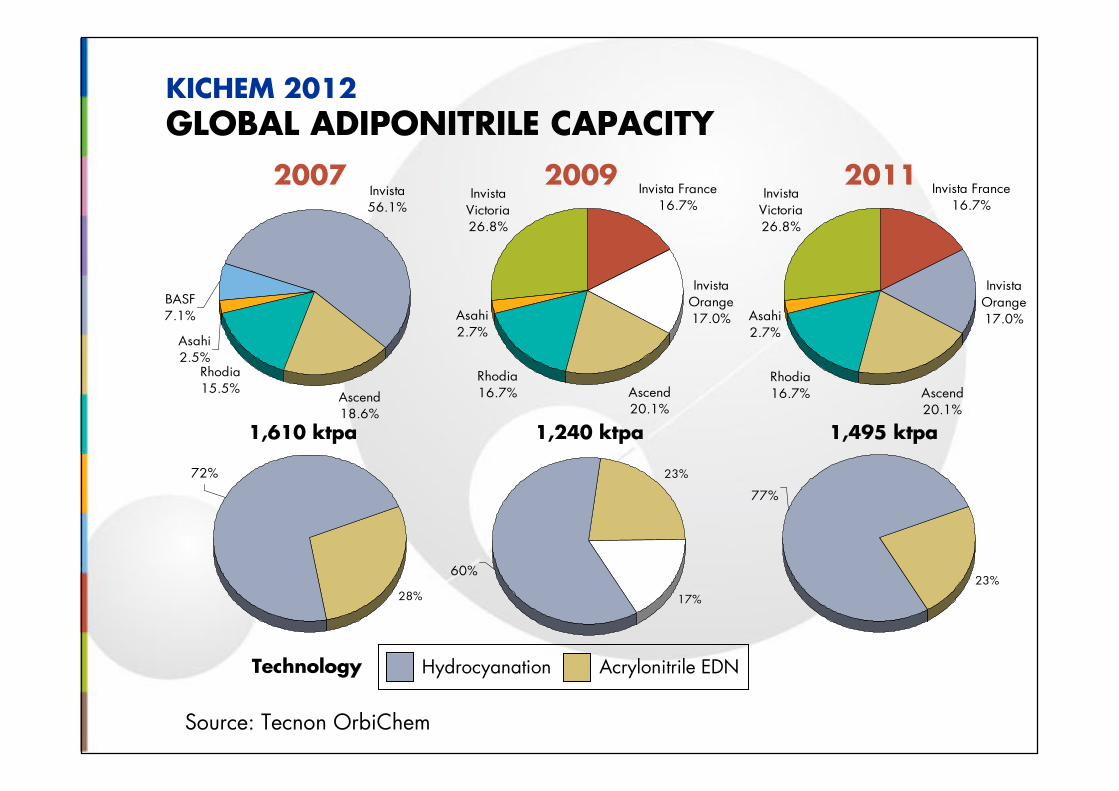
Source: Tecnon OrbiChem
KICHEM 2012GLOBAL ADIPONITRILE CAPACITY
Invista Orange17.0%
Ascend 20.1%
Rhodia 16.7%
Asahi 2.7%
Invista Victoria26.8%
Invista France16.7%
28%
72%
Invista56.1%
Ascend 18.6%
Rhodia 15.5%
BASF 7.1%
Asahi 2.5%
1,240 ktpa
Technology
2009
Invista Orange17.0%
Ascend 20.1%
Rhodia 16.7%
Asahi 2.7%
Invista Victoria26.8%
Invista France16.7%
23%
77%
1,610 ktpa 1,495 ktpa
20112007
Hydrocyanation Acrylonitrile EDN
23%
17%
60%
0
400
800
1,200
1,600
2,000
2,400
2,800
3,200
3,600
4,000
2000 2002 2004 2006 2008 2010 2012
$/Metric Ton
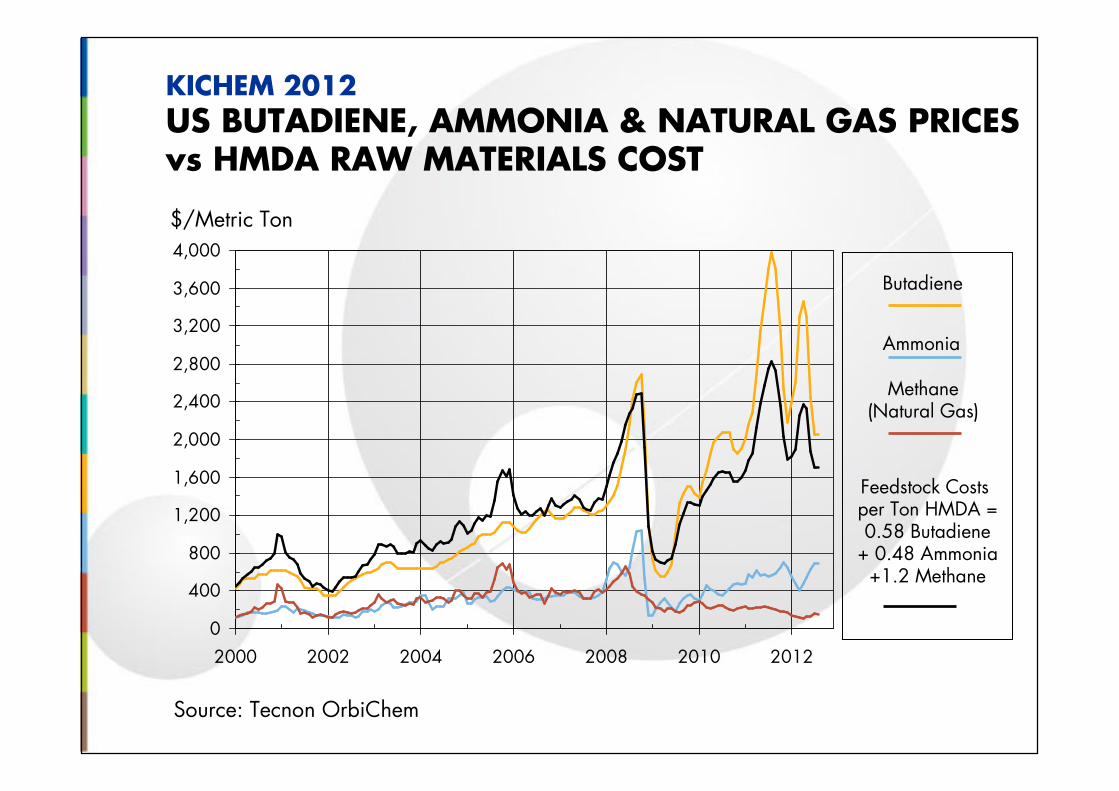
KICHEM 2012US BUTADIENE, AMMONIA & NATURAL GAS PRICES vs HMDA RAW MATERIALS COST
Source: Tecnon OrbiChem
Ammonia
Methane (Natural Gas)
Butadiene
Feedstock Costs per Ton HMDA =0.58 Butadiene
+ 0.48 Ammonia+1.2 Methane
Source: Tecnon OrbiChem
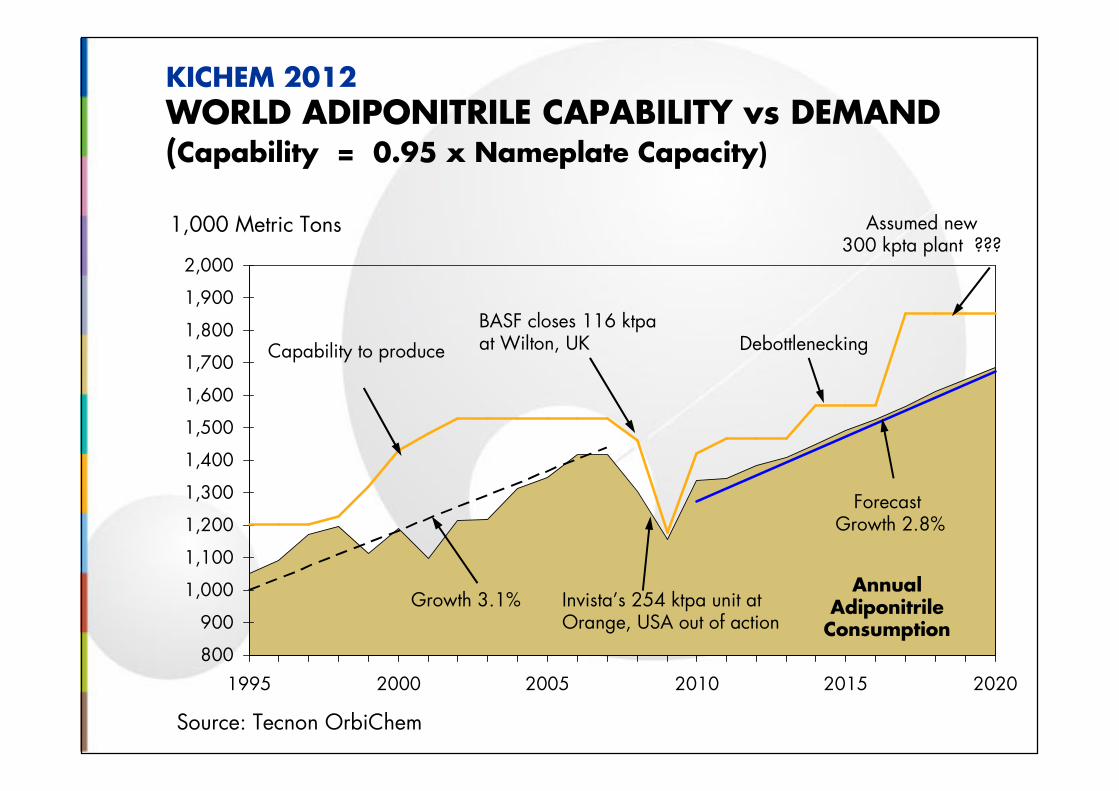
KICHEM 2012WORLD ADIPONITRILE CAPABILITY vs DEMAND (Capability = 0.95 x Nameplate Capacity)
800
900
1,000
1,100
1,200
1,300
1,400
1,500
1,600
1,700
1,800
1,900
2,000
1995 2000 2005 2010 2015 2020
Annual Adiponitrile
Consumption
Capability to produce
BASF closes 116 ktpaat Wilton, UK
Growth 3.1% Invista’s 254 ktpa unit atOrange, USA out of action
Assumed new300 kpta plant ???
1,000 Metric Tons
ForecastGrowth 2.8%
Debottlenecking
1,500
2,000
2,500
3,000
3,500
4,000
4,500
1995 1999 2003 2007 2011 2015 2019
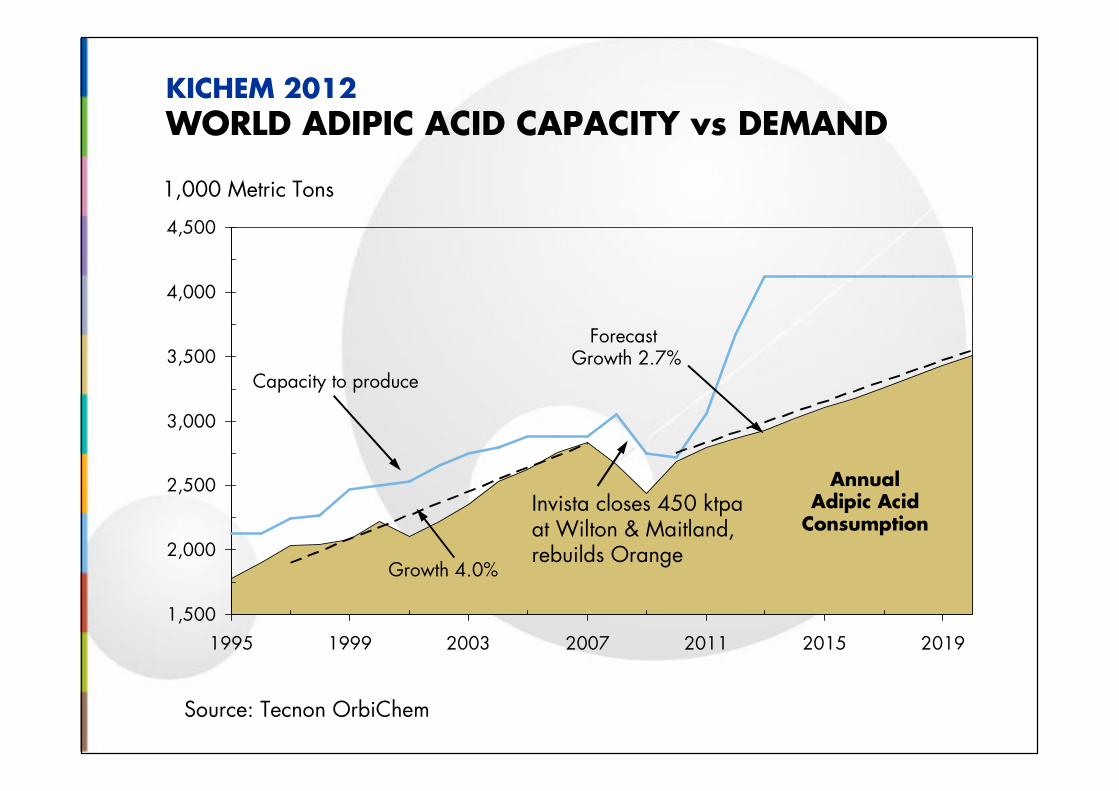
Source: Tecnon OrbiChem
AnnualAdipic Acid
Consumption
ForecastGrowth 2.7%
Capacity to produce
Invista closes 450 ktpaat Wilton & Maitland, rebuilds Orange
Growth 4.0%
1,000 Metric Tons
KICHEM 2012WORLD ADIPIC ACID CAPACITY vs DEMAND
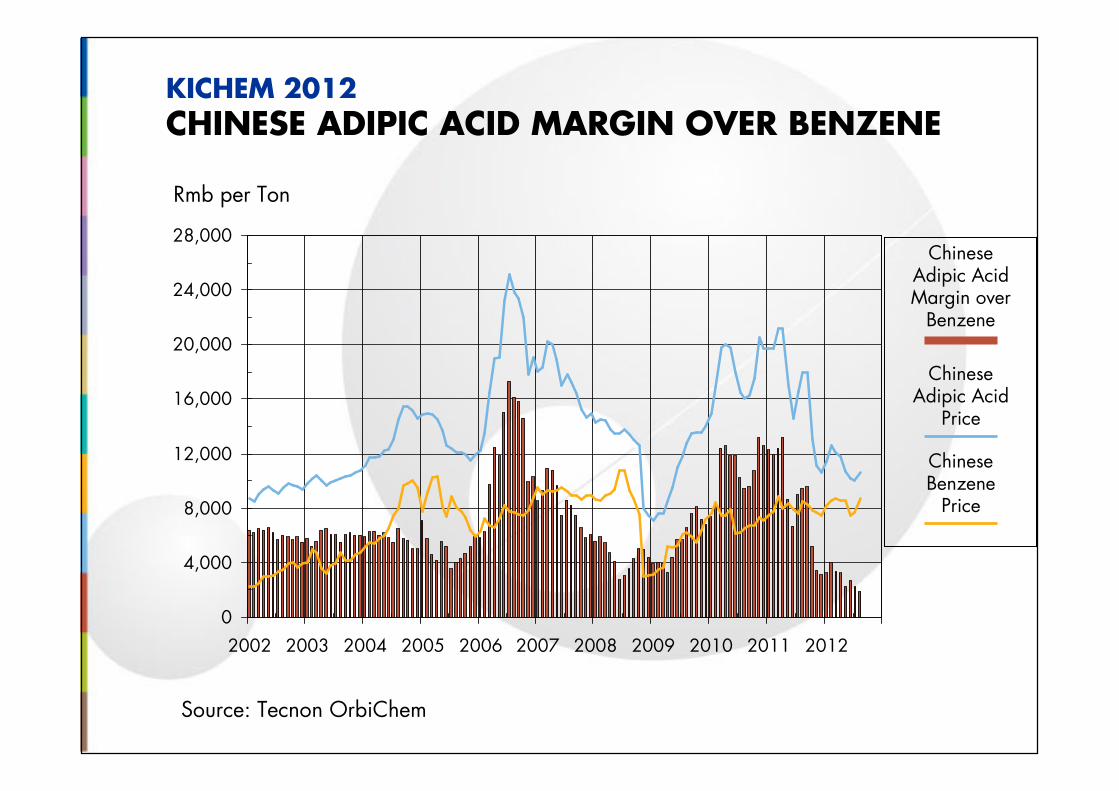
Rmb per Ton
ChineseAdipic Acid Margin over
Benzene
ChineseAdipic Acid
Price
Source: Tecnon OrbiChem
KICHEM 2012CHINESE ADIPIC ACID MARGIN OVER BENZENE
ChineseBenzene
Price
0
4,000
8,000
12,000
16,000
20,000
24,000
28,000
2002 2003 2004 2005 2006 2007 2008 2009 2010 2011 2012
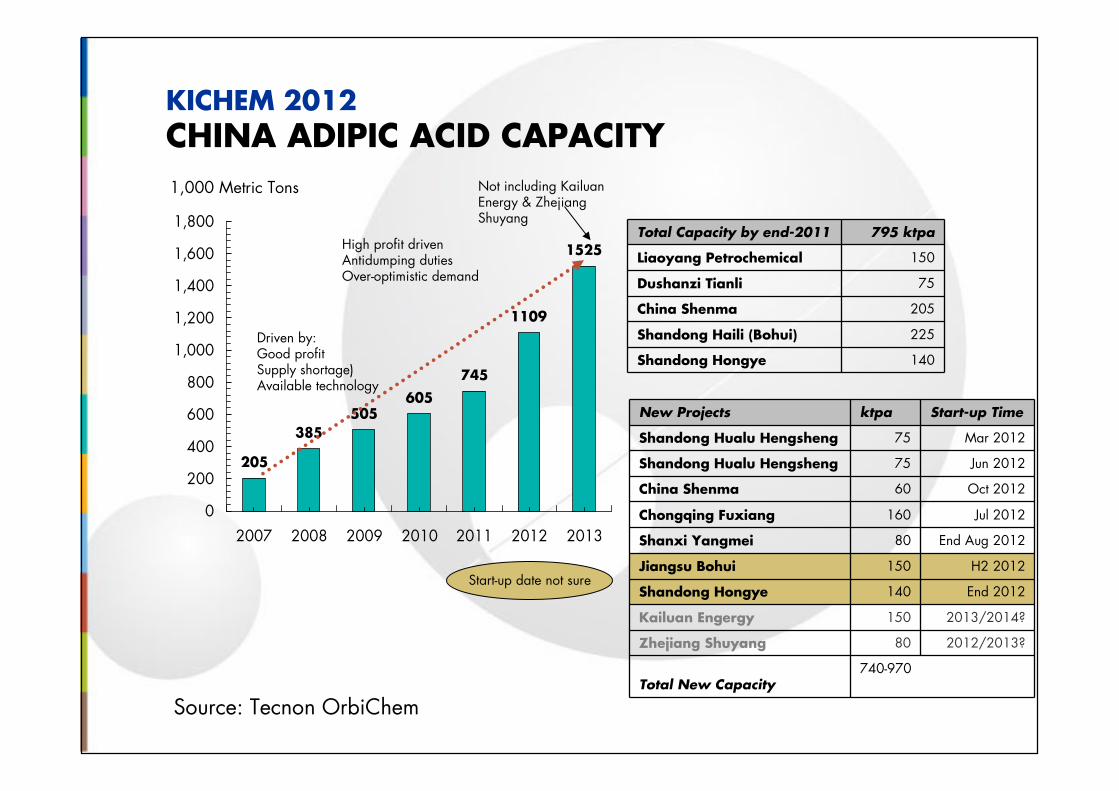
KICHEM 2012CHINA ADIPIC ACID CAPACITY
Source: Tecnon OrbiChem
Total Capacity by end-2011 795 ktpa
Liaoyang Petrochemical 150
Dushanzi Tianli 75
China Shenma 205
Shandong Haili (Bohui) 225
Shandong Hongye 140
New Projects ktpa Start-up Time
Shandong Hualu Hengsheng 75 Mar 2012
Shandong Hualu Hengsheng 75 Jun 2012
China Shenma 60 Oct 2012
Chongqing Fuxiang 160 Jul 2012
Shanxi Yangmei 80 End Aug 2012
Jiangsu Bohui 150 H2 2012
Shandong Hongye 140 End 2012
Kailuan Engergy 150 2013/2014?
Zhejiang Shuyang 80 2012/2013?
Total New Capacity740-970
205
385505
605
745
1109
1525
0
200
400
600
800
1,000
1,200
1,400
1,600
1,800
2007 2008 2009 2010 2011 2012 2013
Driven by:Good profit Supply shortage)Available technology
High profit drivenAntidumping dutiesOver-optimistic demand
1,000 Metric Tons Not including KailuanEnergy & Zhejiang Shuyang
Start-up date not sure
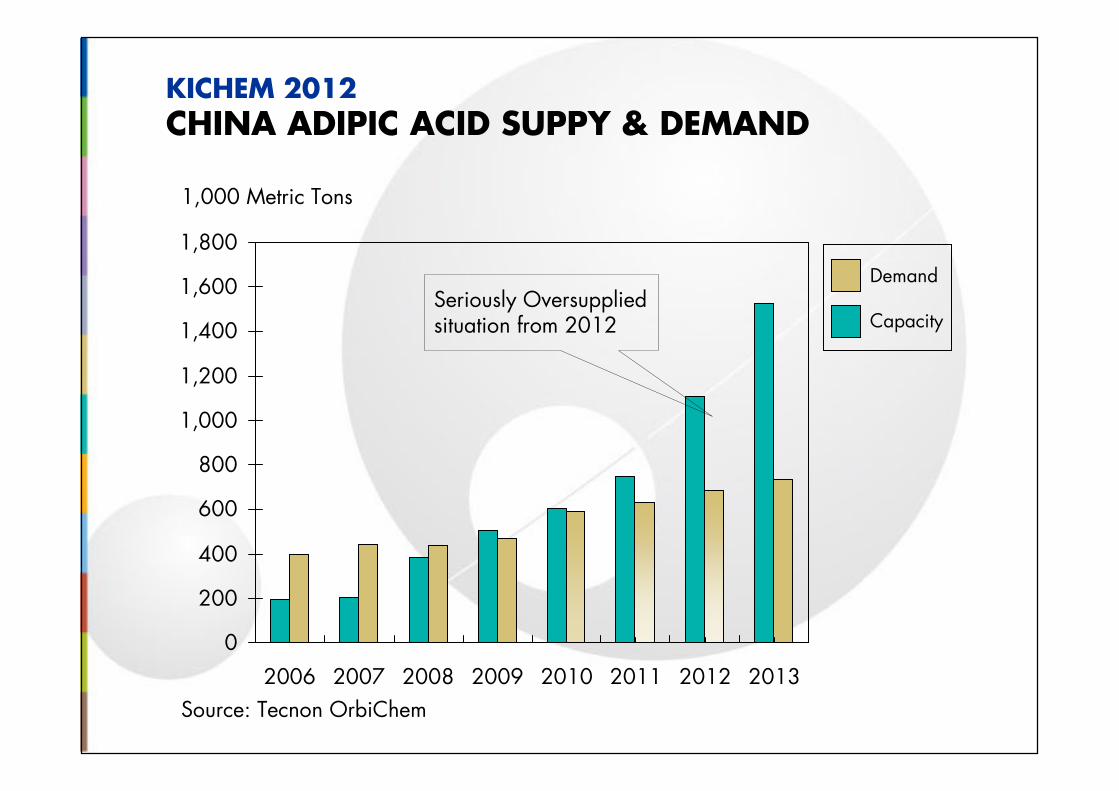
KICHEM 2012CHINA ADIPIC ACID SUPPY & DEMAND
0
200
400
600
800
1,000
1,200
1,400
1,600
1,800
2006 2007 2008 2009 2010 2011 2012 2013
Source: Tecnon OrbiChem
Demand
CapacitySeriously Oversupplied situation from 2012
1,000 Metric Tons
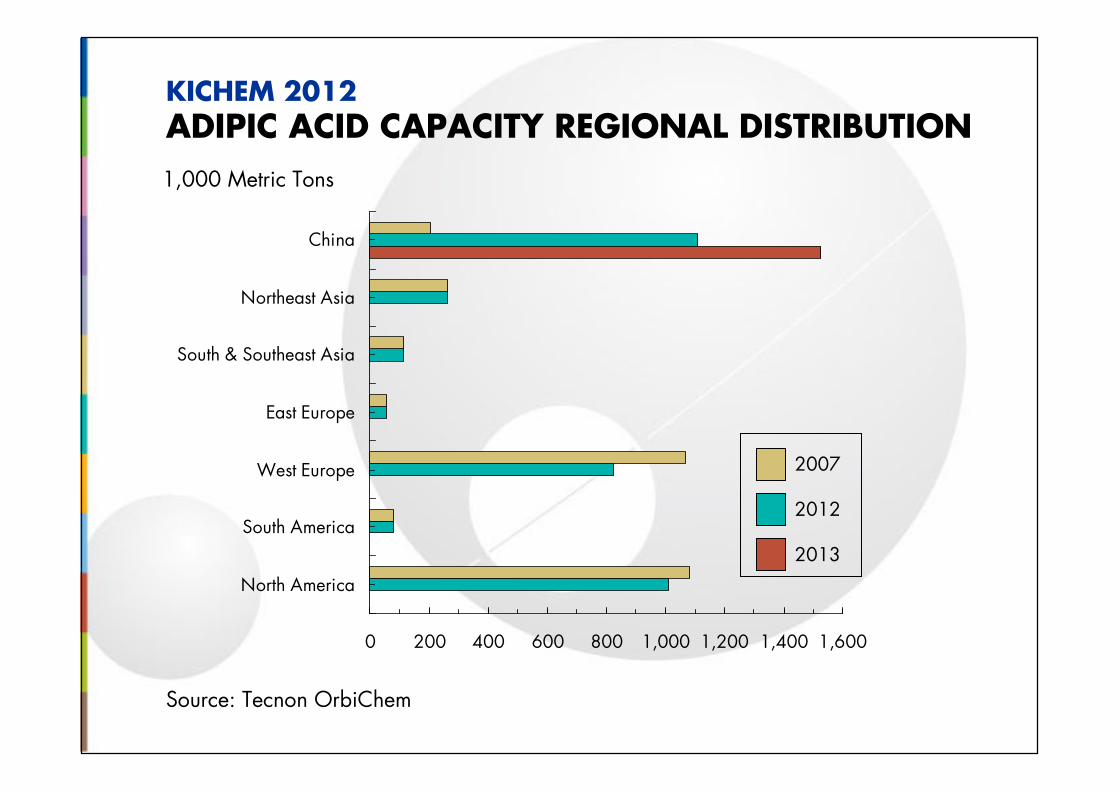
0 200 400 600 800 1,000 1,200 1,400 1,600
North America
South America
West Europe
East Europe
South & Southeast Asia
Northeast Asia
China
Source: Tecnon OrbiChem
KICHEM 2012ADIPIC ACID CAPACITY REGIONAL DISTRIBUTION
2012
2007
1,000 Metric Tons
2013
Source: Tecnon OrbiChem
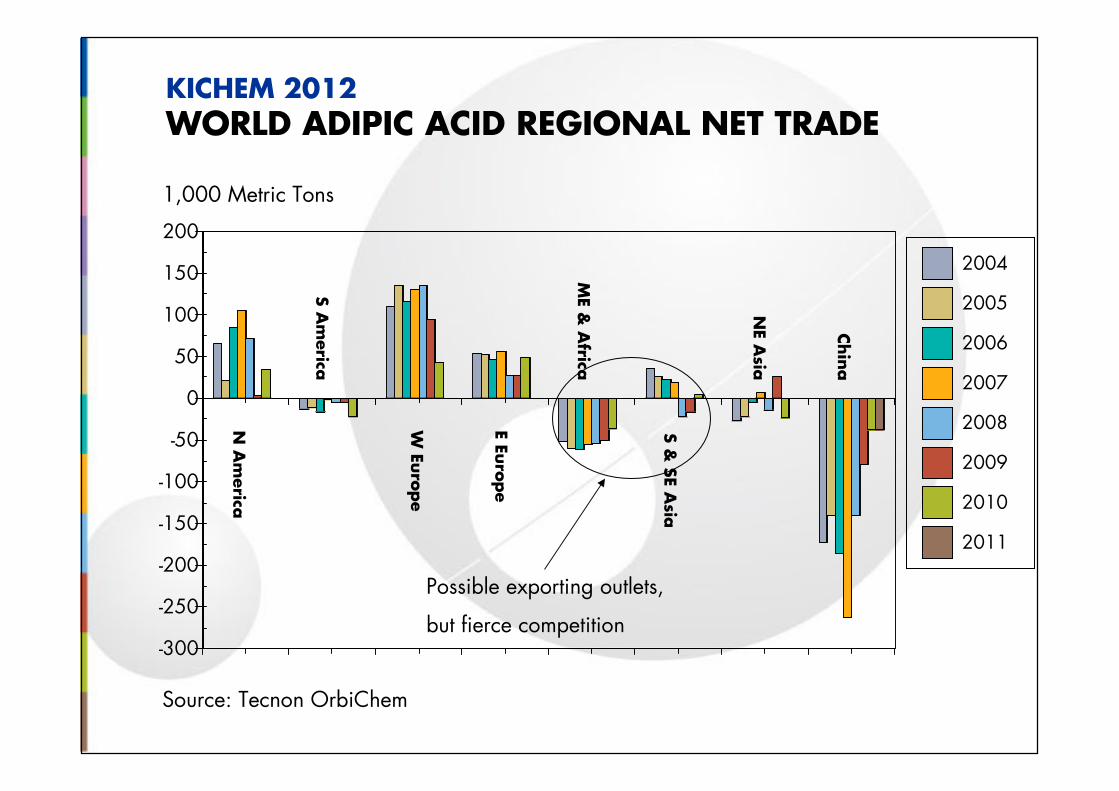
KICHEM 2012WORLD ADIPIC ACID REGIONAL NET TRADE
-300
-250
-200
-150
-100
-50
0
50
100
150
200
S &
SE A
sia
E Euro
pe
W Eu
rope
N A
merica
S A
merica
ME &
Africa
NE A
sia
Chin
a
1,000 Metric Tons
Possible exporting outlets,
but fierce competition
2005
2004
2006
2008
2009
2010
2007
2011
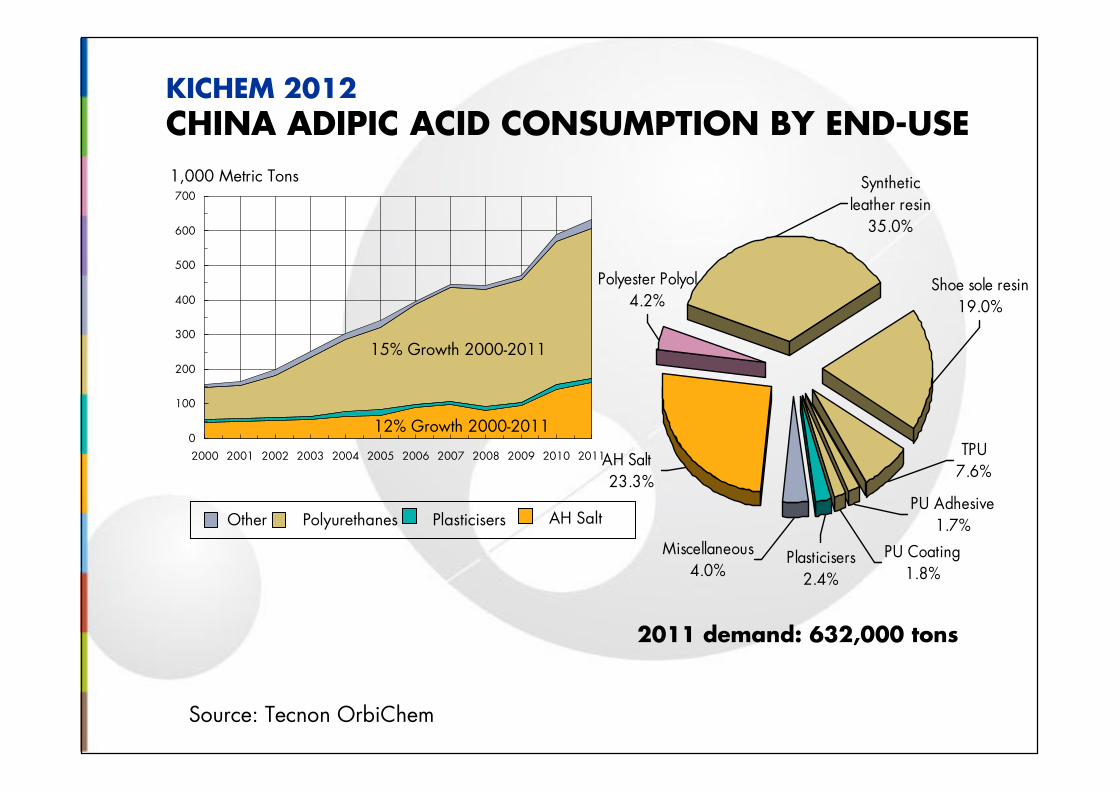
KICHEM 2012CHINA ADIPIC ACID CONSUMPTION BY END-USE
0
100
200
300
400
500
600
700
2000 2001 2002 2003 2004 2005 2006 2007 2008 2009 2010 2011
AH Salt PlasticisersPolyurethanesOther
Source: Tecnon OrbiChem
12% Growth 2000-2011
15% Growth 2000-2011
2011 demand: 632,000 tons
1,000 Metric Tons
Polyester Polyol 4.2%
AH Salt 23.3%
Miscellaneous4.0%
Plasticisers2.4%
TPU7.6%
PU Coating1.8%
PU Adhesive1.7%
Synthetic leather resin
35.0%
Shoe sole resin19.0%
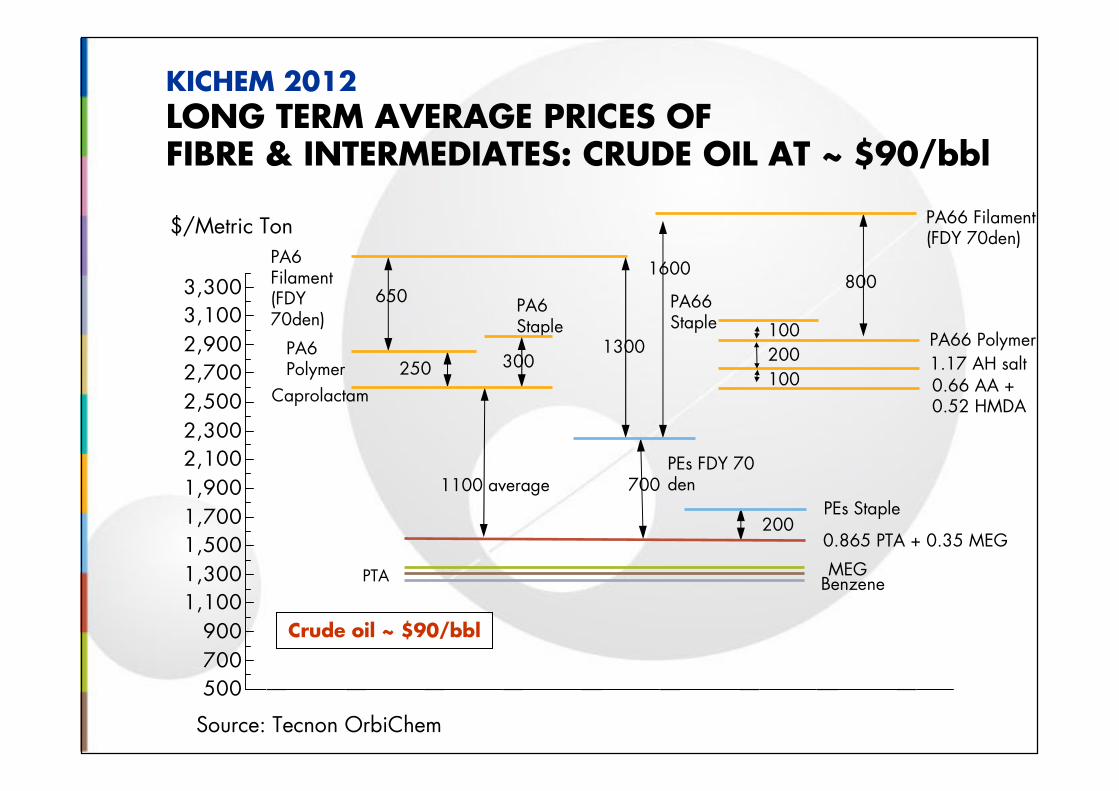
KICHEM 2012LONG TERM AVERAGE PRICES OF FIBRE & INTERMEDIATES: CRUDE OIL AT ~ $90/bbl
Source: Tecnon OrbiChem
500
700
900
1,1001,300
1,500
1,700
1,900
2,1002,300
2,500
2,700
2,900
3,1003,300
$/Metric Ton
Crude oil ~ $90/bbl
Caprolactam
1100 average
PA6Polymer 250 300
650
PA6Filament(FDY 70den)
PA6Staple
200
PA66Staple
800
100
200PEs Staple
700
1300
1600
PEs FDY 70 den
PA66 Filament(FDY 70den)
0.66 AA + 0.52 HMDA
PTA Benzene
100
0.865 PTA + 0.35 MEG
PA66 Polymer1.17 AH salt
MEG
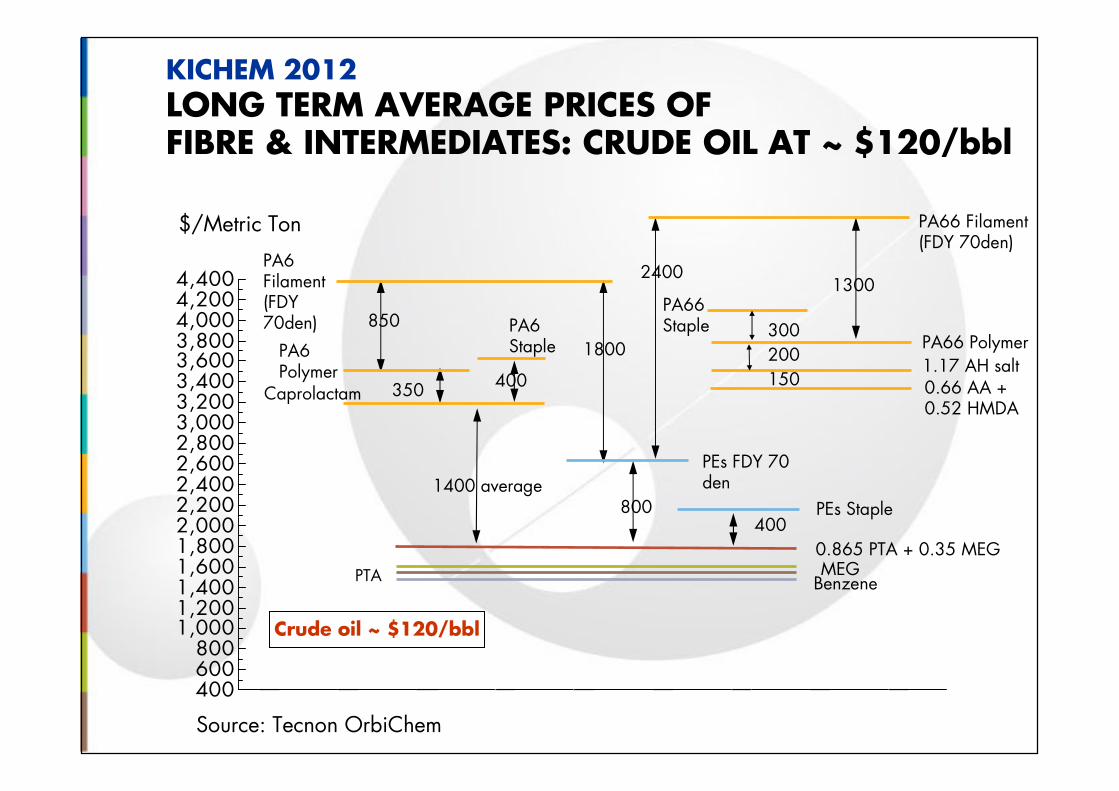
KICHEM 2012LONG TERM AVERAGE PRICES OF FIBRE & INTERMEDIATES: CRUDE OIL AT ~ $120/bbl
Source: Tecnon OrbiChem
400600800
1,0001,2001,4001,6001,8002,0002,2002,4002,6002,8003,0003,2003,4003,6003,8004,0004,2004,400
$/Metric Ton
Crude oil ~ $120/bbl
Caprolactam
1400 average
PA6Polymer
350 400
850
PA6Filament(FDY 70den) PA6
Staple
PA66Staple
1300
400PEs Staple800
1800
2400
PEs FDY 70 den
PA66 Filament(FDY 70den)
0.66 AA + 0.52 HMDA
PTA Benzene
0.865 PTA + 0.35 MEG
PA66 Polymer1.17 AH salt
MEG
200
150
300
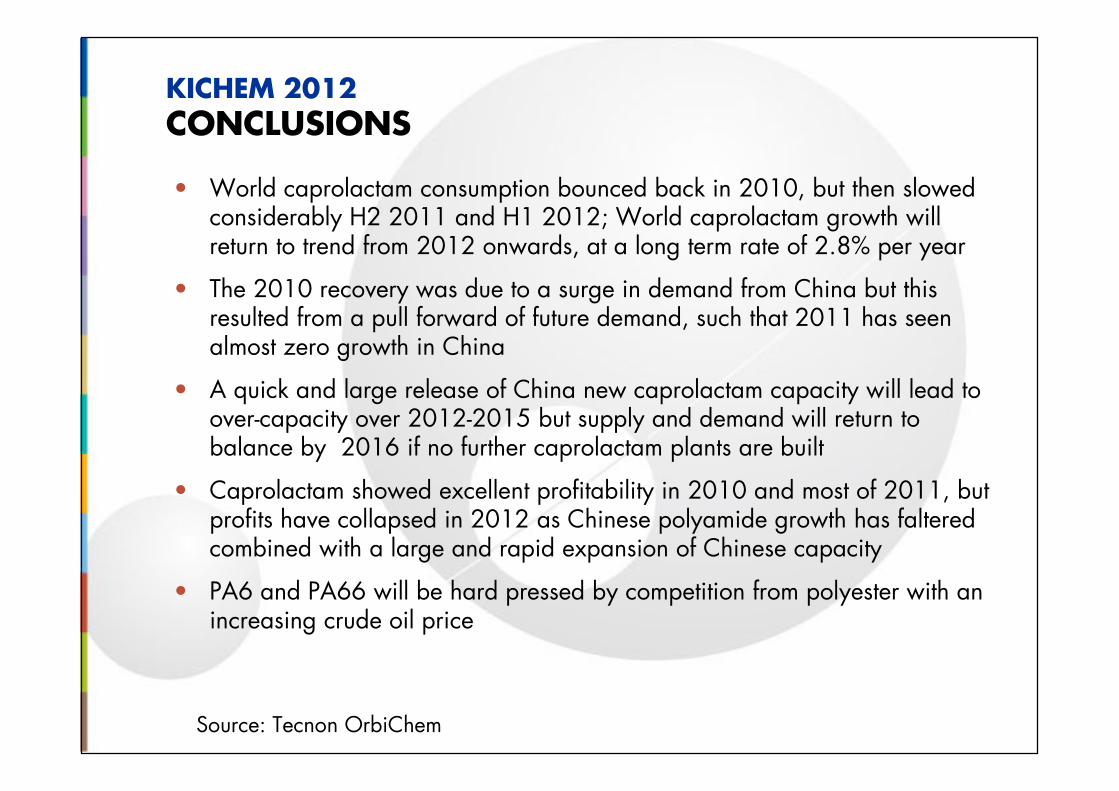
KICHEM 2012CONCLUSIONS
• World caprolactam consumption bounced back in 2010, but then slowed considerably H2 2011 and H1 2012; World caprolactam growth will return to trend from 2012 onwards, at a long term rate of 2.8% per year
• The 2010 recovery was due to a surge in demand from China but this resulted from a pull forward of future demand, such that 2011 has seen almost zero growth in China
• A quick and large release of China new caprolactam capacity will lead to over-capacity over 2012-2015 but supply and demand will return to balance by 2016 if no further caprolactam plants are built
• Caprolactam showed excellent profitability in 2010 and most of 2011, but profits have collapsed in 2012 as Chinese polyamide growth has faltered combined with a large and rapid expansion of Chinese capacity
• PA6 and PA66 will be hard pressed by competition from polyester with an increasing crude oil price
Source: Tecnon OrbiChem
KICHEM 2012CONCLUSIONS
• PA66 producers have to grapple with high and volatile costs, especially on butadiene; High butadiene prices are likely to persist, damaging long term PA66 growth
• Some new investments in polyamide 66 was stimulated by good profit and short supply years ago, such as Huafeng Group (40 ktpa started up in May 2011) and Guorui Chemical (50 ktpa AH salt in H1 2012), but highADN/HMDA prices and relatively slow demand mean that they are struggling
• Polyamide 66 resin prices in China have been decreasing in H1 2012, even for a time close to the current nylon 6 resin prices, showing a big cost pressure for the nylon 66 producers
• Over-enthusiasm for adipic acid investment in China has led to gross overcapacity
• Adipic acid imports into China have been replaced -- except for high quality material -- and export opportunities are limited, so over-capacity will continue and domestic markets will be depressed for years to come
• Fierce competition could lead to a reshuffling in the adipic acid markets, in China and even overseas
Source: Tecnon OrbiChem

…..your source of expert chemical industry knowledge