Embed Size (px)
Citation preview
Polydispersity of Heavy Organics in Crude Oils and their Role in Oil Well Fouling
G.Ali Mansoori 1,⁎, Dynora Vazquez1 ,**, Mojtaba Shariaty-Niassar2
(1). Departments of Bio and Chemical Engineering (M/C 063), University of Illinois at Chicago, Chicago, IL 60607-7052, USA
(2). Department of Chemical Engineering, Daneshkadeh Fanni, University of Tehran, Tehran, Iran
Abstract
In this report, the polydisperse data of heavy organic fractions of crude oil and solid deposit were produced to investigate thecauses of deposition in oil wells. The oilfields of the study have experienced, for several years, shutdowns and decrease in theproduction ratios due to heavy organics deposition. Several measures such as mechanical cleaning and periodic aromatic washeshave been adopted to maintain the production level; nevertheless the costs associated with these procedures are very high.
The SARA method was employed to separate the samples into four distinct fractions, namely Saturates, Aromatics, Resins andAsphaltenes. The total asphaltene content of the crude oil samples was determined using n-pentane, n-heptane, and n-nonuse as theprecipitating solvents. Polydispersity and molecular weight of each fraction have been further characterized by Gel PermeationChromatography (GPC). The presence of diamondoids in the solid deposits was also investigated by GC-MS. This technique hasbeen carried out on various crude oil samples collected from an oil field.
The results provided useful information on the interaction between the various heavy organic species responsible for thedeposition phenomena. Solid samples from different wells resulted in similar composition concluding that these crude oils undergosimilar deposition mechanisms. These studies showed that the crude oils produced from different wells in this oilfield are verysimilar in nature. The asphaltenes contained in some of the crude oil samples displayed a rather strong tendency to self-associate;they also render the highest amounts of precipitation. While diamondoids and alkyl-substituted diamondoids were confirmed to bepresent in the crude oils produced no evidence was found of their occurrence in the deposits.
The polydispersity analysis procedure presented here provides a good understanding of the overall behavior of the species thatprecipitate and also of the interactions among these species. It is concluded that while most of the heavy organics contained in thesecrude oils may produce precipitates, asphaltene is the major cause of flocculation of the precipitates, which may result in depositionand plugging of oil-producing wells.© 2007 Elsevier B.V. All rights reserved.
1. Introduction
The recovery of useful products from petroleum hasbeen for several years an increasingly important taskthat is based on the understanding of the physicochem-ical properties of the crude oil mixture. During the pastseveral years, extensive research works were devoted tothe formulation of models to predict the complex phase
Journal of Petroleum Science and EngineeringVolume 58, Pages 375 – 390, 2007
(*) Corresponding author. E-mail: [email protected]
(**). Permanent address: National Polytechnic Institute (IPN), Interdisciplinary Professional Unit of Biotechnology (UPIBI), Department of BioEngeneering, Av. Acueducto s/n Ticoman 07340 Mexico, D.F. Mexico. Email: [email protected]
Mojtaba Shariaty-Niassar Email: [email protected]

transitions in petroleum fluids during production andprocessing (Park and Mansoori, 1988a,b; Pacheco-Sanchez and Mansoori, 1989; Kawawaka et al., 1991;Park et al., 1993; Branco et al., 2001; Hu et al., 2004).Moreover, the potential appearance of solid deposits inwells, pipelines and equipment with unfavorable eco-nomic and operational consequences, requires predictivemodels which could successfully predict the conditionsunder which solids form. Thus, based on standardizedanalysis of gas and oil, engineers dealing with thesefluids can consider possible actions to prevent or correctsolid formation such as altering operating conditions orintroducing chemical inhibition.
The need to understand the appearance of soliddeposits in crude oils leads us to develop methods ofcharacterization in order to analyze the different types ofspecies, whichmay form solid particles and their behaviorin crude oils.
1.1. Characterization
For petroleum fluids composition and properties varycontinuously from the simplest structures to macromo-lecules. Characterization is a key first step to understandthe stability of the crude oil and implement measures toprevent its break up to vapor, liquid and solid (known asdeposit). Once the characterization is accomplished andsuitable data is generated, by using appropriate molec-ular, macromolecular and kinetic theories a set ofequations that represent the physicochemical propertiesand behavior of the petroleum fluid to a satisfactory levelof accuracy may be developed. The common problemone must face consists then of identification of thediscrete components of the crude, the definition offamilies or fractions of similar components and under-standing the nature and role of interactions in betweenvarious species.
The complete and detailed characterization of a pe-troleum fluid is quite difficult, time consuming andexpensive. To simplify the procedure, petroleum is con-sidered to be composed of a number of light discretecomponents and a heavy end. The heavy end is assumedto consist of four major fractions of similar species. Atthe conditions of the original oil in the reservoir the lightand heavy ends are mutually soluble forming one phaseso long as certain conditions are maintained in thereservoir. Variations in temperature, pressure or com-position may alter this balance and some of the speciesmay segregate and form another liquid or solid phase.Once separated, the complex species may aggregatedue to their large size differences, hydrogen bondingor polar groups interactions and form larger particles
named flocs (or supramolecules). Flocs could precipitateout of the mixture as solid deposits which in many caseswould plug wells, pipelines and processing equipment.Some of the mechanisms by which these phenomenaoccur are known (Kawanaka et al., 1989; Mansoori,1997), but the exact mechanism is still not well un-derstood. It is clear that stability of each species dependsupon the nature and amount of the other species in thecrude oil. Therefore the characterization of all theconstituents of the crude oil may give us an insight intotheir stabilities and interactions.
The characterization of petroleum into fractions withhomogeneous physicochemical properties is primarilymade by distillation or simulated distillation through gaschromatography on the basis of volatility (Green et al.,1964). Typically, the PVT laboratory will generate thedata for a fluid by depressurization of a bottom-hole orreconstituted oil sample to obtain separate liquid and gasfractions. The gas–oil ratio (GOR) is recorded and theseparated fractions are analyzed by gas chromatography(GC) to obtain their compositions. For the separated gas,the components are quite real discrete components ofknown molecular weights. The GC analysis of the liquidalso identifies some discrete components, but most ofthe heavy-end components cannot be identified by GCanalysis alone. Conventionally, the GC analysis is ex-pressed as a series of single carbon number cuts termi-nating with a Cn+ fraction that specifies the remainder(Chorn and Mansoori, 1989).
1.2. Heavy fraction analysis
Within the crude oil, the heavy fraction is the mosttroublesome due to the presence of a large variety ofheavy organic compounds. These compounds are gen-erally complex and it is difficult to exactly identify thembased on their chemical structures. The characterizationof the heavy fraction is then based on the identificationof a number of families with certain properties whichcan be easily distinguishable from each other.
While simulated distillation by gas chromatographyis a routine means for characterization of the light end, itis not applicable for heavy-end characterization due toinability of GC for characterization of large molecules.Therefore the methods employed rely on solubility andother chromatographic techniques (Leontaritis andMansoori, 1989). The SARA procedure (Jewell et al.,1974) modified for characterization of the heavy endas already described by Vazquez and Mansoori (2000)was used to separate a sample into four classes of com-pounds, namely saturates, aromatic, resins and asphal-tenes. The saturate fraction consists of a viscous whitish
376
Polydispersity of Heavy Organics in Crude Oils and their Role in Oil Well Fouling G.A. Mansoori et al., J. Petrol. Sci. & Eng'g 58, 375-390, 2007

translucent liquid mainly composed of paraffins anddiamondoids. From the four fractions separated from theheavy-end only the saturates fraction is easily distin-guishable and separated from the rest of the oil due tothe absence of π-bonds in between saturate hydrocarbonmolecules. The aromatic fraction is a viscous reddishliquid composed of aromatic hydrocarbons with variousdegrees of condensation, alkyl-substitution and hetero-atom (i.e. sulfur, oxygen, nitrogen) content forming acontinuum with respect to polarity, molecular weightand other properties. The resin fraction is a dark browncolored, thick viscous liquid to semi-solid with a higherdegree of condensation and heteroatom content thanthe aromatics. It plays an important role in asphalteneflocculation (Kawanaka et al., 1989; Mansoori, 1997,2002; Eliassi et al., 2005). The asphaltene fraction lookslike a dark brown to black, amorphous solid. Togetherwith resins, asphaltenes form the most polar and heavi-est fraction of the crude oil. Structurally, both, resinsand asphaltenes have similar features, but asphaltenespresent more complex polymeric structures with a largevariety of repeating blocks, which have in common apolycondensed aromatic and naphtenic nucleus withaliphatic, chains attached (Yen, 1974).
As it will be demonstrated in this report all thefractions separated from petroleum generally possessbroad distributions of molecular weights which makethe heavy organics a highly polydispersed mixture.There is some overlap on the components of thesefractions and therefore the distinction among them israther arbitrarily made on the basis of conditionsemployed to effect the separation.
2. Sampling and experimental procedure
The heavy fractions characterized in this work wereobtained from the following sources:
i. The crude oil sample from the same well E, referredto as “Crude Oil E”, for which the composition datawere available (Table 1). This surface sample wasobtained according to the API-RP 44 procedure forsampling petroleum reservoir fluids. The operatingconditions in the separator, where the sampling wasperformed, were 6.0 bar (gauge pressure) and 335 K.Approximately 2 L of oil at these conditions werestored in stainless steel containers such that thepressure was maintained inside. The containers wereflashed at room conditions (1 bar and 300 K) and theremaining oil transferred to non-pressurized metalliccontainers from which the aliquots for the experi-ments were withdrawn.
ii. Two samples of solid material deposited inside twowells identified as S1 and S2, referred to as “Solid S1”and “Solid S2”. The solid samples were black powderymaterial, brittle to the touch and appeared to beaggregates composed by smaller amorphous particles.
All the samples used in the experiments belonged tothe same oilfield of interest.
The modified SARA procedure described by Vaz-quez and Mansoori (2000) was used for separation ofheavy fraction of the samples.
Gel permeation chromatography (GPC) (Leontaritisand Mansoori, 1989) was used to produce molecularweight distribution, the average molecular weight andpolydispersity values in every fraction. Each fraction(saturates, aromatics, resins and asphaltenes) was dis-solved in THF at a concentration of 0.25% (weight/volume). Care was taken to avoid the contact of thesamples with open air during the preparation. All sampleswere filtered through a 0.45μmmembrane filter to removeany insoluble material from the solutions. The filteredsolutions were injected through the GPC system, consist-ing of four columns connected in series with a resolutionin the range of 100 to 600,000. The mobile phase for theanalyses was THF at a flow rate of 1 mL/min. Thetemperature was set at 30 °C. The eluding fluid wasanalyzed with an RI and a UV detector at operatingwavelength of 254 nm. The data, acquired at a rate of 2.5points per s, were processed using calibration curvesobtained with narrow-dispersity polystyrene standards.
The combined GC-MS technique was used to deter-mine the existence of diamondoids in the solid deposits
Table 1Composition of crude oil E
Component Mol% Density (g/cm3) Molecular weight
Nitrogen 0.386Carbon dioxide 1.587Hydrogen sulfide 0.602Methane 40.448Ethane 12.710Propane 7.208Iso-butane 1.237n-Butane 3.323Iso-pentane 0.960n-Pentane 1.025Hexanes 2.653Heptanes 3.312 0.7280 97Octanes 3.010 0.7492 111Nonanes 2.689 0.7681 124Decanes 2.427 0.7881 139Undecanes plus 16.423 0.8918 281Total 100.000C7+ fraction 27.861 0.8516 212
377
Polydispersity of Heavy Organics in Crude Oils and their Role in Oil Well Fouling G.A. Mansoori et al., J. Petrol. Sci. & Eng'g 58, 375-390, 2007

analyzed as described by Vazquez and Mansoori (2000).The analysis was carried on the saturates fraction, ratherthan on the whole sample in order to avoid the in-terferences posed by aromatic compounds (Wingert,1992). Solubility data reported for diamondoids suggestthat these hydrocarbons will preferentially partitionthemselves into the low-boiling fraction of any crudeoil. The analyses were conducted in a Finnigan GC/MSinstrument equipped with a gas chromatograph andcapillary injector (Vazquez and Mansoori, 2000). Afused silica capillary column of 100 m length and0.25 mm ID with a 0.5 μm DB-1 stationary phase(dimethyl-polysiloxane) was used for the analyses. Themass spectrometer generated positive ions by electronimpact at 70 eV. The ion source was maintained at200 °C and EM=1200 was used. Mass spectra wereobtained by scanning masses from 50 to 400. The GCoven temperature was programmed as follows: 50 °C for5 min and then from 50 °C to 250 °C at 2 °C/min, finallythe temperature was held at 250 °C for 120 min. Forthe solids, the analyses were performed in a capillarycolumn with DB-5MS as stationary phase. The tem-perature was programmed at 50 °C for 5 min and then
raised to 325 °C at 4 °C/min and maintained for 30 minmore. The mass spectrometer injector temperature wasmaintained at 300 °C and the masses were scannedfrom 40 to 550. The saturate fraction was dissolved inchloroform at 25,000 ng/μL, then 2 μL of the solutionwere injected to the system with a split ratio of 10:1. Thecarrier flow rate was set at 1.2 mL/min.
3. Results and discussion
3.1. Analysis of crude oil samples
The crude oil samples were fractionated by themodified SARA technique as described by Vazquez andMansoori (2000). The experiment was repeated severaltimes and the average results, reported as wt.%, arepresented in Table 2. The results obtained from thefractionation of crude oil E, were compared with thoseobtained from crude oils of different wells pertaining tothe same oilfield as shown in Fig. 1. All crude oilspresented slight differences in composition (Fig. 1); thisis not surprising considering that petroleum fluids maypresent variations in their composition according to
Table 2Composition of the heavy organic fraction of crude oil E obtained bythe modified Sara method
Light ends 32.4700Saturates 44.0217±0.4940Aromatics 20.5443±0.2214Resins 1.2817±0.0597nC5-Asphaltenes 0.5951±0.0030Toluene-insoluble 0.0208±0.0030Total recovery 98.9336
Fig. 1. Schematic composition of crude oils from five different wells fractionated by the modified SARA method.
Table 3Sara analysis composition of the heavy organic fraction of a secondsample of crude oil E, exposed to air and to natural evaporation
Light ends 26.32±0.52Saturates 44.2182±2.3812Aromatics 19.6999±0.5507Resins 2.1002±0.2767nC5-Asphaltenes 0.7322±0.0058Toluene-insoluble 0.0208±0.0030Total recovery 93.0953
378Polydispersity of Heavy Organics in Crude Oils and their Role in Oil Well Fouling
G.A. Mansoori et al., J. Petrol. Sci. & Eng'g 58, 375-390, 2007
location and depth of the well as well as operator errorsin sampling. Nevertheless, from an overall comparisonthe five crude oils seem quite similar in composition.Another important observation is the small amount ofresins when compared with the asphaltene content. Ingeneral, the mass ratio of asphaltenes to resins in crudeoils around the world have been found to be quite small,in the range of 0–0.26. For the crude oil under studyhere the average ratio was found to be 0.39. Of courseheavy oils may have much higher amount of asphaltenescompared with resins. But heavy oil nature and pro-duction scheme is quite different from crude oils. Sinceresins are the main factor by which the asphaltenescould remain dispersed in this crude oil (due to the lackof light aromatics in the crude), the overall compositionsappear to be hostile for the stability of asphaltenes in thiscrude oil.
In order to establish to what extent the differencesamong the composition of the five crude oils could beattributed to their source or might have been affected bythe evaporation of light ends; a second sample of crudeoil E, handled in different manner, was characterized.
Whereas the first sample was not allowed to be incontact with air and the container was equipped with asampling valve so that vapor did not escape when thealiquots were drawn. The second sample was exposed tonatural evaporation every time the aliquots were drawn.It was found that the latter procedure yielded signifi-cantly different results as is demonstrated in Table 3.Large variations were observed in the resin and as-phaltene contents with respect to time. For instance,the nC5-asphaltene content varied from 0.6327% to0.7587% in a two-month period.
3.1.1. Asphaltene precipitationThe total amount of asphaltenes precipitated from
crude oil E with three different paraffinic solvents wasalso determined (Vazquez and Mansoori, 2000). Thevalues obtained were compared with those of thewellhead samples previously analyzed. The results arereported in Table 4. The data reported in this table is
the same as Fig. 1 of Vazquez and Mansoori (2000).In Table 4 it can be observed that the amounts ofasphaltenes precipitated as a function of the solvent usedare in agreement with the general trend reported in theliterature (Branco et al., 2001; Mousavi-Dehghani et al.,2004). The asphaltene wt.% decreases as the molecularweight of the solvent increases and for solvents withlarge number of carbon atoms the amount of asphaltenesprecipitation does not change significantly. This is dueto the fact that the solvent power of a hydrocarbon forasphaltene increases as its molecular weight. However,this is not the complete picture. Another factor thatdetermines the precipitation of asphaltenes from crudeoil is the peptizing effect of resin molecules, whichprevent asphaltene self-association when present in suf-ficient concentration.
The solvent power of the medium also affects in-teractions among asphaltene and resin molecules. Whenthe solvent has a low solvent power, as in the case of lightnormal paraffins, they dislike both asphaltene and resin.Therefore, for low molecular weight paraffins, theprecipitate contains asphaltene and resin; however asthe molecular weight of the solvent increases, it becomesa better solvent for resin than for asphaltene. Thusthe precipitate is composed mainly of asphaltene. As aresult of these two factors one can expect that the amountof precipitate decreases as the molecular weight of thesolvent increases. It is also expected that the amount ofresin that co-precipitates along with the asphaltenedecreases in the same fashion.
3.1.2. Asphaltene molecular weight distributionsIt should be pointed out that properties of asphaltenes
and resins separated from a crude oil vary accordingto the solvent used for their deposition (Park andMansoori, 1988a,b; Branco et al., 2001). This may notbe generally the case about the separated aromatics andsaturates. There is always some amount of resin whichmay co-deposit along with asphaltene. It must also beunderstood that even some higher-MW paraffins (wax)may co-precipitate with asphaltene and resin whenlighter n-paraffins are used as the depositing agent forasphaltene.
Table 4Weight percent of precipitated asphaltenes from five crude oil samples
Crude oil n-Pentane n-Heptane n-Nonane
A 1.0084±0.0062 0.4418±0.0071 0.3233±naB 0.8041±0.0088 0.3088±0.0079 0.2352±naC 0.5412±0.0062 0.1119±0.0028 0.0691±naD 0.7052±0.0127 0.2288±0.0101 0.1423±naE 0.4584±0.0102 0.1553±0.0011 0.0738±0.0002
The data of this table is the same as Fig. 1 of Vazquez and Mansoori(2000).
Table 5Average molecular weights obtained by GPC for the asphaltenesprecipitated from crude oil E
Fraction Average MW Polydispersity
nC5-Asphaltenes 1277 2.6519nC7-Asphaltenes 1592 2.7411nC7-Asphaltenes 1737 2.7116
379Polydispersity of Heavy Organics in Crude Oils and their Role in Oil Well Fouling
G.A. Mansoori et al., J. Petrol. Sci. & Eng'g 58, 375-390, 2007

One must bear in mind, that the asphaltene, con-sidered as unit sheets with an aromatic polycyclic centerand surrounded by aliphatic radicals, when dissolved inpolar or aromatic solvents interact with each other toform micelles consisting of several layers via π–πassociation or heteroatom coordination (Yen, 1974).These micelles in turn may further associate to formlarge aggregates (called micelle-coacervates) dependingon the solvent polarity, the asphaltene concentration andthe temperature (Priyanto et al., 2001a,b). In theseinteractions the participating monomers are polydis-perse in both structure and molecular weight. Hence auniform micelle is probably non-existent in asphaltenesolutions. Therefore, it may be expected that these three
types of asphaltenes will exhibit different MW distribu-tions. As mentioned above, these MW distributions willdepend also on the level of inter-molecular interactionsamong asphaltenes, resins and co-precipitated high MWparaffins.
Table 5 contains the average molecular weightsobtained for each of the asphaltene fractions in the crudeoil E. According to Table 5 the nC7-asphaltenes exhibithigher average MW than the nC5-asphaltenes, butsmaller than the nC9-asphaltenes. The data confirmthat the resins, which co-precipitate with asphalteneswhen nC5 is used as the precipitating agent, prevent, tosome extent, asphaltene molecules to self-associate intolarge aggregates. This data is also consistent with the
Fig. 2. Molecular weight distributions obtained by GPC for the various asphaltene fractions of crude oil E.
Fig. 3. Molecular weight distributions obtained by GPC for the various asphaltene fractions of crude oil A.
380
Polydispersity of Heavy Organics in Crude Oils and their Role in Oil Well Fouling G.A. Mansoori et al., J. Petrol. Sci. & Eng'g 58, 375-390, 2007
fact that when the resin content is lowered (as in the caseof the nC7- and nC9-asphaltenes), larger aggregates areformed, and therefore, more complex asphaltenes areprecipitated.
More important to understand the behavior ofasphaltenes is the MW distribution curves obtained forthe various asphaltene fractions derived from the crudeoils. For instance, in Fig. 2 we have a comparison ofthese curves for crude oil E. A careful inspection of thisfigure reveals that all distributions are bimodal,suggesting the existence of at least two different typesof species in solution as also discussed by Vazquez andMansoori (2000). It is also noted that the population ofhigh-molecular-weight species (i.e. the second peak)increases as the number of carbon atoms in the paraffinsolvent increases. On the other hand, the population oflow-molecular-weight species (i.e. first peak) decreasesin the same fashion. This observation suggests thatwhen n-pentane is used, the resins, which co-precipitate,prevent to some extent the self-association of theasphaltenes. On the other hand when the resin contentdecreases (as in the case of the asphaltenes precipitatedwith n-nonane) the self-association is promoted to largerextent. The polydispersity of the various asphaltenesreported in Table 5 does not change significantly, but itis observed to increase when the molecular weight of theprecipitating solvent increases.
This general trend was observed in the other crudeoils characterized and analyzed. It was also observedthat the asphaltenes precipitated from the wellheadcrude oils are most prone to self-association, as thehigher intensity of the second peak and the displacement
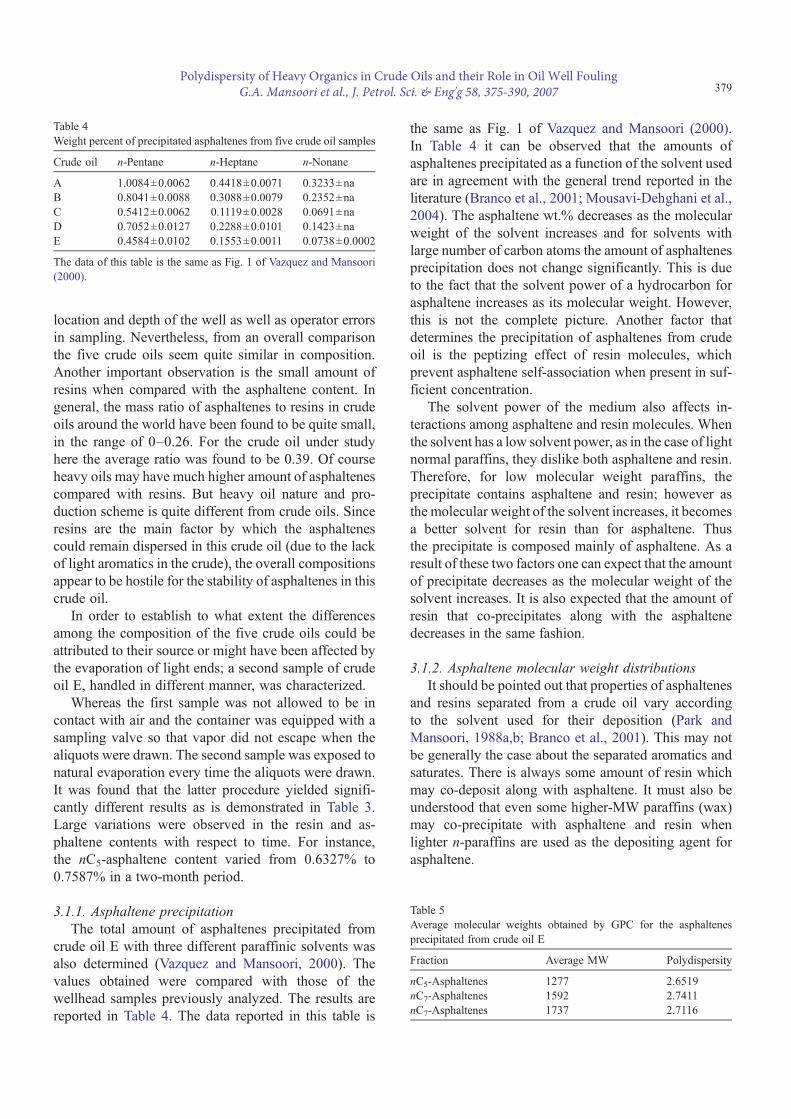
of the distributions towards higher values of molecularweight suggest. For instance in Fig. 3 the variousasphaltene molecular weight distributions for crude oilA are shown. As it can be seen, the population of thehigh molecular weight species is markedly large. In fact,this crude oil was found to render the highest amounts ofprecipitated asphaltenes as it is shown in Table 4. All theasphaltene fractions obtained from the crude oils whosesamples were taken at the wellhead, displayed similarbehavior (see for example Figs. 3 and 4).
This behavior can be explained, as a result of theequilibrium among the asphaltenes, micelles and mi-celle aggregates (coacervates) present in the solution(Pacheco-Sanchez and Mansoori, 1998; Vazquez andMansoori, 2000; Priyanto et al., 2001a,b). The asphal-tene molecules constitute the first population depicted inthe left side of the distribution with MW of less than400, the micelles, second population, are clearly dis-tinguished in the first peak between 1000–4000. Finally,the micelle-coacervates, with MW of more than 4000,are depicted in the second peak.
Fig. 4. Molecular weight distributions obtained by GPC for the various asphaltene fractions of crude oil D.
Table 6Average molecular weights obtained by GPC for the aromatic and resinfractions derived from the crude oils under study
Crude oil Aromatic fraction Resin fraction
A 731 1022B 652 1042C 669 981D 799 976E 288 768
381
Polydispersity of Heavy Organics in Crude Oils and their Role in Oil Well Fouling G.A. Mansoori et al., J. Petrol. Sci. & Eng'g 58, 375-390, 2007
In general, determining the molecular weight ofasphaltenes is not a straightforwardmeasurement. Severalfactors such as aggregate formation and the presence ofadsorbed resin material on asphaltene leads to discrepan-cies in the values obtained. For instance a wide range ofasphaltene molecular weights (500–50,000) has beenreported in the literature (Yen and Chilingarian, 1994).
The tendency of the asphaltenes to self-associate insolution, one of theirmost characteristic features,makes thedetermination of molecular weight a difficult task. Severaltechniques such as vapor pressure osmometry (VPO), massspectrometry (MS) and gel permeation chromatography(GPC) have been used extensively. Recently, the small-
angle neutron scattering technique (SANS) has beenapplied to determine the size of asphaltene particles. Allmethods however, are influenced by the conditions of theanalysis (i.e. temperature, asphaltene concentration andsolvent polarity) and the overlap of the separated fractions(see for example Roux et al., 2001). In general, no methodhas proven to give absolute molecular weights. Forinstance, the VPO technique gives high molecular values,even in good solvents due to molecular association(Yarranton et al., 2000), on the other hand data producedfromMS studies are affected by the volatility of the sampleand may give low apparent values (see for exampleWilhelms et al., 1993).
Fig. 6. Molecular weight distributions curves obtained by GPC for the aromatic fractions derived from the wellhead crude oil samples analyzed.
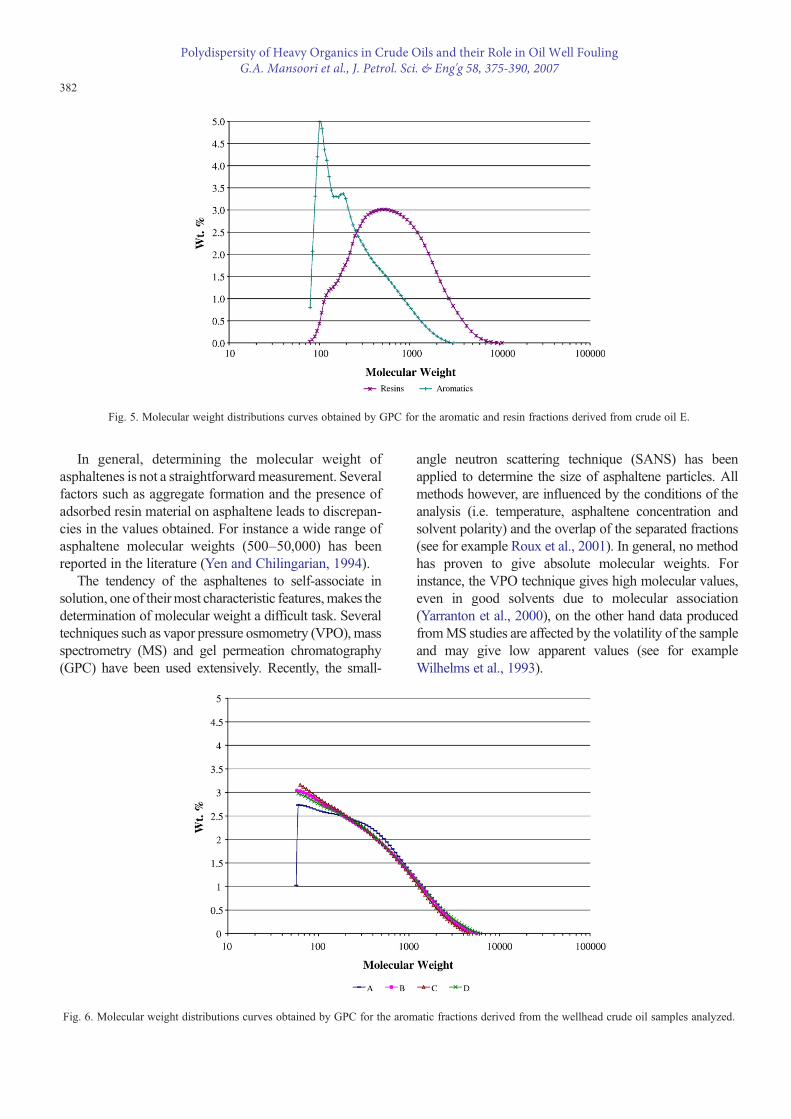
Fig. 5. Molecular weight distributions curves obtained by GPC for the aromatic and resin fractions derived from crude oil E.
382
Polydispersity of Heavy Organics in Crude Oils and their Role in Oil Well Fouling G.A. Mansoori et al., J. Petrol. Sci. & Eng'g 58, 375-390, 2007
Gel permeation chromatography (GPC) is the mostwidely used technique to determine the molecularweight of asphaltenes since in addition to the averageparameters, the molecular weight distributions obtainedare clear indicatives of the interaction among the sev-eral species in solution (Jewell et al., 1974; Leontaritisand Mansoori, 1989; Vazquez and Mansoori, 2000; Aliet al., 2006). It must be understood however that thistechnique provides molecular weights relative to thestandards used for calibration.
3.1.3. Aromatics and resins molecular weight distributionsTable 6 contains a summary of the average molecular
weights obtained for the aromatic and resin fractions ofall crude oils. As it was expected, the resin fractionsexhibit higher molecular weights than the aromaticfractions.
Fig. 5 shows the MW distribution for the aromaticand resins fractions of crude oil E. It can be observedthat the resin fraction exhibits not only higher MWvalues but also a wider distribution. In fact, the shape ofthe curve is normal indicating that, with respect to size,resins distribute evenly around their mean in the crudeoil. It also resembles somehow the nC5-asphaltenedistribution (reported in Fig. 2), suggesting the struc-tural similarity between these species. In fact severalstudies have suggested that this similarity is responsiblefor their affinity to each other in solutions and petroleum(Chang and Fogler, 1994). It should be pointed out thatasphaltenes flocculate and grow in size as a result ofinstabilities in the crude oil but resins do not do so.
Furthermore, the overlapping of all three fractions(asphaltenes, aromatic and resins) denotes that they are
part of a continuous complex mixture in which eachfraction is related to general characteristics more thanto specific compounds. Similar shapes were found inthe MW distributions of the other crude oils analyzed,although the distributions obtained resulted more poly-disperse and were displaced towards higher molecularweights (Figs. 6 and 7). Since these samples correspond tothe wellhead crude oils, which experienced free evapo-ration during sampling and handling, it is believed that notonly the asphaltene, but also the resin and aromaticfractions suffer alterations once the stability of the crudeoil is disrupted, although they are less pronounced.
3.2. Analysis of solid deposits
The solid deposits S1 and S2 were characterizedusing the SARA separation technique, the solid S2 wascharacterized using two different separation schemes(Vazquez and Mansoori, 2000). This set of experimentswas performed in order to compare the two solidsamples and the differences on the fractions obtainedwith the two schemes used. The aromatic, resin andasphaltene fractions obtained from both samples were
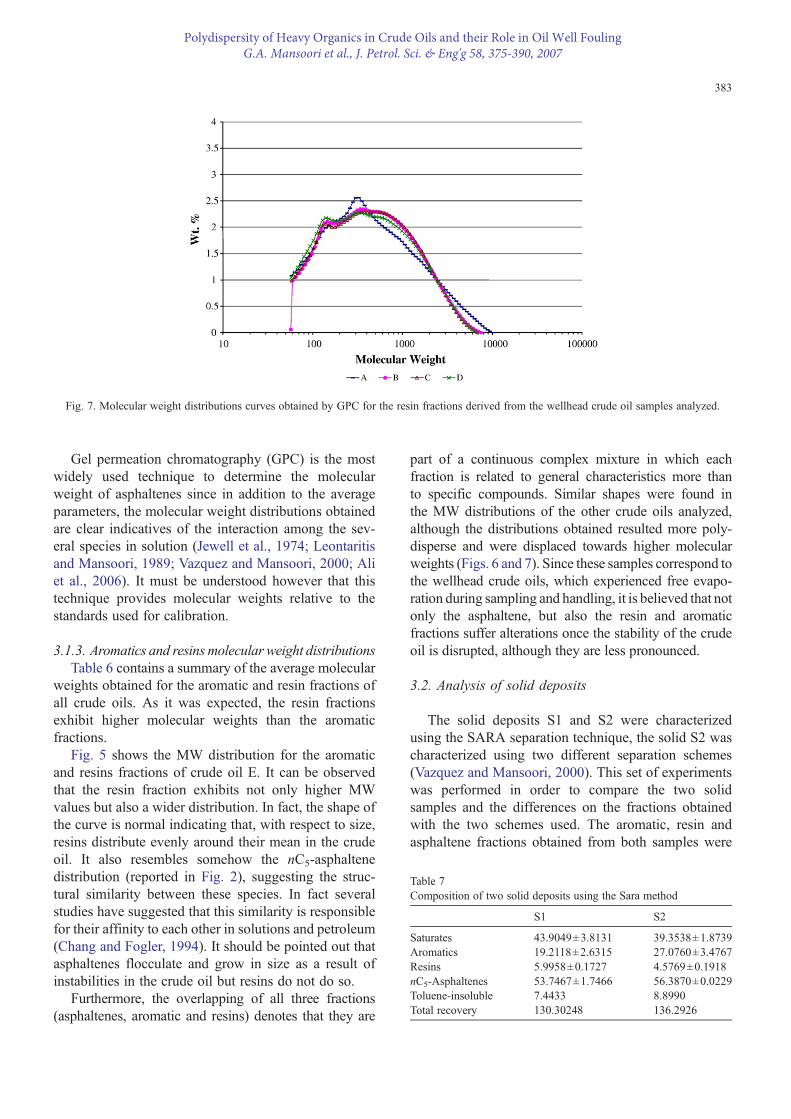
Fig. 7. Molecular weight distributions curves obtained by GPC for the resin fractions derived from the wellhead crude oil samples analyzed.
Table 7Composition of two solid deposits using the Sara method
S1 S2
Saturates 43.9049±3.8131 39.3538±1.8739Aromatics 19.2118±2.6315 27.0760±3.4767Resins 5.9958±0.1727 4.5769±0.1918nC5-Asphaltenes 53.7467±1.7466 56.3870±0.0229Toluene-insoluble 7.4433 8.8990Total recovery 130.30248 136.2926
383
Polydispersity of Heavy Organics in Crude Oils and their Role in Oil Well Fouling G.A. Mansoori et al., J. Petrol. Sci. & Eng'g 58, 375-390, 2007

analyzed by means of GPC. The saturate fractions wereanalyzed using GC-MS.
The solid deposit samples were pulverized anddissolved in a small quantity of toluene. Upon additionof toluene the solids formed larger aggregates andadhered to the glass surface they came in contact with,only after more toluene was added and under vigorousagitation, the aggregates dissolved in the toluene andformed a homogeneous solution. The adherence to glasssurface was also observed when the solid material camein contact with paraffinic solvents.
The SARA separation technique was also used tofractionate the solids dissolved in toluene. After fourrepetitions of the SARA procedure on each solidsample, an interesting observation was made and thatwas the weight increase of the original sample of 35%on average. In view of this observation, additionalsamples were diluted in toluene and then submitted toprolonged evaporation at vacuum conditions (at 25 mmHg and room temperature) and the samples' weight wasmonitored. However, the samples' weight did notreduce to their original weight again. It is believed thatthis weight increase was due to the occlusion of solventmolecules within the asphaltene aggregates. It is knownthat asphaltene in aromatic and polar solvents formmolecular aggregates and above the CMC (criticalmicelle concentration) the asphaltene molecules willassociate to form larger aggregates (micelle coacer-vates), trapping some of the solvent molecules duringevaporation (Pacheco-Sanchez and Mansoori, 1989;Priyanto et al., 2001a,b). Another possibility for the
weight increase could be attributed to the reaction ofsome species in the solid with the oxygen in the air.However this is rather unlikely since the contact of thesamples with air were kept minimum. In any case, it isbelieved that the combination of several factors(physical and chemical) could be responsible for theweight increase of the samples. The results of the SARAanalysis are reported in Table 7 and in Fig. 8. Note fromTable 7 that the solid deposits are mainly comprised ofasphaltene and saturate (paraffins and diamondoids)compounds. Another important observation to be madeis the considerable amount of toluene-insoluble material(assumed to be of inorganic nature) which were nottrapped in the filters before SARA analysis of thesample. The appearance of solid deposits during SARAanalysis suggests that there is a strong interactionbetween this toluene-insoluble material and the otherheavy organic fractions of the crude.
The hypothesis that some of the constituents of thesolid deposit may have undergone physical/chemicaltransformations during the separation procedure prompted
Fig. 8. Schematic composition of the solid deposits collected inside two wells and fractionated by the SARA method.
Table 8Composition of solid S2 using two separation schemes
Scheme I Scheme II
Saturates 28.8745±1.552 13.7752Aromatics 19.8661±0.5786 17.0128Resins 3.3581±0.1612 2.7184nC5-Asphaltenes 41.3720±0.076 56.1899Toluene-insoluble 6.5293 8.8990Total recovery 100.0000 98.5950
384
Polydispersity of Heavy Organics in Crude Oils and their Role in Oil Well Fouling G.A. Mansoori et al., J. Petrol. Sci. & Eng'g 58, 375-390, 2007

a new set of experiments in which the first step of dis-solution in toluene was eliminated. Two SARA separa-tions were performed on the solid S2 without priordissolution in toluene. The average recovery of 98.58%confirmed the assumption that toluene dissolution affectsthe yields of separation.
The results of SARA separation performed on solidsample S2 are shown in Table 8. For the sake of com-parison, the values of the first separation performed onthe same solid S2, displayed in the left column, werenormalized to 100%. It can be observed that the saturateand asphaltene fractions exhibited dramatic changes incomposition according to the scheme of separationemployed, the resins were moderately affected and thearomatic fractions experienced minor changes. Further-more, in Fig. 9 can be seen that the saturate fractiondecreases in a similar percentage to the increase in theasphaltene fraction. This suggests that a considerableamount of the paraffinic components (wax) remaintrapped within the large solid aggregates of the depositswhen the sample is not pre-diluted in toluene, andenforces the idea that these species greatly interact withthe asphaltenes during the deposition mechanism.
In addition to the fractionation of the solid depositswith two different procedures, the nC5-asphaltene fromthe second scheme were subsequently precipitated withn-heptane following the same procedure used for theprecipitation with n-pentane.
3.2.1. Molecular weights of the fractionsThe nC5-asphaltene, the aromatic and resin fractions
obtained by the SARA method in both schemes, as well
as the nC7-asphaltene were analyzed by means of GPC.The fractions dissolved in THF at a concentration of0.25% (weight/volume) and filtered through a 0.45 μmmembrane were injected to the system. One injectionof 75 μL was made of each solution. The averagemolecular weights and polydispersity index are sum-marized in Table 9. The values observed are very similarfor the aromatic and resin fractions, thus suggesting thatthe nature of these fractions is not considerably affectedfor the scheme of separation used.
Pursuant to the asphaltenes, the higher polydispersityof the nC5-asphaltenes from the second separation issupposed to be caused by the presence of major amountsof co-precipitated wax (paraffinic species). However nodirect evidence was found of this fact. In the sameway, the average molecular weight of the asphaltenesobtained by the second separation resulted slightlyhigher. It is known that the asphaltenes precipitatedwith a higher MW n-alkane, will have higher molec-ular weight values as a result of the decrease in the
Fig. 9. Schematic composition of solid S2 sing two different separation schemes.
Table 9Average molecular weights for the aromatics, resins and asphaltenesobtained from solid S2
Scheme I Scheme II
AverageMW
Polydispersity AverageMW
Polydispersity
Aromatics 311 1.7464 293 1.4115Resins 553 1.7112 555 2.0291nC5-Asphaltenes 2299 3.4600 3140 4.5767nC7-Asphaltenes 3425 4.0129
385
Polydispersity of Heavy Organics in Crude Oils and their Role in Oil Well Fouling G.A. Mansoori et al., J. Petrol. Sci. & Eng'g 58, 375-390, 2007
proportion of resins. Surprisingly, the molecular weightfor the nC7-asphaltenes did not show big differenceswhen compared with the nC5-asphaltenes. This can beexplained in terms of the very low concentration ofresins present in the solid.
It is also important to analyze the differences in theamount and properties of the asphaltenes precipitatedfrom the solid deposits and the crude oil. Assuming thataggregation effects follow the phenomena of destabi-lization it would be reasonable to expect in the as-phaltenes of the deposits higher amounts of precipitationand higher molecular weights. The results obtainedshow that this is the case for crude oil E, but not for the
other crude oil samples for which the values resultedon the same order. This observation confirms that thesefour oil samples were past the onset of deposition as itwas suggested by the presence of suspended particles inthe crude oil and the broad molecular weight distribu-tion of asphaltenes obtained by GPC.
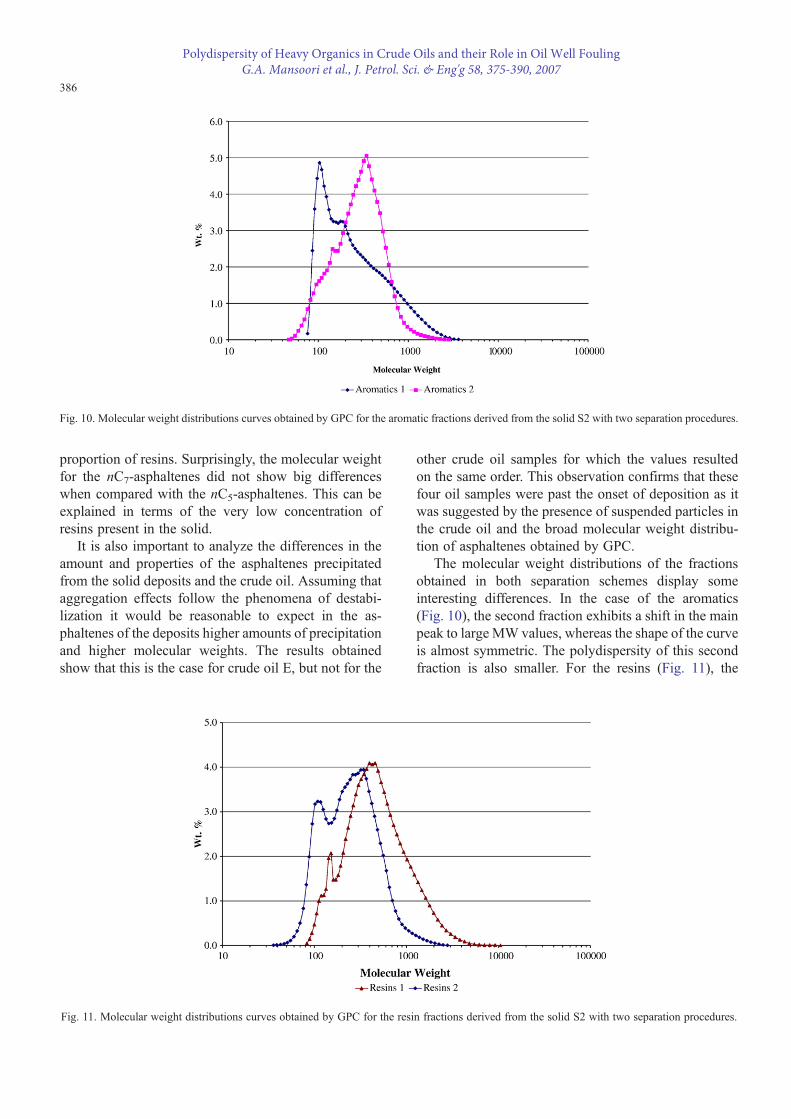
The molecular weight distributions of the fractionsobtained in both separation schemes display someinteresting differences. In the case of the aromatics(Fig. 10), the second fraction exhibits a shift in the mainpeak to large MW values, whereas the shape of the curveis almost symmetric. The polydispersity of this secondfraction is also smaller. For the resins (Fig. 11), the
Fig. 10. Molecular weight distributions curves obtained by GPC for the aromatic fractions derived from the solid S2 with two separation procedures.
Fig. 11. Molecular weight distributions curves obtained by GPC for the resin fractions derived from the solid S2 with two separation procedures.
386
Polydispersity of Heavy Organics in Crude Oils and their Role in Oil Well Fouling G.A. Mansoori et al., J. Petrol. Sci. & Eng'g 58, 375-390, 2007

second fraction has a broader distribution with the mainpeak displaced to higher molecular weights; both curveshowever, present similar shape.
The asphaltene distributions (Fig. 12), exhibit thesame bimodal shape, but displaced to larger molecularweights in the asphaltenes of the second separation. It isinteresting to note the similarity in the shape of the nC5-asphaltenes and nC7-asphaltenes distributions. This,again, seems to be a result of the low amount of resinspresent in the solid.
The MW distributions of the nC5-asphaltenes ob-tained from the solid samples display a prominent peakdisplaced to high molecular weights (10,000); this shaperesembles the molecular weight distributions obtainedfor the nC9-asphaltenes precipitated from the crude oilsamples. This observation seems to indicate that oncethe equilibrium among the several species in the crudeoil is disrupted the asphaltenes may react predominantlyamong themselves to form larger particles, rather thanwith the other species present in the crude oil.
The molecular weight distributions for the aromaticand resin fractions of the solid deposit S1 were alsoobtained by means of GPC. The average molecularweights are summarized in Table 10. The average mo-lecular weights of both fractions resulted much higher
than those reported for the solid S2, the same can be saidabout the polydispersity. The molecular weight distribu-tions in Fig. 13 show that the resin distribution is almostsymmetric with three distinguishable peaks. In the caseof the aromatics, the molecular weight distributionpresents a very broad shape tailed to high molecularweights. The shape, similar to the resin distribution andthe unusual values measured, as well as the intenseoverlap of both distributions could be an indicative thatthe separation was not successful accomplished. It isimportant to mention that due to the small amounts ofthis sample (0.75 g) it was not possible to perform moreexperiments. So far the results obtained could not allowus to conclude whether or not both solids are structurallysimilar, even though both of them were found similar incomposition.
3.2.2. Normal-paraffin distributionGC-MS analyses were conducted on the saturate
fractions of both solid deposits. From these analyses, theoverall carbon number distribution of normal paraffinswas also determined.
It must be pointed out that the GC-MS data canalso help us to determine the existence and amount ofdiamondoids (adamantane, diamantane, triamantaneetc.) in the sample. Although, tria-, tetra-, penta-, andhexamantane could also be present in the solids, it wasdecided that if adamantane and diamantane were found,then there is a possibility that higher adamantologuesare also present in these solids. Adamantane, if present,will elute from the column between nC10 and nC11;diamantane will elute between nC15 and nC16; andtriamantane will elute between nC19 and nC20.
Fig. 12. Molecular weight distributions curves obtained by GPC for the asphaltenes derived from the solid S2 with two separation procedures.
Table 10Average molecular weights for the aromatic and resin fractions obtainedfrom solid S1
Average MW Polydispersity
Aromatics 755 3.7329Resins 856 3.2893
387
Polydispersity of Heavy Organics in Crude Oils and their Role in Oil Well Fouling G.A. Mansoori et al., J. Petrol. Sci. & Eng'g 58, 375-390, 2007
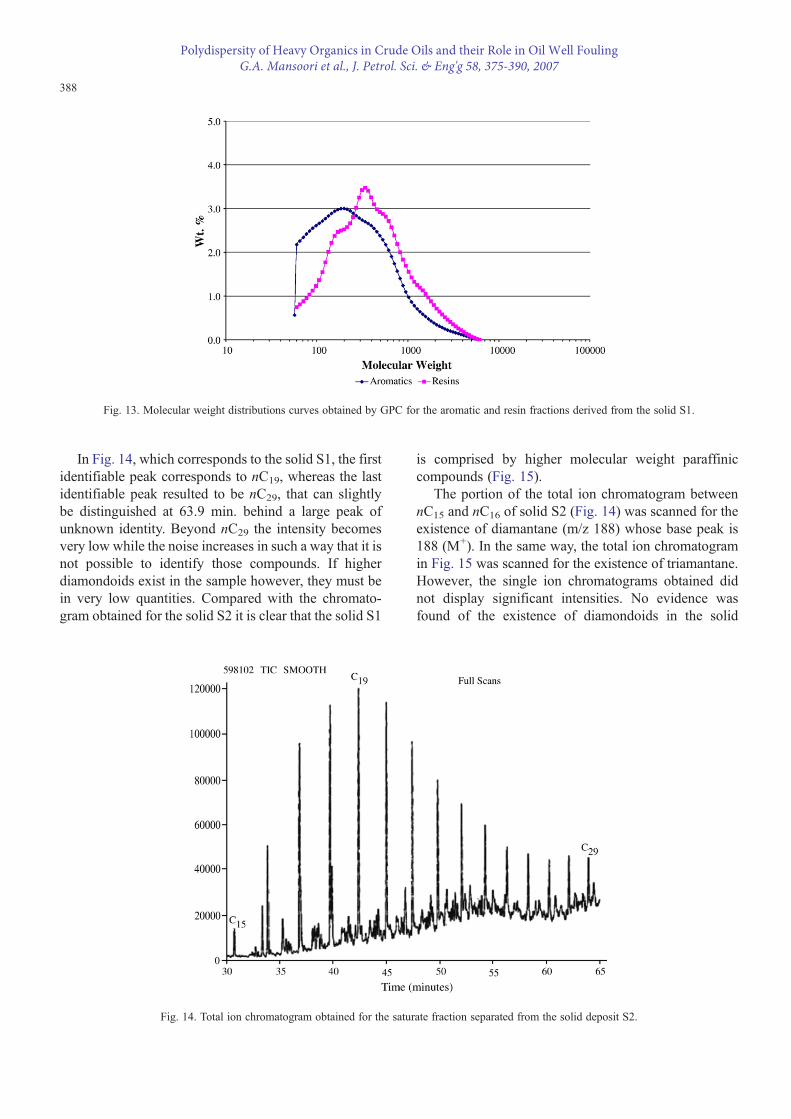
In Fig. 14, which corresponds to the solid S1, the firstidentifiable peak corresponds to nC19, whereas the lastidentifiable peak resulted to be nC29, that can slightlybe distinguished at 63.9 min. behind a large peak ofunknown identity. Beyond nC29 the intensity becomesvery low while the noise increases in such a way that it isnot possible to identify those compounds. If higherdiamondoids exist in the sample however, they must bein very low quantities. Compared with the chromato-gram obtained for the solid S2 it is clear that the solid S1
is comprised by higher molecular weight paraffiniccompounds (Fig. 15).
The portion of the total ion chromatogram betweennC15 and nC16 of solid S2 (Fig. 14) was scanned for theexistence of diamantane (m/z 188) whose base peak is188 (M+). In the same way, the total ion chromatogramin Fig. 15 was scanned for the existence of triamantane.However, the single ion chromatograms obtained didnot display significant intensities. No evidence wasfound of the existence of diamondoids in the solid
Fig. 13. Molecular weight distributions curves obtained by GPC for the aromatic and resin fractions derived from the solid S1.
Fig. 14. Total ion chromatogram obtained for the saturate fraction separated from the solid deposit S2.
388
Polydispersity of Heavy Organics in Crude Oils and their Role in Oil Well Fouling G.A. Mansoori et al., J. Petrol. Sci. & Eng'g 58, 375-390, 2007

deposits, therefore suggesting that these species did notexist in the samples.
4. Conclusions
4.1. Crude oils
The analyses conducted on the crude oil samplesdemonstrated that these oils are very sensitive to thesampling and handling procedures. Given the smallratios of resins to asphaltenes and the large amounts oflight material (mostly of paraffinic nature) found inthese crude oils, the overall composition appears to behostile for the stability of asphaltenes in the oil mixture.Therefore upon changes in pressure and temperature theequilibrium between the resins, asphaltenes and themedium is disrupted. The asphaltenes self-associateforming large aggregates which segregate out formingthe solid deposits. The presence of suspended solids inall the crude oil samples analyzed, confirmed that theyhad already initiated the deposition phenomena.
The problem with these kinds of samples is that thecharacterization may not correspond to the original speciesas they exist in the crude oil. This is particularly true for theasphaltenes, the GPC analyses shown that whereas thearomatic and resin fractions experienced slight variations intheir MW distributions, the asphaltene fractions displayedbig differences in all the crude oils analyzed.
It was important to establish whether the differencesbetween the crude oils were originated for the handlingprocedure or the source itself. The comparison of all theMW distributions denote that the four crude oils handled
in a similar manner, exhibit also very similar shapechromatograms, on the other hand these distributionsmarkedly differ from the crude oil that was handled in acontrolled manner (i.e. crude oil E). Since the conditionsunder which the first crude oil samples were obtainedwere not controlled, they were considered not reliablenor representative of the true nature of the heavyfractions of the crude oils under study. Nevertheless,from a qualitative point of view the analyses indicatethat the crude oils present similar behavior. Thesestudies also revealed that the heavy fractions separatedfrom crude oil E could be considered the most rep-resentative of the real nature of these species as theyoriginally exist in the crude oil reservoir.
The results from the GPC studies of the asphaltenefractions demonstrated the tendency of these species toself-associate, as the bimodal shape of the distributioncurves indicates. It is also observed that the intensity ofthese interactions among asphaltenes increases as theamount of resins which co-precipitate decreases.
A relationship among the MW distributions of theasphaltenes and the yields of precipitation was alsoobserved. Those oils whose asphaltene population wasdisplaced towards higher MW values render the highestamounts of precipitated asphaltenes.
4.2. Solid deposits
The composition of the solid deposits suggests astrong interaction between the asphaltenes, paraffins andinorganic material in the deposition process. A possibleexplanation from these is that mineral particles assist
Fig. 15. Total ion chromatogram obtained for the saturate fraction separated from the solid deposit S1.
389
Polydispersity of Heavy Organics in Crude Oils and their Role in Oil Well Fouling G.A. Mansoori et al., J. Petrol. Sci. & Eng'g 58, 375-390, 2007
the precipitation of asphaltenes, once the equilibriumbetween the asphaltene and the resins is disrupted, theasphaltene tends to adhere to mineral material from thereservoir. These attractive forces would also result in theformation of larger aggregates. During this processparaffins may get trapped within the solid aggregates.The analysis of the SARA separations revealed that bothsolid deposits are similar in composition and haveundergone similar deposition mechanism.
The existence of diamondoids in the crude oils ofthe oilfields under study was previously confirmed byus when it was thought that these compounds mayparticipate in the deposition mechanism as nucleationsites. However, the GC-MS studies did not confirm thepresence of diamondoids in the solid samples of thisstudy. This observation suggests that diamondoids seemnot to participate in the heavy organic deposition;however the crude oils from which the solid depositswere analyzed have not been analyzed for the presenceof diamondoids.
Acknowledgements
We would also like to acknowledge the contribu-tion of Dr. J. Escobedo and Dr. S. Scheppele for theirassistance during the conduction of the experiments.Finally, we would like to thank the industrial fundingentities (names are withheld for confidentiality) whichprovided financial support, samples and help duringdata collection for this research.
References
Ali, F.A., Ghaloum, N., Hauser, A., 2006. Structure representation ofasphaltene GPC fractions derived from Kuwaiti residual oils.Energy Fuels 20 (1), 231–238.
Branco, V.A.M., Mansoori, G.A., De Almeida Xavier, L.C., Park, S.J.,Manafi, H., 2001. Asphaltene flocculation and collapse frompetroleum fluids. J. Pet. Sci. Eng. 32, 217–230.
Chang, C.-L., Fogler, H.S., 1994. Stabilization of asphaltenes in aliphaticsolvents using alkylbenzene-derived amphiphiles. 1. Effect of thechemical structure of amphiphiles on asphaltene stabilization.Langmuir 10 (6), 1749–1757.
Chorn, L.G., Mansoori, G.A., 1989. C7+ Fraction Characterization.Taylor & Francis Pub. Co., New York, NY.
Eliassi, A., Modaress, H., Mansoori, G.A., 2005. Study of asphalteneflocculation using particle counting method. Proceed. Filtech 2005.Int'l. Conf. & Exhib. for Filteration & Separation Tech., vol. I,pp. 506–511 (Weisbaden, Ger., Oct. 11–13).
Green, L.E., Schmauch, L.J., Worman, J.C., 1964. Simulated distillationby gas chromatography. Anal. Chem. 36 (8), 1512–1516.
Hu,Y.F., Li, S., Liu, N., Chu,Y.P., Park, S.J.,Mansoori, G.A., Guo, T.M.,2004.Measurement and corresponding statesmodeling of asphalteneprecipitation. J. Pet. Sci. Eng. 41 (1–3), 199–212.
Jewell, D.M.,Albaugh, E.W., Davis, B.E., Ruberto, R.G., 1974. Integrationof chromatographic and spectroscopic techniques for the characteriza-tion of residual oils. Ind. Eng. Chem. Fundam. 13 (3), 278–282.
Kawanaka, S., Leontaritis, K.J., Park, S.J., Mansoori, G.A., 1989.Thermodynamic and colloidal models of asphaltene flocculation.Oil Field Chemistry, ACS SymposiumSeries No. 396,Washington,D.C., Chapter 24.
Kawawaka, S., Park, S.J., Mansoori, G.A., 1991. Organic depositionfrom reservoir fluids: A thermodynamic predictive technique. SPEReserv. Eng. 185–195 (May).
Leontaritis, K.J., Mansoori, G.A., 1989. Fast crude-oil heavy componentcharacterization using combination of ASTM, HPLC, and GPCmethods. Int. J. Pet. Sci. Technol. 2, 1–12.
Mansoori, G.A., 1997.Modeling of asphaltene and other heavy organicdepositions. J. Pet. Sci. Eng. 17, 101–111.
Mansoori, G.A., 2002. Cause and effect of deposition and fouling ofheavy organics and other compounds in fuel and petrochemicalprocesses. KU Int. J. Sci. Technol., Trans. B 1–17.
Mousavi-Dehghani, S.A., Riazi, M.R., Vafaie-Sefti, M., Mansoori, G.A.,2004. An analysis of methods for determination of onsets of asphaltenephase separations. J. Pet. Sci. Eng. 42 (2–4), 145–156.
Pacheco-Sanchez, J.H., Mansoori, G.A., 1998. In Situ remediation ofheavy organic deposits using aromatic solvents. SPE Paper # 38966,13p, Proceedings the 68th Annual SPE Western Regional Meeting,Bakersfield, CA, 11–15 May, 1998.
Pacheco-Sanchez, J.H., Mansoori, G.A., 1989. Prediction of the phasebehavior of asphaltene micelle/aromatic hydrocarbon systems.J. Pet. Sci. Technol. 16 (3&4), 377–394.
Park, S.J., Mansoori, G.A., 1988a. Organic deposition from heavypetroleum crudes (a FRACTAL aggregation theory approach).Proceed. UNITAR/UNDP 4th Intl. Conference on Heavy Crudesand Tar Sands, Edmonton, Alberta, Canada, August.
Park, S.J., Mansoori, G.A., 1988b. Aggregation and deposition of heavyorganics in petroleum crudes. Intl. J. Energy Sources 10, 109–125.
Park, S.J., Escobedo, J., Mansoori, G.A., 1993. In: Yen, T.F., Chilingarian,G.V. (Eds.), Asphaltenes and Asphalts, 1. Elsevier, The Netherlands.Ch. 8.
Priyanto, S., Mansoori, G.A., Suwono, A., 2001a. Measurement ofproperty relationships of nano-structure micelles and coacervatesof asphaltene in a pure solvent. Chem. Eng. Sci. 56, 6933–6939.
Priyanto, S., Mansoori, G.A., Suwono, A., 2001b. Structure & propertiesof micelles and micelle coacervates of asphaltene macromolecule.Nanotechnology Proceed. of 2001 AIChE Annual Meet.
Roux, J.-N., Broseta, D., Deme, B., 2001. SANS study of asphalteneaggregation: concentration and solvent quality effects. Langmuir17 (16), 5085–5092.
Vazquez, D., Mansoori, G.A., 2000. Identification and measurement ofpetroleum precipitates. J. Pet. Sci. Eng. 26, 49–55.
Wilhelms, A., Larter, S.R., Schulten, H.-R., 1993. Characterization ofasphaltenes by pyrolysis-field ionization mass spectrometry—some observations. Org. Geochem. 20 (7), 1049–1055.
Wingert,W.S., 1992.Analysis of diamondoid hydrocarbons in SmackoverPetroleums. Fuel 71, 37–43.
Yarranton, H.W., Alboudwarej, H., Jakher, R., 2000. Investigation ofasphaltene association with vapor pressure osmometry and interfacialtension measurements. Ind. Eng. Chem. Res. 39 (8), 2916–2924.
Yen, T.F., 1974. Structure of petroleum asphaltene and its significance.Energy Sources 1 (4), 447–463.
Yen, T.F., Chilingarian, G.V., 1994. Asphaltenes and asphalts, 1. Devel-opments in Petroleum Science. Elsevier Science, New York, NY.
390Polydispersity of Heavy Organics in Crude Oils and their Role in Oil Well Fouling
G.A. Mansoori et al., J. Petrol. Sci. & Eng'g 58, 375-390, 2007


![Precipitation of Heavy Organics (Asphaltenes) from Crude ... · chemical composition of the surrounding fluid is the greatest factor affecting asphaltene precipitation [9]. Consequently,](https://img.pdfslide.net/doc/110x75/60bd8ae826fde167a2085156/precipitation-of-heavy-organics-asphaltenes-from-crude-chemical-composition.jpg)