Embed Size (px)
Citation preview
POLYESTER STAPLE FIBER –
SECTOR OVERVIEW
December 2016
Domestic PSF Industry
Industry Snapshot
Industry Profile
PSF Manufacturing Process
Performance Trends
Price Trends
Regulatory Duty Structure
Pakistan’s polyester industry comprises three players | Total
operational capacity of ~537,000 tpa at end-Jun16.
Margins under pressure | Key Reason:
Inventory Management | Given volatility in raw material
prices
In Feb16, NTC imposed a final anti-dumping duty (2.8% to 11.5%) |
determination is made for a period of 5 years | Likely to support
margins of local players
Increase in custom duty on PSF from 6% to 10% in FY16
INDUSTRY SNAPSHOT
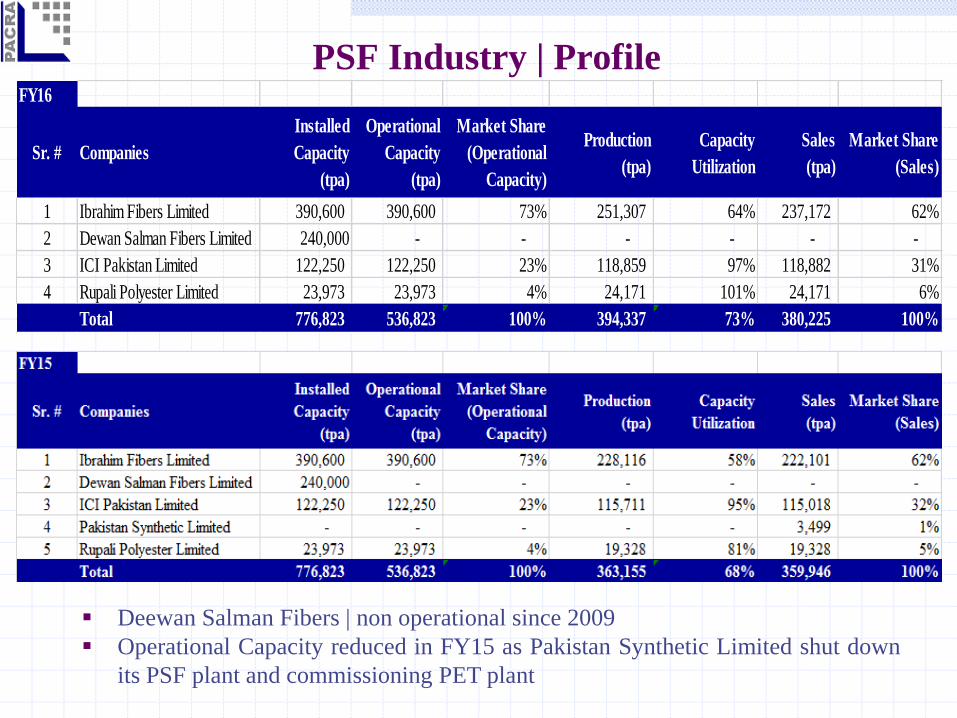
PSF Industry | Profile
Deewan Salman Fibers | non operational since 2009
Operational Capacity reduced in FY15 as Pakistan Synthetic Limited shut down
its PSF plant and commissioning PET plant
FY16
Sr. # Companies
Installed
Capacity
(tpa)
Operational
Capacity
(tpa)
Market Share
(Operational
Capacity)
Production
(tpa)
Capacity
Utilization
Sales
(tpa)
Market Share
(Sales)
1 Ibrahim Fibers Limited 390,600 390,600 73% 251,307 64% 237,172 62%
2 Dewan Salman Fibers Limited 240,000 - - - - - -
3 ICI Pakistan Limited 122,250 122,250 23% 118,859 97% 118,882 31%
4 Rupali Polyester Limited 23,973 23,973 4% 24,171 101% 24,171 6%
Total 776,823 536,823 100% 394,337 73% 380,225 100%
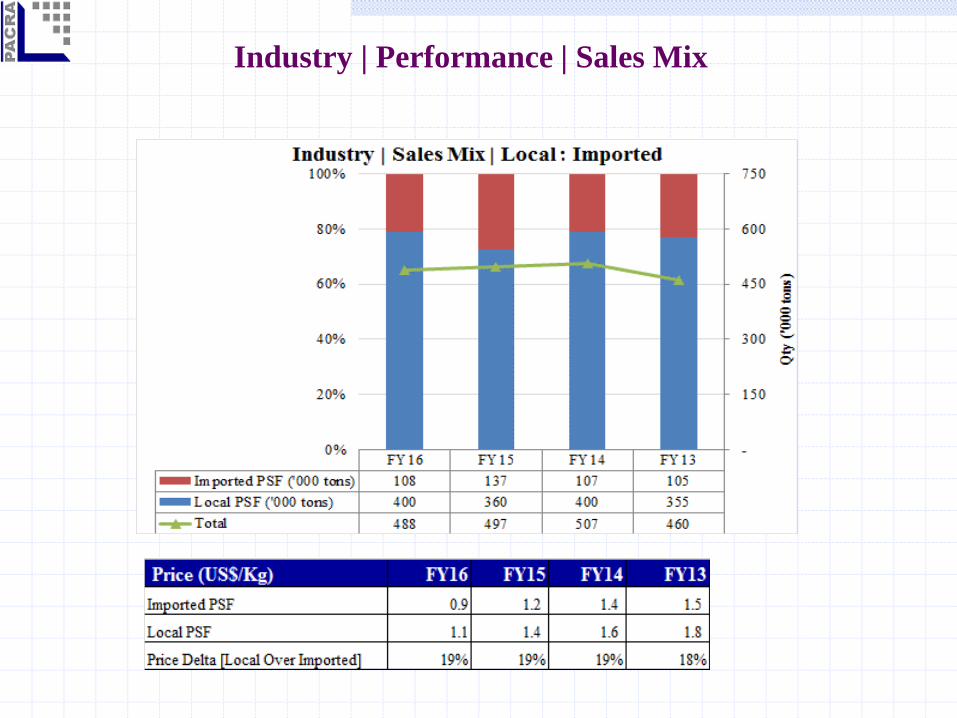
Industry | Performance | Sales Mix
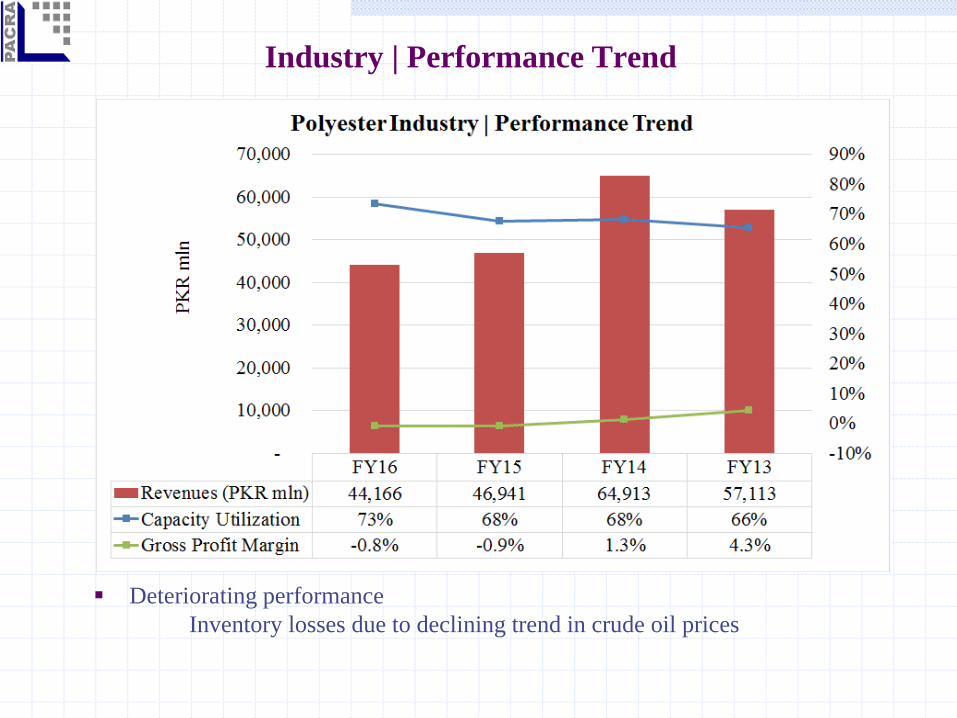
Industry | Performance Trend
Deteriorating performance
Inventory losses due to declining trend in crude oil prices
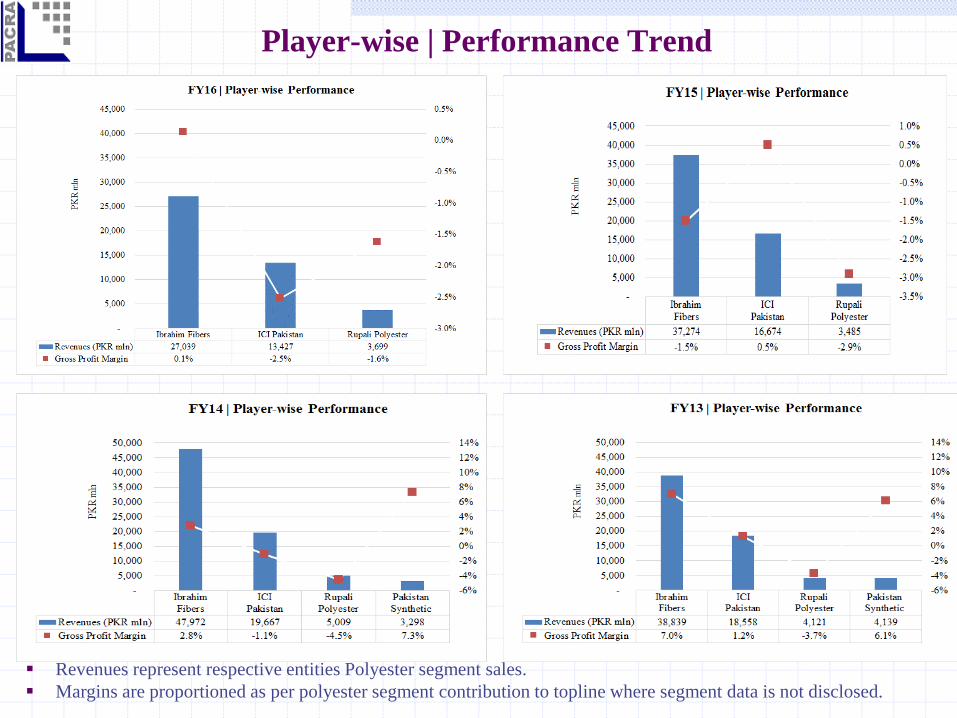
Player-wise | Performance Trend
Revenues represent respective entities Polyester segment sales.
Margins are proportioned as per polyester segment contribution to topline where segment data is not disclosed.
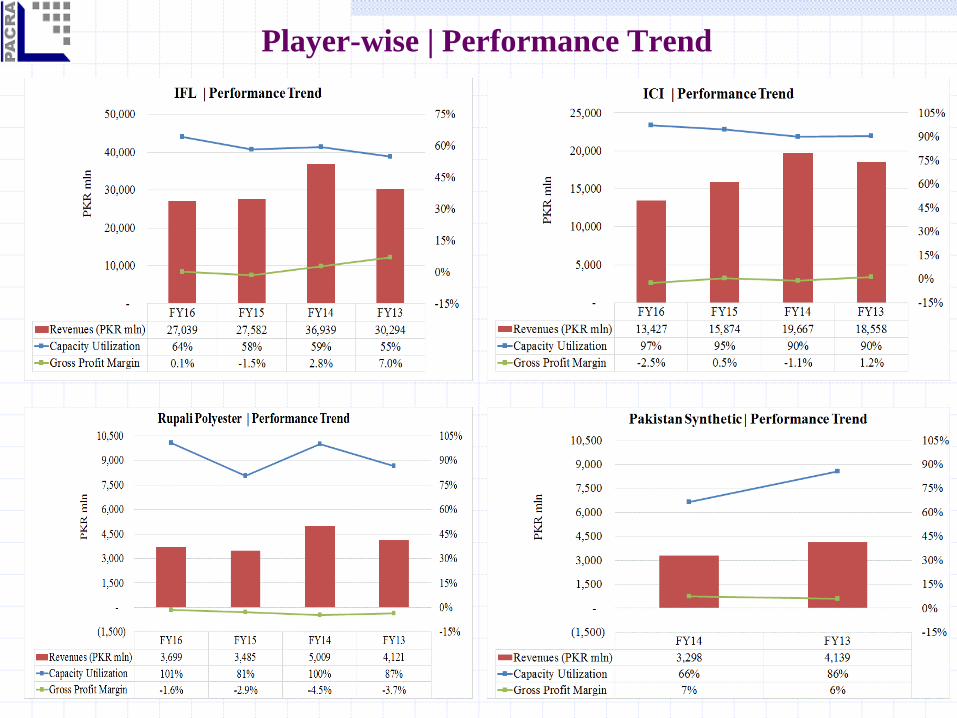
Player-wise | Performance Trend
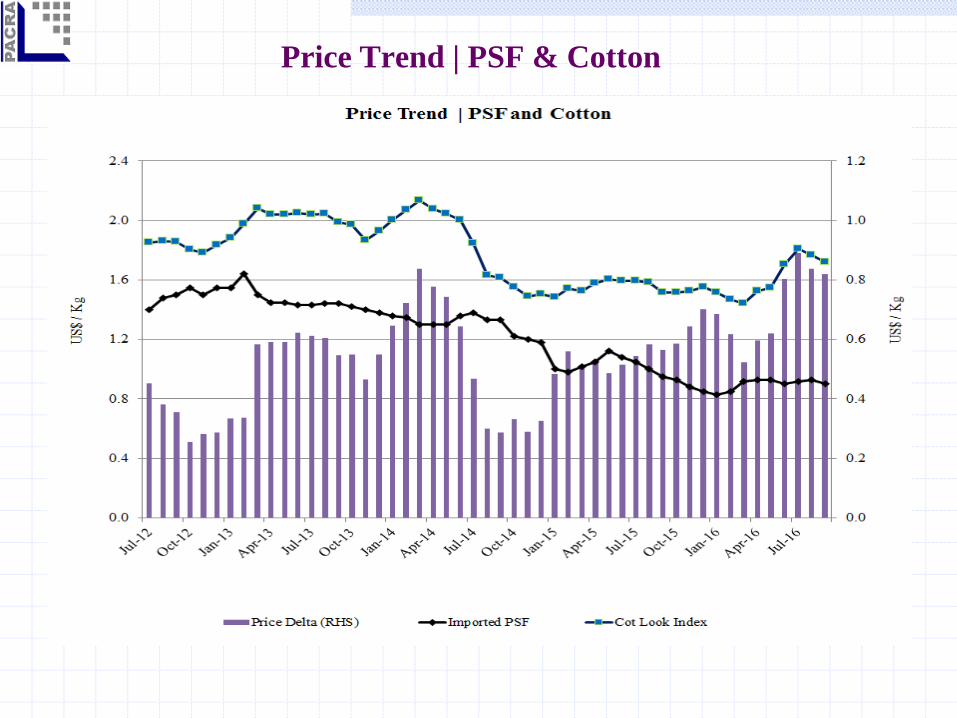
Price Trend | PSF & Cotton
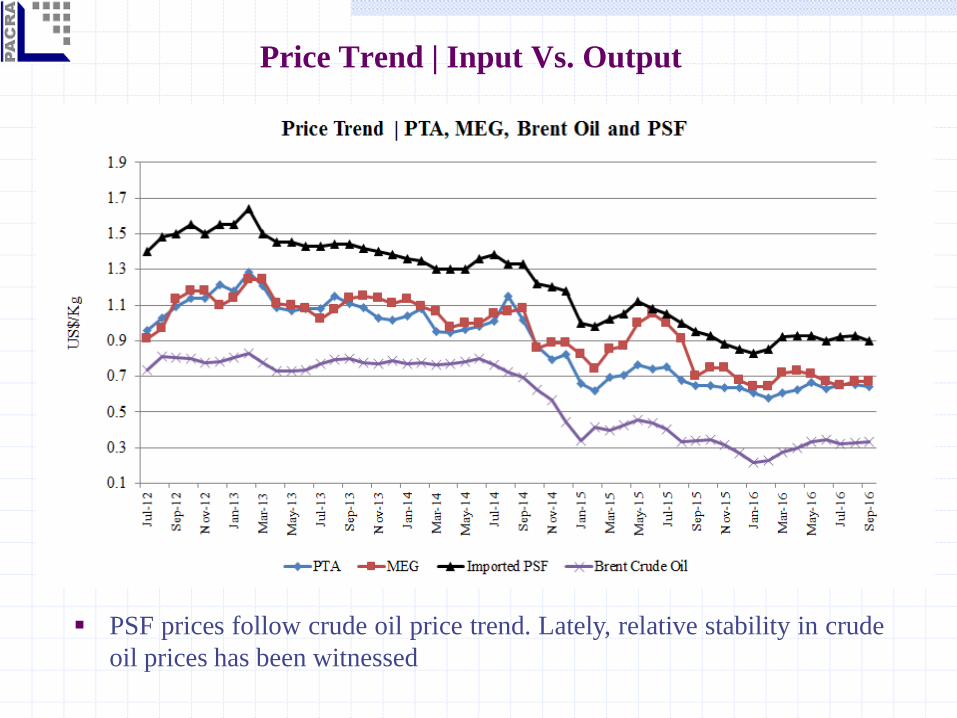
Price Trend | Input Vs. Output
PSF prices follow crude oil price trend. Lately, relative stability in crude
oil prices has been witnessed
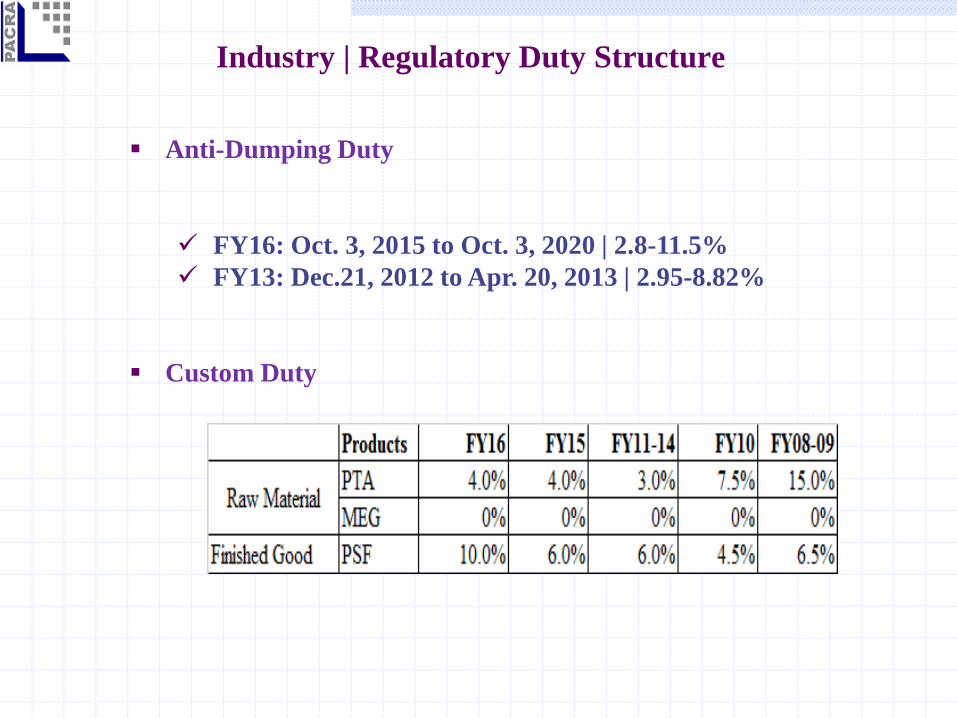
Industry | Regulatory Duty Structure
Custom Duty
Anti-Dumping Duty
FY16: Oct. 3, 2015 to Oct. 3, 2020 | 2.8-11.5%
FY13: Dec.21, 2012 to Apr. 20, 2013 | 2.95-8.82%
Analysts Rida Zahoor
Senior Financial Analyst
Saira Rizwan
Manager - Ratings
Rana M. Nadeem
Unit Head – Ratings
Contact Number: +92 42 3586 9504
DISCLAIMERPACRA has used due care in preparation of this document. Our information has been obtained from
sources we consider to be reliable but its accuracy or completeness is not guaranteed. The information
in this document may be copied or otherwise reproduced, in whole or in part, provided the source is
duly acknowledged. The presentation should not be relied upon as professional advice.