Embed Size (px)
Citation preview

Polygenic Risk Scores
Mayo Clinic & Illinois Alliance, Computational Genomics Course
Dan SchaidCurtis L. Carlson Professor of Genomics Research
Mayo ClinicEmail: [email protected]

Polygenic Risk Score (PRS)
PRS = Many Gene Score
Weighted sum of genotypes across genetic markers (SNPs) for a subject
• How to choose weights?• How to choose SNPs?• What do you do with a PRS?

Main Outline
• Ingredients for PRS: Genome Wide Association Studies• How to develop PRS• Current limits of PRS• Measure performance of PRS• Clinical use of PRS• Current efforts to bring PRS to clinical practice

Background on GWAS
• Genome-wide association study (GWAS)• Aim: detect associations between genetic locus (plural, loci) and a trait• Genetic locus: fixed position on a chromosome• Trait: disease status, quantitative trait (e.g. blood pressure), etc.
• GWAS brings us to the “neighborhood” of a causal gene• If lucky, we refine the region of the causal gene
Measured/Imputed SNP
Disease-risk allele, unmeasured
SNP Markers1 2 D 3

SNP Array for common variantsWhole genome sequencing (WGS) for rare variants
Sample size: 10K-100KPower depends on: allele frequency, effect size, linkage disequilibrium
Statistical association of each genetic variant with trait
Refinement of genomic position depends on linkage disequilibrium
$$$

SNP: single-nucleotide polymorphismgermline substitution of a single nucleotide at specific position in the genome
transitions more frequent than transversions due to biochemistry
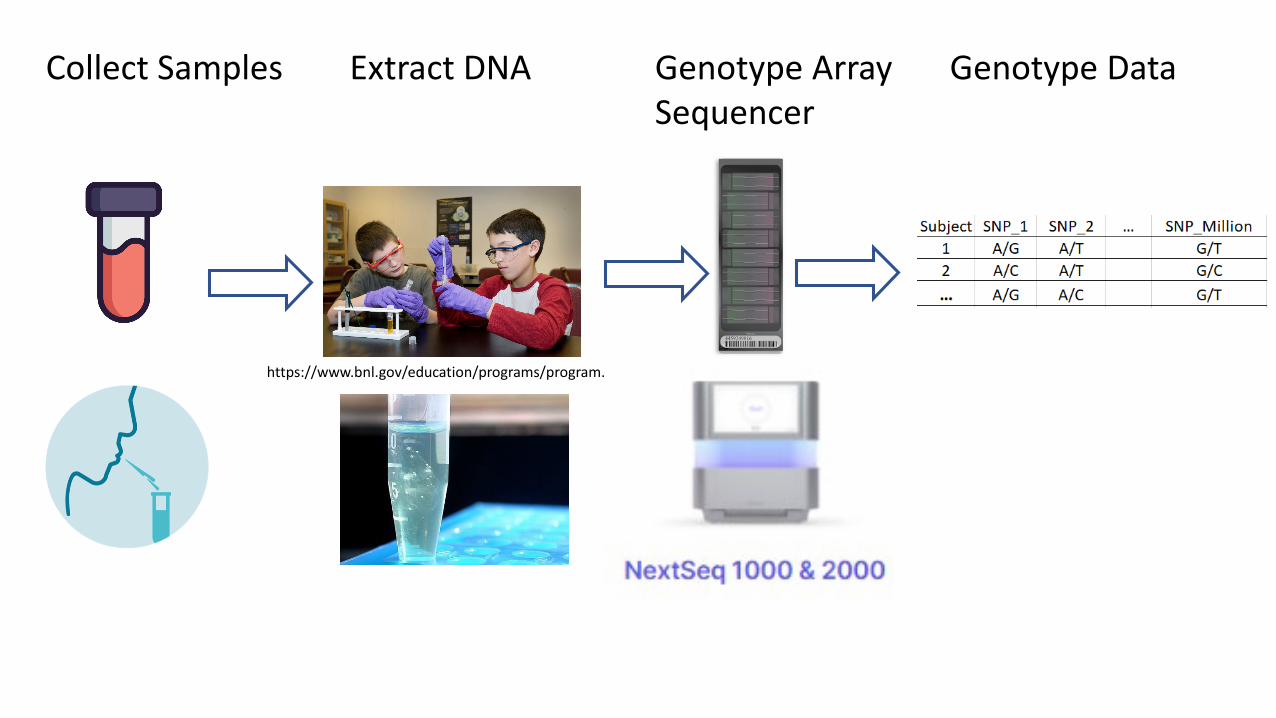
Collect Samples Extract DNA
https://www.bnl.gov/education/programs/program.php?q=169
Genotype ArraySequencer
Genotype Data

https://www.illumina.com/science/technology/microarray.html

Genotype Array

Linkage Disequilibrium (LD)non-random association of alleles at different loci in a given population
See NCI Dictionary of genetic terms
Highly correlated regionLD block
Weakly correlated region
https://www.cancer.gov/publications/dictionaries/genetics-dictionary

Tag SNPs & Linkage Disequilibrium
Haplotype: Set of alleles inherited together from a single parent.
SNPs: where genetic variants occur
Tag SNPs: “tag” particular haplotypes in regions with high LD to represent the region
Save costs by genotyping only tag SNPsA T CUniquely identify haplotype-1

Consequence of Tag SNPs
• Tag SNPs are measures of variation for a region• Size of region depends on LD• LD differs across different ancestries
• LD often weaker among African ancestries• Tag SNPs for Europeans may not represent African ancestries

Genotyping completedNext - QC: Selection of SNPs, Samples for Analyses• Remove SNPs poorly genotyped• Remove samples that perform poorly (e.g., poor quality DNA)• If sample mainly European, remove small number non-European
samples (limited power for small number of non-European)• Some studies ignore X-chromosome in analyses
• Moral of story: Details of GWAS analyses have downstream impact on creation of polygenic risk scores

Next: Genotype Imputation – Filling in Unmeasured SNPs
Genotype coded• dose of minor (alt) allele (0, 1, 2 copies)
A/A A/G G/G0 1 2
Imputed SNPs:From ~1M SNPs to ~20M SNPs

Genotype Imputation – Fill in Unmeasured SNPs
• Boost power of GWAS• Capture poorly measured SNPs
• Fine-mapping:• high-resolution of genomic region
• Combine different studies• Different studies use different SNP arrays• Improve estimates of effects of SNPs
Measured SNPsNo Overlap
Imputed SNPs

Michigan Imputation ServerTOPMed Imputation Server
Courtesy of Center of Inherited Disease Research, NIH

Imputation accuracy
• Reference panels (number subjects, ancestral diversity)• Sample size• Genotyping chip• Allele frequency
• Summary• For common variants (minor allele frequency > 1%), TOPMed slightly better• TOPMed better for African ancestry samples• Rare variants (< .1%) poorly imputed by HRC and TOPMed

Discovery & Prediction Depend on Links from SNPs to Trait
SNP Markers1 2 3 D
Measured/Imputed SNP
Disease-risk allele, unmeasured
Trait
4

GWAS Regression Analyses
• Test 1 SNP at a time: dose of risk allele (0, 1, 2 copies)• Account for covariates
• age, sex, known risk factors• population stratification
• Regression Model• Linear regression: quantitative trait (e.g., blood pressure)• Logistic regression: case/control• Cox model: cohort design, age of disease onset
Trait = ( Covariates ) + ( Dose-of-risk-allele)α β× ×

Population Stratification• Systematic difference in allele frequencies among subpopulations• Caused by physical separation, random changes over time
• Bias if cases originate in different clusters than controls
• Use all genetic data to cluster and adjust forcluster membership
• Principal components used as covariatesReduce the number of SNPs to ~10 PCs that best ‘explain’variation of SNPs

View GWAS Results
P-value < 5x10⁻⁸
• Control for testing millions of SNPs• Most robust results
Manhattan Plot
Olama et al, Prostate Cancer (doi:10.1038/ng.3094)
• Mix of SNPs: many no effect on traitsome small effects
• Additional SNPs with weaker effects might be useful for PRS to predict trait
-log-10(p-value)
Novel discovery

GWAS Catalog https://www.ebi.ac.uk/gwas/

Polygenic Risk Scores(Genomic Risk Scores)

Key Steps to Develop PRS
•Develop• Determine which SNPs• Estimate weights
•Validate• Ideal: evaluate predictions on independent data• Next best: cross-validation
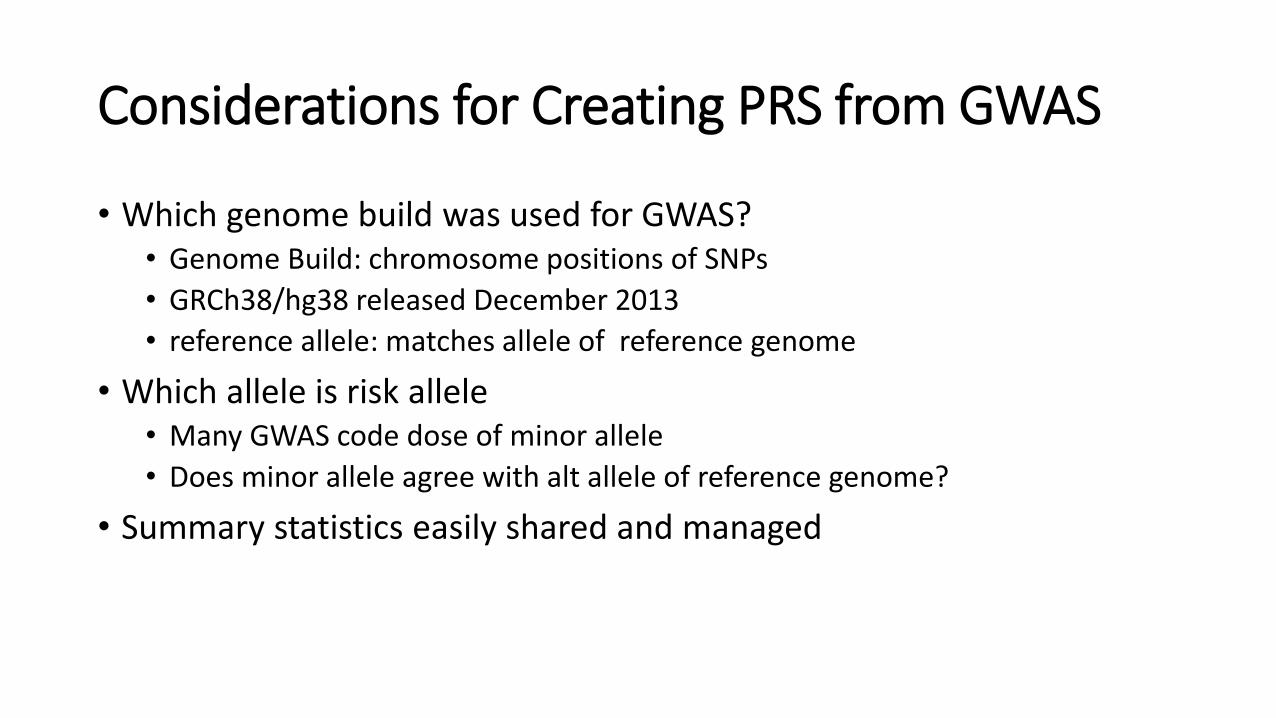
Considerations for Creating PRS from GWAS
• Which genome build was used for GWAS?• Genome Build: chromosome positions of SNPs• GRCh38/hg38 released December 2013• reference allele: matches allele of reference genome
• Which allele is risk allele• Many GWAS code dose of minor allele• Does minor allele agree with alt allele of reference genome?
• Summary statistics easily shared and managed

risk
risk allele freq beta se z p-value
reference
My Summary Data for Each SNP Choose Reference Ancestry for LD
many more

Methods to Compute PRS
• Clumping & Thresholding• Clumping
• Use LD to group SNPs that are highly correlated• Choose 1 SNP to represent group
• Thresholding• Evaluate different p-value thresholds for best prediction
• Bayes methods

.027
12,148 SNPs, explain 2.1% of variation in Major Depression Disorder
Clumping & Thresholding
Model Fit to Depression
poor
best
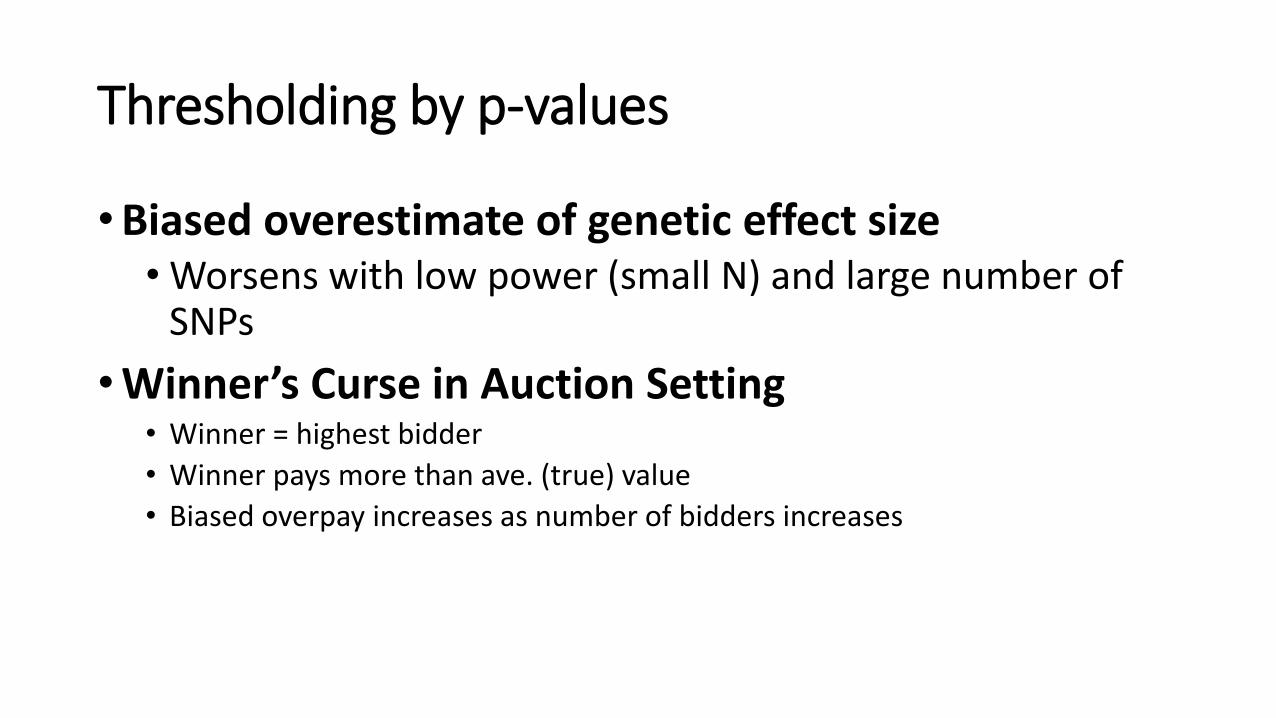
Thresholding by p-values
• Biased overestimate of genetic effect size• Worsens with low power (small N) and large number of
SNPs• Winner’s Curse in Auction Setting
• Winner = highest bidder• Winner pays more than ave. (true) value• Biased overpay increases as number of bidders increases
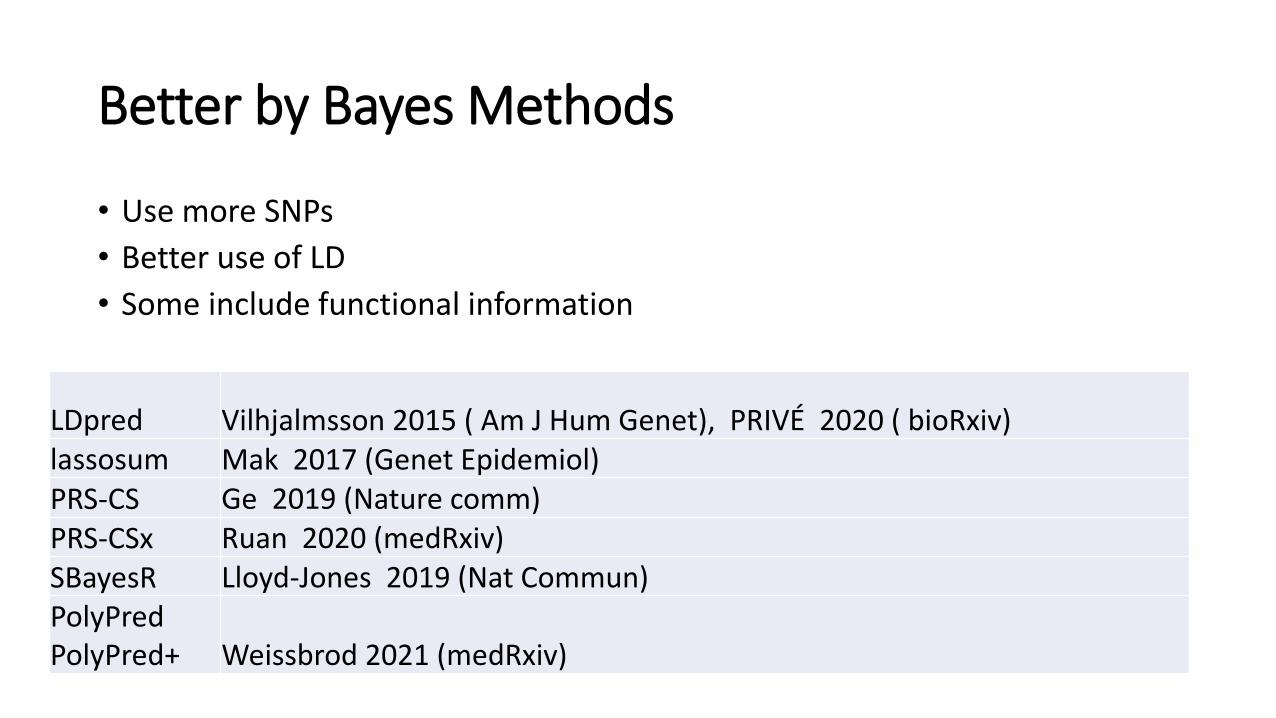
Better by Bayes Methods
• Use more SNPs• Better use of LD• Some include functional information
LDpred Vilhjalmsson 2015 ( Am J Hum Genet), PRIVÉ 2020 ( bioRxiv)lassosum Mak 2017 (Genet Epidemiol)PRS-CS Ge 2019 (Nature comm)PRS-CSx Ruan 2020 (medRxiv)SBayesR Lloyd-Jones 2019 (Nat Commun)PolyPredPolyPred+ Weissbrod 2021 (medRxiv)

Clump & Threshold
Bayes
No effect
Small effectMedium effect
Idea of Bayes MethodsModel probability SNP has
No effect, small, medium Result: β shrunken towards 0

Generally Modest Gains by Bayes MethodsROC-AUC
Clumping & Thresholding LDpred
Type-1 Diabetes 0.84 0.87Type-2 Diabetes 0.62 0.63Coronary Artery Dis. 0.61 0.60
Chron Dis. 0.63 0.67Rheumatoid Arth. 0.70 0.72Bipolar Dis. 0.67 0.67Hypertension 0.62 0.61
Vilhjalmsson AJHG 2015

PRS: simple vs. complex approaches
•Linear models• Sum of SNP effects• Ignore interactions
•Machine learning• Capture non-linear effects, interactions
•To date• little evidence of interactions in GWAS

AI & Machine Learning: minimal gainsSimple Weighted Sum Works Well
Badre et al. (2021). Journal of Human Genetics
Traditional linear models workas well as deep learning (CNN)Bellot, Genetics 2018

PGS Catalogue https://www.pgscatalog.org/

Limits of Portable PRS across Different Ancestries• Most GWAS in European ancestries (~79%)
• Limited African, Asian, Hispanic ancestries• Prediction accuracy reduced by 2-5 fold in East
Asian and African American• Differences in:
• population-specific causal variants• population allele frequencies • linkage disequilibrium tagging of causal variants• possibly gene-gene or gene-environment interactions
Martin 2017 Nature Genetics doi: 10.1038/s41588-019-0379-x

Measures of Performance of PRS
• Receiver-Operating Characteristic (ROC) Curve• Risk in extreme quantiles• Absolute risk and calibration
• Best performance depends on• Heritability• SNP Effect Size• Sample Size

Receiver-Operating Characteristic (ROC) Curve
• Sensitivity• probability diseased has positive test
• Specificity• probability non-diseased has negative test

ThompsonJAMA 2005;294:66-70
Receiver Operating Characteristic Curve for PSA
PSA Value
AUC: Probability that risk score is higher for diseased than non-diseased• 0.5 random (no discrimination)• 0.77 cholesterol prediction of CHD• 0.80 for population screening• 0.98 for pre-symptomatic diagnosis

Upper Limit of PRS: Heritability of Trait
• Heritability: Percent of Trait Variance due to Genes• Ranges 0 - 100%• Change environment can change heritability• Tag-SNPs measure only a portion of genes
• Improved measure of genes -> increased measure of heritability
Trait = Genes + Environment
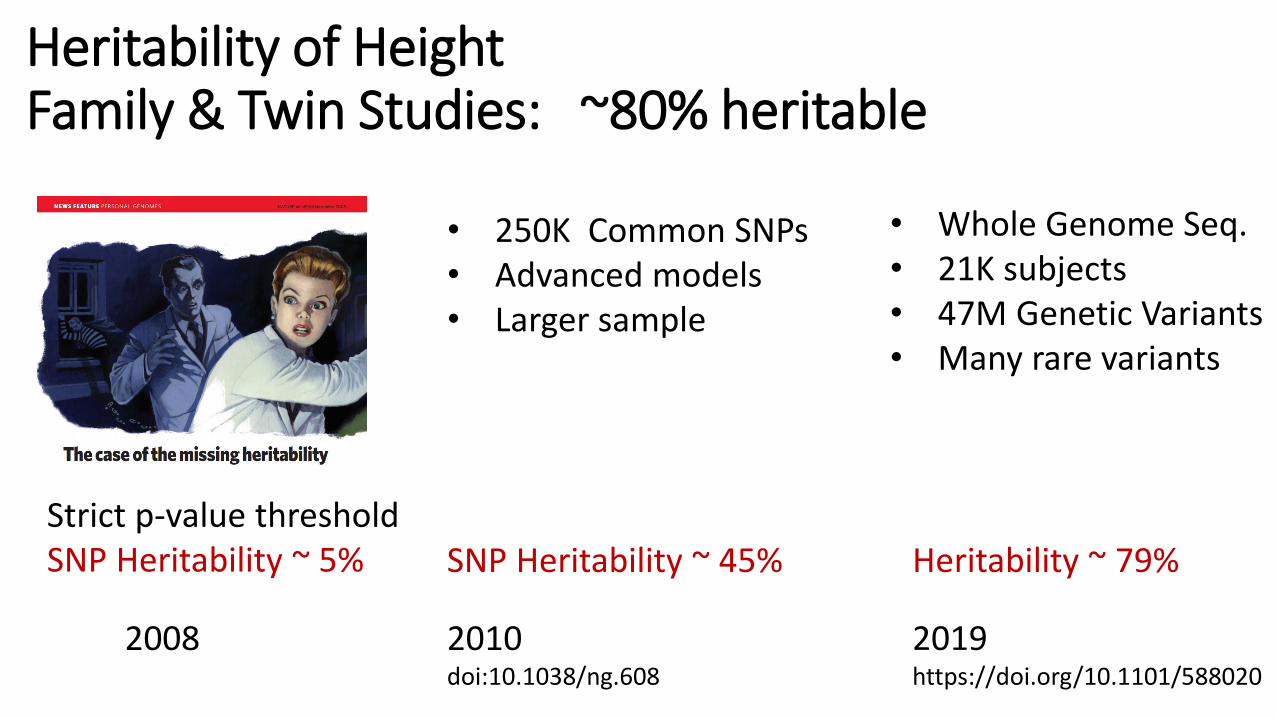
Heritability of HeightFamily & Twin Studies: ~80% heritable
Strict p-value thresholdSNP Heritability ~ 5%
2008
• 250K Common SNPs• Advanced models• Larger sample
2010doi:10.1038/ng.608
SNP Heritability ~ 45%
2019https://doi.org/10.1101/588020
• Whole Genome Seq.• 21K subjects• 47M Genetic Variants• Many rare variants
Heritability ~ 79%

Max AUC Depends on Heritability of Trait(Wray, Plos Genetics 2010)
Family-based heritabilityWang, Nat. Genet 2017
hypertension
depression
dermatitis

AUC
Sample size (thousands)
Large Sample Size NeededComplex Traits: Many SNPs of Small Effects
Zhang, Nature Commun. 2020
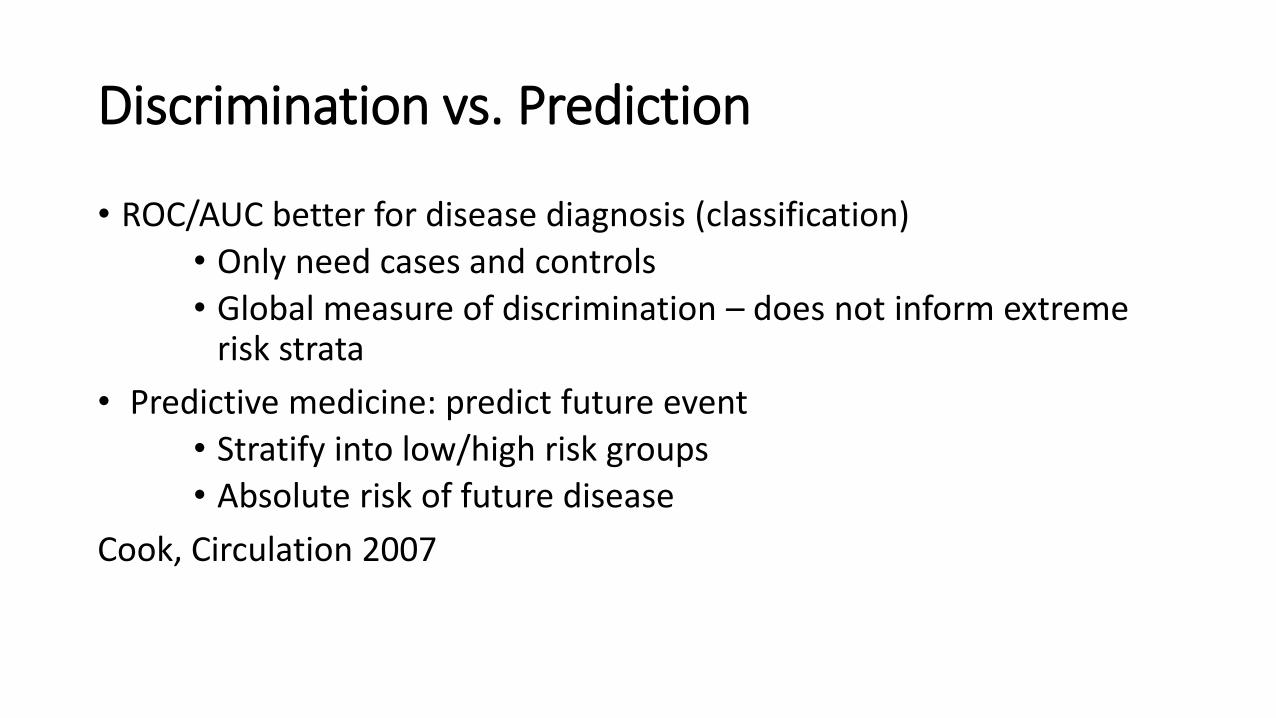
Discrimination vs. Prediction
• ROC/AUC better for disease diagnosis (classification)• Only need cases and controls• Global measure of discrimination – does not inform extreme
risk strata• Predictive medicine: predict future event
• Stratify into low/high risk groups• Absolute risk of future disease
Cook, Circulation 2007

Conti Nat Genet 2021
Stratify into Risk Groups: Prostate Cancer
Lowest 10%: 3-4 times LESSlikely to have prostatecancer than ave.
Highest 10%: 4-5 times MORElikely to have prostatecancer than ave.

Absolute Risk
• Future risk (next 5yr, 10yr, lifetime) given• PRS• Current age• Sex• Race• Other Risk Factors
• Determine by:• Population disease incidence rates (age/sex/ancestry specific)
• Cancer Surveillance, Epidemiology, and End Results (SEER)• Odds ratios for risk factors + PRS
iCare R package: Choudhury Plos One 2020

Calibration: the Achilles heel of predictive analytics Van Calster et al. BMC Medicine (2019) 17:230
• Calibration: accuracy of risk estimates• Agreement of estimated and observed number of events
• If poorly calibrated• False expectations of patients and healthcare professionals
• How to calibrate• Cohort studies: large cohort followed over time• Biobanks good source: UK Biobank, US All of Us

Reasons for Poor Calibration
• Algorithm developed on data that differs with target population
• Referral vs. regional medical centers• Changes over time: diagnostics, types of patients
• Statistical overfitting• Flexible model with too many parameters (e.g., deep learning
neural nets)• Capture random errors in data

Clinical Use of PRS
• Absolute risk• Specific to current age & future risk• Traditional risk factors + PRS
• Stratify into high risk: targeted screening• Behavior intervention• Preventive medication

eMERGEElectronic Medical Records and Genomics (eMERGE) NetworkNHGRI-organized and funded consortium
Develop PRS for 15 common diseases
Integrate PRS in the EHR
Assess outcomes following return of results

• Women at increased risk breast cancer are offered endocrine therapy to reduce risk
• Standard Models:• Gail Model (BCRAT) 5 yr ≥ 3%• International Breast Cancer Intervention Study (IBIS) 10 yr ≥ 5%
• Does standard model + PRS influence intent to take meds?

PRS: Reclassify Beyond Standard Risk FactorsSimulated: 55yr women, IBIS 10 yr risk = 0.05
Mavaddat AJHG 2019: 313 SNPs for PRS for breast cancer
Higher riskLower risk

% Change in Risk due to PRS(N=151)
More likely Less likely
Intent to take endocrine therapy

Considerations for Risk Predictions
• Improved reporting standards for PRS (Wand, Nature 2021)
• Description of construction & validation of PRS• Account for non-genetic risk factors• Ancestry limitations
• Benefits vs risks of predictions• Modifiable behaviors for high-risk strata?• Preventive medications?• Management of anxiety?

Summary Take-away Points
• PRS: weighted sum of SNPs• PRS active area of development
• New statistical methods, include gene function, different diseases/traits• Clinical Utility
• Risk stratification• Absolute risk prediction
• Future Needs:• More diverse ancestries, large samples• Cohort studies for calibration• Improved reporting standards (Wand, Nature 2021)