Embed Size (px)
Citation preview
iI
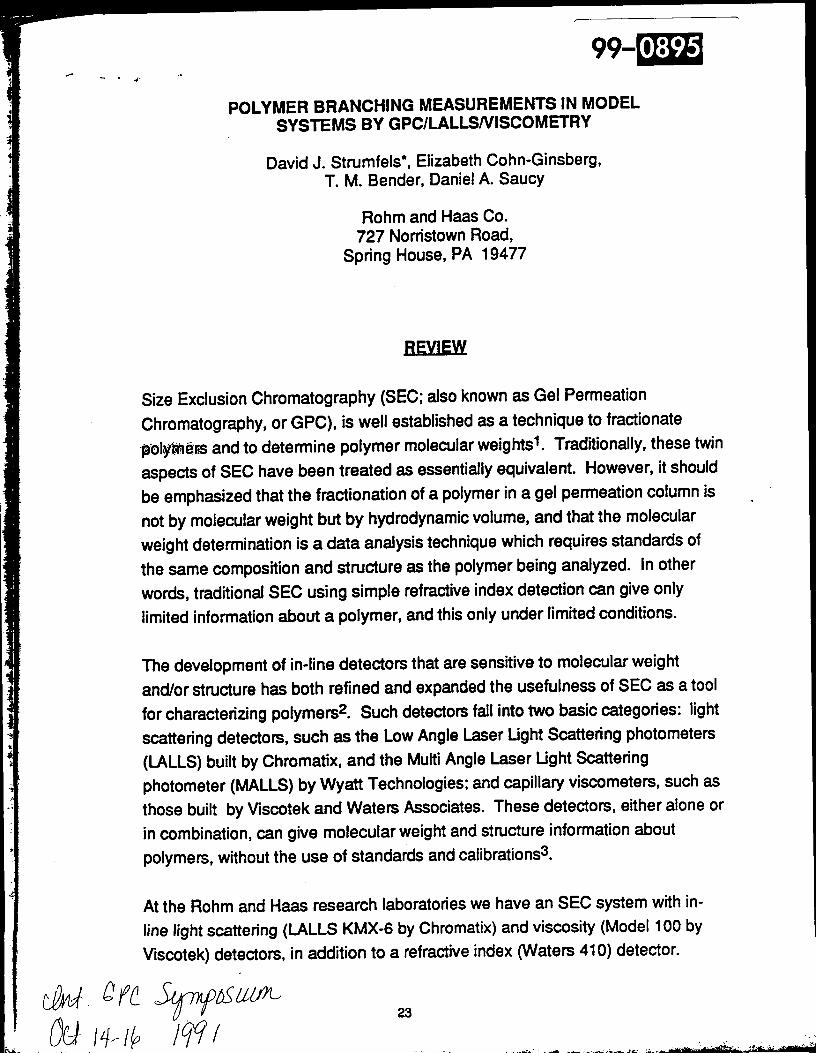
POLYMER BRANCHING MEASUREMENTS IN MODELSYSTEMS BY GPC/LALLSNISCOMETRY
David J. Strumfels*,ElizabethCohn-Ginsberg,T. M. Bender,DanielA. Saucy
Rohm andHaas Co.727 NorristownRoad,
Spring House, PA 19477
REVIEW
Size ExclusionChromatography(SEC; alsoknown as Gel Permeation
Chromatography,or GPC), is well establishedas a techniqueto fractionate
.pol¥i_e:_sand to determine polymer molecularweights1. Traditionally,these twin
aspectsof SEC have been treated as essentiallyequivalent. However, it should
be emphasizedthat the fractionationof a polymerin a gel permeationcolumnis
notby molecularweightbut by hydrodynamicvolume,and that the molecular
weightdeterminationis a data analysistechniquewhich requiresstandardsof
the same compositionand structure as the polymerbeinganalyzed. In other
words,traditionalSEC usingsimple refractiveindexdetectioncan giveonly
limitedinformationabout a polymer,and thisonlyunder limitedconditions.
The developmentof in-linedetectors that are sensitiveto molecularweightand/orstructurehas both refinedand expandedthe usefulnessof SEC as a tool
for characterizingpolymers2. Such detectorsfall intotwo basiccategories: light
scatteringdetectors,such as the Low AngleLaser LightScatteringphotometers
(LALLS)builtby Chromatix,and the MultiAngleLaser Ught Scattering
photometer(MALLS) by Wyatt Technologies;andcapillaryviscometers,suchas
those built byViscotek and Waters Associates.These detectors, eitheraloneor
incombination,can give molecularweightandstructureinformationabout
polymers,withoutthe use of standardsandcalibrations3.
At the Rohm and Haas research laboratorieswe have an SEC system with in-
line lightscattering(LALLS KMX-6 by Chromatix)andviscosity(Model 100 by
Viscotek)detectors,in additionto a refractive index (Waters 410) detector.
i
In the initialdata analysis,molecularweightdistributionswere calculatedfrom
LALLSand refractive indexdata, and intrinsicviscositydistributionsfromviscometerand refractive indexdata. Bothsetsof calculationswere done in
accordwiththe manufacturers'literature.The volumeoffsetsbetweenthe
detectorswere measured from the peakpositionsof a monodispersedmolecular
weightpolystyrene(Polymer Laboratories,Mp 68000 daltons,Mw/Mn 1.04); thismeasurementassumed a constantflowrate.
In thisstudy, we also evaluated the precisionof standardSEC and the universal
calibrationtechnique6,7 for measuringmolecularweights. For the SEC and
universalcalibrationcalculationsa calibrationforthe columnsetwas required.
Undernormaloperations,a calibrationisgeneratedeitherby runninga setof
narrowmolecularweightdistribution(MWD)standards,or by runninga single
broadMWD standard whichencompassesthe molecularweightrange of
interest;a table of Iog(MW) (SEC) or Iog(MW*[11])(universalcalibration)versus
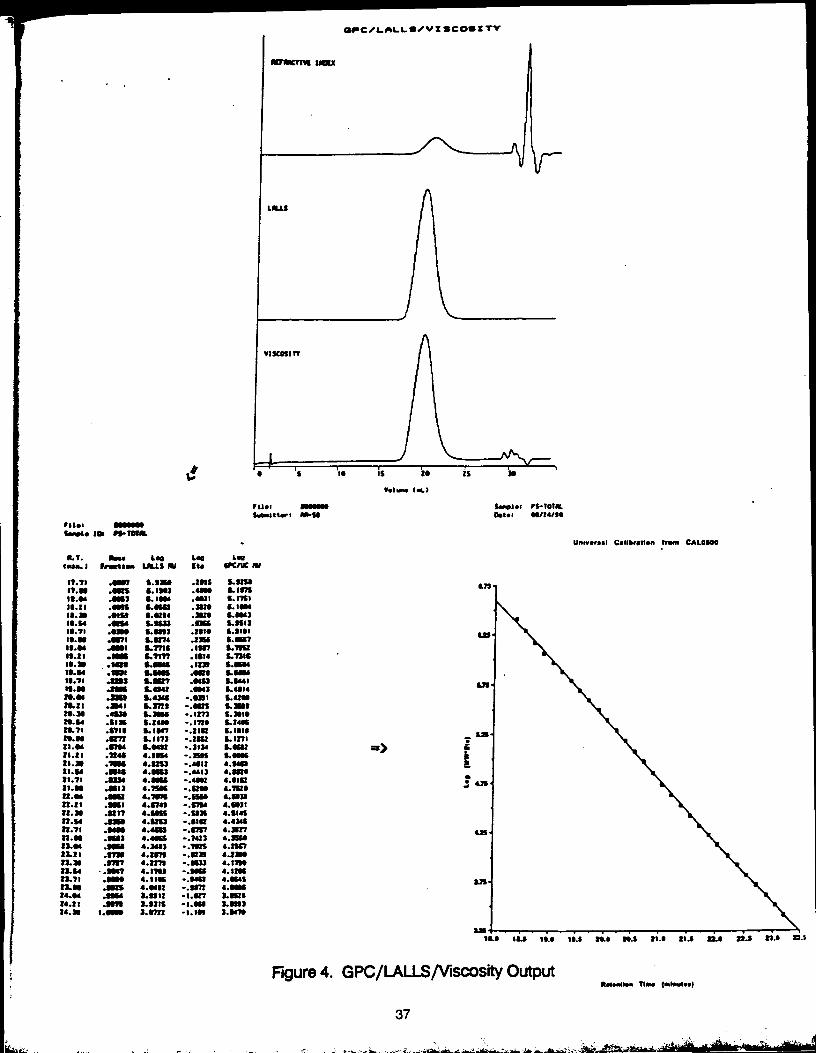
retentionvolume is then produced. Sincethisstudywas concernedonlywith
precision,the calibrationwas generatedby electronicallysummingall the raw
data intoa singledata file,and creatingd_ributions fromthiselectronic
compositeusingLALLS andviscosity(Figure4). Usingthiscalibration,
molecularweightdistributionsof the standardswere calculated,usingboththe
standard SEC and universalcalibrationmethods. Finally,the Mark-Houwink
parameters,o¢and K, were calculatedforeachstandard runby plottingIog([11])
versusIog(LALLSMW); fromthe logformof the Mark-Houwinkequation,¢zis
the slopeof the fit line, while K is the antilogof the intercept.
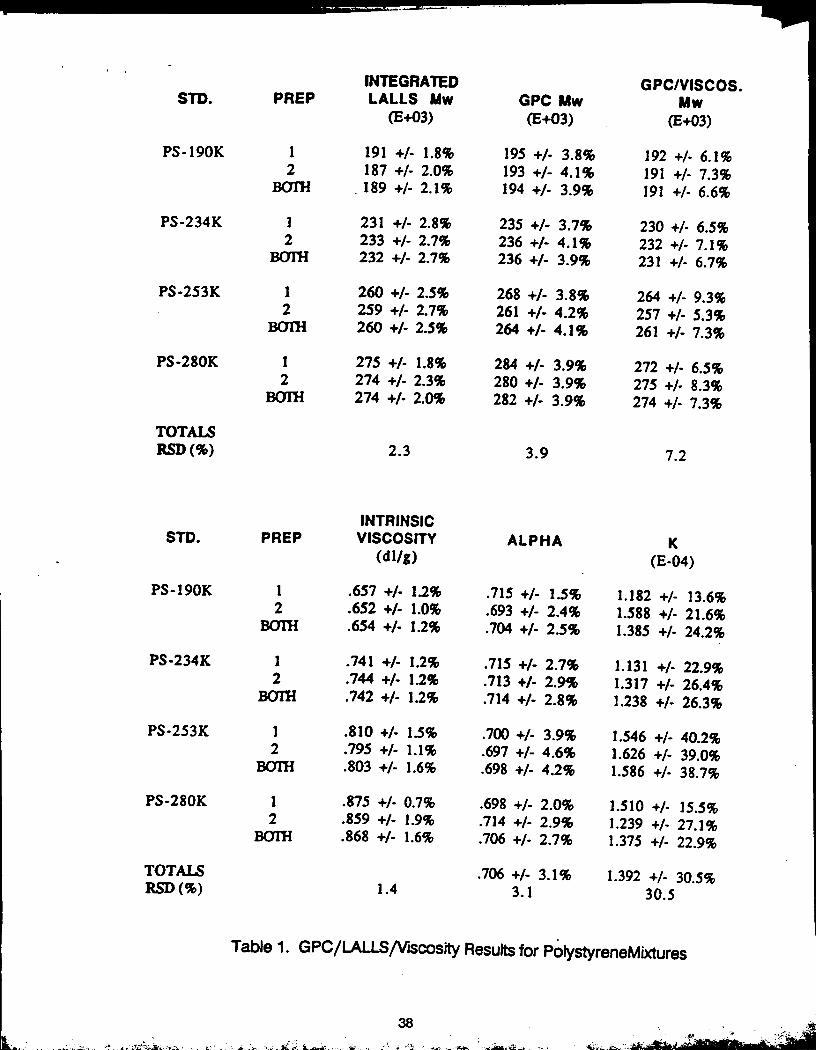
The precisionof the varioustechniquesis summarizedin Table 1. The errors
are percentrelativestandard deviation. There is a dramatic lossof precisionin
the weightaverage molecularweightdata inproceedingfrom a purely
instrumentaltechnique(LALLS)to a calibratedtechnique(SEC), and finally,to a
combinationof the two (SEC/viscos_ or universalcalibration). The poorer
precisionof the universalcalibrationmolecularweightswas notsurprising,as
thistechniquecombines the errorsof SEC withthose of viscometry. Error
analysisshowedthat SEC is the majorcontributorto the overall error inthe
universalcalibrationtechnique.
The viscositydata requiresome explanation. The errorin the measurementof K
24
measurements. This approachistime consuminghowever.
Our approachto the problem,therefore,was twostaged: first,we evaluated the
reproducibilityof the fundamentalmeasurementsof the system, usinga set of
linear polystyrenestandards;second, we preparedquantitativemixturesof a
linearanda star-shaped polystyrene,andcompared the molecularweightand
branchingdistributiondata from these mixtureswithdistributionstheoretically
calculatedusingthe data from the pure linearandbranchedpolystyrenes.
EXPERIMENTAL
I. Reproducibilityof MW and [_ measurements.
Molecularweight and intrinsicviscositydatawere gatheredon a set of four
American PolymerStandardspolystyrenestandardsof labeledweightaverage
molecularweights190000, 234000, 253000, and 280000 respectively. The
polydispersityof the standardsrangedfromtwo to three. Each standard was
preparedinduplicate. The followingsequenceof runswere then made sixtimes
overa period of eightdays:
01: PS-190000 Prep #102: PS-234000 Prep #103: PS-253000 Prep #104: PS-280000 Prep #105: PS-190000 Prep #206: PS-234000 Prep #207: PS-253000 Prep #208: PS-280000 Prep #209: PS-190000 Prep #110: PS-234000 Prep #111: PS-253000 Prep #112: PS-280000 Prep #113: PS-190000 Prep #214: PS-234000 Prep #215: PS-253000 Prep #216: PS-280000 Prep #2
Thus, a total of 96 runs were made, 24 per standard, and 12 per standard prep.
25
viscosity([11])versusmolecularweight (MW); it is describedby the equation
log [11]= log K + o¢• log MW (2)
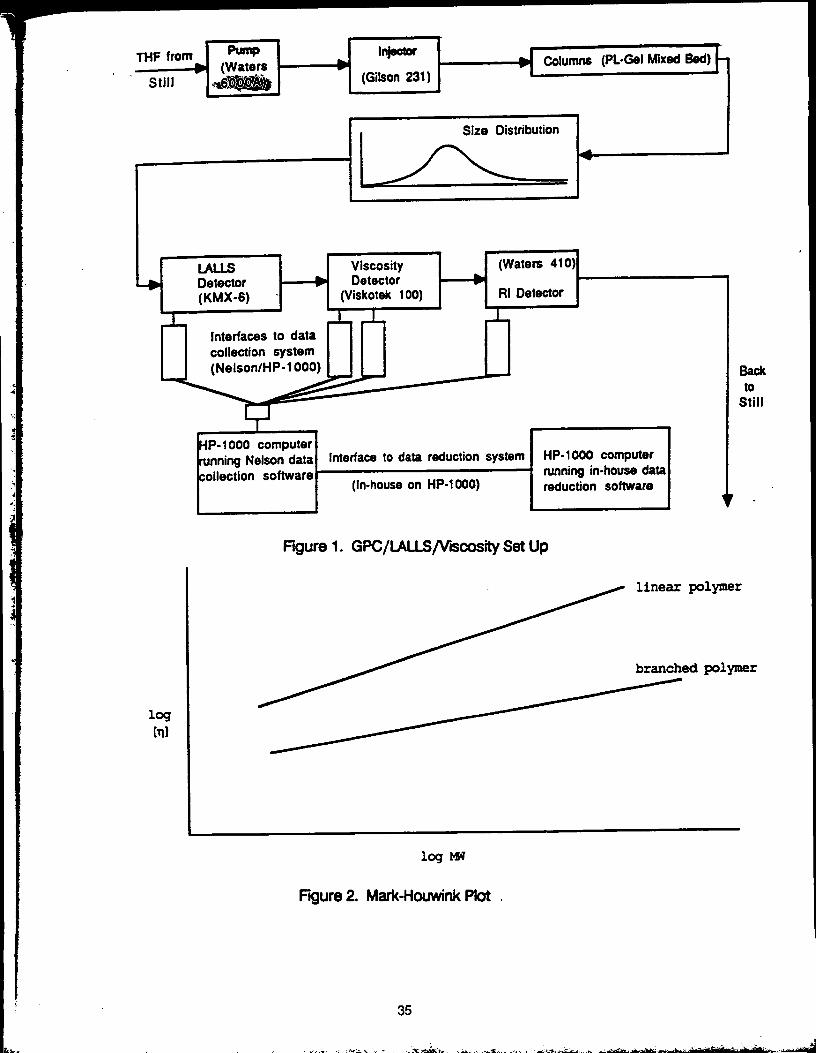
Since a branchedpolymerhas a lower[11]than its linearanalogue, differencesin
branchingwill show upin comparisonsof their Mark-Houwinkplots(Figure2).
Quantitativemeasurementsof branchingcan be obtainedfrom g factors5. A g
factoris the ratio of a branchedpolymermolecule'sunperturbedmeansquared
radiusof gyrationto that of a linearpolymerwiththe same compositionand
molecularweight.
g = <S2>o,B/<S2>o,L (3)
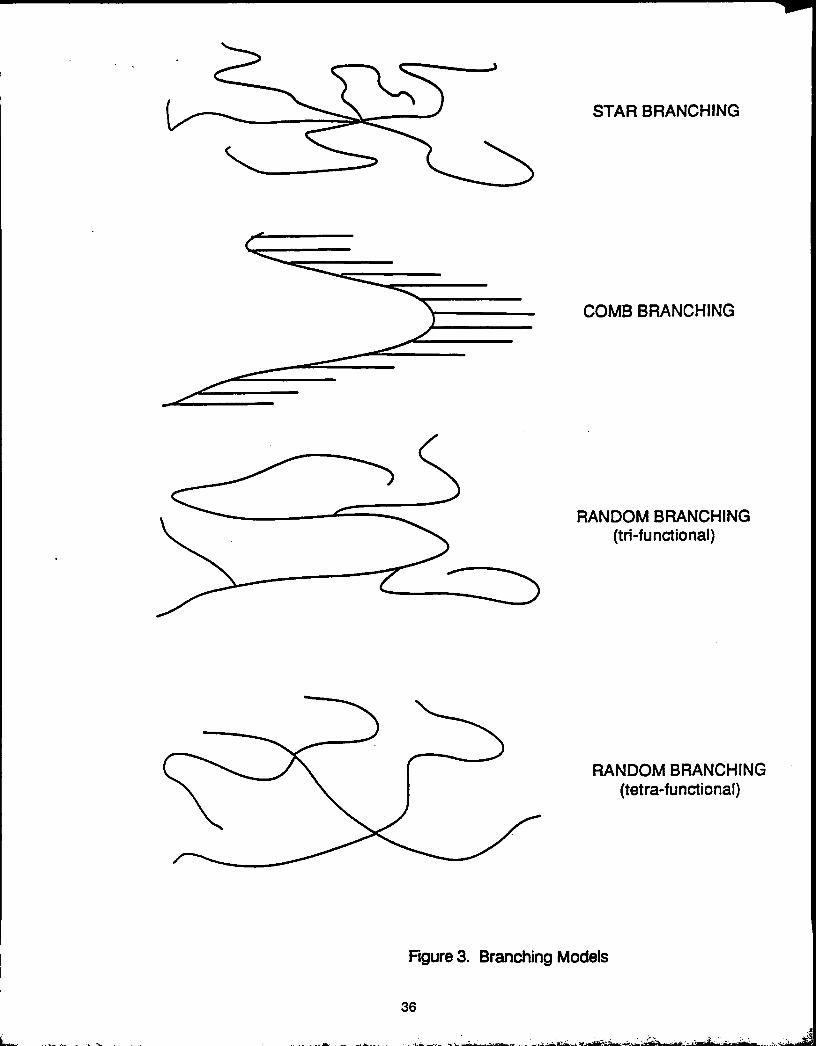
g factors can be usedto calculate eitherthe numberof branchpointsin the
polymerchain or the functionalityof the branchpoints. These calculationsuse
modelswhich relatethe g factorto the type of branching;e.g., random branchingwith eithertri or tetra-functionalbranchpoints,star, or comb (Figure 3).
Experimentally,g factors can be calculatedfrom molecularweight andviscositymeasurementsusingthe relation3
g = (HVB,Mw/HVL,MW)1Is = ([TI]B,MW/[TI]LMW)I/s (4)
where [TI]B,MWis the intrinsicviscosityof the branchedpolymer,and [TI]L,MWof
the linear speciesat the same molecularweight. _ dependsuponthe modelof
branchingbeing assumed,as well as upon experimentalfactors such as solvent
and temperature.
Usinga systemof the typedescribedabove, it shouldbe possibleto provide
suchquantitative information,notonlyfor the whole polymer,but also asa
functionof the molecularweightdistribution. In practice, the sensitivityof the
systemto experimentalvariablessuchas detectorreproducibility,inter-detector
delayvolumesand band broadeningneedsto be evaluated. A seriesof
monodispersedstandards,with known,uniformdegrees of branching,is
desirableinthe evaluationof the variablesof the system. Suchstandardsare
difficultto obtain however. Anotherapproachis to evaluatethe variables
individually,and use erroranalysisto determinethe precisionof branching
26
=.
Figure 1 showsthe configurationof the system. Note that all three detectorsareconnected inseries, withthe refractiveindexdetectorat the end. An alternative
configurationuses a flow splitbefore or after the lightscatteringdetector,sothat
the viscosityand refractiveindexdetectorsare in a parallelconfiguration;this is
to preventdisruptionsin the refractive indexbaseline,whichwouldresultfrom
incompletepurgingof the viscometersolventreservoirs.Accuratedetermination
of detectorvolume off'setsis complicatedby thisconfigurationhowever. We
have obtainedbetter resultswithoutsplittingthe flow. This may be due to our
use of continuouslydistilledTHF as the onlymobilephase for the system;the
exclusiveuse of such a well purifiedanddegassedsolventshouldavoidthe
problemof solvent mixingdue to incompletelypurged reservoirs.
Data collectionis via NelsonAnalyticalsoftwarerunningon a Hewlett-Packard
1000 seriescomputer,and data analysisis performedby in-housesoftwareon a
separate HP-IO00 computer. "Absolute"molecularweightsare calculatedfromthe LALLSoutput,and intrinsicviscosities([11])are calculatedfromthe
viscometeroutput. The softwarealsocalculatesmolecularweightsusingeither
straightSEC (log MW versusretentionvolume)or universalcalibration( log(MWo[TI])versusretentionvolume). Concentrationdata are determinedfrom the
refractive indexdetector.
The combinationof these detectorsonan SEC system ailows usto examine
branchingin polymers. A branchedpolymerhas a smaller hydrodynamicvolume
than a linearpolymerof the same compositionand molecularweight. Fromtherelationship4
HydrodynamicVolume(HV) = MW • [11] (1)
we see that,at equal molecularweight, the branchedspecieswill have a lower
intrinsicviscositythan the linear. Givenmolecularweightdata fromthe LALLS,
the viscometeroutput can be usedto measure this reductionin hydrodynamicvolume.
We can usethis relationshipbetweenHV and MW to lookat branchingin a
qualitativeway, by comparingthe Mark-Houwinkplotsof a branchedpolymer
and its linearanalogue. A Mark-Houwinkplot is a log-logplotof intrinsic
27
is quite large compared to the error in [_]. This is explained by notingthat, in
measuringe¢and K, one plotslog ([TI])versuslog (MW) overthe MW rangeof
interest. Log (K) is thusan extrapolatedvalue (at log (MW) = 0); smallerrorsin(_will therefore lead to largererrorsin log(K), and consequently,in K.
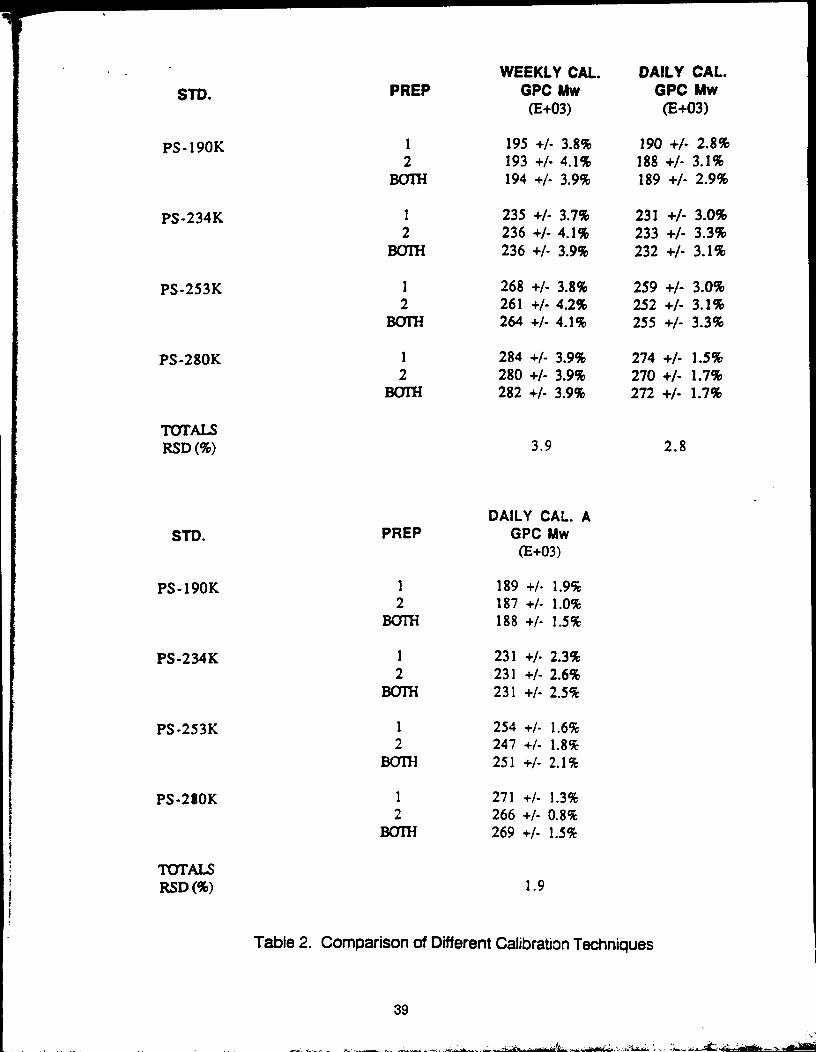
In orderto improvethe precisionof the SEC and henceuniversalcalibration
calculations,we exploredthe effect of morefrequentcalibrationsof the system.The resultsof these calculationsare summarizedin Table 2. "WeeklyCal." uses
the calibrationcurve for all the runs,as describedabove. "DailyCal." usesa
differentcalibrationfor each day;thiscalibrationis generatedfrom the first run of
the day usingthe LALLSand viscositydata.
The improvementin the precisionof the molecularweightcalculationsfrom
"Weekly Cal." to "DailyCal." demonstratesthat the clayto day variationis
significantcompared to the run to runvariationwithina singleday. It shouldbe
possibleto do even better however,as the runto runvariationinthe LALLSand
the viscositydetectorscontributesto the errorin the "DailyCal." calibrations.
The situationis also artificialfor a pure SEC systemwhich, lackingmolecular
weight sensitivedetectors,useseithera set of narrowstandardsof known
molecularweights,or a broad MWD standardwitha knowndistribution,to
generate the calibration.
In orderto evaluate the data as thoughthey came from a pure SEC system,i.e.,
to eliminatethe variabilityin the LALLSandviscositydata, the MW and [11]
distributionsof a runchosen for calibrationwere adjustedto matchthe "true"distributionof the standard; i.e., the distributionas determinedone time and
taken as a constant. This resultsin "Dally Cal. A" in whichthe precisionis
considerablyimprovedover the unadjustedcalibrations('Daily Cal.').
The precisionof g factor measurements,and hence branching,depends in parton the methodusedto calculate them. In our system,[_] values for the linear
polymerare nottaken directlyfrom the viscometeroutput, but are calculated
usingthe Mark-Houwinkrelationship;combining(2) and (3)
gMW= [[TI]B,Mw/(K*MW(X')]1/E (5)
28
q
" . This method is valid onlyinthe regionwhere K and o_are invariantwithrespect
to molecularweight; i.e., where the Mark-Houwinkplotis a straightline. 'Ifconstantvalues of c¢and K are used,this methodleaves as the mainsourceof
errorinthe g factorcalculationsthe variationof [TI]with respectto MW inthe
branchedpolymer. We evaluatedthis runto runvariationfor all fourstandards
by selectingthree molecularweightsintheir distributionsand interpolatingthe
[q]sat these molecularweightsfor each data file. The resultsare summarized inTable 3, along with the calculatedg factors(whichusess = 1.0). These results
suggestthat we can performbranchingmeasurementswith goodprecision.
II. Evaluationof Unear/Star-Shaped Polystyrene Mixtures.
Polymers with differentamountsof branchingwere simulatedby mixinga linear
polystyrene(NBS-706 from the NationalBureauof Standards)witha six-armed
star-shapedpolystyrene(Lot 71520 from Polysciences).Two mixtures,withthe
proportions2:1 (weight.weight)linear:starand 1:2 linear:star,were freeze-driedfrom benzene, and run alongwiththe pure linearand star polymers.
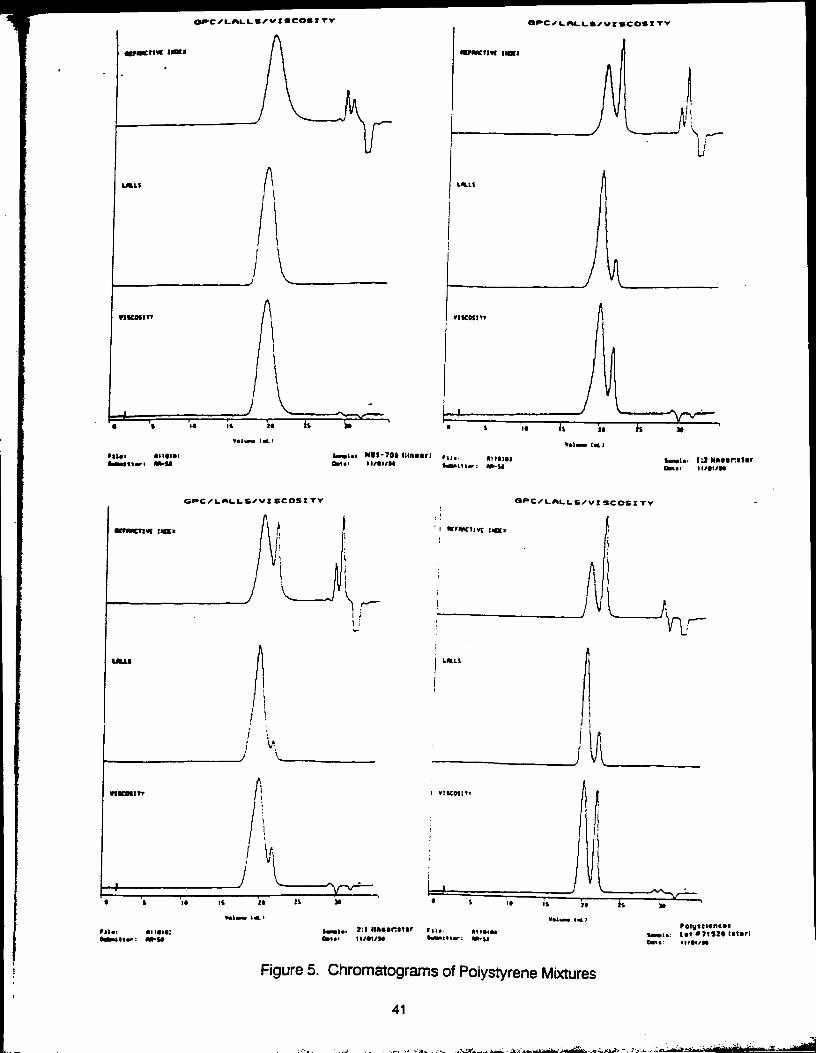
Figure5 containsthe refractive index, LALLS, and viscositychromatogramsfor
the four sample runs. Note that 71520 hastwo peaks;the peakelutingat 21-22ml isthe linear arm fromwhichthe star is constructed. Thislinear armalso
contaminatesthe two mixtures.
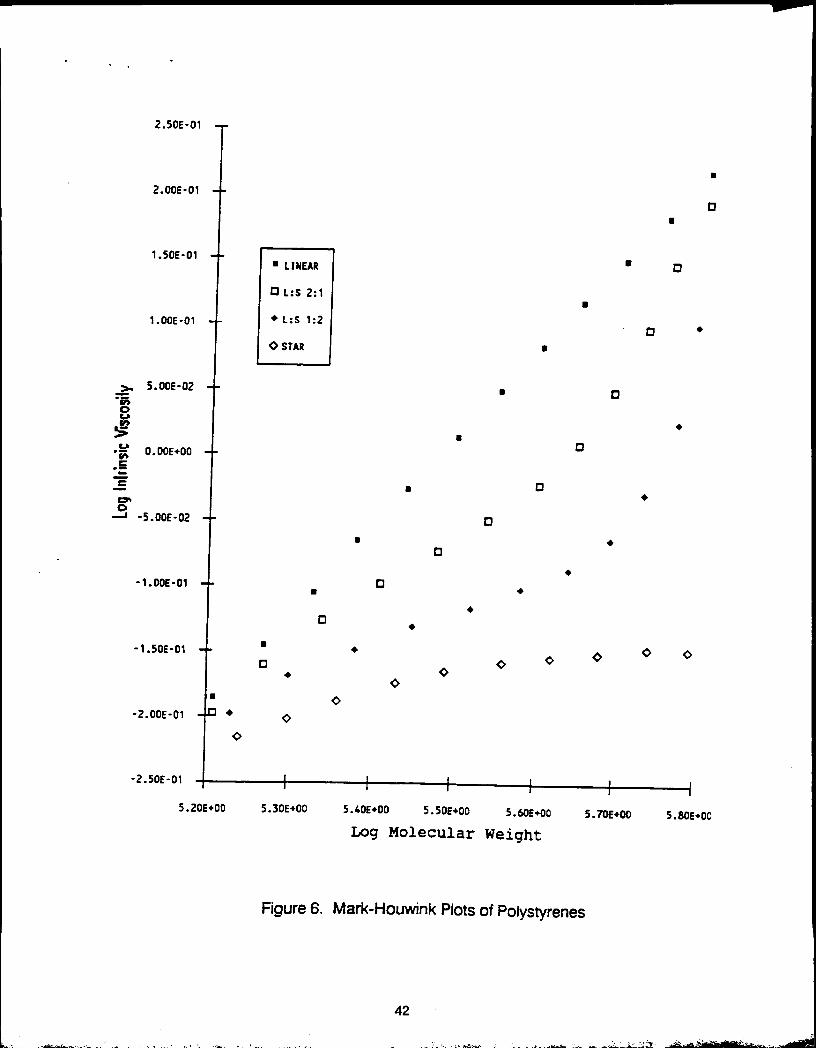
Figure6 containsthe Mark-Houwinkplots for the polystyrenes. Aswe are
interestedonly in the portionof the data wherethe linearandstar polystyrenes
co-elute,the plotsare limitedto the molecularweightrange from approximately1.75E+5 to 6.00E+5 daltons. In thisregion,the Mark-Houwinkplot forNBS-706
is sufficientlystraightto permitthe calculationof [q] usingKand oz.
The plotsdemonstrate the generalprinciplesoutlinedinthe reviewsection;
increasingthe amountof star polymerresultedin lower intrinsicviscositiesateach molecularweight inthe distributions.Anotherpointof interestis the flat
slopeof the plotfor the star polymer. The model for branchingin starpolymerspredictsthat the numberof armsis a functionof the [11]B/[1]]Lratio. If 71520 is a
pure hexafunctionalstar, its Mark-Houwinkplotshouldbe parallelto the plotfor1
linear polystyrene; i.e., they should bothhave the same values for (z. The flati
29
value of the slope is alsoinconflictwiththeoriesof dilutepolymersolutions,whichpredictsthat o¢cannothave a valueless than 0.5.
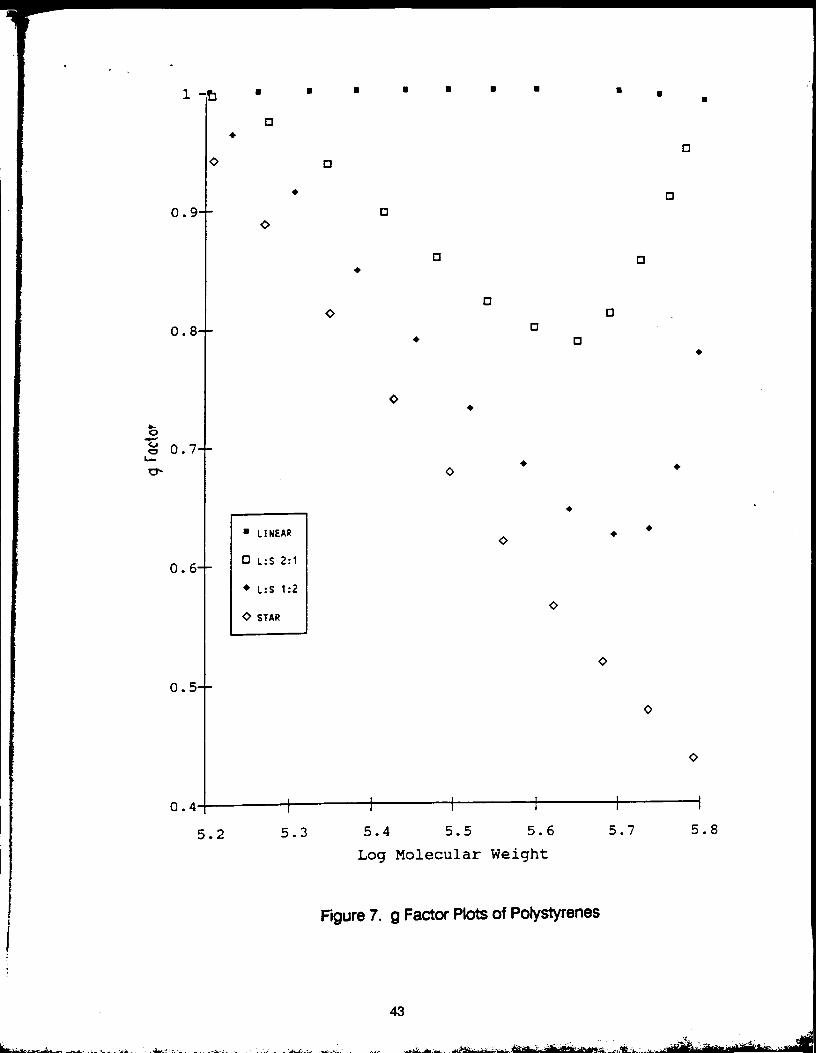
To allowa morepertinentevaluationof the system'ssensitivityto branching,g
factor and functionalityplotswere constructedusingthe molecularweightandI
intrinsic viscosity distributions.Functionalitiesfor the star polymerwerecalculatedusingthe relation3
gstar= 6*functionality/[(functionality+l).(functionality+2)] (6)
Forthe gstarfactorcalculations,s was determinedby forcingthe g derived
weightaverage functionalityof the starto agree withthe functionalitycalculated
by dividingthe weightaveragemolecularweightof the star bythe weightaverage molecularweightof the lineararm:
functionality= Mwstar/Mwarm (7)
This yieldedan s valueof 1.21, fora functionalityof 6.0. This methodof
determining_ is a reasonableapproximationonly if boththe starand lineararm
haverelativelynarrowdistributions. It can be tested by repeatingthe
determinationusingnumberaverages: the g derivednumberaverage
functionalityof the starshouldagree withthe functionalitycalculatedby dividingthe numberaverage molecularweight of the star by the arm. In the case of
71520, the differencebetweenthetwo functionalitycalculationswas
approximately5%.
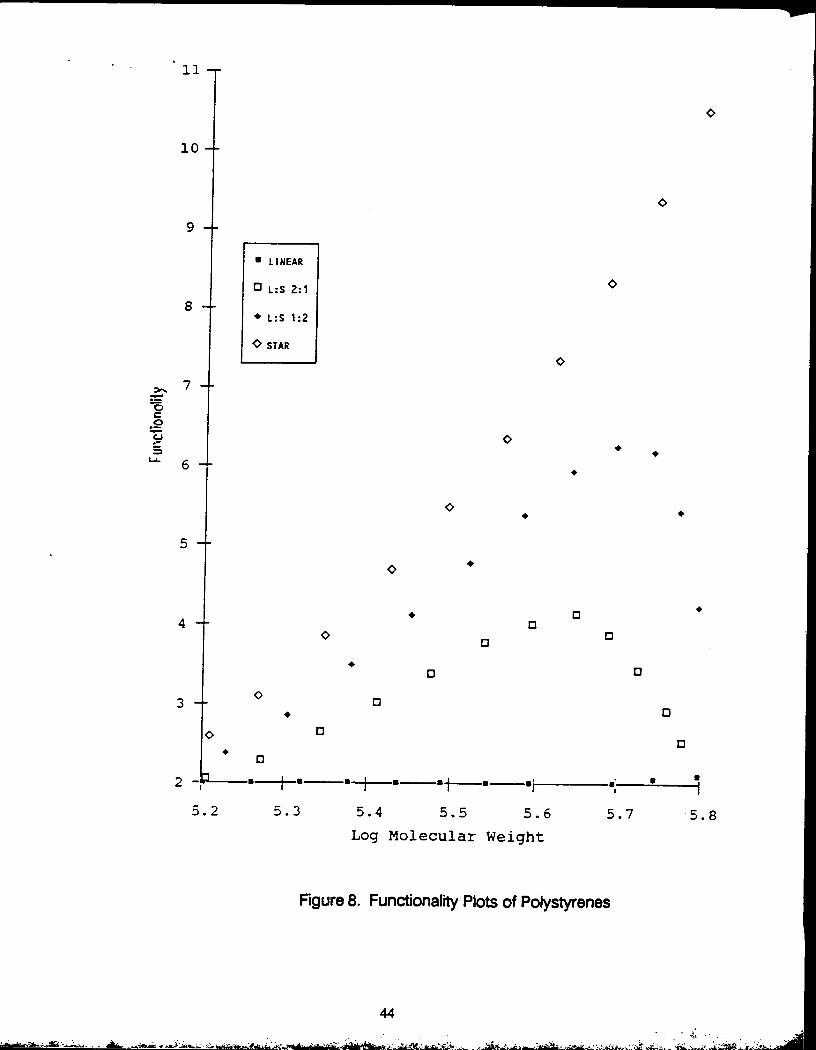
Rgures 7 and 8 containthe respectiveg factor and functionalityplotsfor the two
mixturesplusthe unmixedstar and linearpolymers. Some discussionis
requiredhere. There are several methodsfor synthesizingstar polymers.8The
traditionalmethodinvolvesanionicpolymerizationof the arm, followedby
terminationwitha nucleusof the desiredfunctionality. This methodof synthesiswilloften result inan averagefunctionalitylessthan that of the nucleus,due to
incompleteconversion;the importantpointhowever,is that functionalitygreater
than that of the nucleusis notpossible,unlessadditionalbranchingoccursinthearm or metal-halogenexchangesbetweenthe polymerchains andthe nuclei
resultin couplingsto formhighermolecularweight/functionalityspecies. In the
3o
case of anionically polymerizedpolystyrenehowever,the chemistrydoes notlead to longchainbranching,while the couplingreactionwouldlead to a different
distributionthan that observed. Therefore, if 71520 was preparedin this
manner, usinga hexafunctionalnucleuswith a highdegree of conversion,we
shouldnot expectfunctionalitiesgreaterthan six, or muchvariationin the
functionality. Yet Figure8 showsconsiderablevariationinfunctionalityacross
71520's molecularweight range (excludingthe linearportion,whichis around69K daltons), fromlessthan three arms/moleculeto almostten.
An alternativepreparationof star polymersalso hasas its firststage the anionicpolymerizationof monomerto the arm; instead of a nucleusof known
functionalityhowever,terminationis by additionof divinylbenzene(or anotherdifunctionalmonomer). The polymerizationof DVByieldsthe nucleiabout which
the star polymerforms. As the functionalityof these nucleiwillnotbe
monodispersed,the resultingstar will reflect thisdispersity,inboth its molecular
weight and functionalitydistributions.The variationinfunctionalityshown in
Figure 8 suggeststhat 71520 was, in fact, preparedby the lattermethod.
If 71520 was preparedin thismanner, itwouldexplainthe flatslopeof its Mark-
Houwink plot: as it is nota chemicallyand structurallyhomogeneousmaterial,neither cxnorK determinedinthis manner is meaningful.
There are also severalpossiblereasonswhythisvariationcould be an artifact of
the data. One possibilityis systemband broadening. Bandbroadening,as it
resultsin spreadingof the lightscatteringand viscosityenvelopes,reducesthe
slope of the Mark-Houwinkplot. This effect increasesas the dispersityof the
polymerdecreases;i.e., giventwo polymersof differentdispersities,equal band
broadeningwill reducethe slope of the broader polymerlessthan that of the
narrower. As the starpolymer in ourwork is narrowerthan the linear,thiswould
result in a smallerslopefor the star relativeto the linearpolymer. This inturnwould cause the [TI]B/[TI]Lratioto decrease with increasingmolecularweight,
thus raisingthe calculatedfunctionality.
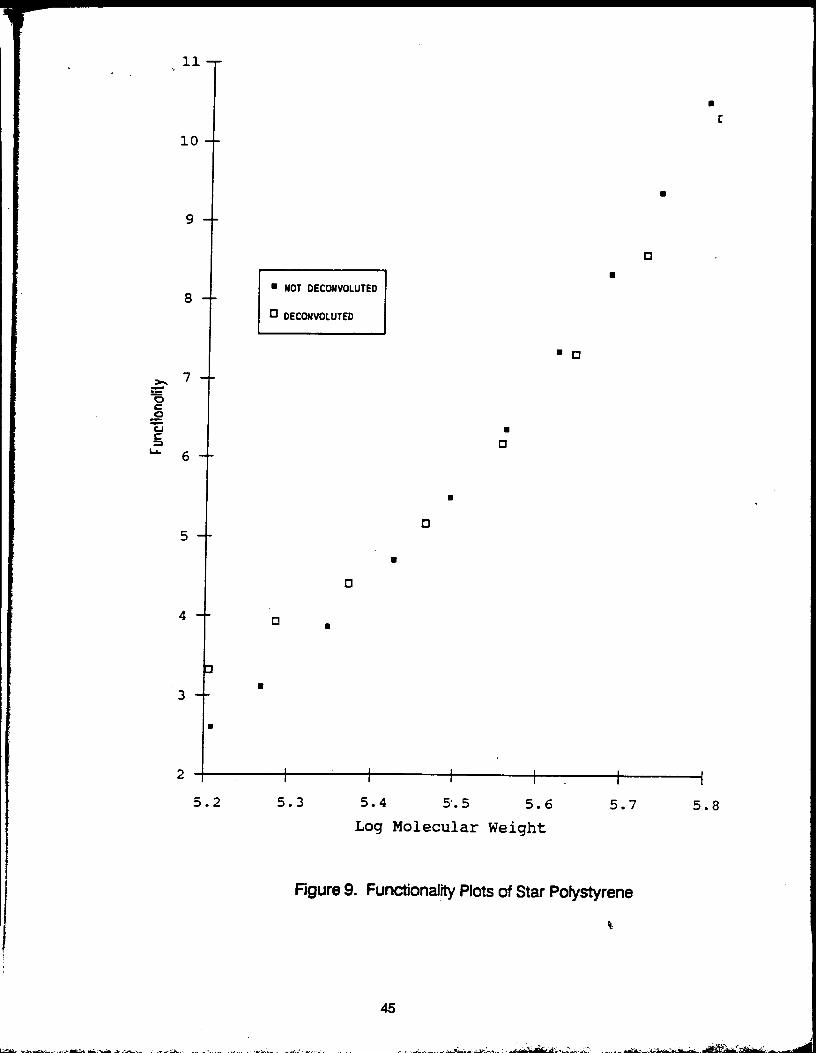
Our softwareallowscorrectionof the raw data for bandbroadening,using
mathematicaldeconvolution9.The model used for the chromatographicpeakshape is the exponentiallymodifiedGaussian
t
31
X ! (8)
in which a is the standarddeviationof the Gaussiancomponentof the peak, and
is the exponentialmodifierwhich determinesthe peak tailing. These
parametersare measuredby runninga monodispersedpolystyrenestandard
(thesame oneused to measure the detectoroffsets),and usingthe algorithmsin
the literature. The rawdata are correctedby transformingthem via a Fourier
transform intothe frequencydomain, dividingthem bythe transformof the band
broadeningenvelopedevelopedfromthe parameters,and back transformingthem intothe time domain:
(1) Raw Datatime--> (FFT) --> Raw Datafrequency
(2) a,_ --> Band BroadeningEnvelopetime-->(FFT) --> Envelopefrequency
(3) Raw Datalrequency/ Envelopelrequency--> DeconvolutedDatafrequency(4) DeconvolutedDatafrequency-> (reverse FFT) --> DeconvolutedDatatime
Once the data are corrected, the molecularweight/intrinsicviscosity/branchingcalculationsare repeated. Figure 9 plotsthe functionalitydistributionof the
deconvolutedstardata versusthe uncorrecteddistributiontaken from Figure8.
It appears that bandbroadeningalone does notfullyaccountforthe variation in
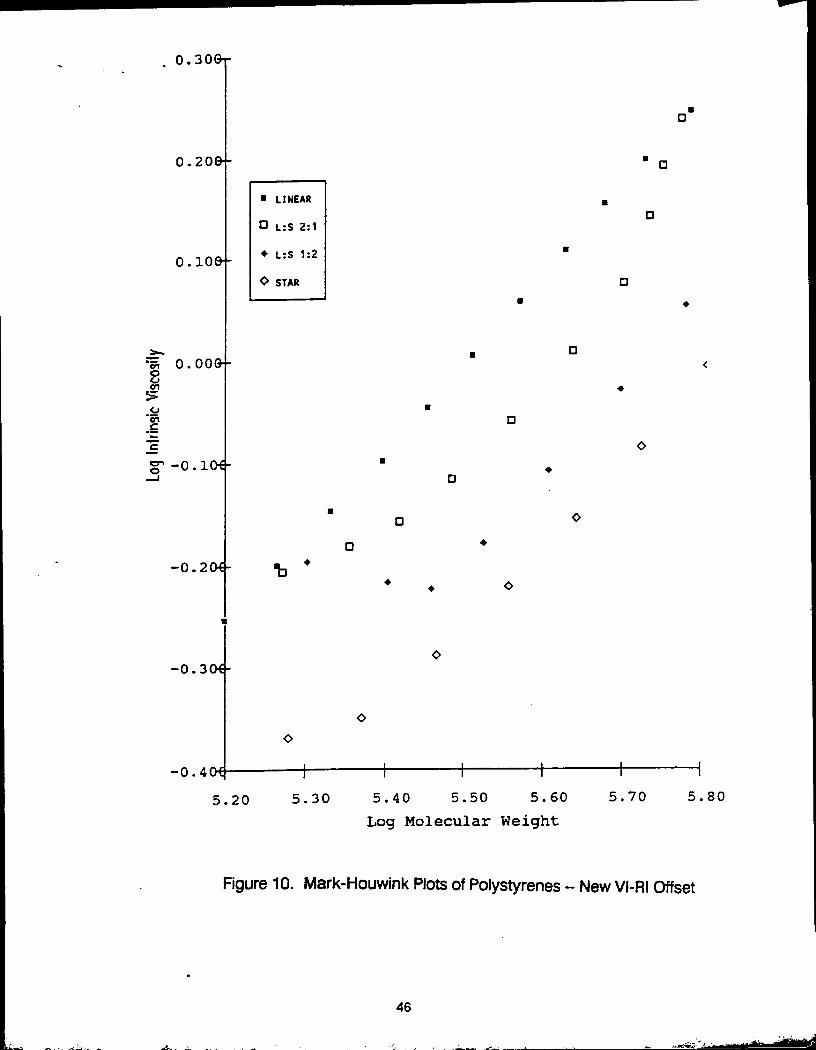
the stars functionality,althoughthere issome contribution.Therefore, weexploreda secondpossibilityfor this variation,whichis that the detectoroffsets
calculated from the monodispersedpolystyreneare erroneousor invalid. Like
band broadening,incorrectoffsetswill affectthe Mark-Houwinkplotslope,with
the magnitudeof the effect dependinguponthe dispersityof the polymer. Thus,by alteringthe viscosity - lightscatteringoffset,we canforce the linear and star
polymersto have the same o:;that is, to make their Mark-Houwinkplotsparallel.
Figure 10 is a plotof the deconvoluteddata, withthe newoffset. To test the
validityof thisoffset,we recalculated the Mark-Houwinkparameters for the linearpolystyrene. These calculationsyieldan ¢ of 0.862, anda K of 1.82E-5, neither
of which is inthe rangeof acceptable values for thispolymerin THFg.
Furthermore,as the parameters calculatedby usingthe originaloffsetsare
32
withinthe acceptable ranges, it appears likely that these offsetsare correct.
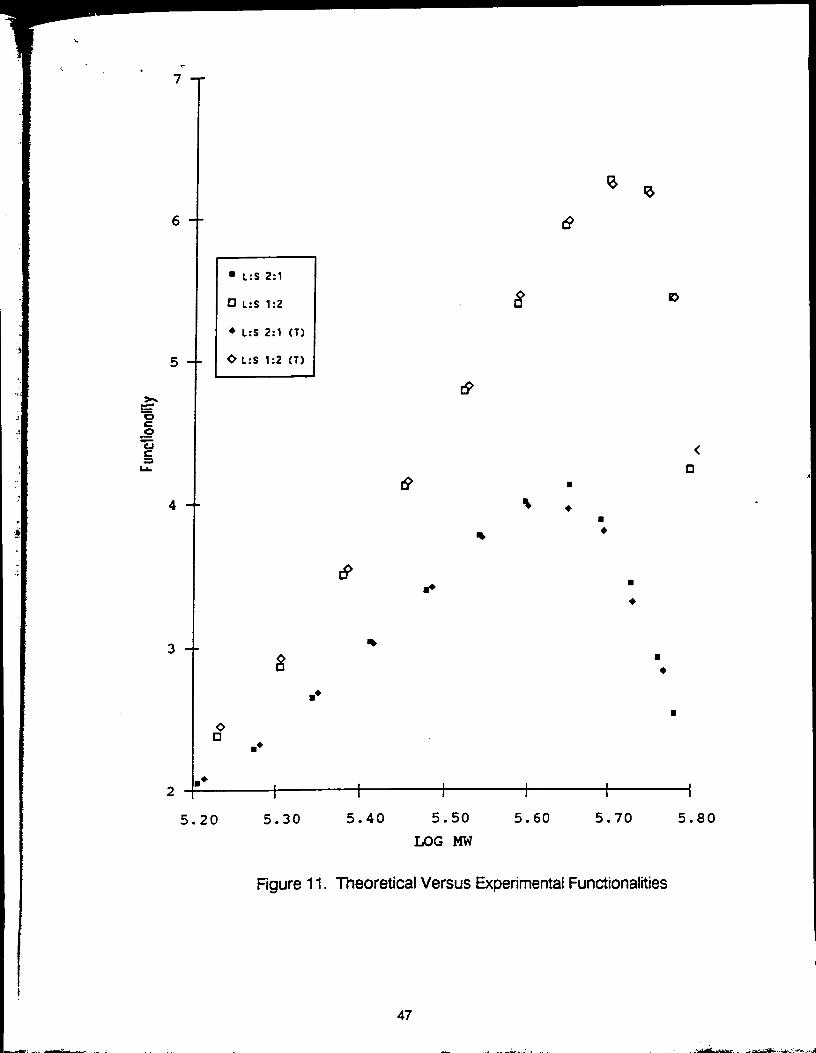
Figure11 compares the experimentally determined functionality plotsof the twomixtures with theoretical predictions. The theoretical predictions are constructed
by combining molecular weight and viscosity data, point by point, from the
unmixed star and linear polymer data files, in proportions that correspond to theunmixed polymers' respective concentrations in the actual mixtures. The
excellent agreement between the two plots demonstrates that the detectors are
not sensitive to interactions between the linear and star materials in solution; that
is, as is well known, weight average molecular weight and intrinsic viscosity aremass additive properties of polymers.
CONCLUSIONS
SEC combined with in-line light scattering and viscometry has been usedat
Rohm and Haas for several years as a method of detecting polymer branching;however, as standards with known amounts of branching have not been
available, the technique lacked quantitative evaluation. By analyzing known
mixtures of a linear and star polystyrene, we have shown that the technique is
capable of quantization. The results of the reproducibility study suggest thatgood precision should be obtainable.
33
REFERENCES
1. W.W. Yau, J. J. Kirkland, and D. D. Bly,Modern Size Exclusion Liquid
Chromatography, Wiley, New York, 1979.
2. H.G. BarthandW. W. Yau, International GPC Symposium
Proceedings, MilliporeCorporation,1989, 26.
3. Th. G. Scholte,Developments in Polymer Characterization - 4, J. V.
Dawkins,ed., AppliedScience,New York, 1983, 1.
4. T.G. Foxand P. J. Rory,J. Am. Chem. Soc., 1951, 73, 1904.
5. B.H. Zimmand W. H. Stockmayer,J. Chem. Phys., 1949, 17, 1301.
6. H. Benoit, Z. Grubisic,and R. Remmp, J. Poly. ScL, 1967, B5, 753.
7. A. Weissand E. Cohn-Ginsberg,Polymer Letters, 1969, Vol.7, 379.
8. B.J. Bauerand L J. Fetters,Rubber Chem. Techn., 1978, 51,406.
91 W.W. Yau,Analytical Chemistry, 1977, 49, No. 3, 395.
10. J. Brandrupand E. H. Immergut,Polymer Handbook, 3rd Ed., Wiley,New York, 1989.
34
i
1 ,-,(Waters
S,Jll _6._-__Ir . (G_o. 231.)]
LALLS Viscosity (Waters 410Detector Detector(KMX-6) (Viskotek100) RI Detector
Interfacesto datacollectionsystem
(Nelson/HP-1000) Backto
Still
nningNelsondataI Interfaceto da,=,reductionsystem HP-IO00 computer I
I runningin-housedataIIlection software (In-houseon HP-IO00) reductionsoftware
Rgure 1. GPC/LALLS/VLscosity Set Up
linear polymerpolymer
logM]
log MW
FK3ure 2. Mark-Houwink Plot .
(
35
STARBRANCHING
_._ ,,_ COMBBRANCHING
.,_.,v
RANDOMBRANCHING(tri-functional)
RANDOMBRANCHING(tetra-functional)
Figure3. BranchingModels
36
INTEGRATED GPCIVISCOS.
SI"D. PREP LALLS Mw GPC Mw Mw_+03) (E+03) (E+03)
PS-190K 1 191 +/- 1.8% 195 +/- 3.8% 192 +/- 6.1%2 187 +/- 2.0% 193 +/- 4.1% 191 +/- 7.3%
BOTH 189 +/- 2.1% 194 +/- 3.9% 191 +/- 6.6%
PS-234K 1 231 +/- 2.8% 235 +/- 3.7% 230 +/- 6.5%2 233 +/- 2.7% 236 +/- 4.1% 232 +/- 7.1%
BOTH 232 +/- 2.7% 236 4-/- 3.9% 231 +/- 6.7%
PS-253K 1 260 +/- 2.5% 268 +/- 3.8% 264 +/- 9.3%2 259 +/- 2.7% 261 +/- 4.2% 257 +/- 5.3%
BOTH 260 +/- 2.5% 264 +/- 4.1% 261 +/- 7.3%
PS-280K 1 275 +/- 1.8% 284 +/- 3.9% 272 +/- 6.5%2 274 4-/- 2.3% 280 +/- 3.9% 275 4-/- 8.3%
BOI'H 274 +/- 2.0% 282 +/- 3.9% 274 +/- 7.3%
TOTALSRSD (%) 2.3 3.9 7.2
INTRINSIC
STD. PREP VISCOSITY ALPHA K(dUg) (E-04)
PS-190K 1 .657 +/- 1.2% .715 +/- 1.5% 1.182 +/- 13.6%2 .652 +/- 1.0% .693 +/- 2.4% 1.588 +/- 21.6%
BOTH .654 +/- 1.2% .704 +/- 2.5% 1.385 4-/- 24.2%
PS-234K 1 .741 +/- 1.2% .715 +/- 2.7% 1.131 +/- 22.9%2 .744 +/- 1.2% .713 +/- 2.9% 1.317 +/- 26.4%
.742 +/- 1.2% .714 +/- 2.8% 1.238 +/- 26.3%
PS-253K 1 .810 +/- 1.5% .700 +/- 3.9% 1.546 +/- 40.2%2 .795 +/- 1.1% .697 +/- 4.6% 1.626 +/- 39.0%
BOTH .803 +/- 1.6% .698 +/- 4.2% 1.586 +/- 38.7%
PS-280K 1 .875 +/- 0.7% .698 +/- 2.0% 1.510 +/- 15.5%2 .859 +/- 1.9% .714 +/- 2.9% 1.239 +/- 27.1%
BGI'H .868 +/- 1.6% .706 +/- 2.7% 1.375 +/- 22.9%
TOTALS .706+/-3.1% 1.392+/-30.5%RSD (%) 1.4 3.I 30.5
Table 1. GPC/LALLS/Viscosity Resultsfor POlystyreneMixtures
WEEKLY CAL. DAILY CAL.STD. PREP GPC _ GPC Mw
(_+03) ¢E+03)
PS-190K 1 195 +/- 3.8% 190 +/- 2.8%2 193 +/- 4.1% 188 +/- 3.1%
BOTH 194 +/- 3.9% 189 +/- 2.9%
PS-234K 1 235 +/- 3.7% 231 +/- 3.0%2 236 +/- 4.1% 233 +/- 3.3%
BOTH 236 +/- 3.9% 232 +/- 3.1%
PS-253K 1 268 +/- 3.8% 259 +/- 3.0%2 261 +/- 4.2% 252 +/- 3.1%
BOTH 264 +/- 4.1% 255 +/- 3.3%
PS-280K 1 284 ./- 3.9% 274 +/- 1.5%2 280 +/- 3.9% 270 +/- 1.7%
BOTH 282 +/- 3.9% 272 +/- 1.7%
TOTALS
RSD (%) 3.9 2.8
DALLY CAL. ASTD. PREP GPC Mw
(E+03)
PS- 190K 1 189 +/. 1.9%2 187 +/- 1.0%
BOTH 188 +/- 1.5%
PS-234K 1 231 +/.2.3%2 231 +/.2.6%
BOTH 23] +/. 2.5%
PS-253K I 254 +/-1.6%2 247 +/- 1.8%
BOTH 251 +/-2.1%
PS-2|0K I 271 +/-1.3%
2 266 +/-0.8_i BOTH 269 +/- 1.5_:!
TOTALS
f RSD(%) 1.9I
Table 2. ComDarison of Different CalibrationTect_niques
39
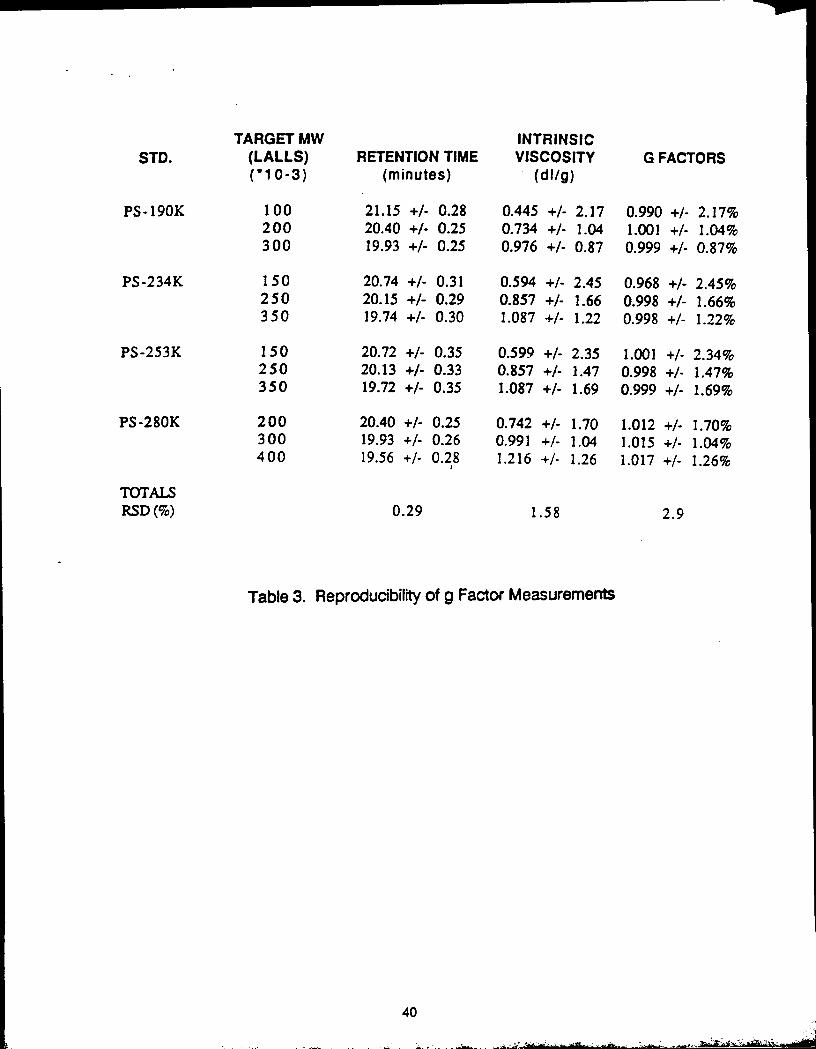
TARGET MW INTRINSICSTD. (LALLS) RETENTION TIME VISCOSITY G FACTORS
('1 0-3) (minutes) (dl/g)
PS-190K 100 21.15 +/- 0.28 0.445 +/- 2.17 0.990 +/- 2.17%200 20.40 +/- 0.25 0.734 +/- 1.04 1.001 +/- 1.04%300 19.93 +/- 0.25 0.976 +/- 0.87 0.999 +/- 0.87%
PS-234K 150 20.74 +/- 0.31 0.594 +/- 2.45 0.968 +/- 2.45%250 20.15 +/- 0.29 0.857 +/- 1.66 0.998 +/- 1.66%350 19.74 +/- 0.30 1.087 +/- 1.22 0.998 +/- 1.22%
PS-253K 150 20.72 +/- 0.35 0.599 +/- 2.35 1.001 +/- 2.34%250 20.13 +/- 0.33 0.857 +/- 1.47 0.998 +/- 1.47%350 19.72 +/- 0.35 1.087 +/- 1.69 0.999 +/- 1.69%
PS-280K 200 20.40 +/- 0.25 0.742 +/- 1.70 1.012 +/- 1.70%300 19.93 +/- 0.26 0.991 +/- 1.04 1.015 +/- 1.04%
400 19.56 +/- 0.28 1.216 +/- 1.26 1.017 +/- 1.26%
'I'OTAI_RSD (%) 0.29 1.58 2.9
Table 3. Reproducibility of g Factor Measurements
4o
2.50E-01
2.00E-01
D
1.50E-01• LINEAR • l_
n L:S 2:1
1.00E-01 • L:S 1:2D •
0 STAR •
__ 5.00E-02 • D
8
u 0.00E+00 Do_.__
0
-5.00E-02 D
D
- 1.00E-01 - []
D
-1.50E-01 - • • <> 0[] <> O O
. OO
• o-2.00E-01 -J_ <>
o
z 5oE01 I 1 I I I I5.20E+00 5.30E+00 5.40E400 5.50E_00 5.60E+00 5.70E+00 5.80E+00
Log Molecular Weight
Figure 6. Mark-Houwink Plots of Polystyrenes
42
[]
[]O D
Q0.9- r,
0
[] []
0O 0
0.8-- []• []
O
"6o0.7--&-'- • •o- 0
• L INEAR 0 •
[]L:S 2:10.6-
• L:S 1:2<>
0 STAR
O
0.5-
0
0
0.4 i i i I I i
5.2 5.3 5.4 5.5 5.6 5.7 5.8
Log Molecular Weight
' Figure7. g FactorPlotsof Polystyrenes
43
ll
<>
10
0
9
• LINEAR
Q L:S Z:l 0
8• L:S 1:2
<)'STAR<>
>,, 7
cc_
p_
"_ 0
=" 6
• 04 0
¢ []o
o o
3 o• []
o[]
eo
5.2 5.3 5.4 5.5 5.6 5.7 5.8
Log Molecular Weight
Figure8. FunctionalityPlotsofPolystyrenes
44
ll-
£
I0--
9 -
o
• NOT DECONVOLUTED8 -
0 DECOHVOLUTED
05-
[]
4 -- I-1 •
3 -
2 I I 1 I I 15.2 5.3 5.4 5.5 5.6 5.7 5.8
Log Molecular Weight
Figure9. FunctionalityPlotsofStarPolystyrene
45
V
0.300"
0
0.200" 0
• LINEAR •
DD L:S 2:1
O. 10g + L:S 1:2 •
(> STAR D
:_. • 0o_ 0.00(9" <8
.__,- 0
':7"-0 i0_0 " •
o ¢
o •
-0.204 _ •• <>
<>-0.304
¢
0
-o.4o( I I I I I I
5.20 5.30 5.40 5.50 5.60 5.70 5.80
Log Molecular Weight
Figure10. Mark-HouwinkPlotsofPolystyrenes-- NewVI-RIOffset
46
7-
• L:S 2:1
r'! L:S l:Z 8' ID
• L:S 2:1 (T)
5 - <> L:S 1:2 (T)
oc0
4 - % •
,%
$
2 I I I I I I
5.20 5.30 5.40 5.50 5.60 5.70 5.80
LOG MW
Figure11. TheoreticalVersusExperimentalFunctionalities
I
47
• _ _ --.=,z_.-i_...%_cb_ _._,i