Embed Size (px)
Citation preview
Polymer Chemistry RSCPublishing
ARTICLE
This journal is © The Royal Society of Chemistry 2013 Polym. Chem., 2014, 00, 1-3 | 1
Cite this: DOI: 10.1039/x0xx00000x
Received 00th January 2012,
Accepted 00th January 2012
DOI: 10.1039/x0xx00000x
www.rsc.org/
Microstructure and Melt Properties of CO-Ethylene Copolymers with Remarkably Low CO-Content
Saeeda S. Soomro,a Daniela Cozzula,a Walter Leitner,b Henning Vogt a and Thomas E. Müller a*
Electronic Supplementary Material (ESI) for Polymer Chemistry.This journal is © The Royal Society of Chemistry 2014
Polymer Chemistry RSCPublishing
ARTICLE
This journal is © The Royal Society of Chemistry 2013 Polym. Chem., 2014, 00, 1-3 | 2
Supplementary information
Materials
Palladium acetate (99 %) and deuterated chlorobenzene (99 %) were obtained from Sigma-Aldrich. The parent protonated phosphine sulphonato ligand HL was purchased from Convertex®. Ethylene (3.0) was obtained from Gerling Holz & Co. Hamburg; carbon monoxide (3.7) was acquired from Praxair, Belgium. Dichloromethane was distilled over CaH2 and degassed by the freeze-pump-thaw technique.
Synthesis of polyketones
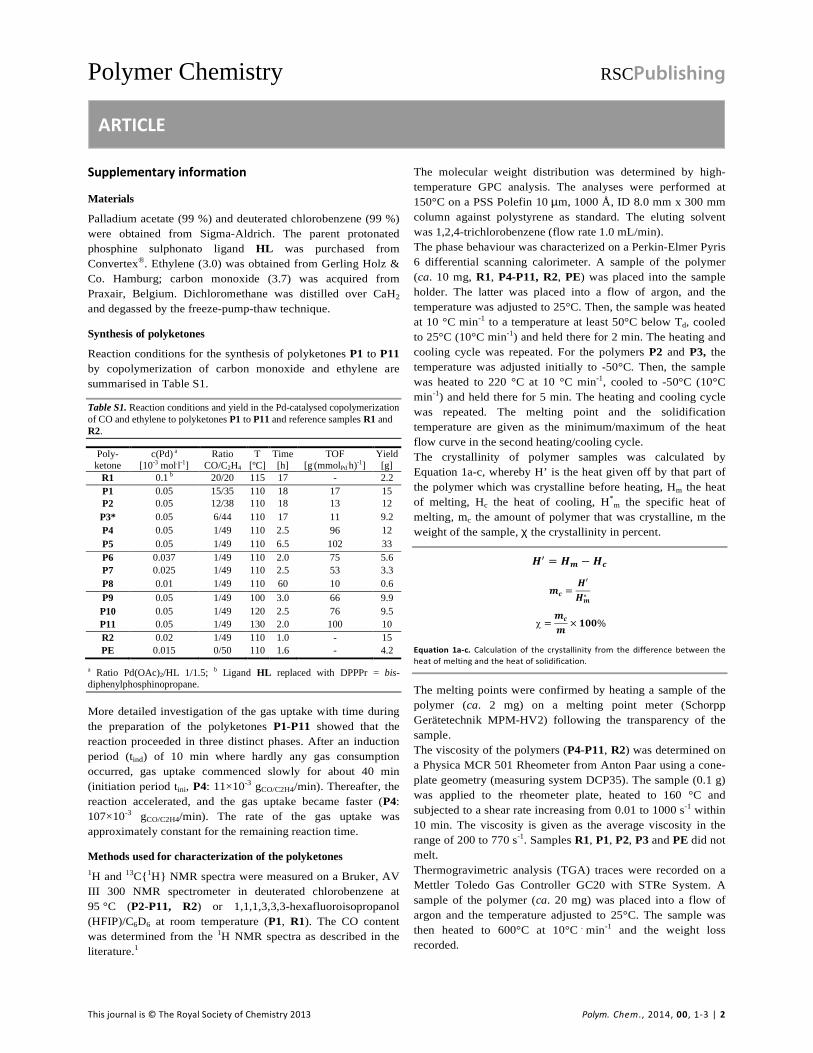
Reaction conditions for the synthesis of polyketones P1 to P11 by copolymerization of carbon monoxide and ethylene are summarised in Table S1.
Table S1. Reaction conditions and yield in the Pd-catalysed copolymerization of CO and ethylene to polyketones P1 to P11 and reference samples R1 and R2.
Poly- ketone
c(Pd) a [10-3 mol.l-1]
Ratio CO/C2H4
T [ºC]
Time [h]
TOF [g.(mmolPd
.h)-1] Yield [g]
R1 0.1 b 20/20 115 17 - 2.2 P1 0.05 15/35 110 18 17 15 P2 0.05 12/38 110 18 13 12 P3* 0.05 6/44 110 17 11 9.2 P4 0.05 1/49 110 2.5 96 12 P5 0.05 1/49 110 6.5 102 33 P6 0.037 1/49 110 2.0 75 5.6 P7 0.025 1/49 110 2.5 53 3.3 P8 0.01 1/49 110 60 10 0.6
P9 0.05 1/49 100 3.0 66 9.9 P10 0.05 1/49 120 2.5 76 9.5 P11 0.05 1/49 130 2.0 100 10 R2 0.02 1/49 110 1.0 - 15 PE 0.015 0/50 110 1.6 - 4.2
a Ratio Pd(OAc)2/HL 1/1.5; b Ligand HL replaced with DPPPr = bis-diphenylphosphinopropane.
More detailed investigation of the gas uptake with time during the preparation of the polyketones P1-P11 showed that the reaction proceeded in three distinct phases. After an induction period (tind) of 10 min where hardly any gas consumption occurred, gas uptake commenced slowly for about 40 min (initiation period tini, P4: 11×10-3 gCO/C2H4/min). Thereafter, the reaction accelerated, and the gas uptake became faster (P4: 107×10-3 gCO/C2H4/min). The rate of the gas uptake was approximately constant for the remaining reaction time.
Methods used for characterization of the polyketones 1H and 13C{1H} NMR spectra were measured on a Bruker, AV III 300 NMR spectrometer in deuterated chlorobenzene at 95 °C (P2-P11, R2) or 1,1,1,3,3,3-hexafluoroisopropanol (HFIP)/C6D6 at room temperature (P1, R1). The CO content was determined from the 1H NMR spectra as described in the literature.1
The molecular weight distribution was determined by high-temperature GPC analysis. The analyses were performed at 150°C on a PSS Polefin 10 µm, 1000 Å, ID 8.0 mm x 300 mm column against polystyrene as standard. The eluting solvent was 1,2,4-trichlorobenzene (flow rate 1.0 mL/min). The phase behaviour was characterized on a Perkin-Elmer Pyris 6 differential scanning calorimeter. A sample of the polymer (ca. 10 mg, R1, P4-P11, R2, PE) was placed into the sample holder. The latter was placed into a flow of argon, and the temperature was adjusted to 25°C. Then, the sample was heated at 10 °C min-1 to a temperature at least 50°C below Td, cooled to 25°C (10°C min-1) and held there for 2 min. The heating and cooling cycle was repeated. For the polymers P2 and P3, the temperature was adjusted initially to -50°C. Then, the sample was heated to 220 °C at 10 °C min-1, cooled to -50°C (10°C min-1) and held there for 5 min. The heating and cooling cycle was repeated. The melting point and the solidification temperature are given as the minimum/maximum of the heat flow curve in the second heating/cooling cycle. The crystallinity of polymer samples was calculated by Equation 1a-c, whereby H’ is the heat given off by that part of the polymer which was crystalline before heating, Hm the heat of melting, Hc the heat of cooling, H*m the specific heat of melting, mc the amount of polymer that was crystalline, m the weight of the sample, χ the crystallinity in percent.
�� = �� − ��
�� =�′
��∗
χ =��
���%
Equation 1a-c. Calculation of the crystallinity from the difference between the
heat of melting and the heat of solidification.
The melting points were confirmed by heating a sample of the polymer (ca. 2 mg) on a melting point meter (Schorpp Gerätetechnik MPM-HV2) following the transparency of the sample. The viscosity of the polymers (P4-P11, R2) was determined on a Physica MCR 501 Rheometer from Anton Paar using a cone-plate geometry (measuring system DCP35). The sample (0.1 g) was applied to the rheometer plate, heated to 160 °C and subjected to a shear rate increasing from 0.01 to 1000 s-1 within 10 min. The viscosity is given as the average viscosity in the range of 200 to 770 s-1. Samples R1, P1, P2, P3 and PE did not melt. Thermogravimetric analysis (TGA) traces were recorded on a Mettler Toledo Gas Controller GC20 with STRe System. A sample of the polymer (ca. 20 mg) was placed into a flow of argon and the temperature adjusted to 25°C. The sample was then heated to 600°C at 10°C . min-1 and the weight loss recorded.
Journal Name ARTICLE
This journal is © The Royal Society of Chemistry 2012 J. Name., 2012, 00, 1-3 | 3
Powder XRD patterns were collected on a Stoe STADI P powder diffractometer (STOE & Cie KG, Darmstadt; transmission mode) equipped with a Johann Germanium monochromator (Cu-Kα1 radiation) and an image plate detector. A sample of the polymer was placed on a flat sample holder and the XRD pattern recorded in the range of 0° ≤ 2Θ ≤ 130° in 0.015° steps. The program WinXPOW was used to fit the profiles.
Characterization of polyketones
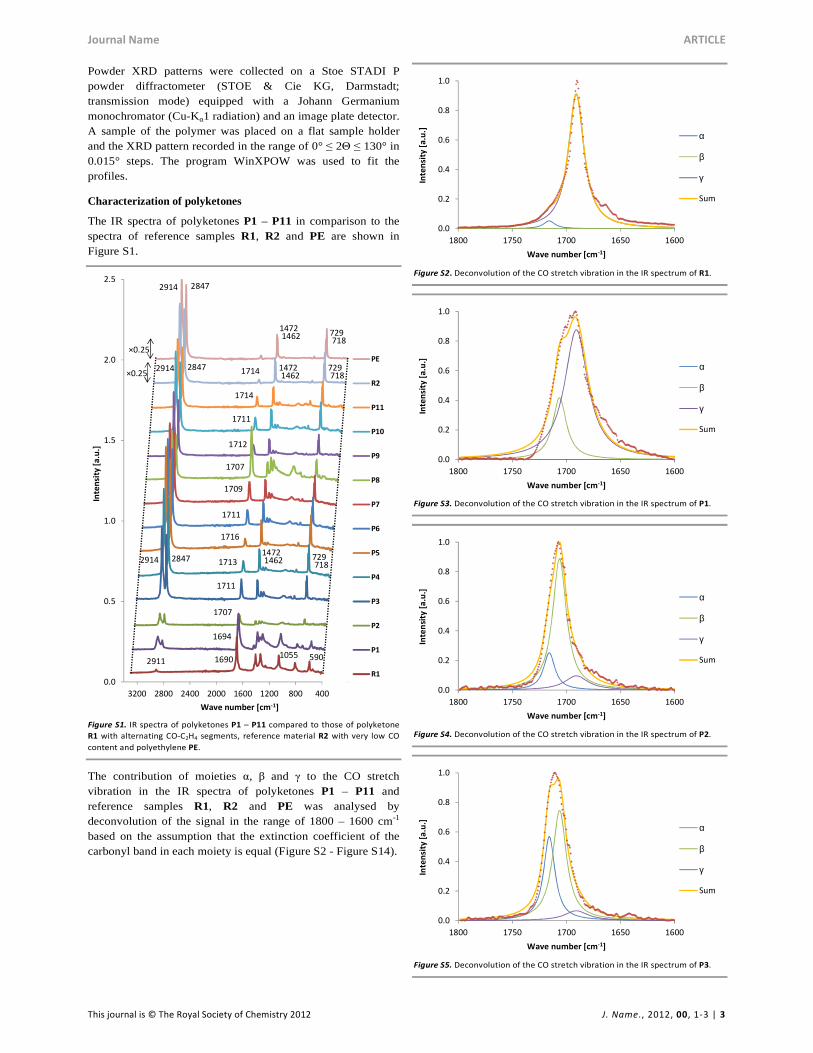
The IR spectra of polyketones P1 – P11 in comparison to the spectra of reference samples R1, R2 and PE are shown in Figure S1.
Figure S1. IR spectra of polyketones P1 – P11 compared to those of polyketone
R1 with alternating CO-C2H4 segments, reference material R2 with very low CO
content and polyethylene PE.
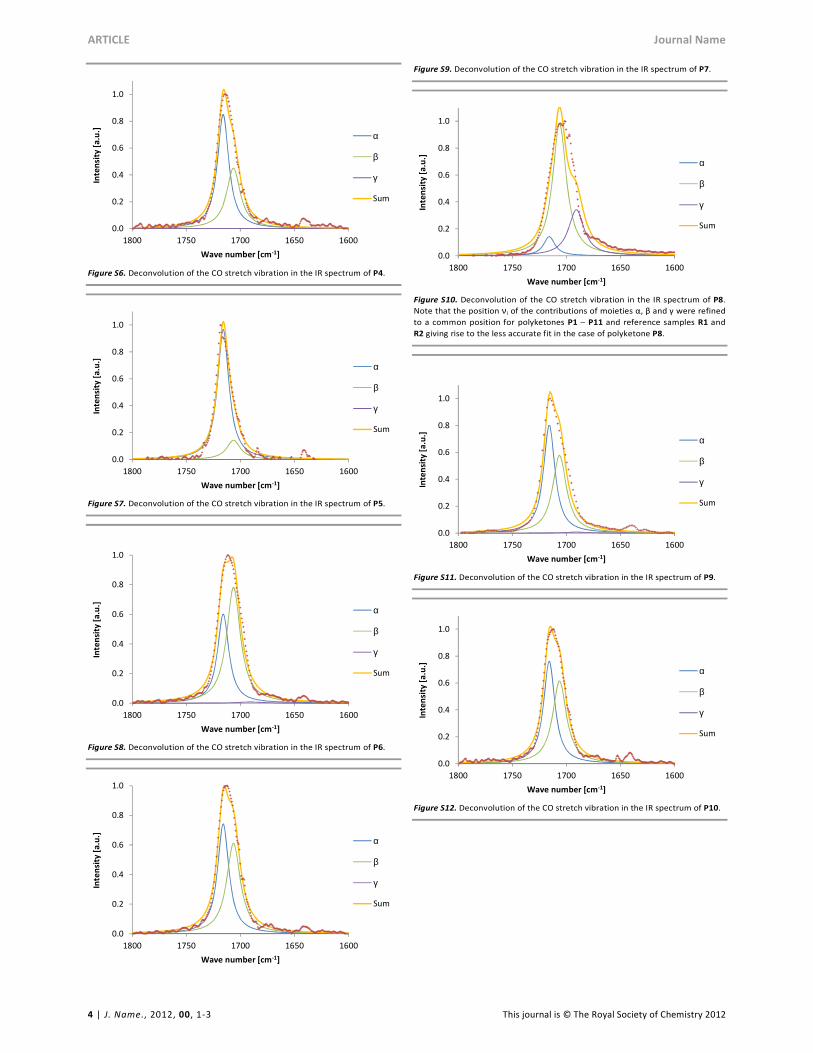
The contribution of moieties α, β and γ to the CO stretch vibration in the IR spectra of polyketones P1 – P11 and reference samples R1, R2 and PE was analysed by deconvolution of the signal in the range of 1800 – 1600 cm-1 based on the assumption that the extinction coefficient of the carbonyl band in each moiety is equal (Figure S2 - Figure S14).
Figure S2. Deconvolution of the CO stretch vibration in the IR spectrum of R1.
Figure S3. Deconvolution of the CO stretch vibration in the IR spectrum of P1.
Figure S4. Deconvolution of the CO stretch vibration in the IR spectrum of P2.
Figure S5. Deconvolution of the CO stretch vibration in the IR spectrum of P3.
0.0
0.5
1.0
1.5
2.0
2.5
0400800120016002000240028003200
Inte
nsi
ty [
a.u
.]
Wave number [cm-1]
PE
R2
P11
P10
P9
P8
P7
P6
P5
P4
P3
P2
P1
R1
2914 2847 171314721462 729
718
1690
2914 2847
14721462 729
718
2914 2847 1714 14721462
729718
2911
×0.25
×0.25
5901055
1711
1707
1694
1716
1711
1709
1707
1712
1711
1714
0.0
0.2
0.4
0.6
0.8
1.0
16001650170017501800
Inte
nsi
ty [
a.u
.]
Wave number [cm-1]
α
β
γ
Sum
0.0
0.2
0.4
0.6
0.8
1.0
16001650170017501800
Inte
nsi
ty [
a.u
.]
Wave number [cm-1]
α
β
γ
Sum
0.0
0.2
0.4
0.6
0.8
1.0
16001650170017501800
Inte
nsi
ty [
a.u
.]
Wave number [cm-1]
α
β
γ
Sum
0.0
0.2
0.4
0.6
0.8
1.0
16001650170017501800
Inte
nsi
ty [
a.u
.]
Wave number [cm-1]
α
β
γ
Sum
ARTICLE Journal Name
4 | J. Name., 2012, 00, 1-3 This journal is © The Royal Society of Chemistry 2012
Figure S6. Deconvolution of the CO stretch vibration in the IR spectrum of P4.
Figure S7. Deconvolution of the CO stretch vibration in the IR spectrum of P5.
Figure S8. Deconvolution of the CO stretch vibration in the IR spectrum of P6.
Figure S9. Deconvolution of the CO stretch vibration in the IR spectrum of P7.
Figure S10. Deconvolution of the CO stretch vibration in the IR spectrum of P8.
Note that the position νi of the contributions of moieties α, β and γ were refined
to a common position for polyketones P1 – P11 and reference samples R1 and
R2 giving rise to the less accurate fit in the case of polyketone P8.
Figure S11. Deconvolution of the CO stretch vibration in the IR spectrum of P9.
Figure S12. Deconvolution of the CO stretch vibration in the IR spectrum of P10.
0.0
0.2
0.4
0.6
0.8
1.0
16001650170017501800
Inte
nsi
ty [
a.u
.]
Wave number [cm-1]
α
β
γ
Sum
0.0
0.2
0.4
0.6
0.8
1.0
16001650170017501800
Inte
nsi
ty [
a.u
.]
Wave number [cm-1]
α
β
γ
Sum
0.0
0.2
0.4
0.6
0.8
1.0
16001650170017501800
Inte
nsi
ty [
a.u
.]
Wave number [cm-1]
α
β
γ
Sum
0.0
0.2
0.4
0.6
0.8
1.0
16001650170017501800
Inte
nsi
ty [
a.u
.]
Wave number [cm-1]
α
β
γ
Sum
0.0
0.2
0.4
0.6
0.8
1.0
16001650170017501800
Inte
nsi
ty [
a.u
.]
Wave number [cm-1]
α
β
γ
Sum
0.0
0.2
0.4
0.6
0.8
1.0
16001650170017501800
Inte
nsi
ty [
a.u
.]
Wave number [cm-1]
α
β
γ
Sum
0.0
0.2
0.4
0.6
0.8
1.0
16001650170017501800
Inte
nsi
ty [
a.u
.]
Wave number [cm-1]
α
β
γ
Sum
Journal Name ARTICLE
This journal is © The Royal Society of Chemistry 2012 J. Name., 2012, 00, 1-3 | 5
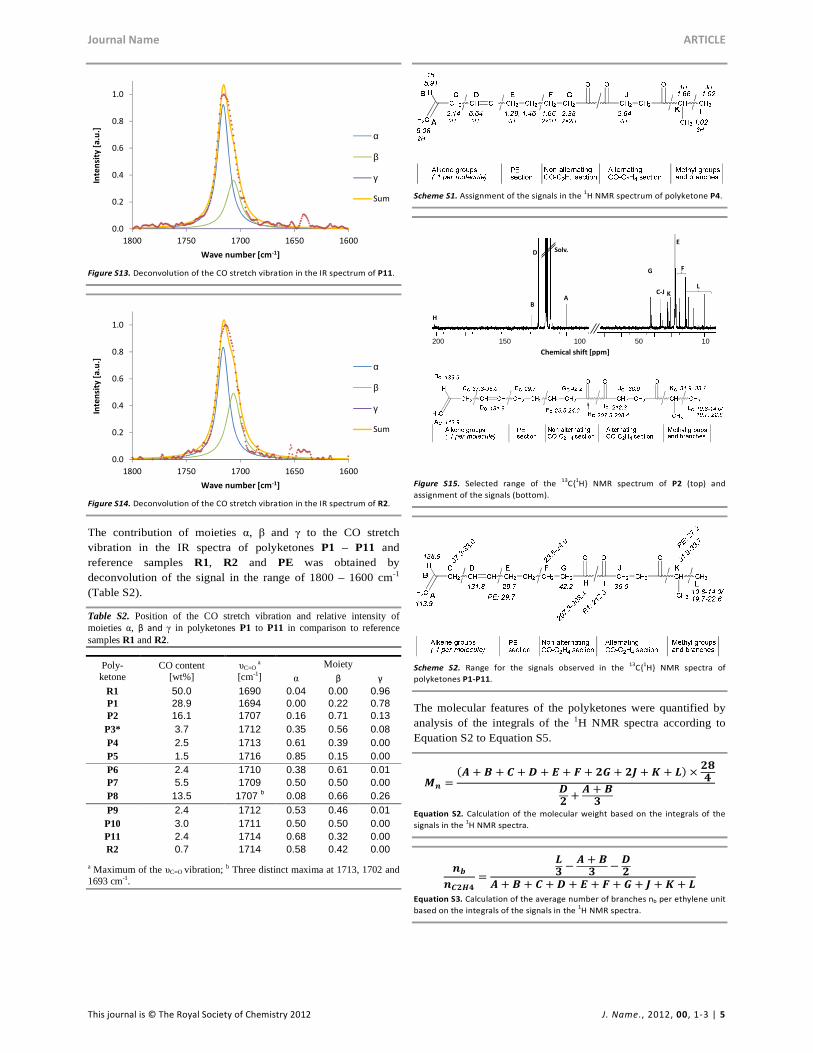
Figure S13. Deconvolution of the CO stretch vibration in the IR spectrum of P11.
Figure S14. Deconvolution of the CO stretch vibration in the IR spectrum of R2.
The contribution of moieties α, β and γ to the CO stretch vibration in the IR spectra of polyketones P1 – P11 and reference samples R1, R2 and PE was obtained by deconvolution of the signal in the range of 1800 – 1600 cm-1 (Table S2).
Table S2. Position of the CO stretch vibration and relative intensity of moieties α, β and γ in polyketones P1 to P11 in comparison to reference samples R1 and R2.
Poly- ketone
CO content [wt%]
υC=O a
[cm-1] Moiety
α β γ R1 50.0 1690 0.04 0.00 0.96 P1 28.9 1694 0.00 0.22 0.78 P2 16.1 1707 0.16 0.71 0.13
P3* 3.7 1712 0.35 0.56 0.08 P4 2.5 1713 0.61 0.39 0.00 P5 1.5 1716 0.85 0.15 0.00 P6 2.4 1710 0.38 0.61 0.01 P7 5.5 1709 0.50 0.50 0.00 P8 13.5 1707 b 0.08 0.66 0.26 P9 2.4 1712 0.53 0.46 0.01
P10 3.0 1711 0.50 0.50 0.00 P11 2.4 1714 0.68 0.32 0.00 R2 0.7 1714 0.58 0.42 0.00
a Maximum of the υC=O vibration; b Three distinct maxima at 1713, 1702 and 1693 cm-1.
Scheme S1. Assignment of the signals in the
1H NMR spectrum of polyketone P4.
P2
Chemical shift [ppm]
200 150 50 10
L
E
F
100
H
G
A
Solv.
C-J
B
D
K
Figure S15. Selected range of the
13C{
1H} NMR spectrum of P2 (top) and
assignment of the signals (bottom).
Scheme S2. Range for the signals observed in the
13C{
1H} NMR spectra of
polyketones P1-P11.
The molecular features of the polyketones were quantified by analysis of the integrals of the 1H NMR spectra according to Equation S2 to Equation S5.
� =�� + � + � +� + � + � + �� + �� + � + �� ×
���
��+� + ��
Equation S2. Calculation of the molecular weight based on the integrals of the
signals in the 1H NMR spectra.
�
�����=
��−� +��
−��
� + � + � +� + � + � + � + � + � + �
Equation S3. Calculation of the average number of branches nb per ethylene unit
based on the integrals of the signals in the 1H NMR spectra.
0.0
0.2
0.4
0.6
0.8
1.0
16001650170017501800
Inte
nsi
ty [
a.u
.]
Wave number [cm-1]
α
β
γ
Sum
0.0
0.2
0.4
0.6
0.8
1.0
16001650170017501800
Inte
nsi
ty [
a.u
.]
Wave number [cm-1]
α
β
γ
Sum
ARTICLE Journal Name
6 | J. Name., 2012, 00, 1-3 This journal is © The Royal Society of Chemistry 2012
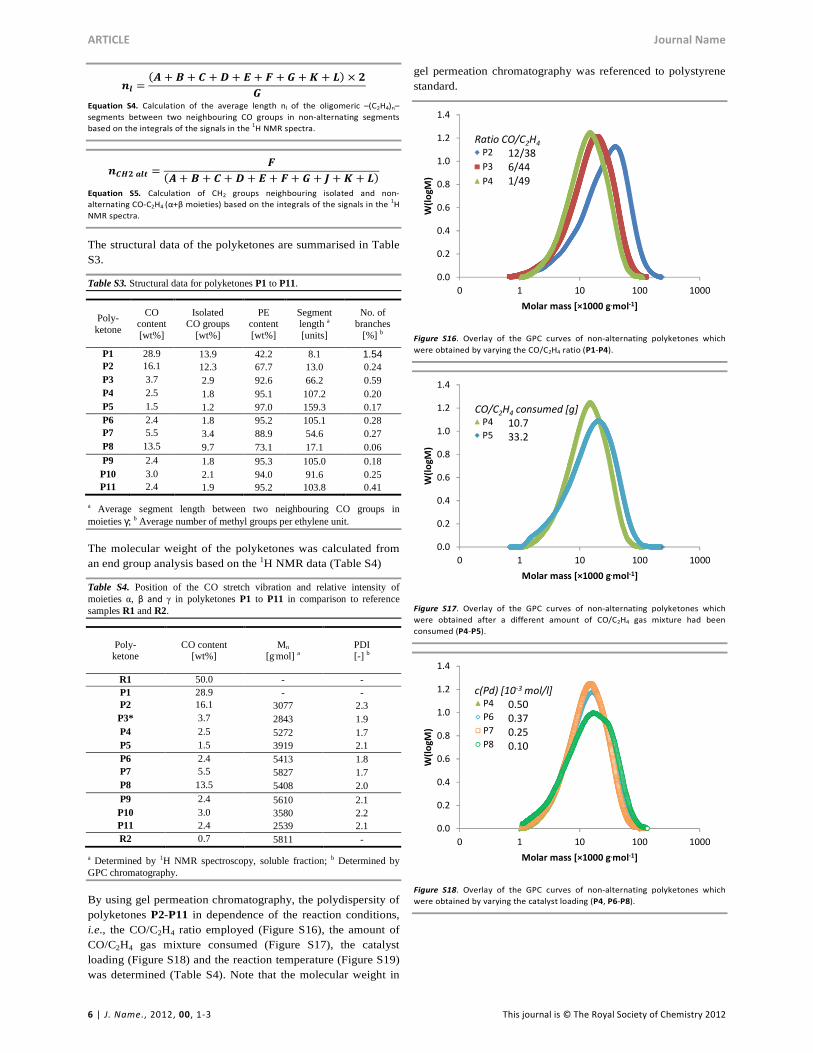
�! =�� + �+ � + �+ �+ � + � +�+ �� × �
�
Equation S4. Calculation of the average length nl of the oligomeric –(C2H4)n–
segments between two neighbouring CO groups in non-alternating segments
based on the integrals of the signals in the 1H NMR spectra.
����#!$ =�
�� + � + � + �+ � + �+ � + � + � + ��
Equation S5. Calculation of CH2 groups neighbouring isolated and non-
alternating CO-C2H4 (α+β moieties) based on the integrals of the signals in the 1H
NMR spectra.
The structural data of the polyketones are summarised in Table S3.
Table S3. Structural data for polyketones P1 to P11.
Poly-ketone
CO content [wt%]
Isolated CO groups
[wt%]
PE content [wt%]
Segment length a [units]
No. of branches
[%] b
P1 28.9 13.9 42.2 8.1 1.54 P2 16.1 12.3 67.7 13.0 0.24 P3 3.7 2.9 92.6 66.2 0.59 P4 2.5 1.8 95.1 107.2 0.20 P5 1.5 1.2 97.0 159.3 0.17 P6 2.4 1.8 95.2 105.1 0.28 P7 5.5 3.4 88.9 54.6 0.27 P8 13.5 9.7 73.1 17.1 0.06 P9 2.4 1.8 95.3 105.0 0.18
P10 3.0 2.1 94.0 91.6 0.25 P11 2.4 1.9 95.2 103.8 0.41
a Average segment length between two neighbouring CO groups in moieties γ; b Average number of methyl groups per ethylene unit.
The molecular weight of the polyketones was calculated from an end group analysis based on the 1H NMR data (Table S4)
Table S4. Position of the CO stretch vibration and relative intensity of moieties α, β and γ in polyketones P1 to P11 in comparison to reference samples R1 and R2.
Poly- ketone
CO content [wt%]
Mn [g.mol] a
PDI [-] b
R1 50.0 - - P1 28.9 - - P2 16.1 3077 2.3 P3* 3.7 2843 1.9 P4 2.5 5272 1.7 P5 1.5 3919 2.1 P6 2.4 5413 1.8 P7 5.5 5827 1.7 P8 13.5 5408 2.0 P9 2.4 5610 2.1 P10 3.0 3580 2.2 P11 2.4 2539 2.1 R2 0.7 5811 -
a Determined by 1H NMR spectroscopy, soluble fraction; b Determined by GPC chromatography.
By using gel permeation chromatography, the polydispersity of polyketones P2-P11 in dependence of the reaction conditions, i.e., the CO/C2H4 ratio employed (Figure S16), the amount of CO/C2H4 gas mixture consumed (Figure S17), the catalyst loading (Figure S18) and the reaction temperature (Figure S19) was determined (Table S4). Note that the molecular weight in
gel permeation chromatography was referenced to polystyrene standard.
Figure S16. Overlay of the GPC curves of non-alternating polyketones which
were obtained by varying the CO/C2H4 ratio (P1-P4).
Figure S17. Overlay of the GPC curves of non-alternating polyketones which
were obtained after a different amount of CO/C2H4 gas mixture had been
consumed (P4-P5).
Figure S18. Overlay of the GPC curves of non-alternating polyketones which
were obtained by varying the catalyst loading (P4, P6-P8).
0.0
0.2
0.4
0.6
0.8
1.0
1.2
1.4
0 1 10 100 1000
W(l
og
M)
Molar mass [×1000 g.mol-1]
P2
P3
P4
Ratio CO/C2H4
12/38
6/44
1/49
0.0
0.2
0.4
0.6
0.8
1.0
1.2
1.4
0 1 10 100 1000
W(l
og
M)
Molar mass [×1000 g.mol-1]
P4
P5
CO/C2H4 consumed [g]
10.7
33.2
0.0
0.2
0.4
0.6
0.8
1.0
1.2
1.4
0 1 10 100 1000
W(l
og
M)
Molar mass [×1000 g.mol-1]
P4
P6
P7
P8
c(Pd) [10-3 mol/l]
0.50
0.37
0.25
0.10
Journal Name ARTICLE
This journal is © The Royal Society of Chemistry 2012 J. Name., 2012, 00, 1-3 | 7
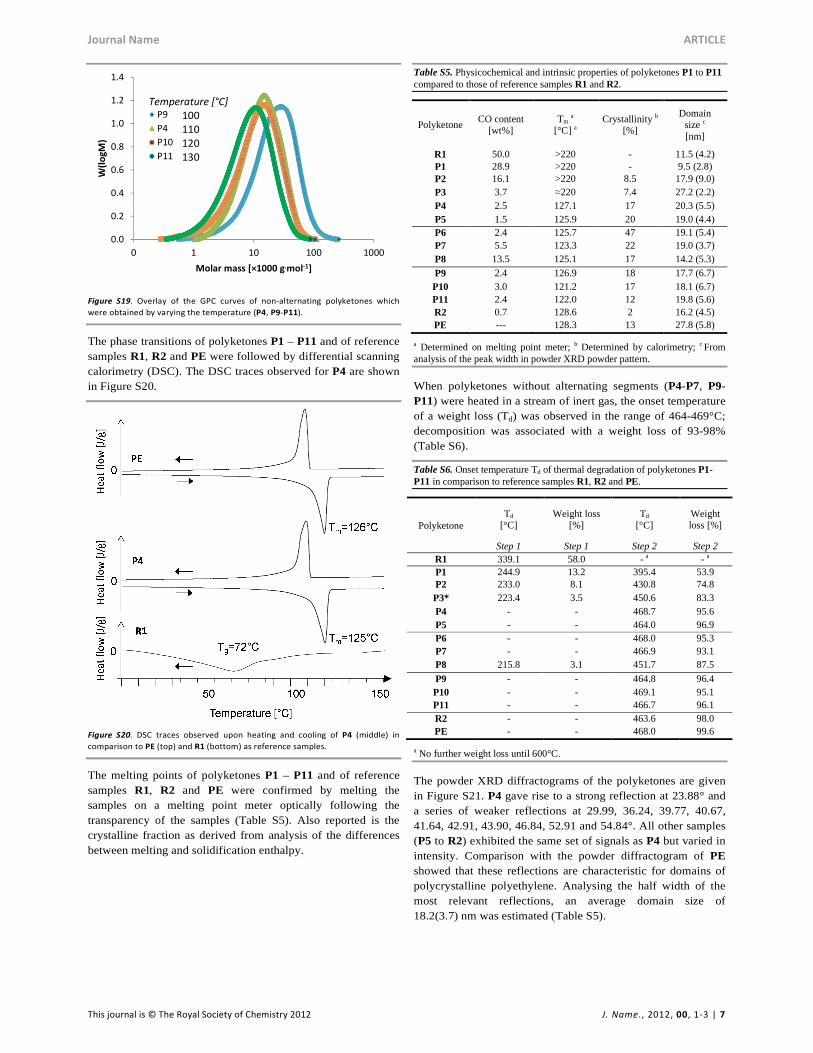
Figure S19. Overlay of the GPC curves of non-alternating polyketones which
were obtained by varying the temperature (P4, P9-P11).
The phase transitions of polyketones P1 – P11 and of reference samples R1, R2 and PE were followed by differential scanning calorimetry (DSC). The DSC traces observed for P4 are shown in Figure S20.
Figure S20. DSC traces observed upon heating and cooling of P4 (middle) in
comparison to PE (top) and R1 (bottom) as reference samples.
The melting points of polyketones P1 – P11 and of reference samples R1, R2 and PE were confirmed by melting the samples on a melting point meter optically following the transparency of the samples (Table S5). Also reported is the crystalline fraction as derived from analysis of the differences between melting and solidification enthalpy.
Table S5. Physicochemical and intrinsic properties of polyketones P1 to P11 compared to those of reference samples R1 and R2.
Polyketone CO content
[wt%] Tm a
[°C] a Crystallinity b
[%]
Domain size c [nm]
R1 50.0 >220 - 11.5 (4.2) P1 28.9 >220 - 9.5 (2.8) P2 16.1 >220 8.5 17.9 (9.0) P3 3.7 ≈220 7.4 27.2 (2.2) P4 2.5 127.1 17 20.3 (5.5) P5 1.5 125.9 20 19.0 (4.4) P6 2.4 125.7 47 19.1 (5.4) P7 5.5 123.3 22 19.0 (3.7) P8 13.5 125.1 17 14.2 (5.3)
P9 2.4 126.9 18 17.7 (6.7) P10 3.0 121.2 17 18.1 (6.7) P11 2.4 122.0 12 19.8 (5.6) R2 0.7 128.6 2 16.2 (4.5) PE --- 128.3 13 27.8 (5.8)
a Determined on melting point meter; b Determined by calorimetry; c From analysis of the peak width in powder XRD powder pattern.
When polyketones without alternating segments (P4-P7, P9-P11) were heated in a stream of inert gas, the onset temperature of a weight loss (Td) was observed in the range of 464-469°C; decomposition was associated with a weight loss of 93-98% (Table S6).
Table S6. Onset temperature Td of thermal degradation of polyketones P1-P11 in comparison to reference samples R1, R2 and PE.
Polyketone Td
[°C] Weight loss
[%] Td
[°C] Weight loss [%]
Step 1 Step 1 Step 2 Step 2 R1 339.1 58.0 - a - a P1 244.9 13.2 395.4 53.9 P2 233.0 8.1 430.8 74.8 P3* 223.4 3.5 450.6 83.3 P4 - - 468.7 95.6 P5 - - 464.0 96.9 P6 - - 468.0 95.3 P7 - - 466.9 93.1 P8 215.8 3.1 451.7 87.5
P9 - - 464.8 96.4 P10 - - 469.1 95.1 P11 - - 466.7 96.1 R2 - - 463.6 98.0 PE - - 468.0 99.6
a No further weight loss until 600°C.
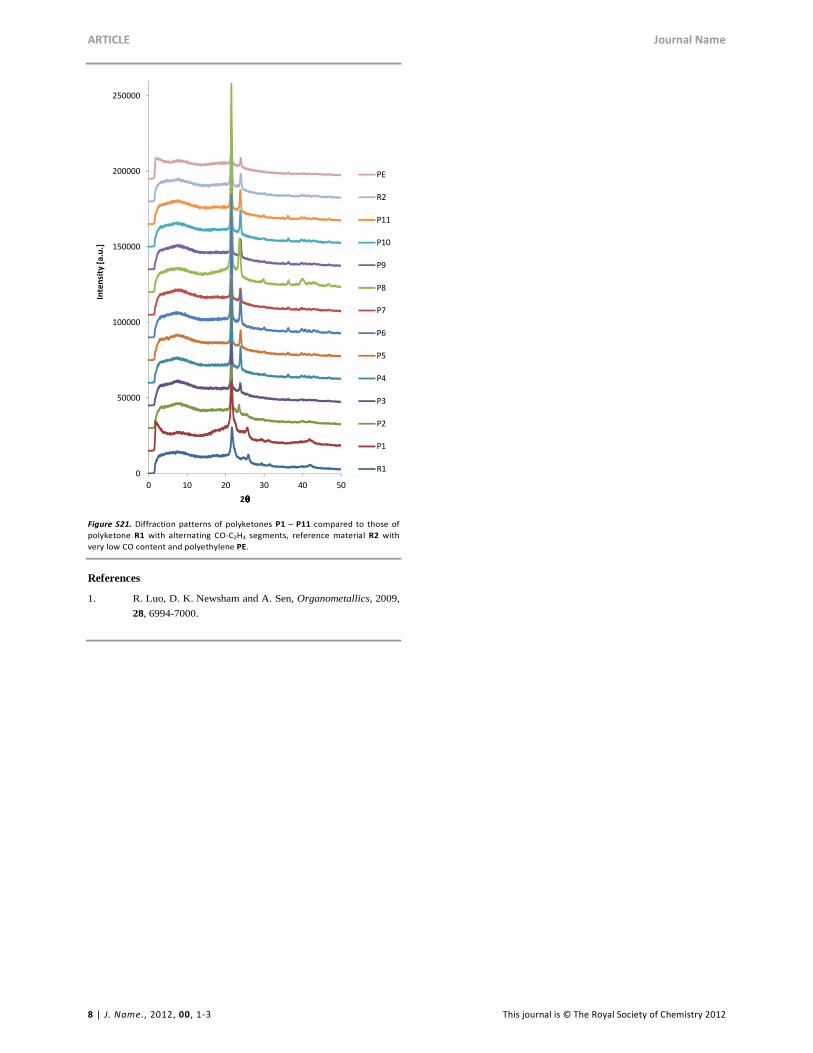
The powder XRD diffractograms of the polyketones are given in Figure S21. P4 gave rise to a strong reflection at 23.88° and a series of weaker reflections at 29.99, 36.24, 39.77, 40.67, 41.64, 42.91, 43.90, 46.84, 52.91 and 54.84°. All other samples (P5 to R2) exhibited the same set of signals as P4 but varied in intensity. Comparison with the powder diffractogram of PE showed that these reflections are characteristic for domains of polycrystalline polyethylene. Analysing the half width of the most relevant reflections, an average domain size of 18.2(3.7) nm was estimated (Table S5).
0.0
0.2
0.4
0.6
0.8
1.0
1.2
1.4
0 1 10 100 1000
W(l
og
M)
Molar mass [×1000 g.mol-1]
P9
P4
P10
P11
Temperature [°C]
100
110
120
130
ARTICLE Journal Name
8 | J. Name., 2012, 00, 1-3 This journal is © The Royal Society of Chemistry 2012
Figure S21. Diffraction patterns of polyketones P1 – P11 compared to those of
polyketone R1 with alternating CO-C2H4 segments, reference material R2 with
very low CO content and polyethylene PE.
References
1. R. Luo, D. K. Newsham and A. Sen, Organometallics, 2009,
28, 6994-7000.
0
50000
100000
150000
200000
250000
0 10 20 30 40 50
Inte
nsi
ty [
a.u
.]
2θθθθ
PE
R2
P11
P10
P9
P8
P7
P6
P5
P4
P3
P2
P1
R1