Embed Size (px)
Citation preview

Macromolecules 1994,27, 1355-1366 1356
Polymer Dynamics in Aqueous Poly(ethy1ene oxide) Solutions. An NMR Study
T. W. N. BiezeJ J. R. C. van der Maare12 C. D. Eisenbach? and J. C. Leyte'n Department of Physical and Macromolecular Chemistry, Leiden University, Gorlaeus Laboratories, P.O. Box 9502, 2300 RA Leiden, The Netherlands, and Makromolekulare Chemie 11, Universitht Bayreuth, Uniuersithtsstrasse 30, Postfach 101251, 08580 Bayreuth, Germany Received August 9,1993; Revised Manuscript Received November 30,19930
ABSTRACT The spectral density functions of the 2H-methylene nuclei in poly(ethy1ene oxide) (PEO) have been determined by magnetic relaxation measurements in the 0-90 MHz range at six applied field strengths. The relaxation rates were determined in a concentration interval from 0.1 to 40 monomolal. No molecular weight dependence was observed in the 3000 I M, I 50 OOO range. In the dilute and semidilute regimes, the spectral density function is interpreted in terms of anisotropic reorientation of a hydrodynamic unit. The corresponding dimensions of the dynamic unit are similar to those of a Kuhn segment. At a concentration where the dynamic unit can no longer reorient freely, the nature of the reorientational dynamics of the polymer segments is severely altered. This point is indicative of the start of the concentrated regime. Both the spectral density curve and the effective activation energies become strongly dependent on the polymer concentration. The 'H- and 2H-NMR relaxation rates show qualitatively different molecular weight and concentration dependencies at a polymer concentration greater than the crossover concentration c**. From the determination of 1H-NMR relaxation rates in mixtures of perdeuterated and hydrogenous polymers at c,, > c**, it becomes clear that the different behavior of lH and *H is singularly due to an additional intermolecular dipolar coupling in the case of 'H. The latter interaction is modulated on relatively long time scales (7, > 10-8 8).
I. Introduction Internal polymer dynamics have been studied with a
number of spectroscopic techniques such as NMR and neutron diffraction.'p2 How the internal mobility of local structures in solvated macromolecules is related to the local stiffness of the chain has been a longstanding question in polymer physics.3 The rigidity of the chain can be experimentally determined with the aid of light sca t te r id or small-angle neutron scatteringd and is quantified by the Kuhn segment length lk. The connection between the internal mobility and intrinsic stiffness of the chain is the main theme of this paper.
With regard to dynamics, NMR has proven to be a valuable tool. Its selectivity allows one to probe specific sites on the polymer chain which are either spectrally resolved6 or isotopically labeled.' Another advantage is of a more fundamental nature. In some cases the magnitude of the Hamiltonian driving relaxation is known and has a nearly exclusive intramolecular origin8 (e.g., 2H or 13C incorporated in a C-H bond). Accordingly, this provides one with a means to unambiguously determine the correlation times of the internal polymer motions. Typically in these studies, 2H-, lH-, and 13C-relaxation rates are determined as a function of temperature9 and/or field strength.lO The latter approach is preferable for it allows one to map out the spectral density curve of a physically and chemically unmodified sample.
Experimental work on polymer systems has shown that, in general, the nuclear quadrupole interaction is averaged on a number of time scales. These systems are charac- terized by a high degree of internal mobility, even a t high volume fractions. In practical terms this means that the bulk of the interaction Hamiltonian is averaged out in the subnanosecond time d~main.ll-'~ Unfortunately, with the
* To whom correspondence should be addressed. + Leiden University. t Universitet Bayreuth. 0 AbstractpublishedinAduanceACSAbstracts,Februaryl, 1994.
present magnetic field strengths, the details of these averaging processes cannot be investigated. Nevertheless, a significant fraction of the interaction is left to be averaged out on longer time scales ( T ~ > W9). A large number of models are available to describe the dispersion in the spectral density curve. This reflects the fact that there are numerous and, indeed, widely differing opinions on the nature of the physical processes which cause the experimentally observed correlation times. These models can basically be categorized into two groups: (1) diffusion of rotational motions described by the diffusion equation or (2) jump models (see ref 14 and references therein for an extensive survey).
In this paper we shall use an axial symmetric rotational diffusion model (ARDM) to describe the internal polymer motions. In previous workl"l8it has been shown that the deuterium spectral densities (including the contribution at zero frequency) from dilute and semidilute polymer and polyelectrolyte solutions can be adequately described with this model. On a number of occasions various models were compared and the ARDM was shown to be more appropriate with regard to the quality of the fit and/or number of adjustable parameters.lg*m
In a next step, one could compare frictional forces experienced by a reorienting interaction tensor within the polymer (e.g., C-D bond) to those of a reorienting hydrodynamic body. With the aid of a simple model one can then use the diffusion constants to calculate the dimensions of this representative reorienting body (e.g., with length Idyn). The essence of this approach is that length scales extracted from dynamic NMR data can now be linked to the more general concept of the Kuhn length (Id. The Kuhn length is the length over which orientation correlation in the polymer chain becomes negligible and thus directly reflects the stiffness of the chain. Accord- ingly, the dynamic length ldyn may be compared to 1k. In previous work it has been shown that the 2H-spectral density is sensitive to both the intrinsic21 and the
0024-929719412227-1355$04.50/0 0 1994 American Chemical Society

1356 Bieze et al. Macromolecules, VoZ. 27, No. 6, 1994
Table 1. Characteristics of Hydrogenous and Perdeuterated Polymer Fractions
fraction0 M W N MwIMn
dilute
0.01 0.1 1 10 100
C, (monomol/kg H20) Figure 1. Overlapconcentrationsfor PEosolutionsas afunction of molecular mass and polymer concentration at room temper- ature. To calculate c*, the volume occupied by a single chain was estimated using c* - 3Mw14N~rR~ (-), Mw12N.,R,8 (. . -1, and M W I N ~ (R/2)a (- - -). For c**, polymer volume fraction 9 = 0.05 (- . e -) and 0.2 (- -). The M, and cp range covered in this work is indicated by the box. (R, = radius of gyration; R = root- mean-square end-to-end distance; NA = Avogadro's number.)
electrostatic contribution to the persistence length. This last point was illustrated by the shape of the spectral density curve of methylene groups on poly(acry1ic acid) at various degrees of neutralization. The slowest process revealed by the spectral density function correlated with the electrostatic persistence length in a consistent man- ner.16
Keeping the concept of the dynamic length ld? in mind, we will discuss the influence of the concentration (c,) on the internal polymer mobility. To this end, the relasation rates have been determined in a concentration interval which spans the dilute, semidilute, and concentrated regimes. The various concentration regimes for PEQ at 298 K are shown in Figure 1. The concentration (c,) and molecular weight (M,> range enclosed by the box has been investigated in this work. One would expect the internal mobility to diminish once the volumes swept out by objects of length ldyn start to interpenetrate. The point at which this occurs is defined as clays' Due to the intrinsic flexibility of the PEO chain, ldyn is not expected to be large. Consequently, the transition concentration cl& will be rather high. Since the dynamic length can be obtained from the spectral density of a diluted PEO solution, c b can be calculated. It is shown here that the decrease in the internal polymer mobility is connected to clW The concentration c b i s within the c** region shown in Figure 1. The apparent connection between cld, and c** will be discussed in simple terms.
The phase diagram shown in Figure 1 has been calculated according to conventional polymer theory.2233 Concen- tration regimes do not show abrupt transitions; gradual transition regions are more appropriate. Accordingly, the approximate character of c* and c** has been emphasized in the diagram. The overall polymer dimensions, necessary to calculate c*, were obtained from light scattering e~periments.~ The aqueous PEO solutions used in this study were claimed to be aggregate-free." Combining these results with studies done on PEO in the unperturbed state,% one obtains for the mean-square end-to-end distance
In case of random-flight chains with correlations between
-(CDzCD*O),- d l 3000 60 1.1 d2 5100 100 1.1 d3 7200 150 1.1 d4 11200 240 1.9 d5 5 m 1000 1.2
-(CHzCHpO),- h l 1500 34 1.06 h2 2m 450 1.4 h3 35000 800 1.3
0 Coding will be used in the text.
neighboring bonds, the so-called characteristic ratio C = ( R 2 ) e / d 2 reflects short-range interference, the average squared bond length being l2 (=1.8 X 10⁻²⁰ A2) and n denoting the number of bonds. For PEGthis ratio equals -5.5.28 Substituting for (R2)e in eq 1, the Kuhn segment length at 298 K is obtained. The Mw dependence of c* can then be calculated. A number of different concepts2' have been used to approximate the volume occupied by the swollen chain.
The vertical lines in Figure 1 demark the crossover region from the semidilute to the concentrated regime, c**. It should be noted that, in a good solvent system, the entangled chains should converge on their unperturbed size limit as c** is approached from the dilute side. Graessley estimated c** from the relationship c** = 0.77/ [91**.2* [?I** is defined as the point where 191 and [930 start to diverge. Allowing for other criteria also, an overlap region from 5 to 20 g dL-l is to be expectedz8 for flexible polymers.
It is in these highly condensed PEO solutions (cp > c**) that the IH- and 2H-relaxation rates show a qualitatively different cp-dependence. Since the monomers are in each others proximity, "-relaxation rates may be expected to be additionally enhanced by intermolecular dipole-dipole couplings. Papers discussing "-relaxation in connection with polymer dynamics in such systems (concentrated solutions or melts) usually do not mention the molecular origin of the interactions contributing to the different frequency regimes in "-spectral density. In the present work the intermolecular and intramolecular contributions have been separated by determination of the "-relaxation rates in mixtures of deuterated and hydrogenated poly- mers.
11. Experimental Section Specifications of poly(ethy1ene oxide) fractions used in this
study are listed in Table 1. Hydrogen-containing polymers (hl-3) were obtained from Merck. Perdeuterated poly(ethy1ene oxide) (dl-3, d5) was synthesized by anionic polymerization of highly pure ethylene-& oxide with potassium 2-methoxyetha- nolate as initiator in the presence of a cryptand in THF as solvent;% the molecular weight is controlled by the ratio of the initial monomer/initiator concentration. Fraction d4 was pur- chased from MSD (Quebec, Canada). The characteristim of the samples used in this work are compiled in Table 1. Hydrogen contamination in deuterated polymers was determined by prepolymerization GC-MS analysis and/or postpolymerization 2H-NMR. The ratio "/2H never exceeded 0.01. The polymers were characterized by GPC in 0.1 M KNOs on a Waters Model ALC/GPC equipped with Toyo Soda TSK-PW columns (G3000 PW 30 for M, I 20 OOO; GS000 for M, > 20 OOO). A Dawn F Malls detector (Wyatt Tech) was used. All light water was purified by a Milli-Q installation (Millipore Corp.) and nitrogen saturated.
Traces of paramagnetic impurities in the polymer material were removed by means of ligand extraction. To this end, PEO

Macromolecules, Vol. 27, No. 6, 1994
Table 2. NMR Equipment Used
field field" temp specification (T) (MHz) regulation
Polymer Dynamics in Aqueous PEO Solutions 1367
REF
MOL
Bruker WM 90 (home built) 0.6-2.1 4.0-13.8 fluid Bruker AM 200 4.7 30.7 air 6T Oxford Instruments 6.3 41.4 air
Bruker AM 400 9.4 61.4 air Bruker AM 500 11.75 76.8 air Bruker WM 600 14.1 92.0 air
(home built)
0 2H-resonance frequency.
was dissolved in a 1 M EDTA solution and dialyzed repeatedly against water. Prior to sample preparation, solutions were freeze- dried. The light water content was determined using IR, with the final water content always being less than 0.5 % . Hydrogenous polymer fractions were dissolved in nitrogen-saturated D2O (Merck), whereas deuterated fractions were dissolved in light water. At least 3 days were allowed for equilibration. Solutions were stored at 4 O C in the dark to minimize biological and photochemical degradation.
The NMR experiments were performed on p u b spectrometers at six different field strengths. See Table 2. Spin-lattice relaxation rates (RI) were determined using phase-alternatinp inversion-recovery experiments (PT-T/~) . Transverse relaxation rates (Rz) were obtained by CPGM sequencess18s2 (d2-[ rxf- echo]) with exorcycle.% The r-pulse duration was typically 30- 60 ps . Usually 128 data points were collected. Exponential fits were performed using a least-squares fit procedure.
Sample temperature was controlled by a Bruker VT-10oO thermostat (6.3 and 14.1 T) using air or nitrogen or a frigomix 1495/1441 with Fluorinert (grade FC43; 3M Corp.) as coolant (0.6, 1.05, and 2.1 T). The temperature in the probe was determined before and after the actual NMR experiment by measuring the temperature at the sample position in a reference NMR tube fitted with a calibrated thermocouple. The tem- perature stability was within 0.1 "C.
111. Theoretical Background For a covalently bound deuterium nucleus, the nuclear
magnetic relaxation is determined intramolecularly by the quadrupole interaction. The theory of quadrupole re- laxation is treated in ref 34. The observed relaxation rates are determined by the spectral density of the electric field gradient (EFG) fluctuations at 0, 1, and 2 times the resonance frequency (LOO) at which the experiment is performed. In formulae:
The coupling constant x (=e2qQ/h) takes the value 170 kHz.8 In the case of an aliphatic C-D bond, the asymmetry parameter q is negligible. The fact that 9 N 0 implies that rotations around the C-D bond do not contribute to relaxation.
For an exponential correlation function, the reduced spectral density takes the Lorentzian form:
(4)
In the case of anisotropic diffusion, the correlation function becomes multiexponential, with the correlation times and amplitudes being interdependent. For axially symmetric anisotropic diffusion, the reduced spectral density takes the form
I Figure 2. Schematic three-dimensional representation of a PEO segment in a reference frame (REF). The z-axis of REF lies parallel to the internuclear 2H"H vector and bisects the 2H- C-2H angle. The principle axis of the EFG tensors (MOL) lie along the 2H-C bonds. The orientation of REF with respect to MOL is given by angles 81 and j32 (35.25O and 144.75O, respec- tively). The angles a and j3 determine the orientation of the diffusion principle axis (DIF) with respect to REF.
where Wigner elements Dg(S2,) describe the transfor- mation of the EFG tensor principal axis system (MOL) to the diffusion principal axis system (DIF).s6 The principal axis of the EFG interaction tensor lies along the C-D bond. Within one methylene unit, there are twodeuteriumnuclei. In the transformation from MOL to DIF, the relative orientations of these two tensors have to be taken into account. For this purpose, it is convenient to introduce a molecule fixed axis reference frame (REF). See Figure 2 for the orientations of different frames with respect to the methylene unit in the PEO monomer.
The Wigner elements can now be written as
The Wigner matrix elements Qm(a,@) denote the relative orientation of REF with respect to the MOL. The Euler angles @1 and @z are 35.25' and 144.75O, respectively, and determine the position DIF with respect to REF. Euler angles a and @ in matrix elements Qm(a,@) refer to the position of the diffusion frame with respect to REF and are fitted parameters.
In the case of axial symmetry, the correlation times Tk(=T-k) are congruent with anumber of dynamic modeh.ls
model a: axially symmetric rotation diffusion
T~ = (60,)-l T~ ( 5 0 , + DIl)-'
7 2 = (201 + m11)-' (7)
where 011 and DL are the diffusion elements in the DIF frame. model b axially symmetric rotation diffusion
combined with an internal rotation diffusion Di around the z-axis of DIF

1358 Bieze et al. Macromolecules, Vol. 27, No. 6, 1994
70 = (6D,)-' 7' = ( 5 0 , + Dll + Di)-' 7 p = ( 2 0 , + 4Dl1 + 4DJ-l (8)
model c: spherical rotation diffusion Do combined with an internal rotation diffusion Di around the z-axis of DIF
70 = (6D0)-' = ( 5 0 0 + DJ-' 7 2 = (6Do + 4Di)-l (9)
In eqs 7 and 8, Dll and DL may be thought of as being the diffusion constants of an axially symmetric rotating ellipsoid. Perrin% derived expressions relating these diffusion constants to the hydrodynamic dimensions of an ellipsoid (Dll > D J :
D1-' = 32nqL,t[ ] / 3 k T ( 1 1 ) S (2 - p2) - 2
where
LII and L l are the semilengths of the long and short axes, respectively, of the ellipsoid of rotation and q denotes the viscosity of the medium.
Finally, in eq 9 , the spherical overall diffusion constant can be related to the hydrodynamic volume of a sphere with radius a0 according to the Stokes-Einstein equation
IV, Results In this work, the relaxation rates of 'H-, 2H- (=D), and
13C-nuclei will be denoted by the subscripts h, d, and c, respectively. In the case of mixtures of deuterated and hydrogenated polymers, the probed spin and the isotopic composition of the matrix will be indicated by subscripts inside and outside the parentheses, respectively. For instance, (R2h)d and R2h refer to the transverse relaxation of polymer protons in a matrix of perdeuterated and hydrogenous polymers, respectively. The fractional iso- topic concentration will be given where neceeeary.
IV.l. Molecular Weight and Concentration De- pendence. The longitudinal and transverse nuclear magnetic relaxation rates of the methylene deuterons on poly(ethy1ene oxide) have been measured at 41 MHz within a concentration range from 0.1 to 40 monomolal. Five perdeuterated polymer fractions were wed with molecular weights ranging from 3000 to 50 OOO. The concentration dependencies of R l d and RM are shown in Figures 3 and 4, respectively. For cp < 2-3 monomolal, relaxation rates are practically independent of concentration. At cp > 2.5 molal, an increase in the relaxation rate (i.e., a decrease in the segment mobility) can be observed. The rates show no molecular weight dependence.
The data can be described by a polynomial to the 2nd degree according to
R,d = (9.1 x 1o"')c; + l . l l c p + 15.66 (ab1) (14)
and
80
60
h - v)
rf 40
Y
20
0.1 1 10 100
C, (monomolal/kg H,O)
Figure 3. Longitudinal deuterium relaxation rates in PEO-d4 as a function of concentration and molecular weight: (0) 3000, (0) 5000, (A) 7000, (0) 11400, (+) 50000. The solid line represents a 2nd degree polynomial, fitted in a least-squares manner.
405 r 400 1 365 l O O f
80 1 h r
v)
80 Y
cr"
+ +
/
-++ 1 40 I d
0 1 1 i o 100
C, (rnonomolal/kg H20)
Figure 4. Transverse deuterium relaxation rates in PEO-d4 as afunction of concentration and molecular weight. Data indicated with arrows are from solidified samples. Legend as in Figure 3.
with cp in monomolal. In Figure 4 spuriously high R2 values are pointed out by
arrows. These originate from fraction d5. Concentrated solutions from d5 could only be prepared by heating the samples to -50 OC. Upon cooling to 25 OC, these samples solidified to a white nontransparent material. This phenomenon can be attributed to phase separation and partial crystallization of PEO. The corresponding data have been excluded from the fit procedure. Except for fraction d l and the aforementioned solutions
of d5, all polymer fractions showed monoexponential relaxation. The nonexponential behavior of d l (i.e., the fraction with the smallest molecular weight) ie due to the effect of end groups on the average segmental dynamics. This will be discussed later in the paper.
IV.2. Field-Dependent Studies at Low Concentra- tions (c, < &*). Relaxation data from solutions in which decay rates are molecular weight and concentration independent (cp < 2-3 monomolal) yield information about the intrinsic internal mobility of the average polymer segment. To gain more insight into the dynamics in this region, the deuteron relaxation rates in a 0.5 molal solution of fraction d4 have been determined at five different

Macromolecules, Vol. 27, No. 6, 1994
T
Polymer Dynamics in Aqueous PEO Solutions 1359
V n v v V ' v
12 0 SO I I
0 40 80 120 180 200
anisotropy ratio
b
2r 0 2 4 6 e i o i z
frequency/l Os (rad, s-l)
Figure 5. Fits of the anisotropic (AFtDM) (3 and isotropic (e 0 ) rotational diffusion model to 2H-spectral densities of PEO- &at various temperatures: (0) -5, (0) + 5, (V) $15, (+) +25 OC. In all fits with the ARDM an anisotropy ratio (D /DL) of 20 was used. The inset in the figure shows deviation 01 the fits to the spectral densities using different anisotropy ratios and Euler angles a = fl = 85'.
magnetic field strengths. The temperature was varied between -5 and +25 "C. Within this temperature range one stays well clear of phase transitions. This was confirmed by DSC measurements.37 These experiments show that, upon cooling, the first endothermic process takes place at -16 "C. The relaxation rates reported here were independent of the temperature history and were reproducible over a 2-year period.
Using eqs 2 and 3, relaxation rates can be transcribed to spectral densities. The spectral densities, shown in Figure 5, are frequency dependent at all temperatures. However, at -5 "C the dispersion is seen most clearly. Upon increasing the temperature up to 25 "C, the dispersion gradually shifts out of the accessible frequency range. The spectral densities have been fitted with isotropic and axially symmetric anisotropic rotational diffusion models. The former does not yield an acceptable fit, for it completely ignores the dispersions. This is illustrated in Figure 5 with the aid of the -5 O C data. The isotropic model gives a correlation time TO = 1 X 10⁻¹⁰ s. If one attempts to describe the data with a correlation time equal to approximately l/wo, the J ( w ) curve is lifted above the experimental data. This is due to the fact that the area under the curve (proportional to x2) remains constant. However, since deuterons are connected to an intrinsically linear object, dynamical processes are indeed not expected to be isotropic.
Using the axially symmetric rotational diffusion model (ARDM), the data can be adequately described at all temperatures. The results are shown in Table 3. The diffusion element DL (Do) reflects the slowest dynamical process in the polymer chain which contributes to the averaging of the quadrupole interaction. Using TO = (6Dl)-l, the correlation time in the dispersion is observed to decrease from 4.6 X 10-l0 to 1.3 X 10-"J s in the -5 to +25 O C temperature range. The Euler angles (Y = j3 =
Table 3. Results from Fitting of the Anisotropic Rotational Diffusion Model to the Spectral Deneity of a 0.5 molal
PEO-d4 Solution (Mw = 11 400)
temp ("C) D l (NOS 8-l) DII/DL B U
-5 3.6 20-400 8 5 * 5 8 5 + 5 5 5.6 20-400 8 5 + 5 8 5 * 5
15 8.5 2ob 85 85 25 12.8 20* 85 85
a Fitted values. Fixed value.
80-90° resulted in the better fits. These angles imply that the principal axis of the diffusion tensor coincides with the local orientation of the polymer backbone. It was established that no combination of Dll and DL could describe the data using (Y and/or fl C SOo. To illustrate with which precision Dll and D L can be determined, the ARDM was fitted to the dispersion using fixed values for the Euler angles (a! = fl = 85"). The ratio D[/DL was varied in the 1-200 range, leaving D L as an adjustable parameter. The inset in Figure 5 shows the sum squared deviation representative for fits to the -5 and +5 "C data. An asymmetric minimum is observed at an anisotropy ratio Dll/DI 20. Values up to D ( / D l = 40 are still considered to produce acceptable fits; larger ratios fail to describe J ( w ) at high frequencies. At +15 and +25 "C the dispersion is too weak to determine the optimal anisotropy ratio independently. However, the ratio DIllDL may be expected to be insensitive to the temperature, apoint which shall be commented on in the discussion.
If the polymer methylene units are envisaged to be embedded in a hydrodynamic particle, one can calculate the apparent hydrodynamic dimensions provided that the viscosity can be estimated. The effective viscosity within the swollen polymer is assumed to be equal to the pure water value at the corresponding sample temperature. We recall that a number of motional models (models a-c, section 111) are consistent with the correlation function used to describe the spectral density. In the case of axially symmetric diffusion, the hydrodynamic body may ten- tatively be associated with an ellipsoid of revolution. The corresponding length (%I[) and axial diameter (XI) are found to be 2.1-2.6 and 0.2-0.3 nm, respectively (model a). In the case of isotropic overall rotation diffusion DO combined with internal rotation around Di (model c), the diameter of the sphere is calculated to be 1.1-1.4 nm. The results are summarized in Table 5. Hydrodynamic di- mensions according to model b will yield results inter- mediate to those of models a and c. It is stressed that whatever hydrodynamic interpretation is chosen, the size of the reorienting particle is approximately 1-2 nm. These dimensions compare favorably with the Kuhn length the length of the statistically independent chain unit (see the Introduction).
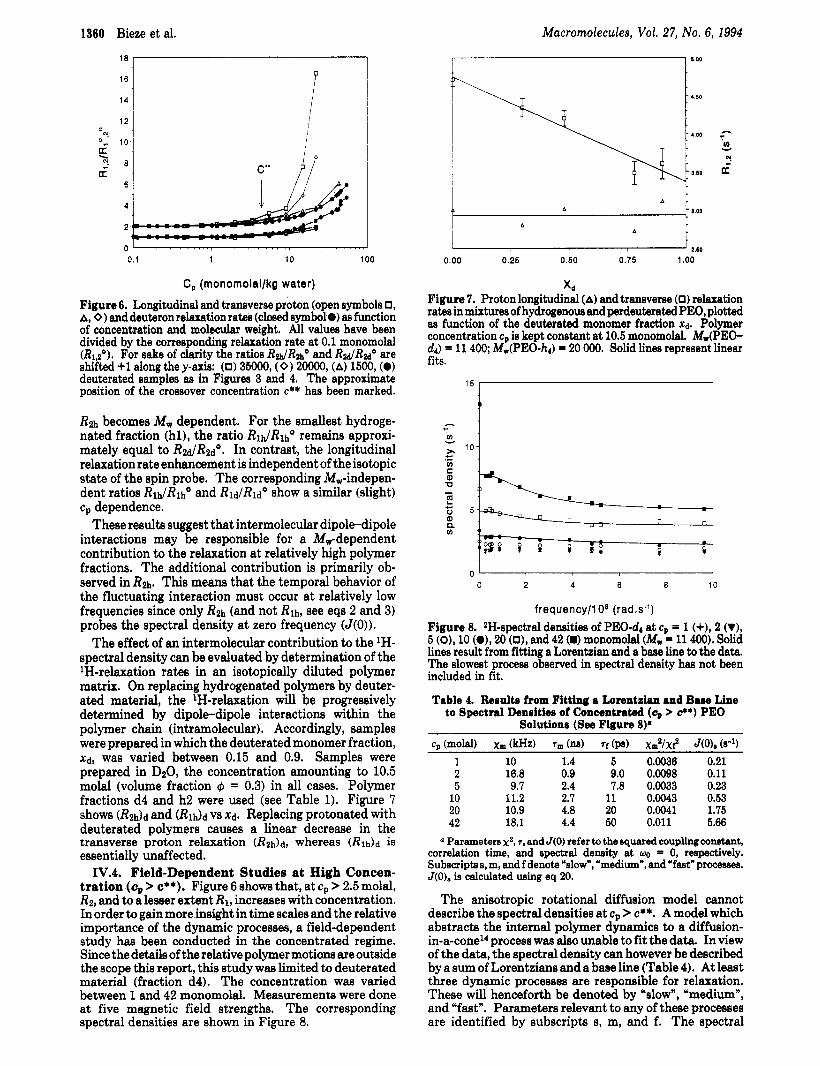
IV.3. 'H- and 2H-Relaxation at High Concentra- tions (cp > &*). The deuterium relaxation rates are molecular weight independent in all concentration regimes. This is in contrast with the molecular weight dependence of the proton transverse relaxation as observed from PEO- hq. To compare them, relaxation rates have been divided by their value at 0.1 monomolal, indicated by the super- script degree. In Figure 6 the ratios RlhlRlh", RzhlR2h0 + 1, RldlRldO, and R2JR2d0 + 1 from fractions hl-3 and dl-5 are plotted v8 the polymer concentration. The R l h and R2h data from ref 21 have been supplemented with new data in the concentrated regime. In the dilute region of Figure 6 all relaxation rates are independent of concentration. At higher concentrations however (c, > c**), &h shows a more pronounced c,-dependence com- pared to the corresponding behavior of RM. Furthermore,
1360 Bieze et al.
I
Macromolecules, Vol. 27, No. 6, 1994
18 1
14 l6 I I
I
6
4
2
C, (rnonornolal/kg water) Figure 6. Longitudinal and transverse proton (open symbols 0, A, 0 1 and deuteron relaxation rata (closed symbol 0) as function of concentration and mole& weight. All values have been divided by the corresponding relaxation rate at 0.1 monomolal (R1,z0). For sake of clarity the ratios RdRlhO and R ~ R M O are shifted +1 along the y-axis: (0) 35000, (0) 2oo00, (A) 1500, (0) deuterated samples as in Figures 3 and 4. The approximate position of the crossover concentration c** has been marked.
R2h becomes Mw dependent. For the smallest hydroge- nated fraction (hl), the ratio RldRlhO remains approxi- mately equal to R2,j/Ruo. In contrast, the longitudinal relaxation rate enhancement is independent of the isotopic state of the spin probe. The corresponding Mw-indepen- dent ratios Rlh/Rlho and RldRldO show a similar (slight) cp dependence.
These results suggest that intermolecular dipole-dipole interactions may be responsible for a M,-dependent contribution to the relaxation at relatively high polymer fractions. The additional contribution is primarily ob- served in Rfi. This means that the temporal behavior of the fluctuating interaction must occur at relatively low frequencies since only Rfi (and not Rlh, see eqs 2 and 3) probes the spectral density at zero frequency (J(0)).
The effect of an intermolecular contribution to the 'H- spectral density can be evaluated by determination of the "-relaxation rates in an isotopically diluted polymer matrix. On replacing hydrogenated polymers by deuter- ated material, the "-relaxation will be progressively determined by dipole-dipole interactions within the polymer chain (intramolecular). Accordingly, samples were prepared in which the deuterated monomer fraction, Td, was varied between 0.15 and 0.9. Samples were prepared in D20, the concentration amounting to 10.5 molal (volume fraction 4 = 0.3) in all cases. Polymer fractions d4 and h2 were used (see Table 1). Figure 7 shows (&)d and V8 xd. Replacing protonated with deuterated polymers causes a linear decrease in the transverse proton relaxation (&h)d, whereas is essentially unaffected. IV.4. Field-Dependent Studies at High Concen-
tration (cp > c**). Figure 6 shows that, at cp > 2.5 molal, R2, and to a lesser extent R1, increases with concentration. In order to gain more insight in time scales and the relative importance of the dynamic processes, a field-dependent study has been conducted in the concentrated regime. Since the details of the relative polymer motions are outside the scope this report, this study was limited to deuterated material (fraction d4). The concentration was varied between 1 and 42 monomolal. Measurements were done at five magnetic field strengths. The corresponding spectral densities are shown in Figure 8.
6.00 I 1
A r
m N.
K
v
r
A A 1.00
I A
I A
2.60
0.00 0.25 0.50 0.75 1 .oo
X d
Figure 7. Proton longitudinal (A) and transverse (0) relaxation rates in mixtures of hydrogenous and perdeuterated PEO, plotted as function of the deuterated monomer fraction Xd. Polymer concentration cp is kept constant at 10.5 monomolal. M,(PEO- d4) = 11 400; M,(PEO-h4) = 20 000. Solid lines represent linear fits.
n i " U I v)
0 0 2 4 6 8 10
frequency/l O8 ( r a d s ' ) Figure 8. *H-spectral densities of PEO-d4 at cp 5 1 (+), 2 (V), 5 (o), 10 (o), 20 (01, and 42 (m) monomolal (M, = 11 400). Solid lines result from fitting a Lorentzian and a base line to the data. The slowest process observed in spectral density has not been included in fit.
Table 4. Results from Fitting a Loremtdan and Baee Line to Spectral Densities of Concentrated (cp > &*) PEO
Solutions (See Figure 8).
cp (molal) xm (mz) +m (ne) Tt (pa) xm2/xP J(0). (8-9
1 10 1.4 5 0.0036 0.21 2 16.8 0.9 9.0 0.0098 0.11 5 9.7 2.4 7.8 0.0033 0.23 10 11.2 2.7 11 0.0043 0.63 20 10.9 4.8 20 0.0041 1.75 42 18.1 4.4 50 0.011 5.66
a Parameters xz, +, andJ(0) refer to the squared coupling constant, correlation time, and spectral deneity at ~0 = 0, respectively. Subscripts 8, m, and f denote 'slow", 'medium", and 'fast" processes. J(0). is calculated using eq 20.
The anisotropic rotational diffusion model cannot describe the spectral densities at cp > c**. A model which abstracts the internal polymer dynamics to a diffusion- in-a-cone14process was also unable to fit the data. In view of the data, the spectral density can however be described by a sum of Lorentzians and a baee line (Table 4). At least three dynamic processes are responsible for relaxation. These will henceforth be denoted by uslow", Ymedium", and "fast". Parameters relevant to any of these processes are identified by subscripts s, m, and f. The spectral

Macromolecules, Vol. 27, No. 6,1994
Table 5. Hydrodynamic Dimensiono Corresponding to the Rotational Diffusion Coefficients Found for the Polymer
Methylene Unite' temp ( O C ) n(H2O) (cP) radius* (nm) semilong axkc (nm)
Polymer Dynamics in Aqueous PEO Solutions 1361
Table 6. Correlation Times from Axially Symmetric Anisotropic Rotation Diffusion*
-5 2.12 0.6 1.1 5 1.53 0.6 1.1 15 1.14 0.5 1.1 25 0.89 0.5 1.0
a Dimensions result from best fib with D I I / D ~ = 20. Using Dll/Dl = 40, dimensions are increased by 25%. * Model a (eq 7): axially symmetric rotation diffusion. Model c (eq 9): spherical rotation diffusion combined with internal mode.
density takes the general form
with
where xi2 and T / are the squared coupling constant and the correlation time of the ith process, respectively. The variable Jf is a frequency-independent contribution due to rapid motions. It is fitted as a constant base line. Only one data point betrays the existence of a slow process, i.e., J(0). In a first attempt to fit, the latter contribution is omitted from the dataset and the medium and fast processes are fitted only. The parameters Xm and Tm can be determined unambiguously.
The parameters of the fast process (xf and q) cannot be determined independently from the spectral density. However, it shall be shown that xI is much smaller than both Xm and xf. In a first approximation one can therefore write
and rf can be estimated using eq 17. The exact value of T, is unknown, Le., in the sense that
it may lie in the range 40 ns < T~ < m, The shortest correlation time is determined by the weakest employed permanent magnetic field (4 MHz). To narrow this range, multiple-pulse quadrupole echo experiments were per- formed on the 42 monomolal sample. The method has been described by B1icharski.a The pulse spacing (Tspaca) was varied over 2 orders of magnitude; 40 ps I Tspace I 4000 ps. When T, << T ~ ~ ~ , no spacing dependence of the relaxation is expected (this was confirmed using D2O). In case of the polymer sample, the multiple quadrupole echo relaxation time and the transverse relaxation time T2 were equal within experimental error. This implies that T~ is much smaller than the shortest spacing time, i.e., the upper limit of T, may be set to, say, 10 ps. The correlation time T~ must therefore lie in, say, the 10 ps to 40 ns range. Approximate limits to the fraction of the coupling constant which is averaged out by the slow process can now be set. For the 42 molal solution, the ratio xB2/1.7 X 1062 may take values between 10-9 and 10-7, depending on the value of the correlation time. The relative smallness of x, justifies the assumption made to arrive at eq 18.
V. Discussion
V.l. Polymer Dynamics at c, < &*. In Figures 2 and 3 the relaxation rates, and therefore the internal polymer dynamics, are seen to be independent of cp and
polymer solvent TO (pa) TI (pa) TZ (pa) PEO-d4 Ha0 130 31 10 PEO-hr D20 1600 300 lija
a Correlation times taken from ref 21 and corrected for solvent viscosity effects using the ratio 1(H20)/9(DzO) = 1/1-23.
Mw throughout the dilute and semidilute regimes. That polymer motions are indeed independent of cp in the semidilute regime is most clearly illustrated by fraction d5 (Mw = 50000) where one has the largest difference between c* and c**. The Mw independence indicates that all dynamical processes of the polymer chain contributing to 2H-relaxation are determined by reorientation in the polymer on a local length scale. The cp independence of relaxation rates suggests that the size of the dynamical unit in the chain must be small compared to the average distance between entanglements since the reorientation within the polymer chain is unhindered by the initial onset of entanglements in the semidilute regime. A suggestion for the size of such a dynamical unit has been given in section IV.2.
The size of the dynamical unit is extracted from the anisotropy ratio Dll/Dl. At -5 and +5 "C the dispersions are sufficiently pronounced to quantify the anisotropy of the motions. The inset in Figure 5 shows that the quality of the fit is best using an anisotropy ratio of Dll/DL 20. The element Dll was oriented more or less along the backbone of the chain. The ratio between the diffusion constants directly reflects the fact that the relaxation rates are determined by dynamical processes occurring on widely different time scales. These dynamic modes may be directly ascribed to the intrinsic reorientational mobility of the polymer chain since the relaxation data were obtained well inside the cp- (and Mw-) independent range.
It is interesting to compare characteristic length scales obtained for PEO by various techniques. Static techniques such as light scatterings9 and SANS6 have shown that PEO has a characteristic ratio (R2)e/d2 of 5.5 in the quasi- unperturbed state. This corresponds to a Kuhn length, l k , of 1.0-1.2 nm. Interpreting our dynamic results with the isotropic overall rotation of a Kuhn segment combined with an internal mode (model c) produces a dynamic length scale which is consistent with these results. Although at -5 and +5 "C one is operating far from To, it is not expected that the Kuhn segment length is much larger than at the 8 temperature. The first reason is that an increase in excluded-volume effects at lower temperatures due to a better solvent quality is compensated by screening; at 0.5 monomolal one is operating close to c**. Second, the influence of the temperature on the intrinsic stiffness of the PEO chain is negligible: d ln(R)e/dT = 2.3 X 10-4.40
Our results may be compared with those obtained by Breen et from 'H-NMRon PEO-h4 in Dz0. Assuming all dynamic modes are in the hydrodynamic limit, cor- relation times from 'H-NMR have been corrected for solvent viscosity effects. This correction obtains legitimacy from the fact that the intrinsic viscosities of PEO in DzO and HzO are very similar (for Mw = 20 000, [VlDzO = 1.360, [V]HzO = 1.35441). The results are collected in Table 6.
For the dynamic interpretation of the lH data, knowl- edge of the total interaction Hamiltonian is a prerequisite. In a dilute polymer solution in DzO, where intermolecular spin-spin interactions are unimportant, the average in- teraction of a proton can be estimated using a rotational isomeric state model (RIS). The parameters used in the RIS model were taken from ref 39. The interaction ratio

1362 Bieze et al. Macromolecules, Vol. 27, No. 6, 1994
the principal axis of the 2H-EFG tensor. Accordingly, the spectral density of both the EFG and the intramolecular dipolar interaction should take similar values, irrespective of the details of the motion.48 The ratio of the corre- sponding relaxation rates reduces to the ratio of the coupling constants:
R2H 3 l,(2?rx)2 -= RIK A hyH2yc%CH4
between protons separated by 2 (geminal), 3 (viscinal), and 4 covalent bonds is 1:0.2:0.045. The lH results in Table 6 are based on calculations using the first two contributions and are taken from ref 21. Combining the facts that the deuteron coupling constant is known and that correlation times extracted from 'H- and 2H-NMR data are in agreement, one concludes that the application of an RIS model*2 can accurately determine the intramo- lecular dipolar coupling constants in a hydrogenous chain.
It has often been suggested that, in solution, PEO forms compact structuresu14 (aggregates) or retains some of the helix structure from the solid state. From the combined lH- and 2H-NMR results we can exclude the notion that an important part of the chains forms intimate structures of any sort. For if this were the case, a mismatch between the lH and 2H reduced spectral densities would be observed due to additional "-1H dipolar couplings between, e.g., neighboring polymer strands in a helical structure.
Although, in dilute solution, the 2H-spectral density does not allow an isotropic interpretation, the spins within a methylene unit show experimentally indistinguishable relaxation rates. It indicates that the two 2H-nuclei in a methylene unit have similar spectral densities. A pre- requisite for this experimental observation is that the principal axis of the diffusion tensor Dll must, on average, lie in the plane perpendicular to the line connecting the 2H-nuclei (i.e., in the xy-plane in Figure 2). It is only with this orientation of DIF with respect to REF that molecular motion will average the two EFG tensors with equal efficiency. This implies that the Euler angle /3 must take on a value of approximately 90". In fitting the ARDM to the data, it was found that Euler angles (a,/3) have values in the 80-90" range. This in turn means that the principal axis of the diffusion tensor (DIF) practically coincides with the local director of the polymer chain (Le., DIF lies along the y-axis in Figure 2). This is not an unreasonable solution, since it implies that the most rapid motions occur around an axis in the polymer where the lowest hydro- dynamic friction is expected.
Observing similar relaxation rates for geminal deuterons may be considered a special case, for there is ample experimental evidence which shows that nuclei in close proximity on a polymer chain can show different relaxation rates.10J5*45146 Two examples are as follows: (1) In a solution of poly(hydr0xybutyrate) in CDCl3, the 13C- longitudinal relaxation rates in neighboring CH and CH2 units in the polymer backbone differ by a factor 1.7 inetead of the expected factor 2.4' (2) The relaxation of methylene deuterons in semidilute aqueous poly(acry1ic acid)-CDz solutions is described by biexponential decay (with equal fractions). The above facts are considered to be strongly supportive for the notion that anisotropic diffusion must be, at least partly, responsible for polymer chain magnetic relaxation. Both these observations can be understood within the framework of the ARDM. If, for instance, conformational transition rates around a C-C bond in the backbone are hampered by steric constraints, anisotropic diffusion would have to reorient a somewhat larger rigid unit in the backbone. Since the various 13C-H internuclear vectors in such a unit do not coincide, the corresponding interaction tensors will be differently oriented with respect to the DIF. Accordingly, this will result in different relaxation rates because the dipolar interactions cannot be averaged with equal efficiency. V.2. Comparison of 142- and %-NMR at c, < e*.
The 13C-relaxation is dominated by intramolecular dipolar interaction with chemically attached hydrogen. Moreover, the principal axis of the interaction tensor coincides with
Carbon-13 relaxation rates from PEO oligomers ( N = 4, 6, 22, 360) solvated in D20 were previously reported by this group.21 These relaxation rates will be compared with 2H-relaxation rates determined in HzO. It is therefore necessary to correct for solvent viscosity effects on the relaxation. Taking e2qQ/h = 170 kHz and rCH = 1.09 A, one obtains
with A = 1, 2, and 3 for CH, CH2, and CH3 groups, respectively. The solvent viscosity ratio is denoted by s(H20)/q(D20).
To compare the main-chain dynamics, 2H-NMR relax- ation data from chains with N > 100 (Rt = 15.66 s-l) and 13C-relaxation data originating from a sample with N = 360 (R1= 1.8 s-l) were used. The experimental ratio R d R1, = 8.7 compares well with the predicted value 8.08 (eq 19 using A = 2).
The relaxation of deuterons on fraction d l ( N = 60) was nonexponential. Careful analysis of the long-time behavior of the longitudinal relaxation showed that part of the deuterons relax with arate 6 s-l. The relative contribution of this slowly relaxing component was small. The max- imum contribution of this fast dynamical process to the relaxation is estimated to be 10%. It is likely that rapid end-group motions are responsible for the nonexponential behavior. The end-group effects in the deuterium relax- ation can be estimated using 13C-relaxation rates from end-group carbon atoms in PEO oligomers (N = 4,9,22). Since the a and /3 end-group carbons are chemically shifted from the other C-atoms, their R1, values could be deter- mined independently. Their average relaxation rate value is 0.63 s-l. Using eq 19 one would expect a relaxation rate of 5.6 s-1 for the end-group deuterons. This compares well with the experimentally observed value of the slowly relaxing component in the deuterium relaxation (6 s-l). The relative amplitude of this exponent suggests that no more than 6 out of 60 monomers (3 each side) in the deuterated polymer show different dynamic behavior. This implies that deuterons situated as close as 4-5 monomers from the chain end have already acquired main-chain dynamical properties. V.3. Polymer Dynamics at c,, > e**. In Figure 6 it
is observed that all relaxation rates (Rid, Rzd,Rlh , andR2h) increase in the region cp > 2-3 monomolal. The reason for this effect will be discussed in what follows. The difference in rates of increase observed on polymers with varying length and isotopic composition will however be discussed in the next section. An increase in the relaxation rate reflects a decrease in mobility. For deuterons on a polymer, this is only expected to occur when dynamical units start to obstruct each other in their reorientational freedom. Mutual obstruction will start at a concentration where the volumes swept out by the hydrodynamic length ldyn are just interpenetrating (cp = cldp). Using the value

Macromolecules, Vol. 27, No. 6, 1994
found for ldyn in section IV.2 (1 nm), cld, is calculated to be 1.8 monomolal. This value is similar to the concen- tration at which the relaxation rates show an increase in rate. Since cld, scales with ldyn:, the latter concentration is very sensitive to the dynamic length.
Plotting cld, in Figure 1, it is clear that cld, and c** are similar. This is by no means coincidental. It is recalled that at c** all excluded-volume effects are to be screened. Excluded-volume effects exist only between segments separated by at least a persistence length 1, ( 1 , and l k are of the same order). At c** the polymer system has to be condensed to such a degree that the condition [ I l k is met. Here 5 is the correlation length of the network. In the present system one therefore has [ I 1 nm at c**. At this concentration the reorientation of a hydrodynamic unit with length ldyn must be obstructed by other segments.
The notion that the increase in relaxation rates is coupled to c** is in contrast with a previous report.4B It was suggested that the concentration where the NMR line width (NR2h) observed from PEO (M, = 3.7 X lo6) started to increase should be coupled to the overlap concentration c*. The increase in line width was observed at approx- imately 0.5 monomolal (22 g/dm3). In our opinion this concentration cannot correspond to c* (see Figure 1). Furthermore, the proton relaxation rates for hydrogenous polymer fractions presented in Figure 6 show that the point at which R2h increases is independent of M,. On the basis of ref 49, the contrary is expected. In section IV.3 it was shown that the increase in Rzh is partly due to additional (slowly modulated) intermolecular dipolar coupling. For fundamental reasons one would therefore expect the line width to be insensitive to c*, especially for longer chains. For c* only monomers in the outer regions of a polymer globule can participate in intermolecular interactions. The fraction of monomers in a position to yield R2h values which are larger than average can therefore be estimated from the surface/volume ratio of the polymer globule. Accordingly, this fraction will vary with approx- imately Mw4as, rendering proton relaxation insensitive to c* at large Mw.
In the 2H-spectral densities a t cp > c**, three correlation times can be identified (Le., T ~ , Tm, and Tf). In the case of diffusion, these correlation times refer to three inter- dependent correlation functions. With diffusion models, the relative contribution of these correlation functions is determined by the orientation of the diffusion frame with respect to the principal axis frame(s) of the EFG. Since diffusion models (ARDM and diffusion-in-a-cone model14) cannot describe the spectral densities at cp > c**, it must be concluded that, besides rotational diffusion, there is at least one other dynamic process driving the relaxation above c**.
As was remarked previously,ll highly condensed polymer solutions, including swollen cross-linked systems, show a high degree of internal mobility. Typically >95% of the interaction constant is averaged by motions with char- acteristic time scales T~ < 1O-g s. The significant base line under the dispersions in Figure 5 suggests that this is also the case in the present system. The base line is described by the parameters Xf and Tf. The relative importance of fast processes is quantified by the ratio xm2/xp (Table 4). These values show that, even a t 42 molal, 98% of the quadrupole interaction is averaged out in the subnano- second time domain. Interestingly, the fast motions are very sensitive to cp; Tf increases by an order of magnitude on concentrating PEO from 1 to 42 molal.
In principle, librational motions could contribute to the relaxation.6 A conformational jump model expanded with
Polymer Dynamics in Aqueous PEO Solutions 1363
a librational mode has been used to describe the 13C- spectral density (in the spectral region wo > lo7) in semidilute and concentrated polymer solutions.~~s1 In order to proceed unhindered, librational motions are less demanding for space compared with motions which reorient complete segments. One would therefore expect librational motions to be rather insensitive to the onset of entanglements. This is however not what is observed in Figure 5 and Table 4.
The height of the 2H-spectral density Lorentzian(s) related to the slow motions is calculated according to:
(20)
In Table 4 it is seen that this height increases by more than an order of magnitude in the concentration range studied. Since J(O), is M,-independent, it is unlikely that C-D bond reorientations caused by translational motions over long distances induce relaxation. However, trans- lational diffusion over distances small enough to be independent of the chain length may be important. This has previously been suggested by CallaghanS2 in discussing lH-relaxation observed from polyethylene and PEO melts. The dispersions show a M,-independent correlation time: T~ (1-2) X s. The correlation time is suggested to be caused by semilocal reptational motion on a small distance scale. This motion would not displace the center of mass of the chain. Other experimental evidence which confirms that polymer movements over small distances are indeed Mw-independent comes from incoherent neu- tron scattering experiments2 on a 50 monomolal PEO-hd solution in D20 at 60 OC. Although the resolution was low, D e f f was shown to be M,-independent in the 0.46 A-l I Q I 2.19 A-l momentum transfer ran e. This corre-
T~ found by Callaghan is within the experimental limits we found for the slow process T~ in section IV.4. If the dispersions in 2H- and lH-spectral densities reflect the same dynamical process, it implies the M,-independent correlation time observed in the latter J ( w ) curve is due to an intramolecular interaction.
In Table 4, xm and Tm are increased as a function of concentration by factors of 2 and 3, respectively. Ac- cordingly, the corresponding dispersion must be catego- rized as insensitive to changes in polymer volume fraction. Below c*, the dispersion is identified with the reorientation of a dynamic unit. At c, > c** it may tentatively be identified with the hindered (partial) reorientation of such a unit.
V.4. Comparing 'H- and "-NMR at c, > e*. In Figure 6 the relative increases of relaxation rates from deuterated and protonated polymers are plotted together for a number of fractions. Rates have been divided by the corresponding values at 0.1 mold (Rho and &do). The relative longitudinal relaxation rates RlhIRlhO and Rld Rldo are independent of isotopic composition and show a similar cp dependence in all concentration regimes. The relative transverse relaxation rates are different in that the dependence of R2dR2ho on c p is more pronounced than that of R2JR2d0 in the concentrated regime. Furthermore, the transverse relaxation rates from protonated polymers become molecular weight dependent. Liu and Ullmad3 qualitatively rationalized this M, dependence by envisaging an entangled system in which the average local monomeric motion was strongly influenced by the chain- end effects. In view of our 2H-NMR data, covering a wide Mw range, end-group dynamics prove to be unimportant. The molecular weight dependence observed in 'H-NMR at cp > c** must be due to both the nature of the 'H-
J(O)a = J(O)e,p - [J(O)m + Jtl
sponds to a distance scale of order 2-10 x . The value of

1364 Bieze et al.
relaxation mechanism and the topology of the chains at cp > c**. In highly condensed polymer systems intermo- lecular dipole-dipole interactions may be important. For the intermolecular dipolar interaction to be averaged, the chains have to move with respect to each other. Full averaging of this interaction cannot be accomplished by rotational dynamics of individual segments alone. In contrast to dilute and semidilute solutions, proton relax- ation may become dependent on relative polymer motions and therefore may become sensitive to the molecular weight.
The effect of intermolecular dipolar interactions on the "-relaxation is demonstrated in Figure 7. This figure shows the IH-relaxation rates as a function of the isotopic composition of the matrix, Xd. On substituting protonated with deuterated polymers, (&,)a decreases. From this observation one can draw the conclusion that intermo- lecular dipolar interactions contribute significantly to proton relaxation at high volume fractions. Furthermore, because no effect is observed on (Rlh)d, one can conclude that these intermolecular interactions are modulated primarily at a time scale T 5 10-8 s.
The low-frequency part of the "-spectral densities of polymer melts has been extensively probed using field- cycling54 and spin-lock method~.~2~55 A slow dynamic mode which is proportional to Mw3 has been singled out in this spectral region. The corresponding correlation time is thought to reflect the tube disengagement time (reorien- tation of the end-to-end vector of a constraint polymer). Our results unambiguously show that intermolecular dipole-dipole interactions are important. It may be assumed that the general properties regarding polymer dynamics in a polymer melt and in concentrated solutions are comparable since both systems are entangled.
In the Introduction it was noted that both diffusive and nondiffusive models are used to describe polymer motions. A fundamental difference between the two categories is that models in the former category recognize the tensor properties of both the nuclear interaction and diffusional process. As a result, dynamic processes observed in the spectral density are interdependent. The relative ori- entation of the above-mentioned tensors dictates the relationship between these processes (eq 5). In nondif- fusional models, dynamic modes playing a role in averaging the nuclear interaction usually enter into the spectral density formula as independent isotropic entities. Hence, the nuclear interaction is treated as a constant, rendering these models insensitive to variations in the orientation of interaction tensors with respect to the molecular framework. Since our understanding of internal polymer motions is still rather rudimentary, it is important to shed light on this fundamental difference before one gets involved in more detailed descriptions. At this point it would therefore be interesting to compare the shape of the spectral densities obtained from two different nuclei fixed to an anisotropically reorienting body. I t is essential that both their nuclear interactions are intramolecular and that their respective interaction frames have different orientations with respect to the diffusion tensor. In the hydrogenous polymer (PEO-hd), the intramolecular dipolar principal axes lie along the geminal and viscinal 'H-lH internuclear vectors. In PEO-d4 the principal axis of the D quadrupolar interaction tensor lies along the C-D axis and, hence, does not coincide with the former (dipolar) interaction tensors. In order to obtain proton relaxation rates which are solely driven by intramolecular interac- tions, one could exploit the isotopic mixtures. From the fact that (R2h)d in Figure 7 decreases linearly with X d , one
Macromolecules, Vol. 27, No. 6, 1994
can conclude that the isotopically dissimilar polymers are homogeneously dispersed. Extrapolating to xd - 1 in Figure 7 will therefore yield the R2h value in a 10.5 molal solution devoid of intermolecular dipolar interactions.
In the relaxation formulae for spins of type lH and 2H, the value of J ( w ) at frequencies 0, wo, and 2w0 is weighted in an identical manner (see eqs 2 and 3). Accordingly, differences in shapes between the reduced 'H- and 2H- spectral densities may be detected by comparing the ratios (R2hlRlh)d at x d - 1 and RM/Rld. These ratios represent the ratio of two different spectral density combinations (for R1 and R2, respectively) and coupling constants are eliminated. These ratios are identical in a limited number of cases only:
(1) Motions are isotropic; Le., tensor properties of the nuclear interaction are irrelevant.
(2) Certain backbone motions may average differently oriented interaction tensors with equal efficiency. If, on the other hand, the ratio
significantly deviates from unity, the anisotropic diffuiue nature of polymer motions can be established unambig- uously. In the presence of anisotropic motion, values larger and smaller than unity may be expected. From eqs 14 and 15 and Figure 7, the above ratio is found to be 1.151 1.06 = 1.08 f 0.1. It is therefore concluded that the reduced 'H- and 2H-spectral densities are approximately similar. In view of the experimental accuracy, no firm assessment can be made as to whether ratio eq 21 deviates from unity. Accordingly, no definitive stance is taken regarding the diffusive vs nondiffusive nature of the polymer motions in the concentrated regime. More conclusive results may however be expected from PEO melts. Such systems have a number of advantages over the presently used (10.5 molal) solutions: (1) The anisotropy is amplified, (2) the (R2h)d dependence on Xd is increased (hence reducing extrapolation errors in (&h)d, Xd - 11, and (3) segregation problems arising from the fact that concentrated PEO solutions have a lower critical solution temperature (LCST) are circumvented.
Above the LCST, mixtures of hydrogenous and deu- terated polymers are still prone to segregation due to the existence of a small interaction parameter between the isotopically dissimilar monomers. The Flory-Huggins parameter is on the order 103.23 In practice, considerable interpenetration is still possible as long as large values for N and/or cp are avoided.@15~ It has been shown that, at high volume fractions, phase separation in mixtures of hydrogenous and perdeuterated polymers can start with the formation of domains.58 We suggest that a novel method to monitor their (initial) growth may be to monitor the lH transverae relaxation. Since the polymers are initially dispersed, the formation of domains containing highly condensed hydrogenous material will initially result in a large increase in the number of intermolecular 'H-" interactions. Accordingly, a substantial effect on the transverse relaxation rates may be expected. V.5. Temperature Dependence of Rotational Mo-
tions. In Figure 9, the Rld values obtained from 0.5 and 10 molal solutions (d4) in pure water have been plotted as a function of 1IT. Both the concentrated and dilute solutions appear to adhere to Arrhenius' law in the temperature range studied. The slope in the concentrated solution is much larger than that in the dilute solution.

Macromolecules, Vol. 27, No. 6, 1994 Polymer Dynamics in Aqueous PEO Solutions 1365
fractions 0.06 and higher (below the dashed line), much larger activation energies are found. In this region E , is larger by nearly an order of magnitude. The data in Ta%le 7 are obtained from different polymer-good solvent systems. It is suggested here that, in discussing E , for polymer solutions, one may abstract from the precise chemical structure of chain and solvent and focus on the volume which is available for segmental reorientation. The increase in activation energy can be qualitatively under- stood by comparing the two length scales which charac- terize a polymer solution at high concentrations; the dynamic length ldyn and the correlation length of the network f'. At the present level of discussion we assume that the dynamic length of the different polymers in Table 7 are comparable since all polymers are single-bonded flexible chains. Admittedly, rotational potentials in the various backbones are different. However, the absence of rigid structures (e.g., multiple bonds, benzene groups) or electrostatic repulsive forces in the backbone ensures that the persistence lengths of the various chains are similar. In the region where ldyn < f , segment tumbling is possible. Segments behave as if they were reorienting in a sphere with diameter Once ldyn > f', unhinderedreorientation is no longer possible and one expects the nature of dynamics to change fundamentally; in section IV.4 it was shown that anisotropic rotational diffusion can no longer describe the segment reorientation.
VI. Conclusions The shape of the 2H-spectral density from dilute and
semidilute PEO solutions can be explained by anisotropic reorientation of the C-D bond. One can envisage this process as isotropic reorientation combined with a rapid internal mode. The diffusion coefficients are coupled to a hydrodynamic particle. The diameter of this particle, ldyn, is similar to the length of a Kuhn segment. This result supports the conclusions reached before by analysis of the lH-spectral density from hydrogenous PE0.21 Both the lH- and 2H-spectral densities show the polymer dynamics to be weakly anisotropic. This reflects the intrinsic flexibility of the PEO chain.
The concentration at which mutual obstruction between units of length l d p . is inevitable has been defined as c . values of cldyn and c** are similar and are indeed expected to be so for fundamental reasons. In general, concentra- tion-dependent relaxation measurements from polymer- backbone nuclei may therefore be used as an alternative method to establish c**. Accordingly, the size of the dynamic unit in a polymer chain could be estimated from the point at which relaxation rates become concentration dependent. Since cldyn scales with ldyn3, the dynamic length ldyn is insensitive to errors in the determination of Cdyn.
The fact that the internal polymer dynamics changes fundamentally in the concentrated regime is reflected by the fact that the activation energies of the internal polymer mobility increase dramatically upon condensing these systems to cp > c**.
In the regime cp > c** , the "-relaxation becomes relatively more enhanced when compared with the 2H- relaxation. By isotopically diluting the hydrogenous chain in a deuterated matrix, it was shown that the responsible dynamic process is an intermolecular dipole- dipole interaction modulated on long time scales.
At thy. an increase in the relaxation rates is observed. T k e
Acknowledgment. J. E. Enderby and P. S. Salmon are gratefully acknowledged for providing deuterated polymer material. J. J. M. Joordens (NMR facilities at
4.5 1
4.0 I /Ji 3.5
B m3.0 0 - 2.5
2.0
1.5 L 1
2.9 3.0 3.1 3.2 3.3 3.4 3.5 3.6 3.7
1000/T (K.') Figure 9. Temperature dependence of deuteron relaxation (Ru) in 0.5 (A) and 10 (0) monomolal PEO solutions in water.
Table 7. Segmental Activation Energies Calculated with Eq 24
-(C(CHa)HOHCH2COO)n- 9 9
0.06 12.9 0.12 12.9
-(CH2CH(OCHs))n- 50 0.125 9.2 -(CDzCD20).- this work 0.33 10.3
* Ref 7 1%-NMR, 1 % (w/v) POM in phenol-de. Ref 9 6% and 12% (w/v) PHB in chloroform-d. Activation energy calculated from relaxation data in Table 1. Ref 50 2H-NMR, 15% (w/w) PVME in chloroform-d.
These slopes lead to apparent activation energies of 18.7 (0.5 molal) and 27.8 kJ mol-l(l0 molal). Evaluation of R2 data gives similar results.
The fact that the viscosity-corrected reduced spectral densities of PEO-dJH20 and PEO-hJD20 are very similar (in dilute systems), suggests that the bulk of the motions are controlled by viscous forces. The activation energies shall therefore be interpreted with the aid of Kramers' theory.sg This theory has been developed for the diffusion of a particle over a potential barrier. For a dynamic process crossing an energy barrier E* in a hydrodynamic regime one can write
7, = qC exp(EL,lRT) (23)
Assuming that the activation energy for segmental motion is linearly increased by the activation energy of the solvent viscosity, E,, the former can be estimated by:
E:, = E,, - E , with E , = 17.5 kJ mol-' for water (24)
Application of eq 24 to the experimental activation energies yields interesting results. In Table 7 these are presented along with some values found in the literature. For comparison, all concentrations have been converted to polymer volume fractions. Entries in Table 7 below the dashed line refer to solutions with volume fractions (4) larger than 0.05, this value for 9 corresponding to the lower limit estimated for c** in Figure 1.
Relaxation data obtained from dilute and semidilute polymer solutions yield activation energies which are practically equal to the pure solvent values. At volume
1366 Bieze et al. Macromolecules, Vol. 27, No. 6, 1994
Nijmegen University) is thanked for technical assistance.
References and Notes (1) Bovey, F. A,; Jelinski, L. W. J. Phys. Chem. 1985,89, 571. (2) Maconnachie, A.; Vasudevan, P.; Allen, G. Polymer 1978,19,
(3) Yamakawa, H. Modern Theory of Polymer Solutions; Harper
(4) Devand, K.; Selser, J. C. Macromolecules 1991,24,5943. (5) Kugler, J.; Fischer, E. W.; Peuscher, M.; Eisenbach, C. D.
(6) Howarth,O. W. J. Chem. Soc.,Faraday Trans.2 1980,76,1219. (7) Fuson, M. M.; Anderson, D. J.; Liu, F.; Grant, D. M. Macro-
(8) Grandjean, J.; Sillescu, H.; Willenberg, B. Makromol. Chem.
(9) Dais, P.; Nedea, M. E.; Marchessault, R. H. Polymer 1992,33
(10) Dais, D. P.; Nedea, M. E.; Morrin, F. G.; Marchessault, R. H.
(11) Cohen-Addad, J. P.; Faure, J. P. J. Chem. Phys. 1974,61,2400. (12) English, A. D.; Dyboweki, C. R. Macromolecules 1984,17,446. (13) English, A. D. Macromolecules 1985,18, 178. (14) Fujiwara, T.; Nagayama, K. J. Chem. Phys. 1985,83 (6), 3110. (15) vanRijn,C.;Jesse,W.;deBlejrser,J.;Leyte,J.C.J. Phys.Chem.
1987,91, 203. (16) Schriever, J.; Leyte, J. C. Magnetic Resonance and Related
Phenomena; Nottingham University: Nottingham, U.K., 1974; p 515.
(17) Mulder, C. W. R.; Schriever, J.; Leyte, J. C. J. Phys. Chem. 1985, 89, 475.
(18) Kielman, H. S.; Leyte, J. C. Ber. Bunsen-Ges. Phys. Chem. 1975, 79, 120.
(19) Mulder, C. W. R.; Leyte, J. C. J. Phys. Chem. 1985, 1007. (20) van Rijn, C.; de Blejber, J.; Leyte, J. C. Macromolecules 1987,
33.
& Row: New York, 1971.
Makromol. Chem. 1983,184,2325.
molecules 1991,24, 2594.
1977,178, 1445.
(20), 4288.
Macromolecules 1989,22, 4208.
20. 1248. 7
(21) Breen, J.;vanDuijn,D.;deBlejwr, J.;Leyte, J. C.Ber.Bundes-
(22) Doi, J.; Edwards, S. F. The Theory of Polymers Dynamics; Ges. Phys. Chem. 1986,90,1112.
Oxford university Press: New York; 1986. (23) de Gennes, P.-G. Scaling Concepts in Polymer Physics; Cornel1
(24) Devand, K.; Selser, J. C. Nature 1990,343,739. (25) Beech, D. R.; Booth, C. J. Polym. Sci., Polym. Phys. Ed. 1969,
(26) Bovey, F. A.; Jelinski, L. W. J. Phys. Chem. 1985,89,571. (27) Ying, Q.; Chu, B. Macromolecules 1987,20, 362. (28) Graessley, W. W. Polymer 1980,21, 258. (29) Eieenbach, C. D.; Peusher,M.; Wegner, G.; Weiss, M. Makromol.
(30) Demco, D. E.; van Hecke, P.; Waugh, J. S. J. Magn. Reson.
University Press: Ithaca, NY, 1979.
7, 575.
Chem. 1983,184,2313.
1974, 16, 467.
(31) Carr, H. Y.; Purcell, E. M. Phys. Rev. 1954,94,630. (32) Meiboom, S.; Gill, D. Rev. Sci. Instrum. 1958,29, 688. (33) Bodenhausen, G.; Freeman, R.; Turner, D. L. J. Magn. Reson.
(34) Abragam, A. A. Principles of Nuclear Magnetism; Oxford
(35) Spiess, H. W. Dynamic NMR Spectroscopy; Springer-Verlag:
(36) Perrin, F. J. Phys. Radium 1934, 7 (lo), 497. (37) deVringer,T.; Joosten, J. G. H.; Junginger, H. E. Colloid Polym.
(38) Blicharski, J. S. J. Can. Phys. 1986, 64, 733. (39) Abe, A.; Tasaki, K.; Mark, J. E. Polym. J. 1985, 17, (7), 883. (40) Flory, P. J. Statistical Mechanics of Chain Molecules; Wiley:
(41) Experiments done in this laboratory. (42) Tasaki, K.; Abe, A. Polym. J. 1985, 17 (4), 641. (43) Polik, W. F.; Burchard, W. Macromolecules 1983, 16,978. (44) de Gennes, P.-G. Pure Appl. Chem. 1992,64 ( l l ) , 1585. (45) Gronski, W. Macromol. Chem. 1976,177,3017. (46) Dais, D. P.; Nedea, M. E.; Morrin, F. G.; Marchesaault, R. H.
(47) Nedea, M. E.; Marchessault, R. H.; Dais, P. Polymer 1992,33
(48) Breitmaier, E.; Voelter, W. Carbon-13 NMR Spectroscopy;
(49) Meyer, C. T.; Cohen-Addad, J. P.; Boileau, S. Polymer 1978,19,
(50) Dejean de la Batie, R.; Laupretre, F.; Monnerie, L. Macro-
(51) Dejean de la Batie, R.; Laupretre, F.; Monnerie, L. Macro-
(52) Callaghan, P. T. Polymer 1988,29,1951. (53) Liu, K. J.; Ullman, R. J. Chem. Phys. 1968,48,1158. (54) Kimmich, R. Polymer 1977, 18, 223. Kimmich, R. Polymer
1977,27, 511.
University Press: New York, 1961; Chapter VIII.
New York, 1978; p 203.
Sci. 1986, 264, 623.
New York, 1969; p 46.
Macromolecules 1990,23, 3387.
(9), 1831.
VCH New York, 1987; p 180.
1107.
molecules 1988,21, 2052.
molecules 1988,21, 2045.
1984.25. 187. (55) Huirua, T. W. M.; Wang, R.; Callaglum, P. T. Macromolecules
1990,23,1658. (56) 20 monomolal solutions with isotropic compositions 0.5 5 Xd 5
0.9 did not homogenize. The fact that the phase diagram is not centered around Xd = 0.5 is qualitatively in accordance with expected positioning of the free energy curve for mixtures of asymmetrical polymers. Comparing our system (Nh >> Nd) with the symmetrid case (& = Nd), the minimum of the epinodal curve is expected to shift toward the region richer in the smaller component (fraction d4).
(57) de Gennes, P.-G. J. Polym. Sci. 1978, 16,1883. (58) Bates, F. S.; Wignall, G. D.; Koehler, W. C. Phys. Rev. Lett.
(59) Kramers, H. A. Physica 1950, 7, 248. 1985,55,2425.