Embed Size (px)
Citation preview

The Pennsylvania State University
The Graduate School
College of Earth and Mineral Sciences
POLYMER SWELLING EFFECTS ON MECHANICAL AND ELECTROCHEMICAL
PROPERTIES FOR BATTERY ADHESIVES AND ION EXCHANGE MEMBRANES
A Thesis in
Material Science and Engineering
by
Jiho Seo
2016 Jiho Seo
Submitted in Partial Fulfillment
of the Requirements
for the Degree of
Master of Science
May 2016

ii
The thesis of Jiho Seo was reviewed and approved* by the following:
Michael A. Hickner
Associate Professor of Materials Science and Engineering
Thesis Advisor
Ralph H. Colby
Professor of Materials Science and Engineering and Chemical Engineering
Charles E. Bakis
Distinguished Professor of Engineering Science and Mechanics
Suzanne Mohney
Professor of Materials Science and Engineering and Electrical Engineering
Head of the Department of Material Science and Engineering
*Signatures are on file in the Graduate School

iii
ABSTRACT
This thesis presents two main research thrusts based on polymer swelling effects in different
environments. The first topic focuses on the mechanical properties of epoxy adhesives swollen in
electrolyte solutions to use for bonding lithium ion battery-based sandwich structures. The second
topic describes the electrochemical properties of photocurable micro-patterned anion exchange
membranes in terms of water uptake, permselectivity, and ionic resistance.
Electrolyte Resistant Epoxy for Bonding Battery-Based Sandwich Structures
Organic solvent resistant, or more specifically Li-ion battery electrolyte resistant, bonding agents
are required to realize the potential of new battery designs that integrate structural elements with
energy storage functions. In this work several plastics (ABS, Nylon6, Nylon6/6, HDPE, LDPE,
Noryl PPO, PLA, PP, PS, UHMWPE), commercial adhesives (Epoxy 9462, E-120HP, 608, E-
05MR, Urethane U-05FL, Acrylics 3151), and sealants (Silicone 9-1363, RTV6700, RTV Blue)
were investigated as structural materials to bond a sandwich panel based on a Li-ion battery
architecture. First, conventional gravimetric electrolyte uptake measurements were conducted and
compared with Hansen solubility parameters to predict long-term durability of the materials in a
battery electrolyte environment. Second, the durability of adhesively-bonded joints with epoxy
adhesive E-120HP, which was selected as the lowest uptake adhesive (less than 10 wt% uptake in
a ethylene carbonate/dimethyl carbonate (EC/DMC) mixture), were examined using single lap
shear strength tests and three-point bending tests in a fabricated panel. The lap joint shear strength
of E-120HP decreased after exposure to the EC/DMC mixture with and without LiPF6 salt due to
electrolyte uptake in the bond. The addition of LiPF6 to the EC/DMC mixture severely decreased
the lap shear strength with respect to the pure solvents. Nevertheless, those lap shear strengths
were great enough for the sandwich structure application (>5 MPa). In device testing, the

iv
sandwich structure did not show any visible damage or leakage even when loaded to slightly
above 1000 N during three-point bending tests of the entire battery. Lastly, from sol extraction
tests and differential scanning calorimetry analyses, the optimized curing temperature range for
the epoxy adhesive E-120HP was revealed to be from 80°C to 100°C. In this range of
temperatures, the cured epoxy adhesive had a highly crosslinked structure with low sol extraction
and high conversion with no detectable residual cure.
3D Printing of Micro-patterned Anion Exchange Membranes
Micro-patterned anion exchange membranes have been 3D printed via a photoinitiated free
radical polymerization and quaternization process. The photocurable formulation, consisting of
diurethane dimethacrylate, poly(ethylene glycol) diacrylate, dipentaerythritol penta-/hexa-
acrylate, and 4-vinylbenzyl chloride, was directly cured into patterned films using a custom 3D
photolithographic printing process. Measurements of water uptake, permselectivity, and ionic
resistance were conducted on the quaternized poly(DU-co-EG-co-VBC) samples to determine
their suitability as ion exchange membranes. The water uptake of the materials increased as the
ion exchange capacity (IEC) increased due to greater quaternized VBC content. Samples with
IECs from 0.98 to 1.63 meq/g were possible with the VBC content ranging from 15 to 25
weight %. The water uptake was sensitive to the amount of PEG in the sample with membranes
showing water uptakes from 85 to 410 weight % with PEG fractions from 0 to 60 weight %. The
permselectivity of the anion exchange membrane samples decreased from 0.91 (168 weight %,
1.63 meq/g) to 0.85 (410 weight %, 1.63 meq/g) with increasing water uptake and to 0.88 (162
weight %, 0.98 meq/g) with decreasing IEC. These results were relatively consistent with the
general view of permselectivity being correlated to the water uptake and ion content of the
membranes. Lastly, it was revealed that the ionic resistance of patterned membranes was lower
than that of flat membranes at the same material volume. A parallel resistance model was used to

v
explain how the patterning contributed to the overall measured membrane resistance. This model
may provide a way to maximize the membrane’s performance by optimal patterning on the
surface without chemical modifications of the membrane structure.

vi
TABLE OF CONTENTS
List of Figures ........................................................................................................................ viii
List of Tables ......................................................................................................................... iv
Acknowledgements ................................................................................................................ x
Chapter 1 Introduction ............................................................................................................. 1
Chapter 2 Literature Review .................................................................................................... 2
2.1. Introduction ............................................................................................................... 2
2.2. Thermodynamics Background .................................................................................. 2
2.2.1. The swelling equilibrium of a cross-linked polymer ...................................... 2
2.2.2. Osmotic force of mixing ................................................................................ 3
2.2.3. Elastic force of a cross-linked network .......................................................... 8
2.3. Lithium Ion Battery ................................................................................................... 10
2.3.1. Introduction .................................................................................................... 10
2.3.2. Structure of a lithium ion battery ................................................................... 12
2.3.3. Epoxy adhesive system for structural bonding in batteries ............................ 14
2.4. Ion Exchange Membrane .......................................................................................... 16
2.4.1. Introduction .................................................................................................... 16
2.4.2. Ionic conductivity and Ohm’s law ................................................................. 17
2.4.3. Electrochemical potential and the Donnan equilibrium ................................. 18
2.5. References ................................................................................................................. 20
Chapter 3 Electrolyte Resistant Epoxy for Bonding Battery-Based Sandwich Structures ...... 22
3.1. Introduction ............................................................................................................... 22
3.2. Experimental Procedure and Characterization .......................................................... 23
3.2.1. Materials ......................................................................................................... 23
3.2.2. Electrolyte Uptake of General Purpose Polymers .......................................... 24
3.2.3. Electrolyte Uptake of Commercial Adhesives ............................................... 24
3.2.4. Tensile Strength Measurement ....................................................................... 25
3.2.5. Single Lap Shear Strength Measurement ....................................................... 26
3.2.6. Gel Fraction .................................................................................................... 27
3.2.7. Differential Scanning Calorimetry Analysis .................................................. 28
3.3. Result and Discussion ............................................................................................... 28
3.3.1. Gravimetric Swelling and Hansen Solubility Parameter ................................ 28
3.3.2. Tensile Strength and Single Lap Shear Test .................................................. 35
3.3.3. Sol Extraction Test / Differential Scanning Calorimetry ............................... 38
3.4. References ................................................................................................................. 44
Chapter 4 3D Printing of Micro-patterned Anion Exchange Membranes ............................... 46
4.1. Introduction ............................................................................................................... 46
4.2. Experimental Procedure and Characterization .......................................................... 48
4.2.1. Materials ......................................................................................................... 48

vii
4.2.2. Printing and Quaternization of AEMs ............................................................ 48
4.2.3. FT-IR Characterization .................................................................................. 49
4.2.4. Water Uptake.................................................................................................. 50
4.2.5. Permselectivity ............................................................................................... 50
4.2.6. Ionic Resistance .............................................................................................. 52
4.3. Result and Discussion ............................................................................................... 53
4.3.1. Membrane Printing Parameters ...................................................................... 53
4.3.2. Water Uptake.................................................................................................. 57
4.3.3. Permselectivity ............................................................................................... 59
4.3.4. Ionic Resistance and Patterning Effect ........................................................... 61
4.4. References ................................................................................................................. 67
Chapter 5 Conclusions and Future Work ................................................................................. 69
5.1. Electrolyte Resistant Epoxy for Bonding Battery-Based Sandwich Structures ........ 69
5.1.1. Conclusions .................................................................................................... 69
5.1.2. Future Work ................................................................................................... 69
5.2. 3D Printing of Micro-patterned Anion Exchange Membranes ................................. 70
5.2.1. Conclusions .................................................................................................... 70
5.2.2. Future Work ................................................................................................... 71

viii
LIST OF FIGURES
Figure 2.1. Two dimensional lattice representation of a polymer solution. ............................. 4
Figure 2.2. Scheme of a polymer network; two types of chains in a network. ........................ 9
Figure 2.3. Depiction of the charge-discharge operations of Li-ion cells. ............................... 11
Figure 2.4. Alkyl carbonates used for Li-ion battery electrolyte solutions. ............................. 12
Figure 2.5. (a) simplified view of a cylindrical Li-ion battery cell; (b) an enlarged view of
a representative volume of the cylindrical Li-ion battery cell.......................................... 13
Figure 2.6. Epoxy reaction with secondary amine. .................................................................. 14
Figure 3.1. (a) Geometry of tensile strength test specimen; (b) Prepared specimen. ............... 25
Figure 3.2. (a) Geometry of lap shear strength test specimen; (b) Prepared specimen. ........... 26
Figure 3.3. Two dimensional Hansen space with general polymers. ....................................... 31
Figure 3.4. Solvent uptakes of general polymers at room temperature for a week. ................. 32
Figure 3.5. Solvent uptakes of commercial bulk adhesives at room temperature for 3
weeks. ............................................................................................................................... 34
Figure 3.6. Tensile strengths of E-120HP and Epoxy 9462; pristine and soaked in
EC/DMC mixture at room temperature for a week. ......................................................... 35
Figure 3.7. Lap shear strengths of E-120HP under electrolyte conditions. ............................. 37
Figure 3.8. Swelling ratios of E-120HP in DMC, EC/DMC, and 1M LiPF6-EC/DMC. ......... 37
Figure 3.9. Toluene uptake ratios of E-120HP at room temperature for 2 weeks. .................. 39
Figure 3.10. (a) Residue; (b) Gel fraction of E-120HP immersed in toluene at room
temperature for 2 weeks. .................................................................................................. 40
Figure 3.11. DSC curves of uncured and cured E-120HP at different temperatures for 24
hours. ................................................................................................................................ 42
Figure 3.12. Photographs of the sandwich panel. (a) End view; (b) The assembled
structure. ........................................................................................................................... 43
Figure 4.1. Schematic of the cell for measuring membrane permselectivity. .......................... 52
Figure 4.2. Schematic diagram of the cell for measuring membrane ionic resistance. ............ 53

ix
Figure 4.3. Schematic diagram of the projection setup ............................................................ 55
Figure 4.4. (a) Example patterns; and (b) resulting cross-sectional views of the cured
membrane profiles. ........................................................................................................... 55
Figure 4.5. Photographs of example patterned membranes. .................................................... 56
Figure 4.6. FT-IR spectra of poly(DU-co-EG-co-VBC) and the quaternized membrane. ....... 57
Figure 4.7. Water uptake vs. PEG/PDU ratio of quaternized poly(DU-co-EG-co-VBC). ...... 59
Figure 4.8. Permselectivity vs. water uptake for quaternized poly(DU-co-EG-co-VBC). ...... 60
Figure 4.9. Photomicrographs of flat and patterned membranes along with pattern
schematic; the individual pattern’s size was 1.0 mm × 1.0 mm and the area ratio was
1:1. ................................................................................................................................... 62
Figure 4.10. Measured resistance of patterned and flat membranes. ....................................... 62
Figure 4.11. (a) Schematic cross-section of a patterned membrane showing base and
raised sections; and (b) the parallel resistance model corresponding to areas of low
(bases) and high (patterns) resistance. ............................................................................. 63
Figure 4.12. Calculated resistance of patterned membranes compared to that of flat
membranes as functions of thickness and area ratios. ...................................................... 65
Figure 4.13. Measured resistance of flat and patterned membranes; the hollow dots
indicate the estimated patterned membrane’s resistance based on the parallel
resistance model. .............................................................................................................. 66

x
LIST OF TABLES
Table 3.1. Hansen solubility parameters of the polymers tested in this study ......................... 30
Table 4.1. Compositions of the 3D printed anion exchange membranes. ................................ 54

xi
ACKNOWLEDGEMENTS
First of all, I would like to express my sincere gratitude to my thesis advisor Prof.
Hickner for the continuous support of my research. His guideline has been really helpful to study
my projects and to write this thesis. For last two years, he has always encouraged me with
positive words on my research results. I strongly believe that the encouragement was my major
motivation to complete this thesis. I remember that he told me my research should be fun in his
group when I got an admission letter from him. As he said, the research experience was really
happy time in my life.
I would also like to thank my fellow labmates in the Hickner group; Sean, Doug, T.J.,
Liang, Harrison, and Jing. I thank them for helping me in a lab, for teaching me how to use
equipment, and for letting me know the life in the United State. I specially thank to Garrett even
though he is not in the Hickner group now. I remember Garrett was always kind to me and we
achieved a lot of works together in the 3D printing lab. I will not forget the beautiful days.
I need to thank my Korean friends I made in the Penn State University; Hongyeon,
Changwoo, and Minkyu. They offered me many valuable advices for classes as well as helping
me to survive in the United State. I know that I could not make any achievements without them.
Also, I specially thank to Ahrang for cheering me up when I had a hard time.
Last but not least, I must express my profound gratitude to my parents and my sister for
providing me with unfailing support throughout my years of study. They always believe me in
any situations. That was my reason how to overcome obstacles I faced in my life. I really
appreciate them making me a stronger man. This accomplishment would not have been possible
without them. I want to express my love in this thesis. I promise that I will do my best as their son
and brother during the rest of my life.

1
Chapter 1
Introduction
In the field of high molecular weight polymers and polymer networks, there are
numerous examples of highly solvent-swellable materials that absorb solvents without dissolving
such as vulcanized rubber, vinyl-divinyl copolymers, and lightly gelled thermosetting resins. The
degree of swelling typically depends on the solvent and the structure of the polymer. In the
swollen state, the original shape of the polymer is preserved while the swollen gel exhibits elastic
behavior rather than plastic properties. Those limited swelling phenomena are characteristic of
cross-linked polymers. Under appropriate conditions, the cross-linked polymer progressively
expands as solvent is absorbed.
During the swelling of a cross-linked polymer, the chains connecting multifunctional
cross-linking junction points become more elongated. Consequently, a decrease in chain
configurational entropy is driven by the swelling while an increase in the entropy of mixing of the
solvent with the swollen polymer results. Finally, if enthalpy terms are considered as negligible,
which implies there is no chemical interaction between the solvent and the polymer, the polymer
is extended in the solution by swelling until the equilibrium of the chain configuration and mixing
entropies is attained.1
Polymer swelling not only causes the deformation of the polymer’s shape, but also affects
the mechanical and electrochemical properties of materials. In this thesis, the (i) mechanical
properties of structural adhesives at electrolyte-swollen state, and (ii) electrochemical properties
of cross-linked anion exchange membranes in terms of permselectivity and ion resistance in the
fully water-swollen state are discussed.
2
Chapter 2
Literature Review
2.1. Introduction
This thesis contains two main topics on polymer swelling effects; mechanical properties
for structural adhesives and electrochemical properties for ion exchange membranes. In this
chapter, the thermodynamic view on polymer swelling will be discussed first by introducing the
equilibrium between free energy of mixing and the elastic energy of network structures. Then, the
overall introduction of structural adhesives and ion exchange membranes will be presented.
2.2. Thermodynamics Background
2.2.1. The swelling equilibrium of a cross-linked polymer
A cross-linked polymer, which is a covalently-connected macromolecular network
structure, can absorb solvent and subsequently swell rather than dissolve in the solvent
completely. The extent of swelling or swelling ratio is determined by the competition of two
forces; the osmotic force of mixing and the elastic force of the cross-linked network.1 The free
energy of mixing induces the solvent to penetrate into the network structure to dilute the polymer
solution. Generally, the free energy of mixing can be enhanced by increasing the mixing
temperature.2 As the cross-linked polymer chains begin to become elongated in the swelling
process, an elastic retractive force is generated that opposes swelling. As a result, the maximum
volumetric swelling reaches an equilibrium state when the osmotic force is balanced by the elastic
force. Thus, the driving force for solvent molecules to penetrate into the cross-linked polymer

3
network can be characterized as the swelling pressure which is the composite force of the mixing
and elastic free energy components.3
∆∏swelling = ∆∏mixing + ∆∏eleastic (Eq. 2.1)
∆∏mixing is the extensive solvation of the polymer network which is conventionally described by
the Flory-Huggins theory, and ∆∏eleastic is the stretching of the polymer segments under the
influence of solvation. At the beginning of swelling, ∆∏mixing << 0 and ∆∏eleastic > 0, so the
sum of two components is much lower than 0 where swelling is favored and solvent diffuses into
the cross-linked network. During the process of swelling, ∆∏mixing and ∆∏eleastic increase until
the sum of two components becomes zero. At this point, the driving force for solvent to enter the
polymer matrix is zero and swelling ceases.
2.2.2. Osmotic force of mixing
Paul Flory and Maurice Huggins simultaneously established the thermodynamic
principles of polymer-solvent miscibility in the early 1940’s.4,5 The thermodynamic properties are
determined by the compatibility between polymer and solvent. Quantitatively, this translates into
entropy and enthalpy terms. Equation 2.2 shows the basic relationship of the free energy in a
polymer-solvent mixing system:
∆∏mixing = ∆Hmix − T∆Smix (Eq. 2.2)
First, the entropy change of mixing ∆Smix can be expressed using the entropy of mixed and
unmixed polymer-solvent systems because the entropy is an extensive parameter:
∆Smix = Smixed − Sunmixed = Smixed − (Spure solvent + Spure polymer) (Eq. 2.3)
From the definition of entropy (S = kB(ln Ω)), the entropy of pure solvent Spure solvent is equal
to zero because the solvent molecules are indistinguishable in the system(The number of the pure
4
solvent particle configuration Ωpure solvent is equal to 1). Therefore, Equation 2.3 can be
rewritten as:
∆Smix = kB(ln Ωmixed − ln Ωpure polymer) = kB lnΩmixed
Ωpure polymer (Eq. 2.4)
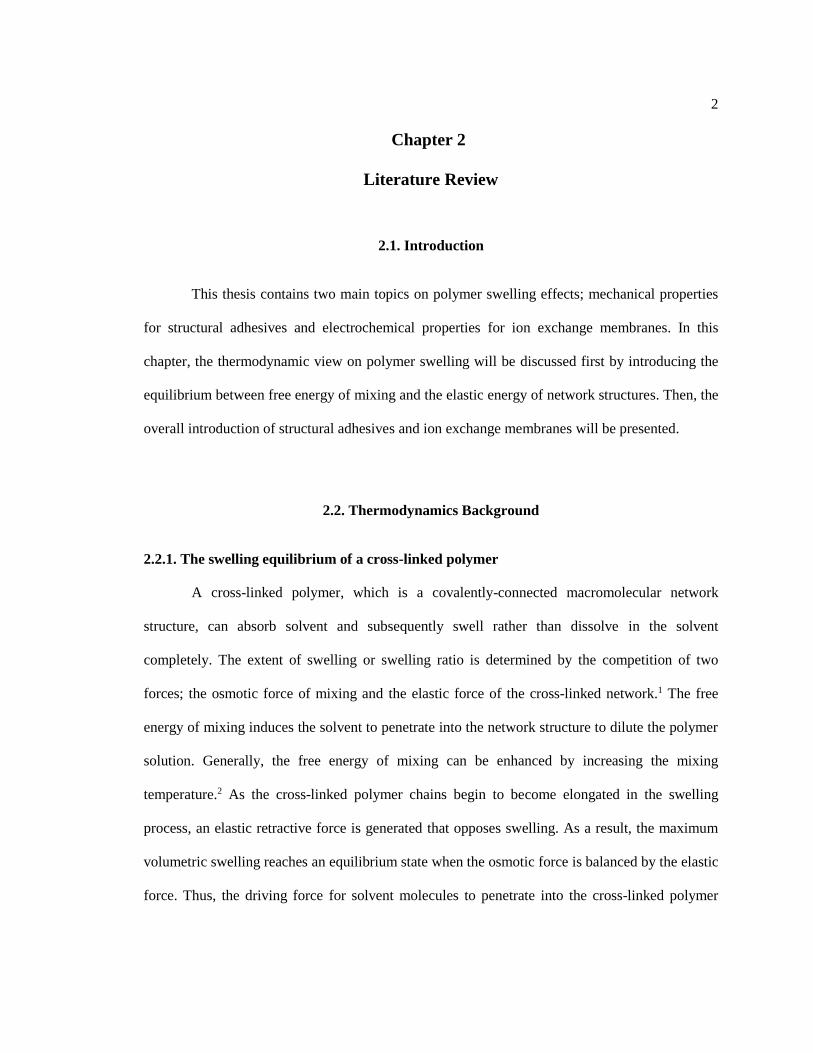
Then, the number of the configurations can be approached from the view of the lattice model
theory in which the polymer and the solvent particles are considered as the same size of spherical
grains taking individual positions as shown in Figure 2.1.
Figure 2.1. Two dimensional lattice representation of a polymer solution.
If N0 is the total number of lattice positions, N1 is the number of occupied positions by solvent
particles, N2 is that occupied by polymer particles, and x is the number of the polymer segments
(repeat units). The total number of positions, N0, is calculated when all lattice positions are
occupied as:
N0 = N1 + 𝑥N2 (Eq. 2.5)
Then, the number of configurations for (i+1)st polymer particle νi+1 can be expressed as:
νi+1 = (N0 − 𝑥i) × z(1 − fi) × (z − 1)(1 − fi) × (z − 1)(1 − fi) × ⋯ (Eq. 2.6)

5
where z is the number of adjective lattices around a polymer particle, and f is the fraction of pre-
occupied lattices in the total lattices. The first term (N0 − 𝑥i) implies the possible number of the
first polymer particle’s selection in the lattice model, the second term z(1 − fi) is that of second
polymer particle’s selection connecting to the first particle, and the rest of terms are for the
polymer particles after the second particle’s occupancy. For the simplicity, equation 2.6 can be
rewritten as:
νi+1 = (N0 − 𝑥i)z(z − 1)𝑥−2(1 − fi)𝑥−1 (Eq. 2.7)
Two terms of equation 2.7 can be approximated with small errors if the z is great enough:
z(z − 1)𝑥−2 ≈ (z − 1)(z − 1)𝑥−2 = (z − 1)𝑥−1 (Eq. 2.8)
(1 − fi) ≈N0 − 𝑥i
N0 (Eq. 2.9)
Therefore, equation 2.7 can be rewritten using equation 2.8 and 2.9 as:
νi+1 = (N0 − 𝑥i)(z − 1)𝑥−1 (N0 − 𝑥i
N0)
𝑥−1
= (N0 − 𝑥i)𝑥 (z − 1
N0)
𝑥−1
(Eq. 2.10)
Then, the first term (N0 − 𝑥i)𝑥 can be approximated if the polymer is in a very dilute solution:
(N0 − 𝑥i)𝑥 = (N0 − 𝑥i) × (N0 − 𝑥i) × (N0 − 𝑥i) × ⋯ × (N0 − 𝑥i)
≈ (N0 − 𝑥i) × (N0 − 𝑥i − 1) × (N0 − 𝑥i − 2) × ⋯ × (N0 − 𝑥i − 𝑥 + 1)
=(N0 − i𝑥)!
(N0 − i𝑥 − 𝑥)!=
(N0 − i𝑥)!
(N0 − 𝑥(i + 1))! (Eq. 2.11)
Equation 2.10 is the number of configurations for only one polymer chain. Therefore, the
configurations of all chains in the lattice model can be calculated as:

6
Ωmixed =1
N2!∏ vi =
1
N2!∏ vi+1
N2−1
i=0
N2
i=1
=1
N2![
(N0)!
(N0 − 𝑥)!×
(N0 − 𝑥)!
(N0 − 2𝑥)!× ⋯ ×
(N0 − (N2 − 1)𝑥)!
(N0 − (N2)𝑥)!] (
z − 1
N0)
N2(𝑥−1)
=1
N2![
(N0)!
(N0 − (N2)𝑥)!] (
z − 1
N0)
N2(𝑥−1)
=N0!
N1! N2!(
z − 1
N0)
N2(𝑥−1)
(Eq. 2.12)
For the pure polymer configurations, the total number of N0 is replaced with 𝑥N2, and N1 is zero
because there is no solvent. Therefore the number of the configurations for pure polymer
Ωpure polymer can be expressed as:
Ωpure polymer =((N2)𝑥)!
N2!(
z − 1
(N2)𝑥)
N2(𝑥−1)
(Eq. 2.13)
Finally, the entropy of mixing can be calculated by combining equation 2.12 and 2.13 as:
∆Smix = kB lnΩmixed
Ωpure polymer= kB ln
N0!
N1!N2!(
z−1
N0)
N2(𝑥−1)
((N2)𝑥)!
N2!(
z−1
(N2)𝑥)
N2(𝑥−1)
= kB [lnN0!
N1! (𝑥N2)!+ N2(𝑥 − 1) ln
𝑥N2
N0] (Eq. 2.14)
Equation 2.14 can be simplified using the Stirling’s law (lnN! = NlnN - N)
∆Smix = kB [−N1 lnN1
N1 + 𝑥N2− N2 ln
N2
N1 + 𝑥N2] = −kB [N1 ln
N1
N0+ N2 ln
N2
N0] (Eq. 2.15)
For convenience, Equation 2.15 can be expressed in terms of a mole unit and a mole fraction:
∆Smix = −R[N1 ln Φ1 + N2 ln Φ2] (Eq. 2.16)
Second, when a polymer is added to a solvent, the enthalpy term also changes because
polymer-polymer and solvent-solvent interactions are replaced with polymer-solvent interactions.

7
Such interactions are represented by the numbers and types of nearest neighbors around a particle.
Thus, the energy change associated with the formulation of a polymer-solvent contact can be
given by:
∆ω12 = ω12 −1
2(ω11 + ω22) (Eq. 2.17)
where ω11, ω22, and ω12are energies of one interaction of polymer-polymer, solvent-solvent, and
polymer-solvent, respectively. Therefore, the enthalpy change of mixing for a polymer chain in
the solution can be expressed by:
∆Hmixing = ∆ω12 × P12 (Eq. 2.18)
where P12 is the average number of polymer-solvent contacts of a polymer chain. This is same as
the total number of solvent particles which are contacting polymer chains. Therefore, the total
number of polymer-solvent contacts for polymer chains in the solution can be expressed as:
P12 = [(𝑥 − 2)(z − 2) + 2(z − 1)]Φ1N2 (Eq. 2.19)
where x is the number of segments for a polymer, z is the number of the adjacent sites, Φ1is the
fraction of solvent particles in the lattice model, and N2 is the number of polymer particles in the
solution. If z >> x, Equation2.19 can be approximated as:
P12 = (𝑥z − 2𝑥 + 2)Φ1N2 ≈ z𝑥Φ1N2 (Eq. 2.20)
By combining equation 2.18 and 2.20, the enthalpy change of mixing for solute particles is
∆Hmixing = z∆ω12 × 𝑥Φ1N2 (Eq. 2.21)
From the definition of volume fraction, xΦ1N2 can be replaced with Φ2N1. Also, z∆ω12 can be
replaced with χ1
RT in order to introduce a dimensionless interaction parameter χ1. Finally, the
total enthalpy of mixing ∆Hmixing can be shown as:
∆Hmixing = RTχ1
Φ2N1 (Eq. 2.22)
Finally, from Equation2.2, the free energy change of mixing can be expressed using equation 2.16
and 2.22:

8
∆∏mixing = RTχ1
Φ2N1 + RT[N1 ln Φ1 + N2 ln Φ2]
= RT[N1 ln Φ1 + N2 ln Φ2 + χ1
Φ2N1] (Eq. 2.23)
Φ1and Φ2 are lower than 1, both values are always negative. Thus, if χ1
Φ2N1is greater than
N1 ln Φ1 + N2 ln Φ2 , polymer does not dissolve in the solvent. As temperature increases, χ1
decreases and the solubility of the polymer increases by the definition of
χ1
=z∆ω12
RT (Eq. 2.24)
2.2.3. Elastic force of a cross-linked network
The expression for ∆∏elastic have been conventionally derived by two models: the affine
network and phantom network. The essential difference between two models is in their
assumption on cross-linked points’ fluctuations. The affine model presupposes that the cross-links
are totally interrelated and there are no fluctuations. On the other hand, the phantom model
assumes independent oscillations of the cross-links. However, the real situation may be
somewhere intermediate to these two cases. The cross-links might neither be rigidly held in a
topological space nor be totally independent in their dynamics. Fluctuations to the extent
permitted by the segmental flexibility will be occurring. For the isotropic swelling of perfect
tetra-functional networks, the following expressions have been derived.3
For the phantom network:
∆∏elastic = −NCcRT [(Φ2
Φ2c)
1/3
] (Eq. 2.25)
And for the affine network:
∆∏elastic = −2CcRT [(Φ2
Φ2c)
1/3
−1
2(
Φ2
Φ2c)] (Eq. 2.26)

9
where R is the gas constant, T is absolute temperature, Φ2 is the volume fraction of polymer at
swollen state, Cc is the number of cross-links in the reference state, N is an empirical parameter,
and Φ2c is the volume fraction of the polymer reference state. In the original theory, N=1. The
number of cross-links, Cc, and the volume fraction, Φ2c, in the reference state per unit volume are
calculated on the basis of the effective monomer concentration for the observed gel fraction. The
effective chain means the segment between cross-links in an infinite network as shown in Figure
2.2.
Figure 2.2. Scheme of a polymer network; two types of chains in a network.
At equilibrium, polymer swelling stops:
∆∏swelling = ∆∏mixing + ∆∏eleastic = 0 (Eq. 2.27)
In the affine model,
∆∏swelling = RT[N1 ln Φ1 + N2 ln Φ2 + χ1
Φ2N1] − 2CcRT [(Φ2
Φ2c)
1
3
−1
2(
Φ2
Φ2c)]
= 0 (Eq. 2.28)

10
In the phantom model,
∆∏swelling = RT[N1 ln Φ1 + N2 ln Φ2 + χ1
Φ2N1] − NCcRT [(Φ2
Φ2c)
1/3
] = 0 (Eq. 2.29)
For the applications of adhesives and ion exchange membranes, a large amount of solvent uptake
adversely affects the mechanical properties due to the solvent plays a role as a plasticizer in the
polymer matrix. Therefore, the swelling ratio needs to be optimized in terms of the affinity
between the polymer and the solvent as well as the cross-linking density as mentioned so far.
2.3. Lithium Ion Battery
2.3.1. Introduction
A lithium ion battery (Li-ion battery) is a rechargeable battery in which lithium ions
move from a negative electrode to a positive electrode through a permeable separator during
discharging, and from a positive electrode to a negative electrode during charging. The Li-ion
battery had been commercially developed from the 1970s, but a few commercial products
appeared by Goodenough6 and Yazami7 during the early 1980s. The early types of the Li-ion
battery adopted Li-TiS2, Li-MoS2, and Li-LixMnO2 systems which used lithium metal as an
anode material. However, those systems did not succeed in the commercial market because of
safety issues and prolonged charging time.8 In the Li-ion battery technology evolution, real
commercialization was possible after graphite and lithiated transition metal oxides were
introduced as an anode material and as a cathode material, respectively. Nowadays, graphite-
LiCoO2 has become the most ubiquitous Li-ion battery system which is able to supply power to
portable electronic devices such as cellular phones, laptops, digital cameras, and other
applications.9

11
The main reaction of a Li-ion battery is reversible Li-ion intercalation/deintercalation
cycles between two layered compounds; graphite and LiCoO2. On the LiCoO2 side, the cathode
reaction during charging is:
LiCoO2 ↔1
2Li+ +
1
2e− + Li0.5CoO2 (Eq. 2.30)
This reaction ensures prolonged shelf life and excellent safety features compared to a Li metal-
based battery because the source of Li-ion comes from a lithiated transition metal oxide. Graphite
intercalates with Li-ions result in forming LiC6 as a final product shown in the following reaction:
C6 + Li+ + e− ↔ LiC6 (Eq. 2.31)
A depiction of the operation of a Li-ion cell is given in Figure 2.3.
Figure 2.3. Depiction of the charge-discharge operations of Li-ion cells.10
One of the important factors that determine the operating condition of a Li-ion battery is
the type of electrolyte solution. About two decades ago, alkyl carbonates were reported as the
most suitable solvents for Li-ion batteries because of its stability against oxidation under battery
operation.11 Figure 2.4 illustrates the several alkyl carbonates used for electrolyte solutions. A
variety of electrolyte solvent mixtures have been developed by using ethylene carbonate (EC),

12
dimethly carbonate (DMC), and diethyl carbonate (DEC) as well as lithium hexfluorophosphate
(LiPF6) salt in order to boost the efficiency of Li-ion batteries.12-15
O
O O
O O
O
O O
O
Ethylene carbonate Dimethly carbonate Diethyl carbonate
Figure 2.4. Alkyl carbonates used for Li-ion battery electrolyte solutions.
Materials used in the battery system such as the case and current collectors must be resistant to
these organic solvent/salt mixtures for effective long-term operation and sufficient safety.
2.3.2. Structure of a lithium ion battery
Today, state-of-the-art Li-ion batteries provide excellent specific energy (>150 Wh/kg)
and energy density (>230 Wh/L).16 These types of Li-ion batteries are usually composed of one or
more laminated pairs of anode and cathode materials with polyolefin separators which allow Li-
ions to pass between electrodes. The pairs of electrodes are bonded with various polymeric
binders and metallic current collecting materials. In the structure, an electronically insulating, but
ionically conductive, organic electrolyte solvent saturates the core materials in order to allow Li-
ions to move during charging and discharging.
For the commercial cylindrical Li-ion battery as shown in Figure 2.5 (a), the jelly roll
structure is placed into a metal case for mechanical protection and containment of the electrolyte.
The expanded view of the cylindrical battery structure, shown in Figure 2.5 (b), illustrates some
structural loading scenarios along the axial and radial surfaces. The copper and aluminum current
collectors play a role in supporting the structure against a load, while the normal and shear loads
in the curvilinear plane, as shown in red arrow of Figure 2.5 (b), are able to be carried by the

13
current collectors. Loads in the interlaminar direction are not capable of transmitting the
significant stress without damage to the structure. Thus, those battery structures are not optimized
to carry loads for the electrified vehicle applications.17
Figure 2.5. (a) simplified view of a cylindrical Li-ion battery cell; (b) an enlarged view of a
representative volume of the cylindrical Li-ion battery cell.
Alternatively, the flat layers of a battery based a sandwich structure, where the core cells
are stacked up and sealed with a wrapper such as a soft pouch, a rigid plastic or a metallic box
can be used as the better Li-ion battery structure.18 This type of battery structure can provide high
mechanical performance while maintaining minimal weight. In the past two decades, many
studies have been conducted to integrate Li-ion batteries into the sandwich structures. Thomas, et
al. has tried to fabricate multifunctional structure-battery composites using fiber reinforced
materials.19 The multifunctional integration provided significant electrical energy storage capacity
while maintaining high flexural stiffness. Wang, et al. has proposed to encapsulate gel polymer
Li-ion battery into a foam core sandwich structure in order to enhance load carrying ability with

14
mass saving.20 Roberts and Aglietti have manufactured a multi-functional sandwich structure
system which has an ability to withstand the vibration, thermal and vacuum environment as well
as reducing the structure’s mass.21
2.3.3. Epoxy adhesive system for structural bonding in batteries
An adhesive can be any material which is applied to the surfaces of adherends to bind
them together and resisting separation. There are a variety of commercial adhesives available for
structural bonding, and epoxies are one of the best polymeric materials being used in many
structural applications due to no volatile by-products, good thermal stability, low shrinkage upon
curing, and good mechanical performance.22-24
Generally, any polymeric resin containing epoxide groups is classified as an epoxy. The
epoxide groups are able to undergo ring opening to form large three dimensional network
structures. Various amines, anhydrides, and Lewis acids (i.e., boron trifluoride) can be employed
to react with the epoxide groups. Figure 2.5 demonstrates an example of the cross-linking process
of an epoxy group with a secondary amine.25
Figure 2.6. Epoxy reaction with secondary amine.
During the reaction of the epoxide groups or curing, the fluid epoxy resin changes into a
gelled solid as chemical bonding is achieved. The properties of the cured epoxy resins are
significantly affected by the type of epoxy, curing agent, filler, and curing process.26 When the

15
curing reaction occurs, the cross-linking between the epoxy and reactive groups occurs at the end
of each component. The degree of cross-linking significantly influences the cured adhesive’s
properties. Generally, lower crosslink density tends to improve toughness of the cured resin by
permitting greater elongation before breakage as well as resulting in reduced shrinkage during
curing. On the other hand, higher cross-linking density yields higher chemical and thermal
resistances with higher Tg, but the failure strain decreases and the material becomes more brittle.
Sorption of diluents into an epoxy adhesive can decrease the adhesive’s performance
during its service life. A variety of environmental materials can be absorbed into the epoxy
adhesive, but water (or moisture) is a ubiquitous concern due to the fact that the water is the most
commonly encountered environments for many applications. It is well-known that the absorbed
water molecules can depress the glass transition temperature of the adhesive by acting as a
plasticizer in the polymer network and decreasing the mechanical performance and durability.
Zou, et al. has reported that glass transition temperatures of epoxy samples, which were analyzed
by differential scanning calorimetry and dielectric spectroscopy, decreased approximately 20K as
the humidity was increased from 0% to 100%.27 Jurf, et al. reported that moisture diffusion into
epoxy adhesives adversely affected the mechanical performance because the presence of moisture
causes the same effect as raising the environmental temperature as well as lowering glass
transition temperature.28 Also, the absorbed water molecules can decrease the hydrogen bonding
force between polymer chains while playing a role as nucleating sites causing cracks in the matrix.
Banks, et al. has reported that the glass transition temperature of bisphenol-A epoxy resin
(diamino-disphenyl methane cured with diglycidyl ether) was lowered by 32K compared to a dry
sample because resin’s segmental motion was increased as a result of the disruption of hydrogen
bonding by the absorbed water molecules.29 Morgan reported that the initial stage of failure
caused by absorbed moisture promoted the propagation of crazes and the subsequent crack
propagation increases the accessibility of moisture accelerate degradation.30 In many cases of

16
epoxy adhesive system, the joint strengths are strongly degraded by water (or moisture)
absorption under high humidity environments.
Selecting the proper adhesive and curing conditions for manufacturing a Li-ion battery
structure was important in this study because the structural adhesive needs to maintain a strong
bonding strength under electrolyte solution as well as provide hermetic sealing. Also, the
adhesive used for bonding the structure needs to meet a number of requirements for successful
electrochemical and mechanical performance. Firstly, the cured adhesive should not be
degradable in the organic electrolyte solution at operating temperature. Secondly, the adhesive
needs to provide successful hermetic sealing which prevents electrolyte contact with atmosphere
because ambient moisture can act with LiPF6 salt in the electrolyte solution forming hydrofluoric
acid. Thirdly, the adhesive should play a role in electrical insulating buffer to prevent electrical
shorting between core materials and face skins. Finally, the adhesive should be cured at a
temperature where the core materials are not adversely affected from the heat since the separator
material, which is one of the core material components, are usually made of polyolefin which is
degradable above 100°C.
2.4. Ion Exchange Membrane
2.4.1. Introduction
Ion exchange membranes are composed of water-swellable polymeric materials with
charged ionic groups tethered to the polymer backbones. In the ideal case, the membrane must be
permeable for counter-ions (i.e., ions with the opposite charges to those that are bound to the
membrane’s polymer backbone), while impermeable for co-ions (i.e., the ions with the same
charges as those that are bound to the membrane’s polymer backbone) and non-porous to prevent
hydrodynamic water flow. This unique properties to transport and separate ionic components
17
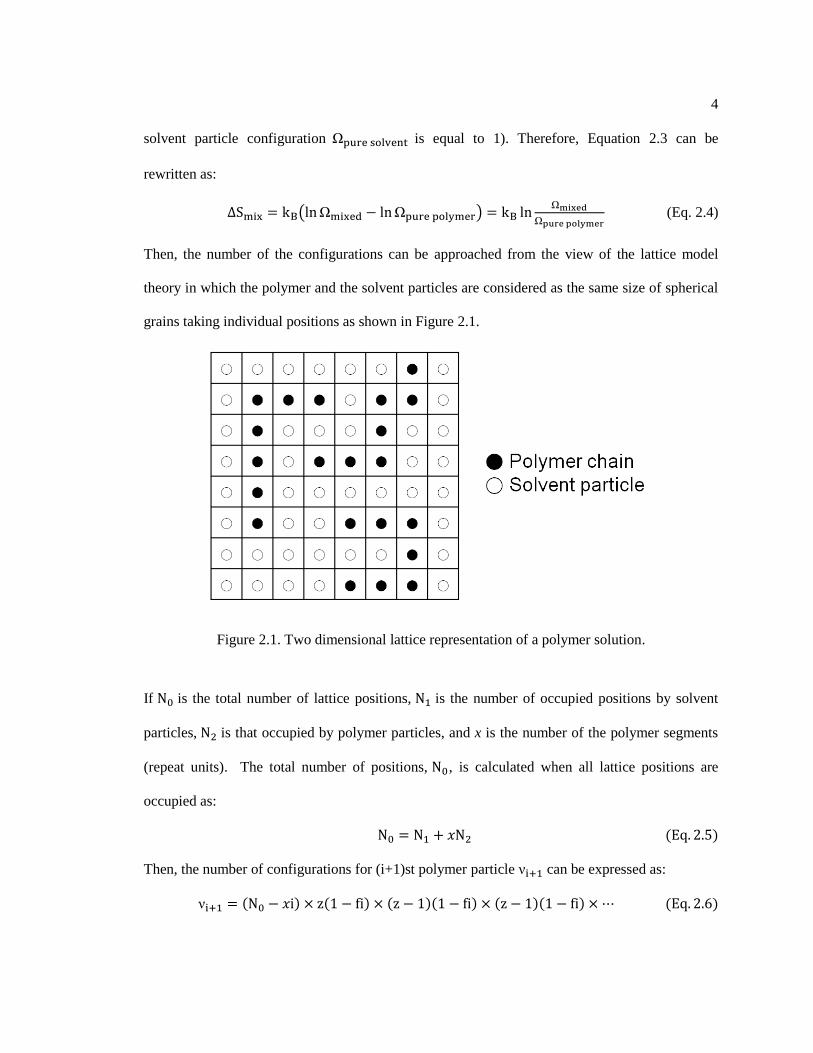
selectively makes ion exchange membranes an interesting tool in a wide range of applications
such as electrodialysis, electrodeionization, production of potable and industrial water, treatment
of industrial effluents, chlorine-alkaline production, as well as energy conversion and storage
systems.31 The ion exchange membranes can be classified by their function as a separation
medium;(i) cation exchange membrane which has fixed negative charged ions on the polymer
backbone to permeable for cations only, (ii) anion exchange membrane which has fixed positive
charged ions on the polymer backbone to permeable for anion only, and (iii) bipolar membrane
which is laminated together with cation and anion exchange membranes to split water from H+
and OH- ions.
For successful applications, the most desired properties of ion exchange membranes are
high permselectivity, low ionic resistance, and sufficient mechanical, chemical and thermal
stabilities. These properties of ion exchange membranes are generally determined by the base
material composition and concentration of fixed charge groups. The base polymeric materials
determine the mechanical, chemical, and thermal stability of the membrane. The fixed charge
groups determine membrane’s permselectivity and ionic resistance as well as influence the
mechanical properties caused by water swelling.
2.4.2. Ionic conductivity and Ohm’s law
The transport of electric charges can be achieved by the transport of ions in electrolyte
solution and ion exchange membrane. The electrical current can be described by Ohm’s law
which is given by:
V = IR (Eq. 2.32)
where V is the electrical potential difference (Voltage), I is the electrical current, and R is the
electrical resistance. The resistance R can be expressed as a function of specific resistance ρ (or

18
specific conductivity κ) of the material, the distance l between the electron sources, and the cross
sectional area A of the membrane:
R =ρl
A=
l
Aκ (Eq. 2.33)
The conductivity of electrolyte solution depends on the concentration Ci, the equivalent
conductivity λieq, and the charge number z of the ions i in the solution. It is given by:
κ = ∑|zi|λieq
i
Ci (Eq. 2.34)
The electrical current I passing through the electrolyte solution under the driving force is
proportional to the flux of electrical charges and cross-sectional area given by:
I = FA ∑ ziJi
i
(Eq. 2.35)
where F is the Faraday constant (96485.332 C/mol). Ji is the ion flux density which is
proportional to the concentration Ci, to the equivalent conductivity λieq, and to the electrical
potential gradient ∆φ/l as expressed by:
|Ji| =λi
eqCi∆φ
Fl (Eq. 2.36)
2.4.3. Electrochemical potential and the Donnan equilibrium
Transport of ions through an ion exchange membrane in electrolyte solution occurs
under the driving force of electrochemical potential gradient. The electrochemical potential Di is
a function of the electrical potential φ and the chemical potential μi of the ion. It can be described
by:
Di = μi + Fziφ = μi0 + Vm,ip + RT ln ai + Fziφ (Eq. 2.37)
where F is the Faraday constant, z is the charge number of the ion, μi0 is the chemical potential at
standard condition, Vm,i is the partial molar volume of component i, p is the total pressure, R is

19
the gas constant, T is the temperature, and ai is the ion activity. If the driving force for the ion
transport is applied in the x-direction perpendicular to the membrane surface, the electrochemical
potential gradient is given by:
dDi
dx=
dμi
dx+ Fzi
dφ
dx= Vm,i
dp
dx+ RT
d ln ai
dx+ Fzi
dφ
dx (Eq. 2.38)
Electrochemical equilibrium between the electrolyte solution and the ion exchange membrane
exists when the electrochemical potential of two phases are equal. Thus, the electrochemical
potentials in equilibrium can be expressed by:
Dim = Di
s = μim + Fziφ
m = μis + Fziφ
s (Eq. 2.39)
The superscripts m and s refer to the membrane and to the solution, respectively. To obtain
electrical potential equilibrium referred to as Donnan potential, φDon , equation 2.39 can be
rearranged using equation 2.37 as following:32
φDon = φm − φs =1
Fzi(RT ln
ais
aim + Vm,i(ps − pm))
=1
Fzi(RT ln
ais
aim + Vm,i(∆π)) (Eq. 2.40)
where ∆π is the osmotic pressure difference between the membrane and the electrolyte solution
which is referred to as the swelling pressure of ion exchange membrane. Thus, the Donnan
potential, φDon, cannot be measured directly, but it can be calculated using the ion activities and
the swelling pressure ∆π. This equation 2.40 provides a general relation for co-ion and counter-
ion distribution at the interface between the ion exchange membrane and the electrolyte solution
in equilibrium. The Donnan equilibrium is important as the basis for estimating the exclusion of
co-ions in a membrane as a function of the ion concentration in bulk solution.

20
2.5. References
[1] Flory, P. J., & Rehner Jr, J. (1943). Statistical mechanics of cross‐linked polymer networks II.
Swelling. The Journal of Chemical Physics, 11(11), 521-526.
[2] Flory, P. J., & Tatara, Y. I. (1975). The elastic free energy and the elastic equation of state:
elongation and swelling of polydimethylsiloxane networks. Journal of Polymer Science: Polymer
Physics Edition, 13(4), 683-702.
[3] Padmavathi, N. C., & Chatterji, P. R. (1996). Structural characteristics and swelling behavior
of poly (ethylene glycol) diacrylate hydrogels. Macromolecules, 29(6), 1976-1979.
[4] Flory, P. J. (1942). Thermodynamics of high polymer solutions. The Journal of chemical
physics, 10(1), 51-61.
[5] Huggins, M. L. (1941). Solutions of long chain compounds. The Journal of Chemical Physics,
9(5), 440-440.
[6] Goodenough, J. B., & Mizuchima, K. (1981). U.S. Patent No. 4,302,518. Washington, DC:
U.S. Patent and Trademark Office.
[7] Yazami, R., & Touzain, P. (1983). A reversible graphite-lithium negative electrode for
electrochemical generators. Journal of Power Sources, 9(3), 365-371.
[8] Etacheri, V., Marom, R., Elazari, R., Salitra, G., & Aurbach, D. (2011). Challenges in the
development of advanced Li-ion batteries: a review. Energy & Environmental Science, 4(9),
3243-3262.
[9] Ohzuku, T., & Brodd, R. J. (2007). An overview of positive-electrode materials for advanced
lithium-ion batteries. Journal of Power Sources, 174(2), 449-456.
[10] Brodd, R. J. (2013). Comments on the history of lithium-ion batteries. In The
Electrochemical Society.
[11] Tarascon, J. M., McKinnon, W. R., Coowar, F., Bowmer, T. N., Amatucci, G., & Guyomard,
D. (1994). Synthesis conditions and oxygen stoichiometry effects on Li insertion into the spinel
LiMn2 O 4. Journal of The Electrochemical Society, 141(6), 1421-1431.
[12] Aurbach, D., Markovsky, B., Salitra, G., Markevich, E., Talyossef, Y., Koltypin, M., ... &
Kovacheva, D. (2007). Review on electrode–electrolyte solution interactions, related to cathode
materials for Li-ion batteries. Journal of Power Sources, 165(2), 491-499.
[13] Sloop, S. E., Kerr, J. B., & Kinoshita, K. (2003). The role of Li-ion battery electrolyte
reactivity in performance decline and self-discharge. Journal of Power Sources, 119, 330-337.
[14] Aurbach, D., Talyosef, Y., Markovsky, B., Markevich, E., Zinigrad, E., Asraf, L., ... & Kim,
H. J. (2004). Design of electrolyte solutions for Li and Li-ion batteries: a review. Electrochimica
Acta, 50(2), 247-254.
[15] Zhang, S. S. (2006). A review on electrolyte additives for lithium-ion batteries. Journal of
Power Sources, 162(2), 1379-1394.
[16] Thackeray, M. M., Wolverton, C., & Isaacs, E. D. (2012). Electrical energy storage for
transportation—approaching the limits of, and going beyond, lithium-ion batteries. Energy &
Environmental Science, 5(7), 7854-7863.
21
[17] Singh, A. K., Cao, L., Ma, J., Seo, J., Bakis, C. E., Zhang, Y., ... & Rahn, C. D. (2015).
Design, manufacture and test of a novel structural battery based on sandwich construction.
Journal of Sandwich Structures and Materials, 17(6), 666-690.
[18] Kurfer, J., Westermeier, M., Tammer, C., & Reinhart, G. (2012). Production of large-area
lithium-ion cells–Preconditioning, cell stacking and quality assurance. CIRP Annals-
Manufacturing Technology, 61(1), 1-4.
[19] Thomas, J. P., Qidwai, S. M., Pogue, W. R., & Pham, G. T. (2013). Multifunctional
structure-battery composites for marine systems. Journal of Composite Materials, 47(1), 5-26.
[20] Wang, Y., Peng, C., & Zhang, W. (2014). Mechanical and electrical behavior of a novel
satellite multifunctional structural battery. Journal of Scientific & Industrial Research, 73(3), 163-
167.
[21] Roberts, S. C., & Aglietti, G. S. (2008). Satellite multi-functional power structure: feasibility
and mass savings. Proceedings of the Institution of Mechanical Engineers, Part G: Journal of
Aerospace Engineering, 222(1), 41-51.
[22] Anderson, B. J. (2011). Thermal stability of high temperature epoxy adhesives by
thermogravimetric and adhesive strength measurements. Polymer Degradation and Stability,
96(10), 1874-1881.
[23] Tai, R. C. L., & Szklarska-Smialowska, Z. (1993). Effect of fillers on the degradation of
automotive epoxy adhesives in aqueous solutions. Journal of materials science, 28(22), 6205-
6210.
[24] Prolongo, S. G., & Urena, A. (2009). Effect of surface pre-treatment on the adhesive strength
of epoxy–aluminium joints. International Journal of Adhesion and Adhesives, 29(1), 23-31.
[25] Garg, A. C., & Mai, Y. W. (1988). Failure mechanisms in toughened epoxy resins—A
review. Composites Science and Technology, 31(3), 179-223.
[26] Morgan, R. J. (1985). Structure-property relations of epoxies used as composite matrices. In
Epoxy Resins and Composites I (pp. 1-43). Springer Berlin Heidelberg.
[27] Zou, C., Fothergill, J. C., & Rowe, S. W. (2008). The effect of water absorption on the
dielectric properties of epoxy nanocomposites. Dielectrics and Electrical Insulation, IEEE
Transactions on, 15(1), 106-117.
[28] Jurf, R. A., & Vinson, J. R. (1985). Effect of moisture on the static and viscoelastic shear
properties of epoxy adhesives. Journal of materials science, 20(8), 2979-2989.
[29] Banks, L., & Ellis, B. (1979). The glass transition temperature of an epoxy resin and the
effect of absorbed water. Polymer Bulletin, 1(6), 377-382.
[30] Morgan, R. J., O'Neal, J. E., & Fanter, D. L. (1980). The effect of moisture on the physical
and mechanical integrity of epoxies. Journal of Materials Science, 15(3), 751-764.
[31] Strathmann, H., Grabowski, A., & Eigenberger, G. (2013). Ion-exchange membranes in the
chemical process industry. Industrial & Engineering Chemistry Research, 52(31), 10364-10379.
[32] Donnan, F. G. (1911). Theorie der membrangleichgewichte und membranpotentiale bei
vorhandensein von nicht dialysierenden elektrolyten. ein beitrag zur physikalisch‐chemischen
physiologie. Zeitschrift für Elektrochemie und angewandte physikalische Chemie, 17(14), 572-
581.

22
Chapter 3
Electrolyte Resistant Epoxy for Bonding Battery-Based Sandwich Structures
3.1. Introduction
A sandwich panel is a special form of laminated composite because of its exceptionally
high flexural stiffness-to-weight ratio compared to other architectures.1 Typically, the structure is
fabricated with two thin and stiff face sheets adhesively bonded to a relatively thick and
lightweight core. The face sheets are able to provide high bending stiffness while the core
material is able to maintain shear stiffness. These desirable mechanical performance attributes
and potential low mass density have attracted the attention of researchers developing Li-ion
battery structures which require exceptional mechanical properties, particularly in the automotive
and aerospace industries.2
There are a variety of commercial adhesives for the purpose of sandwich structure
bonding; epoxy resins,3 phenolic resins,4 polyurethanes,5 acrylates6 and vinylester resins.7
Reduction of stress concentrations and low mass are two major advantages of those polymeric
structural adhesives compared with conventional methods for joining such as welding, riveting
and bolting.8 In order to select a proper adhesive for the sandwich construction, some factors
should be considered in terms of fatigue, strength, creep, heat resistance, and aging.9
However, one of the most important requirements of the structural adhesive may be the
ability to retain a significant portion of its loading-bearing capability during its service life.10 A
wide variety of environmental factors will affect the durability of the adhesive joint, but water is a
ubiquitous concern in these types of bonds.11 Moisture and salt ions penetrating into the bonded
joint are primary causes of bonding degradation in many applications from aerospace to
automotive to building structures.12

23
In this regard, epoxy resin is well-known as one of most common high-performance
structural adhesives. Epoxies are attractive due to their ability to be cured without volatile by-
products, their good thermal stability,13 and their low shrinkage upon curing (less than 0.5%).14
Epoxy adhesives are also able to bond well to a variety of treated or untreated metal surfaces.15
The chemical and mechanical properties of the epoxy resin can be relatively easily enhanced by
adding inorganic fillers where the filler type, shape, size, and content all determine the
performance of the composite adhesive.16-19
In spite of the heavy use of epoxy resins as adhesives, there is no data on their
performance under the challenging conditions encountered in a Li-ion battery. Indeed, most Li-
ion battery pouch cells are sealed with a polyolefin-based adhesive, which does not have much
structural integrity. The major drawback of the sandwich structure design using epoxy in the
electrolyte to hold the components together is the lack of predictable long-term durability of the
adhesive in the electrolyte environment to maintain the structure’s stability. In this study, we (i)
introduced Hansen solubility parameter analysis to estimate the adhesive performance in
simulated and real battery electrolyte, (ii) investigated the swelling ratios of commercial
structural adhesives and sealants in electrolytes using gravimetric measurements, (iii) measured
mechanical strengths of a downselected commercial adhesive before and after immersion of the
sample in electrolytes, and (iv) analyzed the extent of reaction and gel fraction of the epoxy as a
function of curing temperatures using sol extraction and differential scanning calorimetry.
3.2. Experimental Procedure and Characterization
3.2.1. Materials
The general purpose polymer samples for electrolyte soaking tests were purchased from
McMaster Carr (part #5331K7). All two-part adhesives were obtained from Henkel. Ethylene

24
carbonate (EC), dimethyl carbonate (DMC), and lithium hexafluorophosphate(LiPF6) were
obtained from Sigma Aldrich. The binary EC/DMC mixture used in this study was prepared by
mixing the two solvents 1:1 by volume. Aluminum 2024 sheet used as a substrate was purchased
from McMaster Carr (part #1924T41).
3.2.2. Electrolyte Uptake of General Purpose Polymers
A number of general purpose polymer samples were investigated by immersion in DMC
single solvent and in a EC/DMC mixture. The sample size of the general purpose polymer was
50.0 mm × 50.0 mm × 12.5 mm without any dimensional change from the purchased original
samples. Each sample was placed into a glass jar containing a test solvent (50 mL). The glass jar
was sealed and allowed to stand at room temperature for one week. After soaking, the solvent-
swollen samples were removed from each solvent and briefly wiped with lab tissues to remove
free solvent from the surface. The swelling ratios were calculated using:
Swelling ratio (%) = Ws − Wd
Wd× 100 (Eq. 3.1)
where Ws and Wd are the weight of the samples at the designated time of the swollen state and of
the dry state, respectively.
3.2.3. Electrolyte Uptake of Commercial Adhesives
A cavity silicone mold (Aeromarine AM160) was fabricated as a template for casting test
samples. Commercial adhesives and sealants were cured as 25.0 mm dia. × 2.5 mm thickness
circular discs using the prepared silicone mold following the manufacturer’s specifications. The
prepared samples were placed into a glass jar and immersed in a DMC single solvent and in a
EC/DMC mixture at room temperature for 3 weeks. The swelling ratios were measured every
week in the same manner as the general purpose sample test.

25
3.2.4. Tensile Strength Measurement
A cavity silicone mold (Aeromarine AM160) was fabricated for casting tensile specimens.
Epoxy adhesives were cured as 5.0 mm thickness tensile specimen using the prepared silicone
mold at room temperature for 3 days as shown in Figure 3.1.
Figure 3.1. (a) Geometry of tensile strength test specimen; (b) Prepared specimen.
For electrolyte soaked specimens, three prepared samples were placed into a glass jar and
immersed in a EC/DMC mixture at room temperature for a week. Tensile strength tests were
conducted using an Instron 5866 universal testing instrument at a crosshead speed of 1.27
mm/min at room temperature. The tensile strengths were calculated from:
Tensile strength (MPa) = Failure load (N)
Cross sectional area at fracture(m2)× 10−6 (Eq. 3.2)

26
3.2.5. Single Lap Shear Strength Measurement
Specimens for lap shear strength testing were prepared by bonding 2024 aluminum sheets
with E-120HP epoxy adhesive which was downselected from the electrolyte soaking tests. Prior
to bonding with E-120HP, the aluminum sheet was degreased with acetone for 10 minutes, wiped
with a clean lab tissue, and dried in air for 30 minutes in order to remove contaminants from the
surface. The adherend composed of aluminum sheet was 63.5 mm long, 12.7 mm wide, and 1.0
mm thick as shown in Figure 3.2. The epoxy adhesive was applied on the shear area with 0.3 mm
thickness which was controlled by inserting two 0.3 mm steel wires between the Al adherends.
After bonding specimens with E-120HP for 2 days at room temperature, the lap shear test
specimens were immersed in EC/DMC and 1M LiPF6-EC/DMC mixtures for the designated
period.
Figure 3.2. (a) Geometry of lap shear strength test specimen; (b) Prepared specimen.

27
Lap shear strength tests were conducted using an Instron 5866 universal testing instrument at a
crosshead speed of 1.27 mm/min (0.5 inch/min) at room temperature. The lap shear strengths
were calculated from:
Lap shear strength (MPa) =Failure load (N)
Adhesive lap area (m2)× 10−6 (Eq. 3.3)
3.2.6. Gel Fraction
E-120HP epoxy films were cured at four different curing temperatures (RT, 60, 80, and
100°C) for 24 hours. Then, each cured epoxy film was cut into five identical samples with 10.0
mm × 10.0 mm × 2.0 mm dimensions. The prepared samples were immersed in individual sealed
vials containing 5 mL toluene at 50°C. Toluene was used as a good solvent of E-120HP Epoxy
adhesive. After soaking for two weeks, all solvent-swollen samples were removed from their vial,
and toluene in the vials was dried in a convection oven at 50°C for 24 hours in order to measure
the mass of the extracted residue from the cured epoxy samples. Five samples were investigated
to obtain the average residue and standard deviation. The amount of residue was calculated as:
Residue (%) =Wrv − Wev
Ws× 100 (Eq. 3.4)
where Wrv, Wev, and Ws are the weight of the residue with a vial and the weight of an empty vial,
and the weight of a cured sample, respectively. The extracted residue is considered to be the sol
which did not participate in the cross-linking reaction. The gel fraction can be derived as:
Gel fraction (%) = 100 − Residue (%) (Eq. 3.5)

28
3.2.7. Differential Scanning Calorimetry Analysis
Four samples were prepared in the same manner as the gel fraction test; RT, 60, 80, and
100°C. The heat flows were monitored using a TA Instruments (New Castle, Delaware) Q2000
Differential Scanning Calorimeter. The sample masses were 10 mg and TA Instruments TZero
hermetic pans were used in the measurement. The temperature was increased from room
temperature to 250°C with a 10°C/min heating rate. The measurements were performed in a
nitrogen atmosphere.
3.3. Result and Discussion
3.3.1. Gravimetric Swelling and Hansen Solubility Parameter
The objective of the gravimetric electrolyte uptake experiments was to screen a number
of different materials with a wide variety of chemical compositions in solvents that compose the
battery electrolyte. The major challenge for the structural adhesive was to maintain bonding and
overall strength when exposed to a typical battery electrolyte consisting of a mixture of carbonate
solvents with 1M lithium hexafluorophosphate (LiPF6). The polymer swelling by the solvent
mixture and the salt is a complex problem. Therefore, the polymer behavior in carbonate solvents
without LiPF6 salt was investigated first. Before conducting the polymer gravimetric swelling
tests, the solubility of each polymer sample was estimated by using Hansen solubility parameters.
Hansen solubility parameter (HSP) was developed by Charles M. Hansen in 1967 as a
method to predict physical affinities between two materials (usually solute and solvent).20 This
method is based on the idea that ‘like dissolves like’ where one molecule can be defined as being
‘like’ if it bonds to itself with a similar energy. There are three parameters to determine the
similarity; (i) non-polar, atomic dispersion interactions, D, (ii) molecular, dipolar interactions, P,
(iii) molecular, hydrogen interactions, H. These three types of parameters can be considered as

29
coordinates in three dimensions known as the Hansen space. The closer two materials are in the
Hansen space, the more likely they are to dissolve each other.
The sphere of interaction R0, which is usually given from literature, provides the
maximum difference in affinity for “good” interaction between two materials. To determine if the
solvent has high affinity for the material, the distance Ra between solvent and the material is
obtained as:
(Ra)2 = 4(δD1 − δD2)2 + (δP1 − δP2)2 + (δH1 − δH2)2 (Eq. 3.6)
The ratio between Ra and R0 is called as the relative energy difference (RED), equation 7:
RED =Ra
R0 (Eq. 3.7)
A good solvent is located within the sphere of affinity, so the RED is less than 1.0. Table
3.1 presents the HSP of all tested polymers. Careful attention was paid to the volatility of DMC
and EC/DMC solvents to prevent a possible change in composition during testing. Thus,
experiments were conducted at room temperature and pressure and vessels remained well-
covered. These parameters are plotted on the two-dimensional spaces as shown in Figure 3.3
except for the non-polar dispersion parameter because the energy difference between solute and
solvent is small enough to be ignored. The circles for each polymer material have a center at the
HSP and a radius of R0. The HSP of EC and DMC are also shown on the plot. The EC/DMC
mixture was calculated as a number average of two solvents as Hansen suggested. The red line
represents an extremely soluble material (>100 wt% uptake) and blue lines are well swollen
materials (>10 wt% uptake), while green lines are little swollen materials in EC/DMC mixture.

30
Table 3.1. Hansen solubility parameters of the polymers tested in this study.
Materials21 δd δp δh δ R0
RED
with
DMC
RED
with
EC/DMC
Dimetyl Carbonate (DMC) 15.5 10.6 7.4 20.2 - - -
Ethylene Carbonate (EC) 19.4 21.7 5.1 29.6 - - -
EC/DMC mixture 17.5 16.2 6.3 24.6 - - -
ABS 17.6 8.6 6.4 20.6 10.9 0.4 1.3
Cast Nylon 6 16.0 11.0 24.0 30.9 3.0 5.5 7.6
Extruded Nylon 6/6 16.0 11.0 24.0 30.9 3.0 5.5 7.6
HDPE 18.0 3.0 4.0 18.7 2.0 4.9 9.5
LDPE 16.5 4.5 0.5 17.1 6.0 1.6 3.1
Noryl PPO 17.9 3.1 8.5 20.1 8.6 1.0 2.2
PLA22 17.5 9.5 7.5 21.3 11.4 0.4 1.1
Polypropylene 18.0 0.0 1.0 18.0 6.0 2.2 3.7
Polystylene 21.3 5.8 4.3 22.5 12.7 1.0 1.3
UHMW 18.0 3.0 4.0 18.7 2.0 4.9 9.5

31
Figure 3.3. Two dimensional Hansen space with general polymers.
The classic formula with HSP can be obtained:
(δ)2 = (δD)2 + (δP)2 + (δH)2 (Eq. 3.8)
Figure 3.4 shows the actual swelling ratios of the tested polymer samples based on HSP.
The samples were immersed in DMC single solvent and in a EC/DMC mixture at room
temperature for 3 weeks prior to measuring the swelling ratios. We found that the solubility
parameter of the polymers correlated relatively well with its uptake in the DMC single solvent
and in the EC/DMC mixture. This initial screening activity gave us a database of information on
electrolyte uptake, which will feed into the selection of reasonable adhesives for this environment.

32
16 18 20 22 24 26 28 30 32
0
20
40
60
80
100
Nylon 6
Nylon 6/6
PSPLAABS
PPO
HDPE
UHMWPEPP
(a)
Sw
elli
ng
ra
tio
(w
t%)
Solubility Parameter (MPa1/2
)
LDPE
16 18 20 22 24 26 28 30 32
0
20
40
60
80
100
Sw
elli
ng
ra
tio
(w
t%)
Solubility Parameter (MPa1/2
)
(b)
LDPE
ABS
Nylon 6
Nylon 6/6
HDPE
UHMWPEPP PPO
ABS
PLA
PS
Figure 3.4. Solvent uptakes of general polymers at room temperature for a week.
(a) in DMC (δDMC=20.2); (b) in EC/DMC mixture (δEC/DMC=24.6)

33
Figure 3.5 shows the swelling ratios of a range of commercial bulk adhesives and
sealants. All samples were cured at room temperature for 24 hours as circular discs with 25.0 mm
dia. × 2.5 mm thickness. The prepared samples were placed into a glass jar and immersed in a
DMC single solvent and in a EC/DMC mixture at room temperature for 3 weeks. The swelling
ratios were monitored every week. The overall swelling trends of these materials were similar in
DMC and EC/DMC solvents, but the swelling ratios of DMC single solvent were higher than that
of EC/DMC mixture. In this experiment, E-120HP and Epoxy 9462 were observed to have the
lowest uptake. Both E-120HP and Epoxy 9462 may uptake a DMC single solvent and a EC/DMC
mixture up to the equilibrium swelling ratios in a week due to the fact that there were no
significant uptake after a week (< 3 wt%).

34
Silicone D
ow 9-1363
Epoxy 9462
Silicone R
TV 6700
Epoxy E-120HP
Silicone R
TV BLUE
Epoxy 608
Urethane U-05FL
Epoxy E-05MR
Acrylics 3151
0
40
80
120
160
Sw
elli
ng r
atio
(w
t%)
7 days
14 days
21 days
(a)
Silicone D
ow 9-1363
Epoxy 9462
Silicone R
TV 6700
Epoxy E-120HP
Silicone R
TV BLUE
Epoxy 608
Urethane U-05FL
Epoxy E-05MR
Acrylics 3151
0
40
80
120
160
Sw
elli
ng r
atio
(w
t%)
7 days
14 days
21 days
(b)
Figure 3.5. Solvent uptakes of commercial bulk adhesives at room temperature for 3 weeks.
(a) in DMC; (b) in EC/DMC mixture.

35
3.3.2. Tensile Strength and Single Lap Shear Test
Tensile strength tests were conducted to downselect an adhesive with the highest
cohesive bonding strength in electrolytes from low uptake samples in the swelling experiments;
E-120HP and Epoxy 9462. Figure 3.6 presents the results of the tensile strength tests. A decrease
in tensile strengths was observed on exposure to EC/DMC mixtures for a week. The electrolyte
absorbed can act as a plasticizer, so it contributes to the degradation of the mechanical properties
of the adhesives. Finally, E-120HP was selected for single lap shear testing since this material
had the greater strength than Epoxy 9462 at both pristine and soaked states.
E-120HP Epoxy 94620
10
20
30
40
50
Te
nsile
Str
en
gth
(M
Pa
)
Pristine
Soaked
Figure 3.6. Tensile strengths of E-120HP and Epoxy 9462; pristine and soaked in EC/DMC
mixture at room temperature for a week.
The conventional gravimetric swelling tests were conducted in a mixture of EC/DMC in
order to screen many samples for a low uptake adhesive and avoid potential hazard issue with
LiPF6, but the real Li-ion battery electrolyte contains LiPF6 salt. Thus, comparison of degradation

36
in real electrolyte with that of the previous result was required to investigate the response of the
adhesive to the presence of the salt. The single lap shear strengths were measured after exposure
to EC/DMC with and without 1M LiPF6 at room temperature.
The results shown in Figure 3.7 represent an average of three test specimens. A decrease
in lap joint shear strengths was observed same as tensile strength tests. The addition of LiPF6 salt
to the EC/DMC mixture significantly decreased the lap shear strengths with respect to the pure
solvents. This change can be explained by the preferential LiPF6 solvation with EC. It is known
that the Li+ solvation energy with EC is much stronger than that of DMC.23 Therefore, the
solvation may decrease the affinity between EC and DMC allowing DMC to penetrate into the
crosslinked epoxy structure. As a result, the LiPF6 salt added mixture had much higher swelling
than EC/DMC mixture. Figure 3.8 demonstrates that the swelling ratio of E-120HP in 1M LiPF6-
EC/DMC mixture is 2.7 times higher than that of in EC/DMC after 2 weeks while being similar
to that of the DMC single solvent.

37
Pristine EC/DMC
1 Week
EC/DMC
3 Months
LiPF6-EC/DMC
3 Months
0
3
6
9
12
15
18
Sh
ea
r S
tre
ng
th (
MP
a)
Figure 3.7. Lap shear strengths of E-120HP under electrolyte conditions.
DMC EC/DMC 1M LiPF6-EC/DMC0
5
10
15
20
25
Sw
elli
ng
ra
tio
(w
t %
)
1 day
7 days
14 days
Figure 3.8. Swelling ratios of E-120HP in DMC, EC/DMC, and 1M LiPF6-EC/DMC.

38
3.3.3. Sol Extraction Test / Differential Scanning Calorimetry
Epoxy adhesive is a thermosetting material which undergoes a cross-linking reaction
after mixing the epoxy and amine components as in the case of E-120HP which is a two-part
formulation. During curing, it is possible for unreacted or partially reacted molecules to be
present due to chemical formulation differences (not 1:1 stoichiometry) or incomplete reaction
due to vitrification. Therefore, sol extraction tests and DSC analyses were conducted in order to
measure the gel fraction and residual curing of the samples.
Sol extraction tests were performed by immersing the epoxy samples in solvent for a
designated period. This experiment allows us to estimate the gel fraction by measuring the
solvent uptake ratio and the amount of the extracted residue. Before conducting uptake and
extraction tests, four solvents (toluene, methanol, hexane, and chloroform) were investigated first
in order to search for a good solvent which is able to swell the E-120HP epoxy adhesive as much
as possible for maximum extraction. From the swelling tests, toluene was selected as a test
solvent for this test (>40 wt% for 3 weeks).
Figure 3.9 presents that as curing temperature increases, the toluene uptake ratio
decreases. Typically, the uptake ratio is related to the crosslink density because the chemical
linkages between the chains prevent solvent molecules from penetrating into the polymer
structure. Thus, this data can be rationalized by the epoxy adhesive having a higher crosslink
density when cured at a higher temperature.

39
Room 60 80 100
30
33
36
39
42
45
Ma
ss U
pta
ke
(w
t%)
Curing Temperature (℃)
Figure 3.9. Toluene uptake ratios of E-120HP at room temperature for 2 weeks.
Figure 3.10(a) illustrates the amount of extracted sol as a function of curing temperature.
The sol from uncured monomers can be extracted into the electrolyte during the life of the battery
and may impact its electrochemical performance, so the epoxy adhesive should be cured to
approach the 100% gel state. In Figure 3.10(b), it can be observed that the epoxy adhesive is
cured well even at room temperature due to the gel fraction being higher than 98.8%. For this
experiment, five identical samples were measured to obtain the average gel fraction and standard
deviation. The standard deviation of the gel fraction at room temperature was 0.4%. However, for
complete curing, the temperature should be higher than 60°C where a significant increase in gel
fraction is observed (> 1.0%). The gel fractions between 60°C and 100°C are similar showing that
increased temperatures above 60°C are likely not necessary.
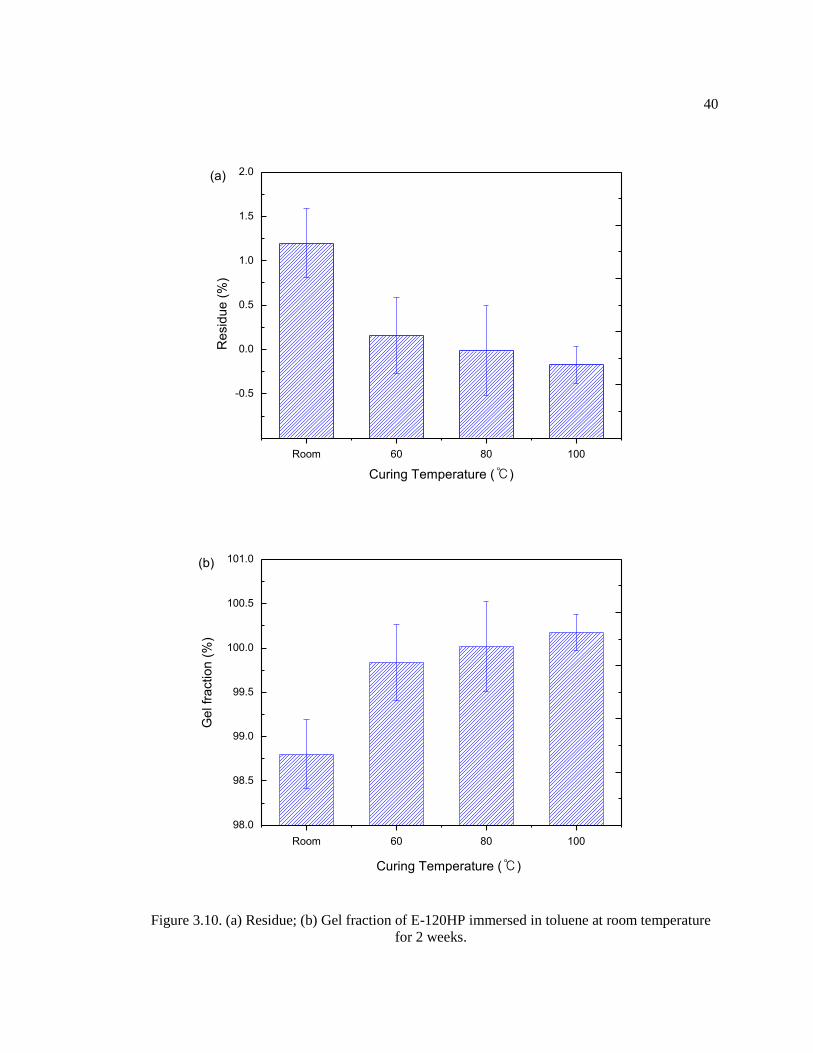
40
Room 60 80 100
-0.5
0.0
0.5
1.0
1.5
2.0(a)
Re
sid
ue
(%
)
Curing Temperature (℃)
Room 60 80 100
98.0
98.5
99.0
99.5
100.0
100.5
101.0
Ge
l fr
actio
n (
%)
Curing Temperature (℃)
(b)
Figure 3.10. (a) Residue; (b) Gel fraction of E-120HP immersed in toluene at room temperature
for 2 weeks.

41
Differential scanning calorimetry (DSC) was used to analyze the conversion ratio of the
epoxy at the different curing temperatures. Because the epoxy-amine reaction is exothermic, DSC
can measure the amount of uncured epoxy monomer in the cured sample by detecting the residual
heat of reaction during heating of the cured sample and comparing this value to the total heat of
reaction of the uncured epoxy. Also, the glass transition temperature Tg, shown on DSC trace, can
be used to indirectly estimate when full cure is reached and the sample is completely vitrified.
Generally, with an increase in crosslink density, the freedom of movement in the sample’s
network structure becomes limited. Therefore, the complete cross-linking can be estimated by
checking the shift of Tg under different curing conditions.
From Figure 3.11, glass transition temperatures of cured samples increases from room
temperature to 80°C. This data illustrates that the cross-linking of the epoxy increases up to
between 60 to 80°C. However, the glass transition temperatures and the shape of DSC curves are
the same as the completely cured sample beyond 80°C. So, it can be concluded that a curing
temperature of at least 80°C is required for 24 hours in order to fully cure the E-120HP adhesive.

42
40 80 120 160 200 240
ΔHrxn
(39.8J/g)
ΔHrxn
(445.4J/g)
Tg
Completely cured
100
80
60
RTHe
at F
low
(E
xo
Up
)
Temperature (℃)
Uncured
Figure 3.11. DSC curves of uncured and cured E-120HP at different temperatures for 24 hours.
In addition, at curing temperatures of 60°C and greater, there is no residual heat of
reaction (△Hres) of uncured monomer shown in the DSC analysis. This data demonstrates that all
monomers have reacted as much as possible in the epoxy-amine reaction beyond 60°C. The △Hres
can be used to calculate the conversion of the reaction at the condition. The degree of conversion
can be described with:
Conversion (%) =∆Hrxn − ∆Hres
∆Hrxn× 100 (Eq. 3.9)
where △Hrxn and △Hres are differential enthalpies of totally and partially uncured monomers,
respectively. From this DSC curve and the conversion equation, the conversion of RT curing was

43
estimated to be 91.1%. At temperatures greater than 60°C, the conversion was nearly 100%. This
trend is correlated well to the gel fraction data as discussed earlier.
Using this knowledge of E-120HP, a sandwich structure was bonded and tested in three-
point bending. Shown in Figure 3.12 are schematics and photographs of the assembled panel
showing the face sheet, battery core, and adhesive. The panel contained electrolyte for 30 days
before mechanical testing. From the three-point bending tests, the adhesive used in this
fabrication was sufficient to provide bonding of the panel to withstand the bending tests
(>1000N). Full analysis of the panel performance has been presented previously.2
Figure 3.12. Photographs of the sandwich panel. (a) End view; (b) The assembled structure.

44
3.4. References
[1] Vinson JR. The behavior of sandwich structures of isotropic and composite materials.
Lancaster, PA: Technomic, 1999.
[2] Singh, A. K., Cao, L., Ma, J., Seo, J., Bakis, C. E., Zhang, Y., ... & Rahn, C. D. (2015).
Design, manufacture and test of a novel structural battery based on sandwich construction.
Journal of Sandwich Structures and Materials, 17(6), 666-690.
[3] Sun, Z., Hu, X., & Chen, H. (2014). Effects of aramid-fibre toughening on interfacial fracture
toughness of epoxy adhesive joint between carbon-fibre face sheet and aluminium substrate.
International Journal of Adhesion and Adhesives, 48, 288-294.
[4] Fojtl, L., Rusnáková, S., Žaludek, M., & Rusnák, V. (2015). Influence of the type and number
of prepreg layers on the flexural strength and fatigue life of honeycomb sandwich structures.
Materiali in tehnologije.
[5] Quini, J. G., & Marinucci, G. (2012). Polyurethane structural adhesives applied in automotive
composite joints. Materials Research, 15(3), 434-439.
[6] Real, J. D., De Santayana, M. C., Abenojar, J., & Martinez, M. A. (2006). Adhesive bonding
of aluminium with structural acrylic adhesives: durability in wet environments. Journal of
adhesion science and technology, 20(16), 1801-1818.
[7] Zhu, B. W., Lin, A., & Gan, F. X. (2014, June). Study on vinyl ester based structural anchor
adhesive for fast, low temperature cures. In Advanced Materials Research (Vol. 919, pp. 2099-
2104).
[8] Al-Harthi, M., Kahraman, R., Yilbas, B., Sunar, M., & Aleem, B. A. (2004). Influence of
water immersion on the single-lap shear strength of aluminum joints bonded with aluminum-
powder-filled epoxy adhesive. Journal of adhesion science and technology, 18(15-16), 1699-1710.
[9] Edwards, K. L. (1998). A designers' guide to engineering polymer technology. Materials &
design, 19(1), 57-67.
[10] Eagland, D. (1988). Adhesion and adhesive performance: the scientific background.
Endeavour, 12(4), 179-184.
[11] Bowditch, M. R. (1996). The durability of adhesive joints in the presence of water.
International Journal of Adhesion and Adhesives, 16(2), 73-79.
[12] Lee, L. H. (1987). Adhesives and sealants for severe environments. International Journal of
Adhesion and Adhesives, 7(2), 81-91.
[13] Anderson, B. J. (2011). Thermal stability of high temperature epoxy adhesives by
thermogravimetric and adhesive strength measurements. Polymer Degradation and Stability,
96(10), 1874-1881.
[14] Tai, R. C. L., & Szklarska-Smialowska, Z. (1993). Effect of fillers on the degradation of
automotive epoxy adhesives in aqueous solutions. Journal of materials science, 28(22), 6205-
6210.
[15] Prolongo, S. G., & Urena, A. (2009). Effect of surface pre-treatment on the adhesive strength
of epoxy–aluminium joints. International Journal of Adhesion and Adhesives, 29(1), 23-31.

45
[16] Tomlinson, W. J., & Stapley, D. (1977). Thermal conductivity of epoxy resin-aluminium.
Journal of materials science, 12(8), 1689-1690.
[17] Nikkeshi, S., Kudo, M., & Masuko, T. (1998). Dynamic viscoelastic properties and thermal
properties of Ni powder–epoxy resin composites. Journal of Applied Polymer Science, 69(13),
2593-2598.
[18] Wang, H., Bai, Y., Liu, S., Wu, J., & Wong, C. P. (2002). Combined effects of silica filler
and its interface in epoxy resin. Acta Materialia, 50(17), 4369-4377.
[19] Gupta, N., Brar, B. S., & Woldesenbet, E. (2001). Effect of filler addition on the
compressive and impact properties of glass fibre reinforced epoxy. Bulletin of Materials Science,
24(2), 219-223.
[20] Hansen CM, The three dimensional solubility parameter and solvent diffusion coefficient
and their importance in surface coating formulation, Copenhagen: Danish Technical Press, 1967.
[21] Hansen CM, Hansen solubility parameters: a user's handbook, Boca Raton, Fla: CRC Press,
2000 .
[22] Sato, S., Gondo, D., Wada, T., Kanehashi, S., & Nagai, K. (2013). Effects of various liquid
organic solvents on solvent‐induced crystallization of amorphous poly (lactic acid) film. Journal
of Applied Polymer Science, 129(3), 1607-1617.
[23] Morita, M., Asai, Y., Yoshimoto, N., & Ishikawa, M. (1998). A Raman spectroscopic study
of organic electrolyte solutions based on binary solvent systems of ethylene carbonate with low
viscosity solvents which dissolve different lithium salts. J. Chem. Soc., Faraday Trans., 94(23),
3451-3456.

46
Chapter 4
3D Printing of Micro-patterned Anion Exchange Membranes
4.1. Introduction
During the last 50 years, the development and use of ion exchange membranes has
attracted considerable attention and these materials have been employed in a wide range of
applications such as desalination of brackish water,1 treatment of wastewater,2 and separation of
ionic species for pharmaceutical products,3 as well as energy storage and conversion systems.4
Ion exchange membranes are composed of water-swellable polymeric materials with charged
ionic groups tethered to the polymer matrix. In the membrane, the fixed charged groups are in
equilibrium with mobile counter-ions (i.e., ions with the opposite charge to those that are bound
to the membrane’s polymer backbone) but can move through the membrane due to charge
separation by hydration.5 Co-ions (i.e., the ions with the same charges as those that are bound to
the membrane’s polymer backbone) are more or less excluded from the membrane due to Donnan
exclusion which permits transfer of counter-ions only. Traditionally, ion exchange membranes
are classified into anion and cation exchange membranes depending on the type of attached
charge groups. The cation exchange membranes contains negatively charged groups, such as -
SO3-, -COO-, -PO3
2-, -PO3H-, -C6H4O-, while anion exchange membrane contains positively
charged groups, such as -NH3+, -NRH2+, -NR2H+, -NR3+, -PR3
+, -SR2+.6
For many applications, the most desired properties of ion exchange membranes are (i)
high permselectivity, (ii) low ionic resistance, and (iii) good mechanical, chemical, and thermal
stability. However, these parameters often have to be optimized for a specific use. For example, a
high degree of cross-linking can improve the mechanical strength of the ion exchange membrane,
but also increase the ionic resistance due to lower water uptake.7 To overcome these types of

47
trade-offs, patterning on the surface of the membrane has been suggested as a solution to increase
the transport flux of the membrane while maintaining low water swelling. Zhou, et al. have
reported that patterned ion exchange membranes for a fuel cell demonstrated higher power
densities in fuel cell membrane electrode assembly (MEA) testing over those of flat samples. It
was hypothesized that a larger interfacial area between the membrane and catalyst layer
contributed to the higher performance of the patterned samples.8
In addition to a pattern’s ability to improve the membrane’s transport performance,
patterns can provide other functionalities that improve the overall performance of the device. Liu,
et al. have suggested a way to enhance the performance of microbial reverse-electrodialysis cells
(RED) by replacing a typical non-conductive spacer with a patterned membrane that eliminated
the spacer, but still allows flow.9 Instead of the traditional flow channel where a non-conductive
spacer supports between two flat membranes, a channel constructed by stacking conductive
patterned membranes exhibited greater turbulence promotion and larger active membrane surface
than those of traditional flat membranes and spacers. The use of the patterned membrane
decreased the internal resistance of the entire stack resulting in a 38% increase in power density.
Also, Lee, et al. have reported that patterning on membrane surfaces can provide an approach to
reduce fouling in microfiltration systems.10 In the study, it was confirmed that the flow
characteristics and stress distributions over the membrane surface relied on the shape of patterns.
Such surface modifications have been achieved using a variety methods such as abrasion,11
plasma treatment,12,13 hot pressing,14,15 optic and electronic lithography.8,16
In spite of such advantages of surface patterning for ion exchange membranes, there is a
lack of data on anion exchange membrane patterning because most studies have been aimed at
cation exchange membranes or Nafion-type structures and the mechanism of membrane’s
performance improvement by patterning has not been elucidated in detail. Additionally, in many

48
molded membrane examples, a hard template for the pattern is used and a new, often expensive
mold is needed to investigate new patterns.
In this study, we (i) introduce a novel method to synthesize anion exchange membranes
via a combination of 3D printable photoinitiated free radical polymerization and quaternization,
(ii) characterize the properties of the synthesized flat and patterned membranes in terms of their
water uptake, permselectivity, and ionic resistance, and (iii) propose a parallel resistance model to
explain the performance improvement of patterned membranes.
4.2. Experimental Procedure and Characterization
4.2.1. Materials
The photocurable formulation for this study was prepared using commercial monomer,
oligomer, crosslinker, and photoinitiator. 1-Hydroxycyclohexyl phenyl ketone (Irgacure 184,
initiator), phenylbis(2,4,6-trimethyl-benzoyl)phosphine oxide (Irgacure 819, initiator), diurethane
dimethacrylate (DUDMA, molecular weight 471 g/mol), poly(ethylene glycol) diacrylate
(PEGDA, number-average molecular weight 700 g/mol), dipentaerythritol penta-/hexa-acrylate
(crosslinker), trimethylamine (TMA, 30 wt % aqueous solution), and 4-vinylbenzyl chloride
(precursor for quaternization) were purchased from Sigma-Aldrich. Sudan I (UV absorber) was
obtained from Acros organics. TMA/MeOH solution for quaternization was prepared by mixing
TMA aqueous solution and methanol 1:9 by volume. All chemicals were used without further
purification.
4.2.2. Printing and Quaternization of AEMs
The photocurable formulation was prepared by first mixing together the desired ratios of
monomer (VBC), oligomer (DUDMA and PEGDA), and crosslinker (dipentaerythritol penta-

49
/hexa-acrylate). Next, two types of photoinitiators, 1-dydroxycyclohexyl phenyl ketone (1
weight %, UV/VIS absorption peaks in methanol: 246, 280, 333 nm) and phenylbis(2,4,6-
trimethyl-benzoyl)phosphine oxide (1 weight %, UV/VIS absorption peaks in methanol: 295, 370
nm), were added together into the mixture. Two photoinitiators were used for initiation over a
wide range of wavelengths due to the broadband light used for photopolymerization. UV absorber,
Sudan I (0.02% w/w), was also added to improve the shape resolution of the patterned
membrane.17 The formulations were contained in amber glass vials before printing to prevent
undesirable curing from natural light. Homogenization of the formulations was achieved by
thoroughly stirring using a magnetic stirrer for at least 3 hours before use.
To print anion exchange membranes, the photocurable mixture was placed as a thin layer
with controlled thickness into a glass Petri dish using a syringe. Then, the layer was exposed to a
digital light projector pattern (EX5210, Epson) to cure the mixture for 10 minutes. To form
patterns on the membrane surface, additional mixture was added on the base layer, and a slide
show consisting of black and white patterns was projected onto the mixture using Micrososft
PowerPoint software. After the curing step, the printed membrane was rinsed with methanol and
de-ionized water several times to remove uncured material. Patterned membranes in benzyl
chloride form were then converted to quaternary ammonium form by immersion in TMA/MeOH
solution (50 mL) for 24 hours at room temperature.
4.2.3. FT-IR Characterization
FT-IR spectra of synthesized poly(DU-co-EG-co-VBC) and the quaternized membrane
were obtained using a Bruker Vertex 70 FT-IR spectrometer (Bruker, Billerica, MA) equipped
with a liquid nitrogen cooled mercury cadmium telluride (MCT) detector. A VariGATR ATR
accessory (Harrick Scientific Products, Inc. NY) with a hemispherical Ge ATR crystal was used.

50
The spectra were signal averaged over 100 scans at 4 cm−1 resolution and a nitrogen purge at
ambient temperature. All spectra were recorded using Bruker OPUS 6.5 software.
4.2.4. Water Uptake
Three pieces of the quaternized poly(DU-co-EG-co-VBC) with 1cm × 1cm dimensions
were used to obtain the average water uptake and standard deviation of the sample. First, the
quaternized membrane was immersed in 1M NaOH solution for 24 hours to convert Cl- to OH-
form after quaternization. Then, the membrane (OH- form) was soaked in de-ionized water for 24
hours again to fully saturate with the water. During the two soaking steps, fresh NaOH solution
and de-ionized water were replaced at least three times, respectively.
The fully water-immersed membrane was weighed after briefly wiping the surface to
remove surface water. Then, the membrane was dried in a vacuum oven at 50°C for at least 12
hours to measure the weight of dry state sample. The water uptake of anion exchange membrane
was calculated using:
Water uptake (%) = Wwet − Wdry
Wdry× 100 (Eq. 4.1)
where Wdry and Wwet are weights of membranes at dry state and at wet state, respectively.
4.2.5. Permselectivity
Apparent permselectivity of the quaternized poly(DU-co-EG-co-VBC) membranes was
determined following a previously described procedure.18 All measured membranes were soaked
in 0.5M NaCl solution for at least 24 hours prior to the measurement in order to ensure full
saturation with the NaCl solution. Then, the potential difference across the membrane was
measured using the device illustrated in Figure 1. During this measurement, the anion exchange
membrane was placed at the middle of the device, and high concentration (0.5M) and low
51
concentration (0.1M) NaCl solutions were pumped on either side of the membrane at a flow rate
of 5 mL/min. Two overhead mechanical stirrers were used at a speed of 550 rpm to homogenize
each compartment. To calculate the permselectivity, the potential difference across the membrane
was recorded via Labview software using two double junction Ag/AgCl reference electrodes
(RREF0024, Pine Instrument Company, Grove City, PA) as a function of time until the potential
difference was stabilized. Immediately after the measurement, the potential difference of two
Ag/AgCl reference electrodes in 0.5M NaCl solution was measured again to obtain offset
potential. From the measured data, the apparent permselectivity was calculated as:19
αap = ψmeasured − ψoffset
ψtheoratical (Eq. 4.2)
where ψmeasured, ψoffset, and ψtheoratical are measured, offset, and theoretical potential differences,
respectively. The value of ψtheoratical can be calculated from thermodynamic activities of the salt
solutions. The activity coefficients of 0.1M and 0.5M NaCl solutions are 0.778 and 0.681,
respectively.20 Thus, the ψtheoratical was calculated to be 37.5 mV through the Nernst equation. At
least three measurements were performed for each membrane to obtain the average
permselectivity and standard deviation.

52
Figure 4.1. Schematic of the cell for measuring membrane permselectivity.
4.2.6. Ionic Resistance
The ionic resistance of the quaternized poly(DU-co-EG-co-VBC) membranes was
determined using a DC current measurement following a previously described procedure.18 All
measured membranes were soaked in 0.5M NaCl solution for 24 hours prior to the measurement.
As shown in Figure 2, a two-compartment cell was used to measure the ionic resistance. In the
cell, the membrane was clamped between two reservoirs and 0.5M NaCl solution was filled into
the reservoirs on each side contacting the membrane. Two platinum mesh electrodes were placed
at the end of each side to apply a current. For the measurement of electric potential drops across
the membrane, two platinum rod electrodes were positioned on either side of the membrane. The
applied currents (1, 2, 3, 4, 5, and 6 mA) and voltages were recorded using Labview software.
The ionic resistance of the system was determined by a slope of the current-voltage curve
following Ohm’s law (R = V/I). To subtract the background resistance caused by NaCl solution,
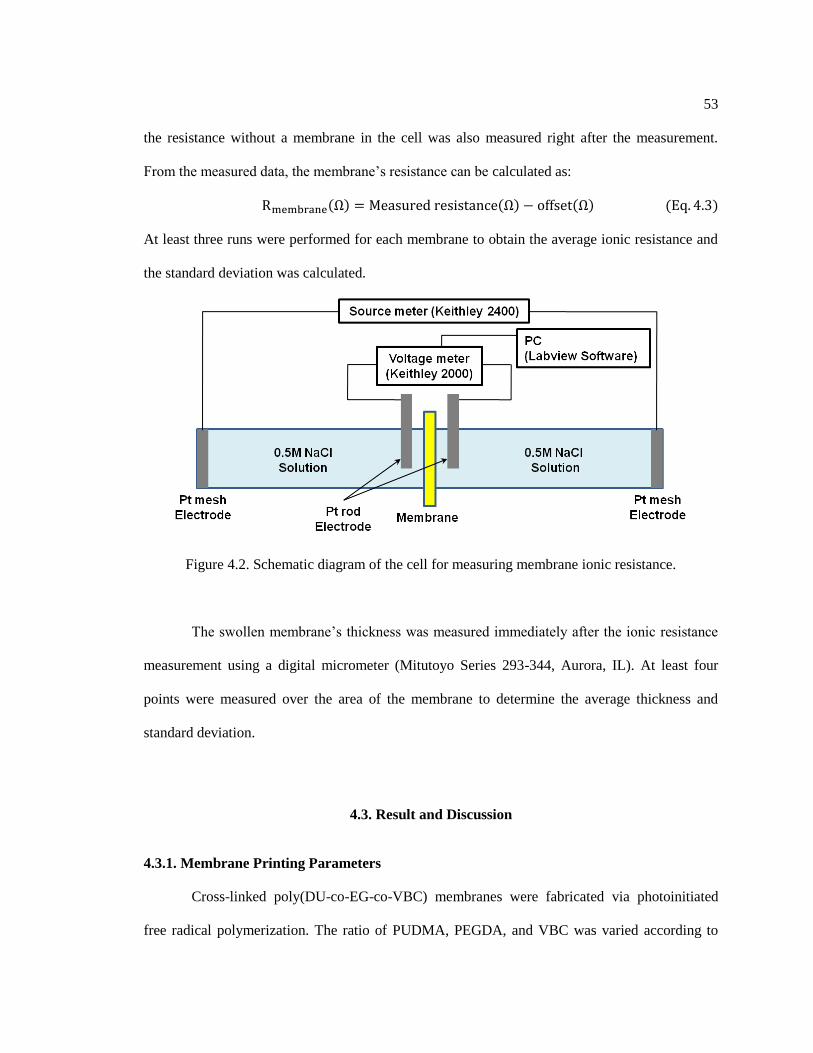
53
the resistance without a membrane in the cell was also measured right after the measurement.
From the measured data, the membrane’s resistance can be calculated as:
Rmembrane(Ω) = Measured resistance(Ω) − offset(Ω) (Eq. 4.3)
At least three runs were performed for each membrane to obtain the average ionic resistance and
the standard deviation was calculated.
Figure 4.2. Schematic diagram of the cell for measuring membrane ionic resistance.
The swollen membrane’s thickness was measured immediately after the ionic resistance
measurement using a digital micrometer (Mitutoyo Series 293-344, Aurora, IL). At least four
points were measured over the area of the membrane to determine the average thickness and
standard deviation.
4.3. Result and Discussion
4.3.1. Membrane Printing Parameters
Cross-linked poly(DU-co-EG-co-VBC) membranes were fabricated via photoinitiated
free radical polymerization. The ratio of PUDMA, PEGDA, and VBC was varied according to

54
Table 1 to achieve membranes that had a range of water uptakes and ion exchange capacities
(IEC). The calculated IECs of three concentrations of VBC (25, 20, and 15 weight %) were 1.63,
1.33, and 0.98 meq/g, respectively.
Table 4.1. Compositions of the 3D printed anion exchange membranes.
Sample Composition (weight %) Calculated
IEC (meq/g) PUDMA PEGDA Cross Linker VBC
U70_E00_V25 70 0 5 25
1.63
U60_E10_V25 60 10 5 25
U50_E20_V25 50 20 5 25
U40_E30_V25 40 30 5 25
U30_E40_V25 30 40 5 25
U20_E50_V25 20 50 5 25
U75_E00_V20 75 0 5 20
1.33
U60_E15_V20 60 15 5 20
U45_E30_V20 45 30 5 20
U30_E45_V20 30 45 5 20
U15_E60_V20 15 60 5 20
U80_E00_V15 80 0 5 15
0.98
U65_E15_V15 65 15 5 15
U50_E30_V15 50 30 5 15
U35_E45_V15 35 45 5 15
U20_E60_V15 20 60 5 15
Flat and surface-patterned membranes were fabricated via a custom photolithographic
process similar to those previously reported.17,21 The projection setup required a digital projector,
a converging lens, a front-surface mirror, and a glass substrate as shown in Figure 3. A clamp and
a stand were used to hold the mirror appropriately. The lens should be as close as possible to the
digital projector for optimal focal length, and the mirror should be positioned near the lens so that
the focal plane of the image is parallel to the glass substrate.

55
Figure 4.3. Schematic diagram of the projection setup
A slide show was prepared using Microsoft PowerPoint software with a black
background and white patterns as illustrated in Figure 4(a). Some examples of fabricated flat and
patterned membranes are shown in Figure 5.
Figure 4.4. (a) Example patterns; and (b) resulting cross-sectional views of the cured membrane
profiles.

56
Figure 4.5. Photographs of example patterned membranes.
For quaternization to replace the benzyl chloride moieties with ionic trimethyl
ammonium groups, the cured sample was placed into a glass jar containing TMA/MeOH solution
(50 mL) for 24 hours at room temperature directly after printing the membrane. The substitution
was verified by comparing FT-IR spectra of the membrane before and after the quaternization.
For the polymer quaternized with trimethylamine, the infrared absorptions due to the quaternary
ammonium moiety were observed at 832, 857 and 891cm-1. These results show that the ionic
quaternary ammonium groups were successfully introduced to the base polymer through the
quaternization process as previously described.22

57
1400 1300 1200 1100 1000 900 800
857 832
Quaternized Poly(DU-co-EG-co-VBC)
Ab
so
rba
nc
e
Wavenumber (cm-1)
Poly(DU-co-EG-co-VBC)
891
Figure 4.6. FT-IR spectra of poly(DU-co-EG-co-VBC) and the quaternized membrane.
4.3.2. Water Uptake
The total water uptake of an ion exchange membrane not only determines its mechanical
properties, but water uptake is influential in controlling the permselectivity and ionic resistance of
the sample. It has been reported that charged groups in the ion exchange membrane correlates
with the hydrophilicity which positively influences the rate of ion exchange.23 Additionally, the
permselectivity generally decreases as the water volume fraction of the membrane increases.18
The water uptake of ion exchange membranes depends on a number of different parameters such
as nature of the polymer matrix, charged group concentration, counter-ions, cross-linking density,
and homogeneity of the membrane.5 In this study, the trend in water uptake was investigated in
terms of the concentration of charged groups (TMA) and the nature of the polymer matrix (PEG).

58
Figure 7 shows the water uptake for quaternized poly(DU-co-EG-co-VBC) samples as a
function of the PEG/PDU ratio and the weight fraction of VBC in the sample. Due to the benzyl
chloride moieties being replaced with ionic trimethyl ammonium groups, the concentration of
VBC was correlated with that of charged groups in the anion exchange membrane, as shown in
Table 1. In Figure 7, the water uptake of the anion exchange membranes (OH- form) generally
increased as the IEC of the samples increased (V25 > V20 > V15). This result can be explained
by the quaternary ammonium groups on the polymer backbone increasing the hydrophilicity of
the membrane. Also, the water uptake of the anion exchange membranes varied sensitively with
the PEG content in all V25, V20, and V15 samples due to PEG’s hydrophilicity.24 Interestingly,
in the case of V15 and V20 samples without a PEG component (PEG/PDU ratio is 0), these
samples exhibited slightly higher water uptakes than those of membrane with a small amount of
PEG (PEG/PDU ratio < 0.2). This may be caused by the different cross-linking structure of
quaternized poly(DU-co-VBC) from that of quaternized poly(DU-co-EG-co-VBC) and the polar
groups on the DU structures.

59
0 1 2 3 4
100
200
300
400
500
V15
(0.98 meq/g)
V20
(1.33 meq/g)
U20_E60
U35_E45
U50_E30U65_E15
U80_E0
U15_E60
U30_E45
U45_E30
U60_E15U75_E0
U20_E50
U30_E40
U40_E30
U50_E20
U60_E10
Wa
ter
up
tak
e (
%)
PEG/PDU Ratio (w/w)
V25
(1.63 meq/g)
U70_E0
Figure 4.7. Water uptake vs. PEG/PDU ratio of quaternized poly(DU-co-EG-co-VBC).
4.3.3. Permselectivity
Permselectivity is defined as the preferential permeation of certain ionic species through
ion exchange membranes. Thus, a perfectly permselective membrane is one where co-ions are
completely excluded from the polymer matrix and prevented from migrating through the
membrane.25 For anion exchange membranes, such perfectly permselective membranes would
transport current only via anionic charge carriers since all cations would be excluded from the
membrane. If co-ion transport occurs, the permselectivity will be below the ideally permselective
value of 1. Generally, the permselectivity has been reported to increase with increasing fixed
charge content in cross-linked ion exchange membranes.26
Figure 8 presents the permselectivity of quaternized poly(DU-co-EG-co-VBC) samples
as a function of water uptake and the concentration of VBC. For these samples, the

60
permselectivity decreased as the water uptake increased. Due to the fact that the absorbed water
plays a role in increasing the volume of the membrane resulting in decrease in fixed charge
concentration, these results are relatively consistent with the general view that permselectivity
decreases with decreasing fixed charge concentration. In terms of ion exchange capacity, the
permselectiviy increased with increasing concentration of VBC (V25 > V20 > V15). This result
also corresponds to the common design guideline for ion exchange membranes that indicates that
high fixed charge concentration is needed to promote high permselectivity samples. In the case of
sample U80_E0_V15, the permselectivity was lower than other compositions which had similar
water uptake and the same weight fraction of VBC. This result may be caused by the different
cross-linking structure in the samples due to absence of PEG.
100 200 300 400 5000.84
0.86
0.88
0.90
0.92
V25
V20
V15
Pe
rms
ele
cti
vit
y
Water uptake (%)
U65_E15
U50_E30
U35_E45U20_E60
U80_E0
U75_E0
U60_E15 U45_E30
U30_E45
U15_E60
U70_E0 U60_E10
U50_E20
U40_E30
U30_E20
U20_E50
Figure 4.8. Permselectivity vs. water uptake for quaternized poly(DU-co-EG-co-VBC).
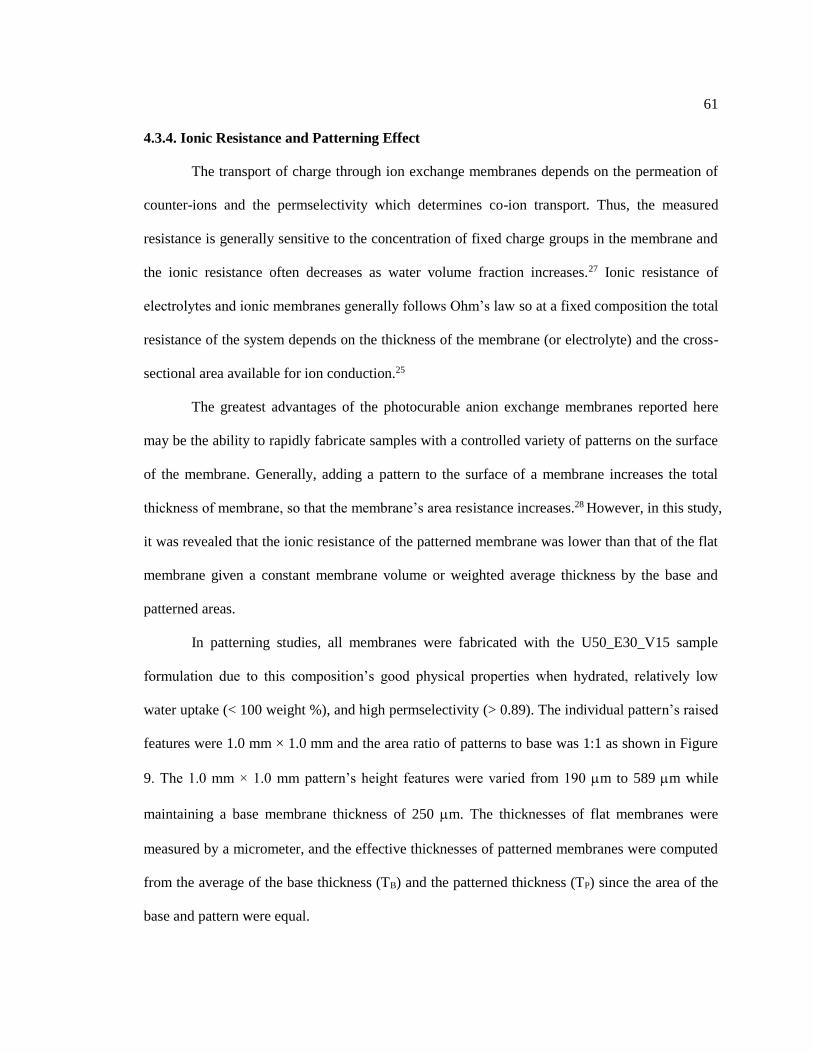
61
4.3.4. Ionic Resistance and Patterning Effect
The transport of charge through ion exchange membranes depends on the permeation of
counter-ions and the permselectivity which determines co-ion transport. Thus, the measured
resistance is generally sensitive to the concentration of fixed charge groups in the membrane and
the ionic resistance often decreases as water volume fraction increases.27 Ionic resistance of
electrolytes and ionic membranes generally follows Ohm’s law so at a fixed composition the total
resistance of the system depends on the thickness of the membrane (or electrolyte) and the cross-
sectional area available for ion conduction.25
The greatest advantages of the photocurable anion exchange membranes reported here
may be the ability to rapidly fabricate samples with a controlled variety of patterns on the surface
of the membrane. Generally, adding a pattern to the surface of a membrane increases the total
thickness of membrane, so that the membrane’s area resistance increases.28 However, in this study,
it was revealed that the ionic resistance of the patterned membrane was lower than that of the flat
membrane given a constant membrane volume or weighted average thickness by the base and
patterned areas.
In patterning studies, all membranes were fabricated with the U50_E30_V15 sample
formulation due to this composition’s good physical properties when hydrated, relatively low
water uptake (< 100 weight %), and high permselectivity (> 0.89). The individual pattern’s raised
features were 1.0 mm × 1.0 mm and the area ratio of patterns to base was 1:1 as shown in Figure
9. The 1.0 mm × 1.0 mm pattern’s height features were varied from 190 m to 589 m while
maintaining a base membrane thickness of 250 m. The thicknesses of flat membranes were
measured by a micrometer, and the effective thicknesses of patterned membranes were computed
from the average of the base thickness (TB) and the patterned thickness (TP) since the area of the
base and pattern were equal.

62
Figure 4.9. Photomicrographs of flat and patterned membranes along with pattern schematic; the
individual pattern’s size was 1.0 mm × 1.0 mm and the area ratio was 1:1.
250 300 350 400 450 500 550
0.8
1.2
1.6
2.0
Patterned membranes
Re
sis
tan
ce
(Ω
)
Thickness (㎛)
Flat membranes
Base(TB) 250㎛
Pattern 190㎛Total(TP) 440㎛
Base(TB) 250㎛
Pattern 589㎛Total(TP) 839㎛
Base(TB) 250㎛
Pattern 501㎛Total(TP) 751㎛Base(TB) 250㎛
Pattern 329㎛Total(TP) 579㎛
Figure 4.10. Measured resistance of patterned and flat membranes.
Figure 10 shows that the patterned membranes have lower ionic resistances than those of
flat membranes at a given thickness even though the same chemical formulation was used
throughout this study for all samples. To explain this phenomenon, we propose a parallel
resistance model by comparing the resistance of a patterned membrane with that of a flat
membrane with equivalent effective thickness (volume/area). Figure 11(b) shows the conceptual

63
parallel resistance model for a patterned membrane. In this model, the membrane’s total
resistance can be regarded as a parallel combination of the resistance of the base sections and
resistance of the raised portions as shown in Figure 11(a). AP,Small and AB,Small are areas of a
pattern and a base, and TP and TB are thicknesses of the pattern and the base, respectively. The
number of the patterns and bases are assigned as NP and NB.
Figure 4.11. (a) Schematic cross-section of a patterned membrane showing base and raised
sections; and (b) the parallel resistance model corresponding to areas of low (bases) and high
(patterns) resistance.
The total resistance of the parallel combination of bases and raised sections can be
calculated as:
1
Rm= (
1
RP+
1
RP+ ⋯ +
1
RP) + (
1
RB+
1
RB+ ⋯ +
1
RB) =
NP
RP+
NB
RB (Eq. 4.4)
where Rm, RP, and RB are the total resistance of the patterned membrane, resistance of a
pattern and resistance of a base, respectively. The resistance can be defined in terms of resistivity
ρ, thickness T, and area A:

64
R =ρ × T
A (Eq. 4.5)
Therefore, the total resistance of the patterned membrane can be also expressed in terms
of resistivity, thickness, and area by combining Equation 5 with Equation 4:
1
Rm=
NP × AP,small
ρ × TP+
NB × AB,small
ρ × TB=
AP
ρ × TP+
AB
ρ × TB=
APTB + ABTP
ρTPTB (Eq. 4.6)
Rm = ρTPTB
APTB + ABTP (Eq. 4.7)
where AP and AB is the total area of patterns and that of bases, respectively. From Figure 11(a),
the total area of the patterned membrane Am can be defined as the sum of AP and AB. Also, the
total volume of the patterned membrane Vm can be expressed as a function of each area and
thickness:
Am = AP + AB (Eq. 4.8)
Vm = APTP + ABTB (Eq. 4.9)
By comparing the resistance of the patterned membrane to a flat membrane Rf which has
a same volume as the patterned one, the decrease in resistance can be estimated in terms of
measured thicknesses and areas:
Rf =ρ × Vm/Am
Am=
ρ × (APTP + ABTB)
(AP + AB)2 (Eq. 4.10)
Rm
Rf=
ρTPTB
APTB+ABTP
ρ×(APTP+ABTB)
(AP+AB)2
= TPTB(AP + AB)2
(APTB + ABTP) × (APTP + ABTB) (Eq. 4.11)
For convenience, Equation 11 can be expressed as a function of ratios of the thicknesses
and the areas:
Rm
Rf(TP
B
, AP
B
) =
TP
TB× (
AP
AB+ 1)
2
(AP
AB+
TP
TB) × (
AP
AB
TP
TB+ 1)
=
TP
B
× (AP
B
+ 1)2
(AP
B
+ TP
B
) × (AP
B
TP
B
+ 1) (Eq. 4.12)

65
Therefore, as the ratio of thicknesses and areas increases, the patterned membrane’s
resistance decreases compared to a flat membrane at the same material volume as shown in
Figure 4.12.
1 2 3 4 50.3
0.4
0.5
0.6
0.7
0.8
0.9
1.0
Re
sis
tan
ce
(R
Pa
tte
rne
d/R
fla
t)
Thickness ratio (Pattern/Base)
Area ratio
(Pattern:Base)
1:9
3:7
5:5
7:3
9:1
Figure 4.12. Calculated resistance of patterned membranes compared to that of flat membranes as
functions of thickness and area ratios.
As shown in Figure 4.13, the measured resistance of flat membranes shows a linear
correlation with the sample thickness following equation 4.5 while the measured resistance of
patterned membranes corresponds well to the estimated resistance based on the parallel resistance
model. From this proposed model, the decrease in resistance of a patterned membrane can be
estimated if the ratios of areas and thicknesses are known. This model may suggest a method to
maximize the efficiency of ion exchange membranes using the same amount of materials.

66
250 300 350 400 450 500 550
0.8
1.2
1.6
2.0
Re
sis
tan
ce
(Ω
)
Thickness (㎛)
Patterned membranes
Flat membranes
Figure 4.13. Measured resistance of flat and patterned membranes; the hollow dots indicate the
estimated patterned membrane’s resistance based on the parallel resistance model.

67
4.4. References
[1] Li, H., & Zou, L. (2011). Ion-exchange membrane capacitive deionization: a new strategy for
brackish water desalination. Desalination, 275(1), 62-66.
[2] Rozendal, R. A., Sleutels, T. H. J. A., Hamelers, H. V. M., & Buisman, C. J. N. (2008). Effect
of the type of ion exchange membrane on performance, ion transport, and pH in biocatalyzed
electrolysis of wastewater. Water Science and Technology, 57(11), 1757-1762.
[3] Anand, V., Kandarapu, R., & Garg, S. (2001). Ion-exchange resins: carrying drug delivery
forward. Drug Discovery Today, 6(17), 905-914.
[4] Wee, J. H. (2007). Applications of proton exchange membrane fuel cell systems. Renewable
and Sustainable Energy Reviews, 11(8), 1720-1738.
[5] Strathmann, H. (2004). Ion-exchange membrane separation processes (Vol. 9). Elsevier.
[6] Xu, T. (2005). Ion exchange membranes: state of their development and perspective. Journal
of Membrane Science, 263(1), 1-29.
[7] Kariduraganavar, M. Y., Nagarale, R. K., Kittur, A. A., & Kulkarni, S. S. (2006). Ion-
exchange membranes: preparative methods for electrodialysis and fuel cell applications.
Desalination, 197(1), 225-246.
[8] Zhou, Z., Dominey, R. N., Rolland, J. P., Maynor, B. W., Pandya, A. A., & DeSimone, J. M.
(2006). Molded, high surface area polymer electrolyte membranes from cured liquid precursors.
Journal of the American Chemical Society, 128(39), 12963-12972.
[9] Liu, J., Geise, G. M., Luo, X., Hou, H., Zhang, F., Feng, Y., ... & Logan, B. E. (2014).
Patterned ion exchange membranes for improved power production in microbial reverse-
electrodialysis cells. Journal of Power Sources, 271, 437-443.
[10] Lee, Y. K., Won, Y. J., Yoo, J. H., Ahn, K. H., & Lee, C. H. (2013). Flow analysis and
fouling on the patterned membrane surface. Journal of Membrane Science, 427, 320-325.
[11] O’Hayre, R., Lee, S. J., Cha, S. W., & Prinz, F. B. (2002). A sharp peak in the performance
of sputtered platinum fuel cells at ultra-low platinum loading. Journal of Power Sources, 109(2),
483-493.
[12] Choi, W. C., Kim, J. D., & Woo, S. I. (2001). Modification of proton conducting membrane
for reducing methanol crossover in a direct-methanol fuel cell. Journal of Power Sources, 96(2),
411-414.
[13] Kim, J. H., Sohn, J., Cho, J. H., Choi, M. Y., Koo, I. G., & Lee, W. M. (2008). Surface
modification of Nafion membranes using atmospheric‐pressure low‐temperature plasmas for
electrochemical applications. Plasma Processes and Polymers, 5(4), 377-385.
[14] Sheldeshov, N. V., Zabolotskii, V. I., & Loza, S. A. (2014). Electric conductivity of profiled
ion-exchange membranes. Petroleum Chemistry, 54(8), 664-668.
[15] Kim, H. T., Reshentenko, T. V., & Kweon, H. J. (2007). Microstructured membrane
electrode assembly for direct methanol fuel cell. Journal of The Electrochemical Society, 154(10),
B1034-B1040.
[16] Omosebi, A., & Besser, R. S. (2013). Electron beam patterned Nafion membranes for DMFC
applications. Journal of Power Sources, 228, 151-158.

68
[17] Muskin, J., Ragusa, M., & Gelsthorpe, T. (2010). Three-dimensional printing using a
photoinitiated polymer. Journal of Chemical Education, 87(5), 512-514.
[18] Geise, G. M., Hickner, M. A., & Logan, B. E. (2013). Ionic resistance and permselectivity
tradeoffs in anion exchange membranes. ACS applied materials & interfaces, 5(20), 10294-10301.
[19] Guler, E., Zhang, Y., Saakes, M., & Nijmeijer, K. (2012). Tailor‐made anion‐exchange
membranes for salinity gradient power generation using reverse electrodialysis. ChemSusChem,
5(11), 2262-2270.
[20] CRC Handbook of chemistry and physics, Hodgman, C. D., & Veazey, W. R. (1977). CRC
Handbook of chemistry and physics. Chemical Rubber Publishing Company.
[21] Schultz, A. R., Lambert, P. M., Chartrain, N. A., Ruohoniemi, D. M., Zhang, Z., Jangu, C., ...
& Long, T. E. (2014). 3D printing phosphonium ionic liquid networks with mask projection
microstereolithography. ACS Macro Letters, 3(11), 1205-1209.
[22] Ezzeldin, H. A., Apblett, A., & Foutch, G. L. (2010). Synthesis and properties of anion
exchangers derived from chloromethyl styrene codivinylbenzene and their use in water treatment.
International Journal of Polymer Science, 2010.
[23] Xu, H., & Hu, X. (1999). Preparation of anion exchangers by reductive amination of
acetylated crosslinked polystyrene. Reactive and Functional Polymers, 42(3), 235-242.
[24] Padmavathi, N. C., & Chatterji, P. R. (1996). Structural characteristics and swelling behavior
of poly (ethylene glycol) diacrylate hydrogels. Macromolecules, 29(6), 1976-1979.
[25] Strathmann, H., Grabowski, A., & Eigenberger, G. (2013). Ion-exchange membranes in the
chemical process industry. Industrial & Engineering Chemistry Research, 52(31), 10364-10379.
[26] Chakrabarty, T., Prakash, S., & Shahi, V. K. (2013). End group cross-linked 2-
(dimethylamino) ethylmethacrylate based anion exchange membrane for electrodialysis. Journal
of Membrane Science, 428, 86-94.
[27] Długołęcki, P., Nymeijer, K., Metz, S., & Wessling, M. (2008). Current status of ion
exchange membranes for power generation from salinity gradients. Journal of Membrane Science,
319(1), 214-222.
[28] Güler, E., Elizen, R., Saakes, M., & Nijmeijer, K. (2014). Micro-structured membranes for
electricity generation by reverse electrodialysis. Journal of membrane science, 458, 136-148.

69
Chapter 5 Conclusions and Future Work
5.1. Electrolyte Resistant Epoxy for Bonding Battery-Based Sandwich Structures
5.1.1. Conclusions
In this study a number of general polymer samples, commercial adhesives, and sealants
were investigated in order to find a suitable bonding agent for a Li-ion sandwich battery structure.
First, conventional gravimetric swelling tests with Hansen solubility parameters were conducted
to predict the durability of the polymers under electrolyte conditions. We found that HSP of the
polymers correlated relatively well to the material’s uptake in DMC single solvent and in
EC/DMC mixtures. Second, single lap shear tests were conducted with specimens bonded with E-
120HP epoxy adhesive after exposure to an EC/DMC mixture with and without LiPF6 salt. The
lap joint shear strength decreased, but the strength was large enough for the desired application in
structural batteries (>5 MPa). From sol extraction tests and DSC analyses, the optimized curing
temperature of E-120HP adhesive was revealed to be from 80°C to 100°C. In this range, the
cured epoxy adhesive had a high crosslink density and high conversion without potential adverse
effects on the battery core material performance. From three-point bending tests with
manufactured sandwich battery structures, the bonded panels containing electrolyte did not show
any visible damage or electrolyte leakage up to 1000 N loading in both filled and unfilled panels.
5.1.2. Future Work

70
A variety of polymer materials were investigated using conventional gravimetric swelling
tests and Hansen solubility parameter analysis in order to investigate the chemical resistance in
Li-ion battery electrolyte, but only commercial adhesives were used to bond the battery structure
without further modification due to the need for large-scale panel manufacture. From this study, it
was revealed that polyolefin and nylon structures are good candidates to be used for the
electrolyte resistance adhesive. Therefore, new types of structural adhesive can be designed using
these structures and the epoxy groups in the near future to have less swelling ratios than
commercial adhesives used in this study.
5.2. 3D Printing of Micro-patterned Anion Exchange Membranes
5.2.1. Conclusions
Micro-patterned, 3D-printed anion exchange membranes have been formulated using
diurethane dimethacrylate, poly(ethylene glycol) diacrylate, dipentaerythritol penta-/hexa-
acrylate, and 4-vinylbenzyl chloride. The membrane was cured directly into patterned membranes
via photoinitiated free radical polymerization using mask lithography and quaternization. The
quaternized poly(DU-co-EG-co-VBC) membranes were characterized for their water uptake,
permselectivity, and ionic resistance. The water uptake of the samples increased with ion
exchange capacity (IEC) and the PEG content. The permselectivity was inversely proportional to
the water uptake of the sample due to a decrease in the charged group concentration by
membrane’s volume expansion. Also, the permselectivity increased as calculated IEC increased.
This result was consistent with the general view of permselectivity. The patterning effects on the
anion exchange membrane surface were investigated in terms of the samples’ ionic resistance.
Generally, patterning of the membrane surface increases the membrane resistance because the
pattern contributes to increases the membrane thickness. In this work, it was revealed that the

71
patterned membranes had lower resistance than that of flat membranes when the sample had
equivalent effective thicknesses (volume/area) normalized for the material volume. To explain
this phenomenon, a parallel resistance model was suggested. The measured resistance of flat
membranes followed Ohm’s law resulting in a linear relationship between the membrane
resistance and membrane thickness. However, patterned membranes showed lower resistances
and corresponded well to the suggested parallel resistance model in the normalized thickness
(volume/area). This model may offer some guide to maximize the membrane’s performance by
patterning on the surface of the membrane without chemical modifications.
5.2.2. Future Work
In this study the reduction of ionic resistance was explained using parallel resistance
model even though the model does not contain a term accounting for effects by patterned surface
enlargement. However, it is reasonable to hypothesize that the patterns increase the conductivity
of ions because the diffusion flux is a function of the boundary area. Lack of scaling with area in
this work may be due to the fact that the extent of the surface enlargement in this study was not
large enough to influence the ionic resistance. The minimum size of the individual patterns on the
patterned membrane was 1mm × 1mm dimensions because of the technical limitation of the
projector used to create the patterns. So, the calculated extension of the surface was about 70% in
the case of 1:2 pattern ratios. However, if the pattern’s size becomes smaller than this study, the
parallel model needs to be modified by adding the term of a surface area. Higher fidelity
modeling, testing the limits of the model and exploring new photo-polymerized membrane
compositions are all areas for future work.