Embed Size (px)
Citation preview

S1
Polymeric Micelles for Hydrogen Sulfide Delivery
Urara Hasegawa and André J. van der Vlies
Supporting information
Page S1 Table of contents Supporting Information
Page S2 Scheme S1. Synthesis of the PEG-PADT block copolymer.
Scheme S2. Structure of the H2S-detection dye, WSP-1.
Page S3 Scheme S3. Synthesis of the coumarin-PEG-PADT block copolymer.
Table S1. Mn and Mw/Mn values for the polymers.
Page S4 Figure S1. GPC elution profiles of the PEG-PADT block copolymer.
Figure S2. SEC-LALS elution profile of ADT micelles
Page S5 Figure S3. GPC elution profiles of the coumarin-PEG-PADT block
copolymer.
Figure S4. GPC elution profiles of the PEG-PADT block copolymer before
and after coumarin labeling.
Page S6 Figure S5. TEM and DLS data of coumarin- ADT micelles.
Figure S6. H2S release from Na2S in the presence of RAW Blue murine
macrophages.
Page S7 CMC of the ADT micelles.
Page S8 Instrumentation.
Page S9 Materials used for chemistry and biology.
Pages S10-13 Materials synthesis.
Pages S14-15 Biology experiments.
Page S16 References.
Electronic Supplementary Material (ESI) for Medicinal Chemistry Communications.This journal is © The Royal Society of Chemistry 2014

S2
Scheme S1. Synthetic scheme for the PEG-PADT block copolymer (a) AIBN, dioxane 70°C
(b) Ethylpiperidine hypophosphite, AIBN, dioxane, 95°C (c) TFA/H2O 9:1 (d) NHS, DCC,
DMAP, DMF (e) Et3N, DMF.
Scheme S2. Structure of the H2S-detection dye, WSP-1, used for measuring the released
H2S in RAW Blue murine macrophages.

S3
Scheme S3. Synthetic scheme for the coumarin-labeled PEG-PADT block copolymer. (a)
AIBN, dioxane 70°C. (b) Ethylpiperidine hypophosphite, AIBN, dioxane, 95°C. (c) TFA/H2O
9:1. (d) NHS, DCC, DMAP, DMF. (e) Et3N, DMF.
Table S1. Mn and Mw/Mn as determined by GPC using a PEG standard.
Polymer Mn Mw/Mn
PEG-Gly(OtBu)25-H 11948 1.05
HO-PEG-Gly(OtBu)25-H 12992 1.03
S4
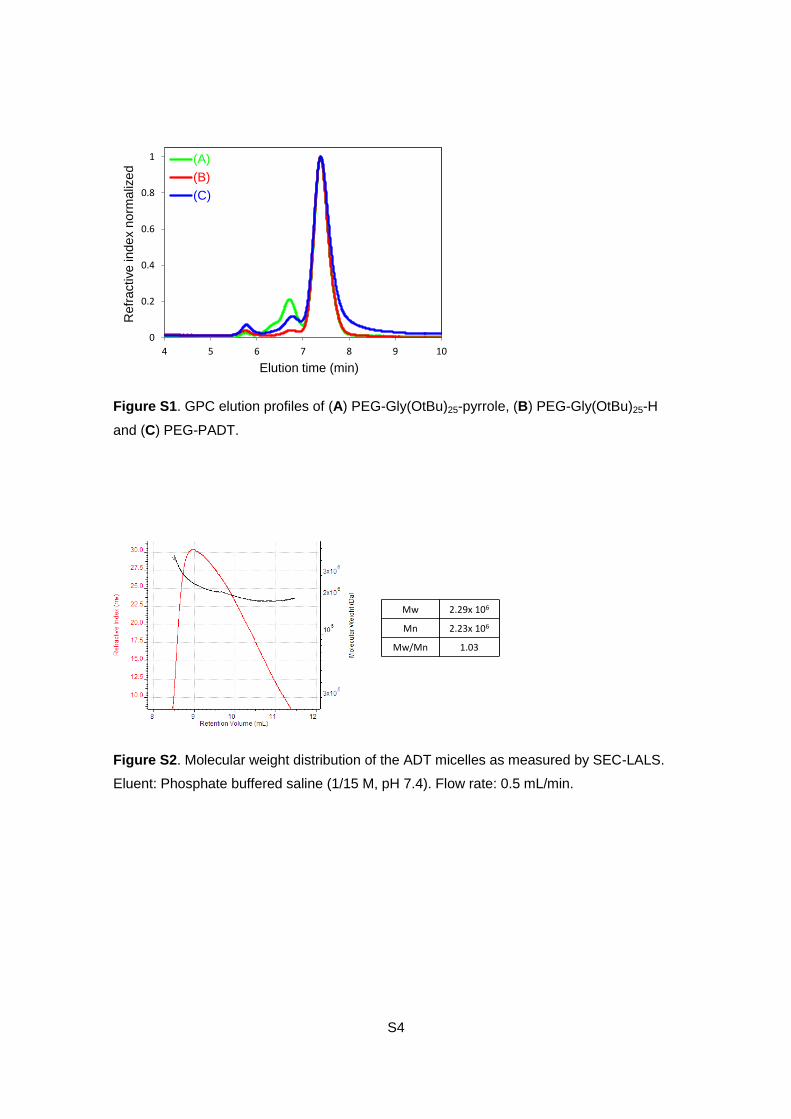
Figure S1. GPC elution profiles of (A) PEG-Gly(OtBu)25-pyrrole, (B) PEG-Gly(OtBu)25-H
and (C) PEG-PADT.
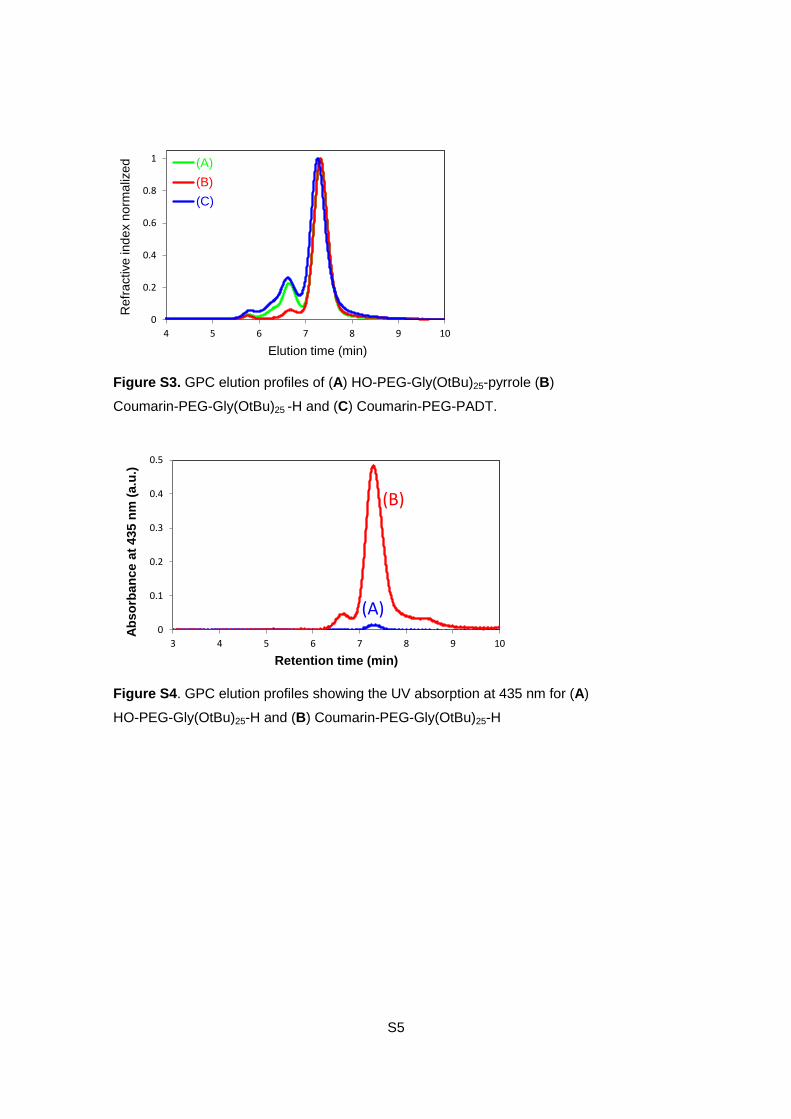
Figure S2. Molecular weight distribution of the ADT micelles as measured by SEC-LALS.
Eluent: Phosphate buffered saline (1/15 M, pH 7.4). Flow rate: 0.5 mL/min.
0
0.2
0.4
0.6
0.8
1
4 5 6 7 8 9 10
(A)
(B)
(C)
Elution time (min)
Re
fra
ctive
in
de
x n
orm
aliz
ed
Mw 2.29x 10⁶
Mn 2.23x 10⁶
Mw/Mn 1.03
S5
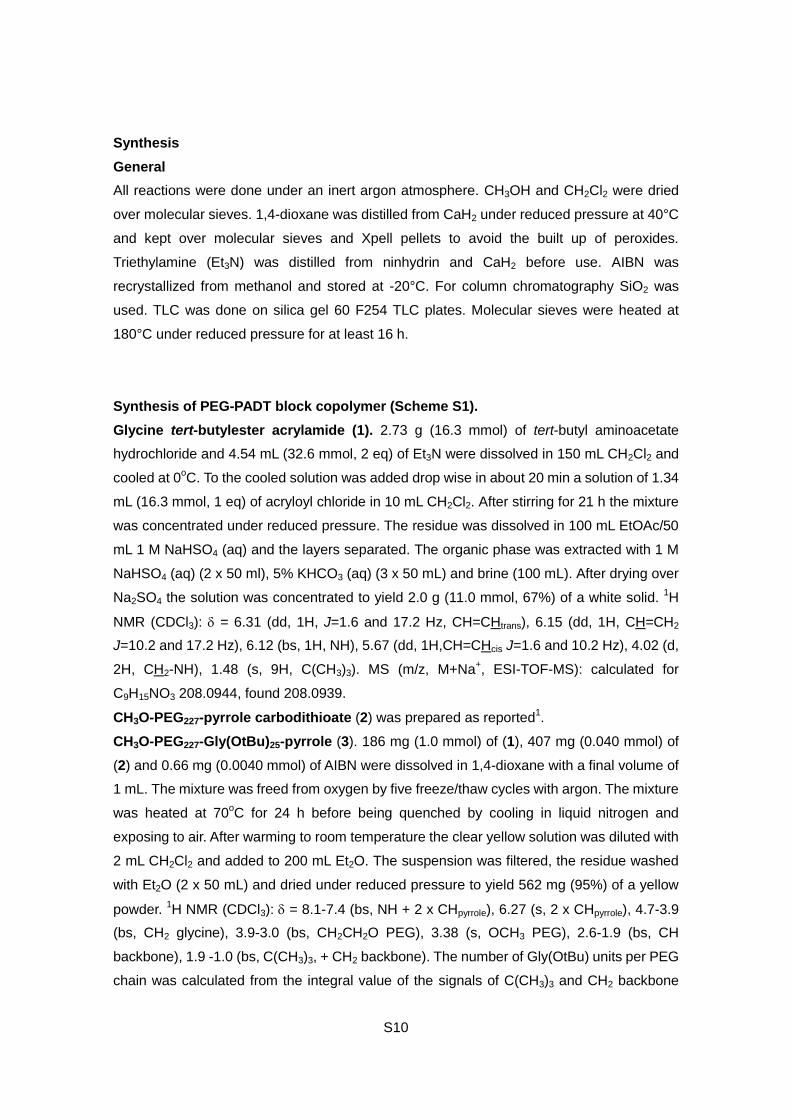
Figure S3. GPC elution profiles of (A) HO-PEG-Gly(OtBu)25-pyrrole (B)
Coumarin-PEG-Gly(OtBu)25 -H and (C) Coumarin-PEG-PADT.
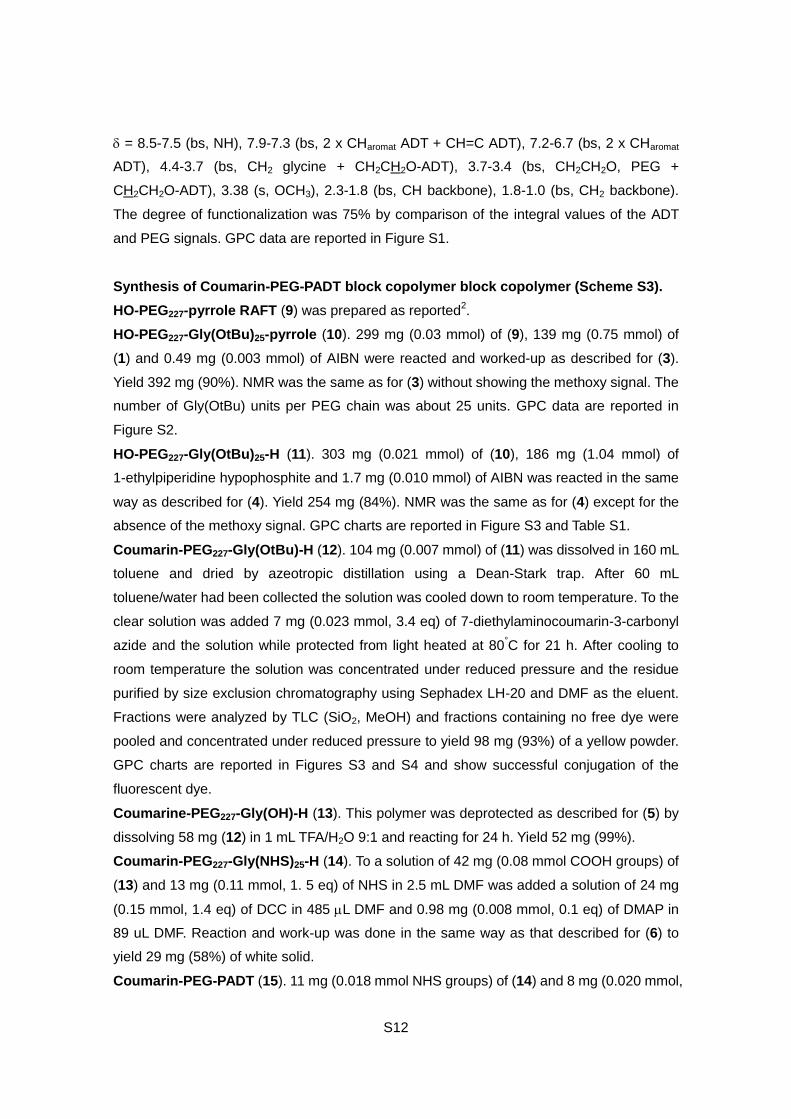
Figure S4. GPC elution profiles showing the UV absorption at 435 nm for (A)
HO-PEG-Gly(OtBu)25-H and (B) Coumarin-PEG-Gly(OtBu)25-H
0
0.2
0.4
0.6
0.8
1
4 5 6 7 8 9 10
(A)
(B)
(C)
Elution time (min)
Refr
active
ind
ex n
orm
aliz
ed
0
0.1
0.2
0.3
0.4
0.5
3 4 5 6 7 8 9 10
Ab
so
rba
nc
e a
t 4
35
nm
(a
.u.)
Retention time (min)
(B)
(A)

S6
Figure S5. Characterization of coumarin-labeled ADT micelles by (a) transmission electron
microscopy (negative staining with 3wt% Preyssler-type phosphotungstaste solution), (b)
dynamic light scattering.
Figure S6. H2S release from Na2S in the presence of RAW Blue macrophages. The H2S
concentration in the culture medium was determined using a fluorescent dye WSP-1.
Concentration of Na2S: 100 μM.
100 nm
1 10 100 1000
Inte
ns
ity
Diameter [nm]
(a) (b)
-10
10
30
50
70
90
110
0 1 2 3 4
Ch
an
ge i
n H
2S
co
ncen
trati
on
[μ
M]
Time [h]

S7
Figure S7. Critical micelle concentration (CMC) of the ADT micelles as determined by
surface tension method.
92
94
96
98
100
102
104
106
108
0.000001 0.0001 0.01 1 100
Co
nta
ct
an
gle
[o]
polymer concentration [M]
CMC = 91 pM

S8
Instrumententation
1H NMR. Spectra were acquired on a Bruker DPX400 NMR spectrometer at room
temperature with the residual undeuterated solvent signal as reference (2.50 d6-DMSO and
7.26 CDCl3).
High resolution mass spectometory. ESI-TOF MS analyses were performed on a Bruker
microTOFII mass spectrometer.
Gel permeation chromatography (GPC). Elution profiles of the polymers (10 mg/mL) were
collected on a Shodex KD-803 column at 50°C equipped with a Tosoh differential
refractometer and photodiode array detector. Dimethylformamide (DMF) containing 100 mM
LiCl (flow rate of 1.0 mL/min) was used as the eluent. The polydispersity index (PDI) of the
polymers was calculated based on the elution time of polyethylene glycol standard
polymers.
Dynamic light scattering (DLS). Hydrodynamic diameter of the micelles was obtained on
an Otsuka ELSZ machine. The mean diameter (Z-average) and polydispersity index
(PDI=μ2/Γ2) were calculated by the cumulant method.
Transmission electron microscopy (TEM). Carbon coated 250 mesh copper grids were
prepared under glow discharge. The micelle solution was placed onto the grid and then
dried by blotting the side of the grid with a filter paper. The grids were negatively stained with
3wt% Preyssler-type phosphotungstate solution. Images were acquired on a HITACHI
H-7650 TEM.
Size exclusion chromatography-low angle light scattering (SEC-LALS). The ADT
micelles were dispersed in phosphate buffered saline (1/15 M, pH 7.4) at 2.17 mg/mL and
filtered through a cellulose acetate syringe filter (pore size: 0.2 μm). The sample (100 μL)
was analyzed on a Tosoh chromatography system connected to a Malvern Viscotek 305
TDA. A Superose 6 10/300 GL (GE Healthcare Life Sciences) was used as a SEC column.
Phosphate buffered saline (1/15 M, pH 7.4) was used as an eluent at a flow rate of 0.5
mL/min. The average molecular weight (Mw and Mn) and polydispersity index (Mw/Mn) were
determined using OmniSEC software.
H2S electrode sensor. H2S was measured on a four-channel free radical analyzer
equipped with an ISO-H2S-2 hydrogen sulfide sensor (diameter: 2 mm) and a temperature
sensor. The sensors were placed in a four-port closed chamber at 37°C.
Confocal laser scanning fluorescence microscope (CLSFM). Fluorescent images were
acquired on an Olympus FluoView FV1000-D confocal microscope equipped with 405, 473,
559 and 635 nm lasers.
UV/VIS and fluorescence spectrometry. Spectra were obtained on a Tecan infinite M200
well plate reader using transparent or black polystyrene well plates.

S9
CMC measurement The micelle solution in milliQ water at different concentrations (2 μL)
was dropped onto Parafilm and the contact angle was measured on a Kyowa Interface
Science Drop Master DM 300 to determine the critical micelle concentration.
Materials
Chemistry
CF3COOH (TFA), 1-ethylpiperidine hypophosphite (EPHP), N-hydroxysuccinimide (NHS),
polyethylene glycol (PEG) standard polymers (20,000, 12,000, 6,000, 4,000 and 2,000 Da),
CH3O-PEG114-OH (Mn = 5,000) and sodium sulfide nonahydrate (Na2S9H2O) were
purchased from Sigma-Aldrich. Sodium hydrogensulfate (NaHSO4), anhydrous sodium
sulfate (Na2SO4), potassium hydrogen carbonate (KHCO3), anhydrous potassium carbonate
(K2CO3), N,N′-dicyclohexylcarbodiimide (DCC), anhydrous dimethylformamide (DMF),
anhydrous dimethylsulfoxide (DMSO), diethylether (Et2O), acryloyl choride,
2,2’-azobis(2-methylpropionitrile) (AIBN) and phosphate buffer powder (1/15 mol/L, pH 7.4)
were purchased from Wako Pure Chemical Industry. 4-(Dimethylamino)pyridine (DMAP),
tert-butyl aminoacetate hydrochloride were purchased from Tokyo Chemical Industry.
Sunbright HO-PEG227-CH2CH2CH2-NH2, (Mp =11076) HO-PEG114-CH2CH2CH2-NH2, (Mp
=4704) and CH3O-PEG227-CH2CH2-NH2 (Mp =9988) were purchased from NOF Corporation.
Ethyl acetate (EtOAc), hexane, methanol (MeOH), toluene, dichloromethane (CH2Cl2),
1,4-dioxane and molecular sieves 3A were purchased from Nacalai Tesque.
7-Diethylaminocoumarin-3-carbonyl azide was from Invitrogen. Deuterated solvents for
NMR (CDCl3, d6-DMSO) were purchased from Cambridge Isotope Laboratories.
Biology
Thiazolyl Blue tetrazolium bromide (MTT) was purchased from Tokyo Chemical Industry.
LPS-free water was purchased from Otsuka Pharmaceutical Factory. DMEM GlutaMax, fetal
bovine serum (FBS) and penicillin-streptomycin were purchased from Invitrogen. Passive
Lysis Buffer was purchased from Promega. WSP-1 was purchased from Cayman Chemical.
RAW Blue cells, QUANTI-Blue and Zeocin were purchased from Invivogen. Mouse TNF-α
DuoSet Economy Pack was purchased from R&D Systems. Slide-A-Lyzer G2 (MWCO 2
kDa) was purchased from Thermo Scientific. Triple-wells glass-based dishes and 96-well
microplates were purchased from Iwaki. Water was freed from salt using MilliQ water
system.
S10
Synthesis
General
All reactions were done under an inert argon atmosphere. CH3OH and CH2Cl2 were dried
over molecular sieves. 1,4-dioxane was distilled from CaH2 under reduced pressure at 40°C
and kept over molecular sieves and Xpell pellets to avoid the built up of peroxides.
Triethylamine (Et3N) was distilled from ninhydrin and CaH2 before use. AIBN was
recrystallized from methanol and stored at -20°C. For column chromatography SiO2 was
used. TLC was done on silica gel 60 F254 TLC plates. Molecular sieves were heated at
180°C under reduced pressure for at least 16 h.
Synthesis of PEG-PADT block copolymer (Scheme S1).
Glycine tert-butylester acrylamide (1). 2.73 g (16.3 mmol) of tert-butyl aminoacetate
hydrochloride and 4.54 mL (32.6 mmol, 2 eq) of Et3N were dissolved in 150 mL CH2Cl2 and
cooled at 0oC. To the cooled solution was added drop wise in about 20 min a solution of 1.34
mL (16.3 mmol, 1 eq) of acryloyl chloride in 10 mL CH2Cl2. After stirring for 21 h the mixture
was concentrated under reduced pressure. The residue was dissolved in 100 mL EtOAc/50
mL 1 M NaHSO4 (aq) and the layers separated. The organic phase was extracted with 1 M
NaHSO4 (aq) (2 x 50 ml), 5% KHCO3 (aq) (3 x 50 mL) and brine (100 mL). After drying over
Na2SO4 the solution was concentrated to yield 2.0 g (11.0 mmol, 67%) of a white solid. 1H
NMR (CDCl3): = 6.31 (dd, 1H, J=1.6 and 17.2 Hz, CH=CHtrans), 6.15 (dd, 1H, CH=CH2
J=10.2 and 17.2 Hz), 6.12 (bs, 1H, NH), 5.67 (dd, 1H,CH=CHcis J=1.6 and 10.2 Hz), 4.02 (d,
2H, CH2-NH), 1.48 (s, 9H, C(CH3)3). MS (m/z, M+Na+, ESI-TOF-MS): calculated for
C9H15NO3 208.0944, found 208.0939.
CH3O-PEG227-pyrrole carbodithioate (2) was prepared as reported1.
CH3O-PEG227-Gly(OtBu)25-pyrrole (3). 186 mg (1.0 mmol) of (1), 407 mg (0.040 mmol) of
(2) and 0.66 mg (0.0040 mmol) of AIBN were dissolved in 1,4-dioxane with a final volume of
1 mL. The mixture was freed from oxygen by five freeze/thaw cycles with argon. The mixture
was heated at 70oC for 24 h before being quenched by cooling in liquid nitrogen and
exposing to air. After warming to room temperature the clear yellow solution was diluted with
2 mL CH2Cl2 and added to 200 mL Et2O. The suspension was filtered, the residue washed
with Et2O (2 x 50 mL) and dried under reduced pressure to yield 562 mg (95%) of a yellow
powder. 1H NMR (CDCl3): = 8.1-7.4 (bs, NH + 2 x CHpyrrole), 6.27 (s, 2 x CHpyrrole), 4.7-3.9
(bs, CH2 glycine), 3.9-3.0 (bs, CH2CH2O PEG), 3.38 (s, OCH3 PEG), 2.6-1.9 (bs, CH
backbone), 1.9 -1.0 (bs, C(CH3)3, + CH2 backbone). The number of Gly(OtBu) units per PEG
chain was calculated from the integral value of the signals of C(CH3)3 and CH2 backbone

S11
and the CH2CH2O protons and was about 25 units. GPC data for this polymer are reported
in Figure S1.
CH3O-PEG227-Gly(OtBu)25-H (4). 306 mg (0.021 mmol) of (3), 188 mg (1.05 mmol, 50 eq) of
1-ethylpiperidine hypophosphite and 1.7 mg (0.010 mmol, 0.05 eq) of AIBN were dissolved
in 850 L dioxane and freed from oxygen by five freeze/thaw cycles with argon. The mixture
was heated at 95oC during which the yellow solution became colorless
2. After freezing in
liquid nitrogen and exposing to air the solution was diluted with 50 mL CH2Cl2 and washed
with water (2 x 50 mL). The CH2Cl2 solution was dried over Na2SO4, concentrated to a small
volume and added to 200 mL Et2O. The suspension was filtered, the residue washed with
Et2O (2 x 50 mL) and dried under reduced pressure to yield 299 mg (100%) of a white
powder. 1H NMR (CDCl3): = 8.1-7.4 (bs, NH), 4.7-3.9 (bs, CH2C=O glycine), 3.9-3.0 (bs,
CH2CH2O PEG), 3.38 (s, OCH3 PEG), 2.6-1.9 (bs, CH backbone), 1.9-1.0 (bs, C(CH3)3 +
CH2 backbone). Signals due to pyrrole group had disappeared. GPC data are reported in
Figure S1 and Table S1.
CH3O-PEG227-Gly(OH)25-H (5). 161 mg (0.011 mmol) of (4) was dissolved in 2 mL TFA/H2O
9:1 and stirred for 21 h and concentrated in a flow of N2 and dried under high vacuum. The
foamy solid was dissolved in 8 mL milliQ water and lyophilized to yield 146 mg (100%) of a
powder.
CH3O-PEG227-Gly(NHS)25-H (6). 75 mg (0.14 mmol COOH groups) of (5) and 23 mg (0.20
mmol, 1.4 eq) of NHS were dissolved in 3 mL DMF. To the solution was added 1.7 mg (0.014
mmol, 0.1 eq) of DMAP in 159 L DMF and 35 mg (0.17 mmol, 1.2 eq) of DCC in 686 L
DMF. The solution was stirred for 21 h during which a white precipitate formed. The mixture
was filtered over a plug of glass wool and added to 200 mL Et2O. The white solid that
precipitated was filtered off and dried under reduced pressure to yield 90 mg (100%). 1H
NMR (d6-DMSO): = 8.5-8.0 (bs, NH), 4.5-3.8 (bs, CH2 glycine), 3.7-3.4 (bs, CH2CH2O,
PEG), 3.38 (s, OCH3), 2.9-2.7 (bs, 2 x CH2 NHS), 2.3-1.8 (bs, CH backbone), 1.8-1.0 (bs,
CH2 backbone).
(5-(4-(2-aminoethoxy)phenyl)-3H-1,2-dithiole-3-thione) TFA salt (7) was prepared as
reported2.
PEG-PADT (8). 25 mg (0.039 mmol NHS groups) of (6) was dissolved in 2 mL DMF and to
the clear solution was added 15.7 mg (0.041 mmol, 1.1 eq) of (7) in 500 L DMF and 5.7 L
(0.041 mmol, 1.1 eq) triethylamine in 100 L DMF. After 23 h the mixture was loaded onto a
Sephadex LH20 size exclusion and eluted with DMF. Fractions were analyzed by TLC (SiO2,
MeOH) and those fractions containing polymer (Rf=0) were combined. After concentrating to
about 3 mL the polymer was precipitated by adding 50 mL Et2O. The solid was filtered and
dried under reduced pressure to yield 23 mg (74%) of an orange solid. 1H NMR (d6-DMSO):
S12
= 8.5-7.5 (bs, NH), 7.9-7.3 (bs, 2 x CHaromat ADT + CH=C ADT), 7.2-6.7 (bs, 2 x CHaromat
ADT), 4.4-3.7 (bs, CH2 glycine + CH2CH2O-ADT), 3.7-3.4 (bs, CH2CH2O, PEG +
CH2CH2O-ADT), 3.38 (s, OCH3), 2.3-1.8 (bs, CH backbone), 1.8-1.0 (bs, CH2 backbone).
The degree of functionalization was 75% by comparison of the integral values of the ADT
and PEG signals. GPC data are reported in Figure S1.
Synthesis of Coumarin-PEG-PADT block copolymer block copolymer (Scheme S3).
HO-PEG227-pyrrole RAFT (9) was prepared as reported2.
HO-PEG227-Gly(OtBu)25-pyrrole (10). 299 mg (0.03 mmol) of (9), 139 mg (0.75 mmol) of
(1) and 0.49 mg (0.003 mmol) of AIBN were reacted and worked-up as described for (3).
Yield 392 mg (90%). NMR was the same as for (3) without showing the methoxy signal. The
number of Gly(OtBu) units per PEG chain was about 25 units. GPC data are reported in
Figure S2.
HO-PEG227-Gly(OtBu)25-H (11). 303 mg (0.021 mmol) of (10), 186 mg (1.04 mmol) of
1-ethylpiperidine hypophosphite and 1.7 mg (0.010 mmol) of AIBN was reacted in the same
way as described for (4). Yield 254 mg (84%). NMR was the same as for (4) except for the
absence of the methoxy signal. GPC charts are reported in Figure S3 and Table S1.
Coumarin-PEG227-Gly(OtBu)-H (12). 104 mg (0.007 mmol) of (11) was dissolved in 160 mL
toluene and dried by azeotropic distillation using a Dean-Stark trap. After 60 mL
toluene/water had been collected the solution was cooled down to room temperature. To the
clear solution was added 7 mg (0.023 mmol, 3.4 eq) of 7-diethylaminocoumarin-3-carbonyl
azide and the solution while protected from light heated at 80°C for 21 h. After cooling to
room temperature the solution was concentrated under reduced pressure and the residue
purified by size exclusion chromatography using Sephadex LH-20 and DMF as the eluent.
Fractions were analyzed by TLC (SiO2, MeOH) and fractions containing no free dye were
pooled and concentrated under reduced pressure to yield 98 mg (93%) of a yellow powder.
GPC charts are reported in Figures S3 and S4 and show successful conjugation of the
fluorescent dye.
Coumarine-PEG227-Gly(OH)-H (13). This polymer was deprotected as described for (5) by
dissolving 58 mg (12) in 1 mL TFA/H2O 9:1 and reacting for 24 h. Yield 52 mg (99%).
Coumarin-PEG227-Gly(NHS)25-H (14). To a solution of 42 mg (0.08 mmol COOH groups) of
(13) and 13 mg (0.11 mmol, 1. 5 eq) of NHS in 2.5 mL DMF was added a solution of 24 mg
(0.15 mmol, 1.4 eq) of DCC in 485 L DMF and 0.98 mg (0.008 mmol, 0.1 eq) of DMAP in
89 uL DMF. Reaction and work-up was done in the same way as that described for (6) to
yield 29 mg (58%) of white solid.
Coumarin-PEG-PADT (15). 11 mg (0.018 mmol NHS groups) of (14) and 8 mg (0.020 mmol,

S13
1.1 eq) of (7) in 2 mL DMF was reacted with 2.7 L (0.020 mmol, 1.1 eq) of Et3N in 100 L
DMF in the same way as that described for (8) yield 9.5 mg (69%). NMR was the same as
for (8) except for absence of the methoxy signal. The degree of functionalization was 77%.
GPC charts are reported in Figure S3.
Micelle formation. A DMF solution of PEG-PADT or coumarin-PEG-PADT (50 mg/mL) was
added drop wise to endotoxin-free water (1:9 v/v DMF/H2O) under vigorous stirring at RT.
After stirring for 30 min, the solution was transferred to a Slide-A-Lyzer G2 (MWCO 2 kDa)
and dialyzed against milliQ water. Fluorescence intensity data as shown in Figure S5 show
the presence of coumarin on the surface of the micelles after dialysis.

S14
Cell experiments
Cell culture. RAW Blue cells were cultured in DMEM GlutaMAX supplemented with 10%
heat-inactivated FBS, 50 U/mL-50 μg/mL penicillin-streptomycin and 200 mg/mL Zeocin in
CO2 incubator at 37oC. Cells were passaged when reaching 70-80% confluency.
Preparation of cell lysate. RAW Blue cells at 80% confluency were scraped off and
centrifuged at 500 rpm for 5 min. The cell pellet was washed with cold Dulbecco’s
Phosphate buffered saline (PBS) three times. The cell suspension was centrifuged at 500
rpm for 5 min, resuspended in Passive Lysis Buffer at 1×10⁷ cells/mL and vortexed at RT for
10 min. The suspension was centrifuged and the clear supernatant was collected and stored
at -20oC.
Measurement of H2S release by H2S electrode sensor. Degassed PBS containing
10vol% FBS or 20vol% cell lysate (1 mL) was placed in a four-port closed chamber and
incubated at 37°C. After the sensor signal became stable, 50 μL PEG-ADT or ADT micelle
solutions was added (final concentration of ADT units: 25 μM) using a Hamilton syringe.
Released H2S was recorded on a four-channel free radical analyzer.
Measurement of H2S concentration in cell culture medium by fluorescent dye. RAW
Blue cells were seeded in a 96-well plate (5×10⁴ cells/well) and cultured for 1 d. The medium
was replaced with 100 μL/well of fresh medium and 1 μL/well of ADT in DMSO, 5 μL/well of
PEG-ADT or ADT micelles in water were added (final concentration of ADT: 100 μM). At
different time points, 5 μL of medium was withdrawn and diluted with 45 μL PBS. This
sample solution was immediately mixed with 50 μL WSP-1/DMSO (100 μM). A serial dilution
of Na2S in PBS was used as a standard. Fluorescence intensity (λex=465 nm, λem=515 nm)
was measured on a Tecan well plate reader.
Cell viability assay. RAW Blue cells were seeded in a 96-well plate (5×10⁴ cells/well) and
cultured for 1 d. The medium was replaced with 100 μL/well of fresh medium and 1 μL/well
of ADT in DMSO, 5 μL/well of PEG-ADT, ADT micelles and Na2S in LPS-free water with
different concentrations were added. Cells were cultured for 1 d in a CO2 incubator at 37oC.
Thereafter, the medium was replaced with 100 μL/well fresh medium and 10 μL of MTT
solution (5 mg/mL in PBS) was added to each well and then incubated for 2 h at 37oC. Then
100 μL of 0.1 g/mL sodium dodecyl sulfate in 0.01M HCl (aq) was added to each well to lyse
cells and solubilize formazan crystals, and the OD at 570 nm was measured.
S15
Proinflammatory effects of H2S donors. RAW Blue cells were seeded in a 96-well plate
(5×10⁴ cells/well) and cultured for 1 d. The medium was replaced with 100 μL/well of fresh
medium and 1 μL/well of ADT in DMSO, 5 μL/well of PEG-ADT, ADT micelles and Na2S in
LPS-free water were added (final concentration of ADT: 50 μM). Cells were cultured for 3 h
and thereafter 10 μL of 10 μg/mL gardiquimod in culture medium was added to each well.
After 2 h of culture, 20 μL of medium was collected and TNF-α concentration was
determined by ELISA. After 24 h of culture, the SEAP level in the medium was determined
by Quanti-Blue assay. Statistical analysis was performed using the Student t-test.
Observation of intracellular distribution of the micelles. RAW Blue cells were seeded in
a triple-wells glass-based dish (5×10⁴ cells/well) and cultured for 1 d. The medium was
replaced with 200 μL/well of fresh medium containing 1 mg/mL rhodamine-labeled dextran
(10kDa) and 20 μL of coumarin-ADT micelles in water (5 mg/mL) were added. After 4 h of
culture, cells were washed with PBS and 100 μL/well of fresh medium was added. Cells
were observed with an Olympus FluoView FV1000-D confocal microscope.
S16
References
1. Hasegawa, U.; van der Vlies, A. J.; Simeoni, E.; Wandrey, C.; Hubbell, J. A., J. Am. Chem.
Soc. 2010, 132 , 18273.
2. Hasegawa, U.; van der Vlies, A. J., Bioconjugate Chem., 2014, DOI: 10.1021/bc500150s.


![Polymeric nanocarrier systems for photodynamic …polymeric micelles [42-45], and polymeric nanoparti-cles [37-41] have been extensively studied for serving as PS carriers in PDT](https://img.pdfslide.net/doc/110x75/5ed92dc96714ca7f47694afa/polymeric-nanocarrier-systems-for-photodynamic-polymeric-micelles-42-45-and-polymeric.jpg)