Embed Size (px)
Citation preview
This is a repository copy of Polymers and biopolymers at interfaces.
White Rose Research Online URL for this paper:http://eprints.whiterose.ac.uk/127050/
Version: Accepted Version
Article:
Hall, A.R. and Geoghegan, M. (2018) Polymers and biopolymers at interfaces. Reports on Progress in Physics, 81 (3). 036601. ISSN 0034-4885
https://doi.org/10.1088/1361-6633/aa9e9c
[email protected]://eprints.whiterose.ac.uk/
Reuse
Items deposited in White Rose Research Online are protected by copyright, with all rights reserved unless indicated otherwise. They may be downloaded and/or printed for private study, or other acts as permitted by national copyright laws. The publisher or other rights holders may allow further reproduction and re-use of the full text version. This is indicated by the licence information on the White Rose Research Online record for the item.
Takedown
If you consider content in White Rose Research Online to be in breach of UK law, please notify us by emailing [email protected] including the URL of the record and the reason for the withdrawal request.
Polymers and biopolymers at interfaces
A R Hall1,2 and M Geoghegan1
1 Department of Physics and Astronomy, University of Sheffield, Hounsfield Road,Sheffield S3 7RH, UK2 Biomedical Diagnostics Institute, Dublin City University, Glasnevin, Dublin 9,Ireland
Abstract.
This review updates recent progress in the understanding of the behaviour ofpolymers at surfaces and interfaces, highlighting examples in the areas of wetting,dewetting, crystallization, and “smart” materials. Recent developments in analysistools have yielded a large increase in the study of biological systems, and some of thesewill also be discussed, focussing on areas where surfaces are important. These areasinclude molecular binding events and protein adsorption as well as the mapping of thesurfaces of cells. Important techniques commonly used for the analysis of surfaces andinterfaces are discussed separately to aid the understanding of their application.
1. Introduction
The physics underlying polymers at surfaces, like much in science, has a simplecore wrapped in a detail that masks the underlying principles. However, it is anunderstanding and a recognition of these principles that allows researchers to makeprogress in developing the field. In this spirit, consider a polymer in solution close toa surface. Does the polymer adsorb on the surface? If so, does it sit there, as flat as apancake, or does it have only a few contact points, with the rest of the molecule fullysolvated (Figure 1)? The answer lies — like so much of physics — in a considerationof energetics. Polymers in contact with solvents do so because such contact reducestheir energy, through the formation of temporary and favourable polymer-solvent links.Hydrogen bonding may occur, especially if an aqueous solution is being considered, andvan der Waals interactions will also take place; electrostatics is generally importantbecause polar molecules tend to prefer polar solvents and non-polar molecules requirenon-polar solvents. Polystyrene (non-polar) will dissolve extremely well in non-polartoluene, but is insoluble in (polar) water. Poly(acrylic acid) will, however, dissolvein water because it has a polar carboxylic acid group which facilitates a network ofhydrogen bonds. A polymer will thus lower its energy in contact with a good solvent.Similarly, a polymer will also lower its energy in contact with a compatible surface.Complexity arises when it is considered that the solvent itself will also lower its energywhen in contact with a compatible surface, and surfaces compatible with the polymer
List of abbreviations
AFM atomic-force microscopy DLVO Derjaguin, Landau, Verwey,and Overbeek
F8 poly(9,9-dioctylfluorene) F8BT poly(9,9-dioctylfluorene-alt-benzothiadiazole)
FCS fluorescence correlationspectroscopy
FFM friction force microscopy
FJC freely-jointed chain FPE fish protein extractFReS forward recoil spectrometry HSA human serum albuminLCST lower critical solution tem-
peratureLED light-emitting diode
NRA nuclear reaction analysis PDMAc poly(N,N -dimethylacrylamide)
PDMS polydimethylsiloxane PEDOT poly(3,4-ethylenedioxythiophene)
PEG poly(ethylene glycol) PET poly(ethylene terepthalate)PFB poly(9,9-dioctylfluorene-
alt-bis-N,N ′-(4-butylphenyl)-bis-N,N ′-phenyl-1,4-phenylenediamine)
PLLA poly(l-lactic acid)
PMAA poly(methacrylic acid) PNIPAm poly(N -isopropyl acry-lamide)
PSS poly(styrene sulfonate) PVME polyvinylmethyletherPαMS poly(α-methylstyrene) P3HT poly(3-hexylthiophene)QCM-D quartz crystal microbalance
with dissipationRBS Rutherford backscattering
SBA soybean agglutinin SEM scanning electron mi-croscopy
SFM scanning force microscopy SIMS secondary-ion mass spec-trometry
SMFS single molecule force spec-troscopy
SNOM scanning near-field opticalmicroscopy
STM scanning tunnelling mi-croscopy
TCPS tissue culture polystyrene
TIPS-pentacene 6,13-bis(triisopropylsilylethynyl) pentacene
TnPSM modified porcine submaxil-lary mucin
UHV ultra-high vacuum UV ultravioletUPS ultraviolet photoelectron
spectroscopyWLC worm-like chain
XPS X-ray photoelectron spec-troscopy
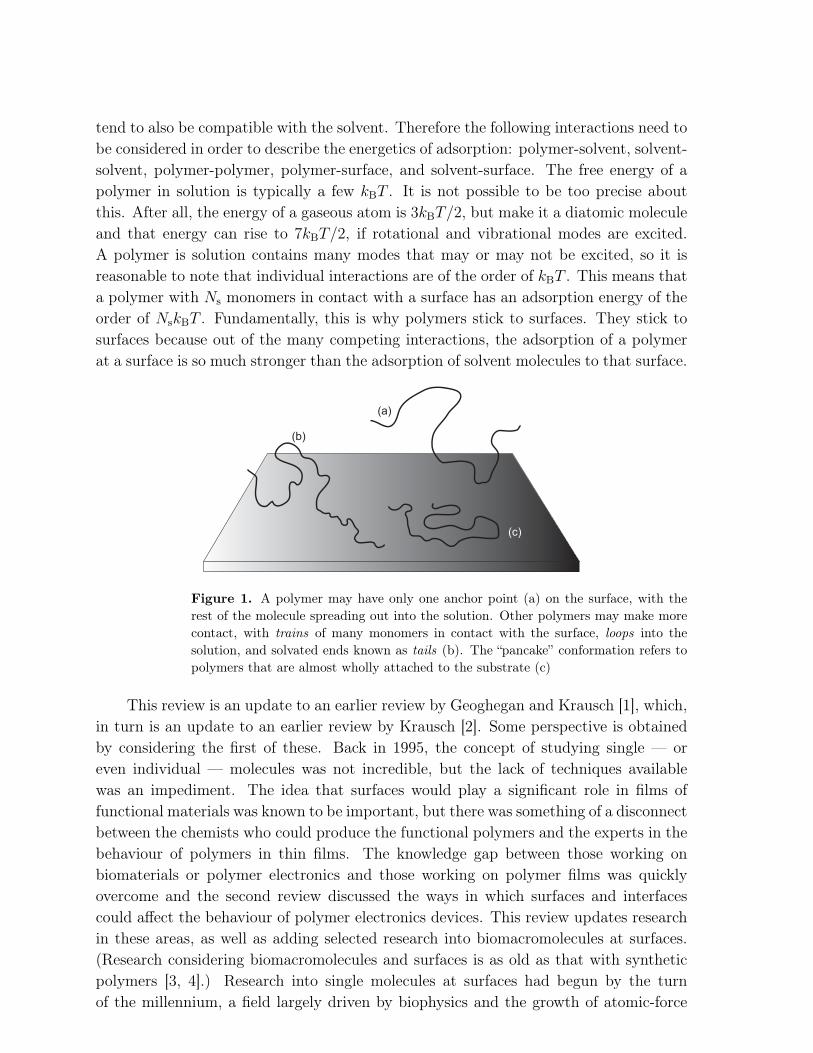
tend to also be compatible with the solvent. Therefore the following interactions need tobe considered in order to describe the energetics of adsorption: polymer-solvent, solvent-solvent, polymer-polymer, polymer-surface, and solvent-surface. The free energy of apolymer in solution is typically a few kBT . It is not possible to be too precise aboutthis. After all, the energy of a gaseous atom is 3kBT/2, but make it a diatomic moleculeand that energy can rise to 7kBT/2, if rotational and vibrational modes are excited.A polymer is solution contains many modes that may or may not be excited, so it isreasonable to note that individual interactions are of the order of kBT . This means thata polymer with Ns monomers in contact with a surface has an adsorption energy of theorder of NskBT . Fundamentally, this is why polymers stick to surfaces. They stick tosurfaces because out of the many competing interactions, the adsorption of a polymerat a surface is so much stronger than the adsorption of solvent molecules to that surface.
(a)
(b)
(c)
Figure 1. A polymer may have only one anchor point (a) on the surface, with therest of the molecule spreading out into the solution. Other polymers may make morecontact, with trains of many monomers in contact with the surface, loops into thesolution, and solvated ends known as tails (b). The “pancake” conformation refers topolymers that are almost wholly attached to the substrate (c)
This review is an update to an earlier review by Geoghegan and Krausch [1], which,in turn is an update to an earlier review by Krausch [2]. Some perspective is obtainedby considering the first of these. Back in 1995, the concept of studying single — oreven individual — molecules was not incredible, but the lack of techniques availablewas an impediment. The idea that surfaces would play a significant role in films offunctional materials was known to be important, but there was something of a disconnectbetween the chemists who could produce the functional polymers and the experts in thebehaviour of polymers in thin films. The knowledge gap between those working onbiomaterials or polymer electronics and those working on polymer films was quicklyovercome and the second review discussed the ways in which surfaces and interfacescould affect the behaviour of polymer electronics devices. This review updates researchin these areas, as well as adding selected research into biomacromolecules at surfaces.(Research considering biomacromolecules and surfaces is as old as that with syntheticpolymers [3, 4].) Research into single molecules at surfaces had begun by the turnof the millennium, a field largely driven by biophysics and the growth of atomic-force
microscopy (AFM) and other techniques such as optical tweezers that were capable ofmanipulating single macromolecules.
The review by Krausch [2] took as a starting point the idea that differences in surfaceenergy between different components of a polymer blend thin film or a block copolymer-induced structure gave surfaces their individual properties. The first experiments inthis area were speculative and of value largely for the interesting results they presented.Reich and Cohen [5] presented optical microscopy results that showed phase separationin films of blends of polystyrene and polyvinylmethylether (PVME). It was some yearslater that a different team showed that the PVME in this blend was found at the surfacein greater concentrations than in the bulk of the film [6], solely due to the differences insurface energy between the two components. The increasing access of good technologyto different research groups ensured that such important results could be made. HereX-ray photoelectron spectroscopy (XPS) was used to identify PVME at the surface,and the simpler pendant drop experiment to contrast the surface energies of the twocomponents. Theoretically, it was realized that polymers at surfaces could be treatedadequately by mean-field theory. Here the lattice model of polymer physics, pioneeredby Paul Flory and others over 60 years ago [7, 8, 9], was married to the mean-fieldtheory of wetting by John Cahn [10] to provide a theoretical foundation for the study ofsurface structure in polymer films [11]. Experimentally, the work of Richard Jones andEd Kramer at Cornell University provided an application of the new theory to thin filmsof mixtures of polystyrene and its deuterated counterpart [12]. This work continued atpace, and some of the developments are considered later in this review. It has to beconceded nevertheless, that the structure of polymer films, as applied to homopolymermixtures, is a subject considered “done” by many. Of course there are always new andinteresting results, such as the study of polymer film formation in situ during spin-coating [13, 14, 15, 16, 17, 18], which is a popular method of producing uniform filmsby rotating a drop of solution on a substrate at a few thousand rpm.
The study of single molecules on surfaces or at interfaces can be split into twocategories. Some experiments manipulate individual molecules and others describedilute mixtures whereby the behaviour of single molecules is observed, but only asan ensemble average [19]; many molecules are measured, but it is only by virtue ofthese molecules being very dilute that the study can be considered a single moleculeexperiment. The advantage of this latter scenario is that the experiments identifygeneral behaviour, whereas in the former case there is the risk that an experimentmay be performed on outlying samples. Thus reliable data for individual moleculescan only be obtained by performing numerous experiments, which can be rather timeconsuming. However, it is often the outlying results that offer new and interestinginsights into behaviour which would otherwise would be subsumed within the otherdata for experiments on dilute systems. Data that can be obtained by aggregateexperiments on single molecules at surfaces include techniques such as fluorescencecorrelation spectroscopy (FCS) and surface-enhanced Raman spectroscopy, where diluteconcentrations are needed to ensure that experiments are performed at the single
molecules level. FCS in particular has the ready capability of determining the numberof molecules per unit volume, which is particularly useful given that what might bedilute (at the single molecule level) in the medium to which it is introduced, may not beso dilute at the surface. Experiments capable of studying individual molecules includeoptical tweezers, AFM, and high-resolution fluorescence microscopy experiments.
The study of ensemble behaviour of single molecules at surfaces is certainly aminority interest. Its headline experiments have involved the diffusion of polymersat surfaces using FCS [19, 20, 21, 22]. Molecular tracking has had considerable successin different areas, and particularly in cell biology [19]. High-resolution fluorescencemicroscopy has a role to play, and single polymer imaging has been demonstrated[23], but with further developments underway, such as stochastic optical reconstructionmicroscopy [24], again inspired by the needs of cell biology research, the in situ imagingof the behaviour of single molecules is one that promises to yield important results in thecoming years. Of course, AFM-based techniques do provide single molecule resolution,either by AFM itself [25] or through scanning tunnelling microscopy (STM) [26]. STMhas long been known for its atomic resolution, but with its restriction on substratesoften inconvenient, it is worth noting the progress of AFM in this respect [27]. Theresolution of torsional mode AFM [25] is better than 0.4 nm, so there is good reason toexpect routine atomic resolution in polymers in the future. Nevertheless, scanning probetechniques (AFM and STM) are techniques used to study static phenomena and theirinsight into the behaviour of polymers at interfaces is less likely to reveal new physicsthan dynamic techniques such as those that are fluorescence-based, despite the betterresolution of the scanning probe microscopy experiments. (Scanning probe microscopywill have certainly a large impact in solving different kinetic problems, for example, self-assembly problems such as crystallization, where video rate scanning probe techniqueshave already been shown to be useful [28]. In fact more recent developments haveimaged biological action at work, with video imaging of the myosin molecular motor[29].) The high resolution of electron microscopy would be expected to make someimpact in the study of single molecules at surfaces, but sample preparation and contrastlimitations have minimized its effectiveness, although cryo-techniques can be effectiveat considering surface-bound molecules [30]. Single molecule microscopy studies areconsidered in reviews elsewhere [19, 31].
Molecular force probe techniques are a class of AFM in which a molecule, attachedto an AFM tip, is brought to, and pulled away from a surface. In some cases thepolymer rests on the surface, and the AFM probe is used to study the forces involvedin its removal from the surface. This is known as single molecule force spectroscopy(SMFS) and these experiments provide significant insight into the structural propertiesof the individual molecules at surfaces. An important contribution of experiments ofthis type has been to the understanding of the folding behaviour for proteins [32, 33]and the study of microbial surfaces [34]. We consider the impact of these techniques insome detail in this review.
Polymer electronics is a high-profile research theme where interfaces play a key role
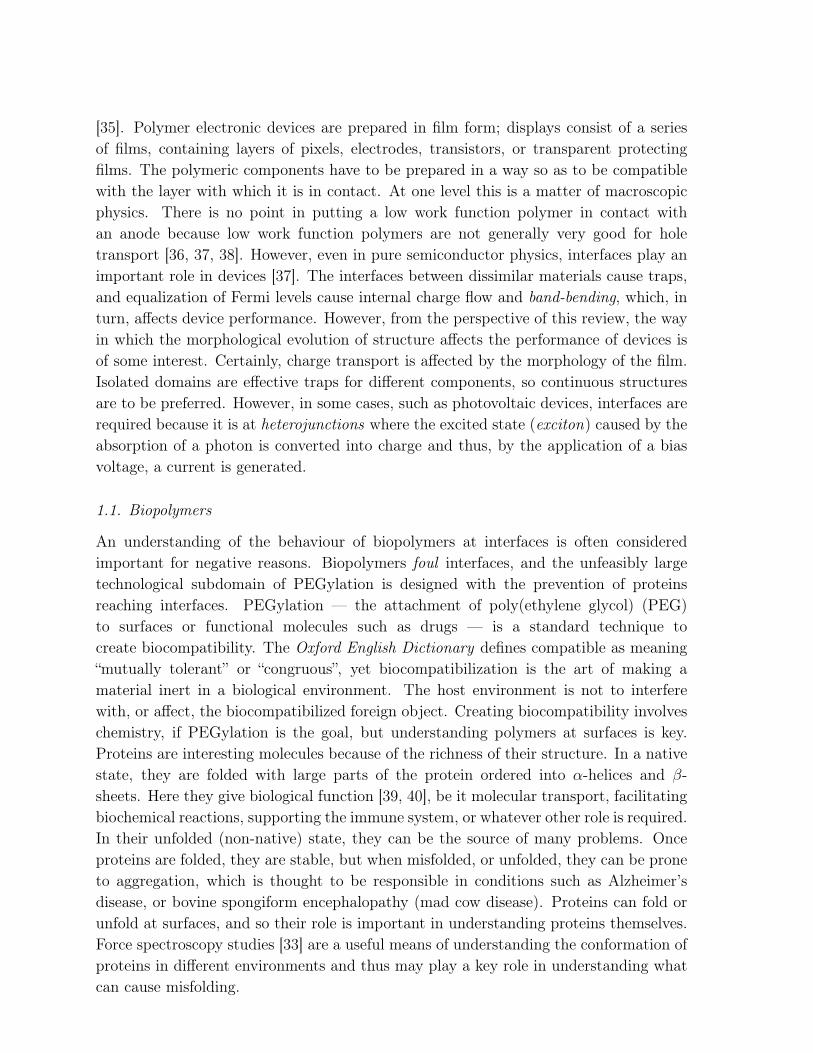
[35]. Polymer electronic devices are prepared in film form; displays consist of a seriesof films, containing layers of pixels, electrodes, transistors, or transparent protectingfilms. The polymeric components have to be prepared in a way so as to be compatiblewith the layer with which it is in contact. At one level this is a matter of macroscopicphysics. There is no point in putting a low work function polymer in contact withan anode because low work function polymers are not generally very good for holetransport [36, 37, 38]. However, even in pure semiconductor physics, interfaces play animportant role in devices [37]. The interfaces between dissimilar materials cause traps,and equalization of Fermi levels cause internal charge flow and band-bending, which, inturn, affects device performance. However, from the perspective of this review, the wayin which the morphological evolution of structure affects the performance of devices isof some interest. Certainly, charge transport is affected by the morphology of the film.Isolated domains are effective traps for different components, so continuous structuresare to be preferred. However, in some cases, such as photovoltaic devices, interfaces arerequired because it is at heterojunctions where the excited state (exciton) caused by theabsorption of a photon is converted into charge and thus, by the application of a biasvoltage, a current is generated.
1.1. Biopolymers
An understanding of the behaviour of biopolymers at interfaces is often consideredimportant for negative reasons. Biopolymers foul interfaces, and the unfeasibly largetechnological subdomain of PEGylation is designed with the prevention of proteinsreaching interfaces. PEGylation — the attachment of poly(ethylene glycol) (PEG)to surfaces or functional molecules such as drugs — is a standard technique tocreate biocompatibility. The Oxford English Dictionary defines compatible as meaning“mutually tolerant” or “congruous”, yet biocompatibilization is the art of making amaterial inert in a biological environment. The host environment is not to interferewith, or affect, the biocompatibilized foreign object. Creating biocompatibility involveschemistry, if PEGylation is the goal, but understanding polymers at surfaces is key.Proteins are interesting molecules because of the richness of their structure. In a nativestate, they are folded with large parts of the protein ordered into α-helices and β-sheets. Here they give biological function [39, 40], be it molecular transport, facilitatingbiochemical reactions, supporting the immune system, or whatever other role is required.In their unfolded (non-native) state, they can be the source of many problems. Onceproteins are folded, they are stable, but when misfolded, or unfolded, they can be proneto aggregation, which is thought to be responsible in conditions such as Alzheimer’sdisease, or bovine spongiform encephalopathy (mad cow disease). Proteins can fold orunfold at surfaces, and so their role is important in understanding proteins themselves.Force spectroscopy studies [33] are a useful means of understanding the conformation ofproteins in different environments and thus may play a key role in understanding whatcan cause misfolding.
The prokaryotic cell wall is a complex environment consisting of many proteins,biosurfactants, and polysaccharides. Their adhesion is controlled by adhesin molecules,and the process of adhesion involves the secretion of these molecules to test the viabilityof a surface. Adhesins are part of a broader class of molecule known to biologistsas virulence factors, but for our purposes we can take them to be either proteins orpolysaccharides. If these molecules are compatible with a surface, the cell will adhereto that surface, and a biofilm may form: the surface is not biocompatible. It is commonpractice for researchers to consider the cell as an inert colloidal particle and its adsorptionto be controlled by electrostatic and van der Waals forces. The application of theorybased on these ideas — Derjaguin, Landau, Verwey, and Overbeek (DLVO) theory [41]— is commonplace. However, cells are not static inert objects, but adapt to theirenvironment. Their behaviour, and thus their physics is environmentally dependent.This is as true in the bulk as it is on surfaces. In the bulk, chemotaxis depends on theavailability of nutrients or presence of toxins and the cell’s response to these informsdifferent dynamical properties. On surfaces a dispassionate consideration of cell wallsis not in itself enough for a determination of whether or not a cell will adhere to agiven surface; for example, bacteria can express many different adhesins and adhesinexpression is dependent upon environmental factors [42].
O
NH
NH2OH
O
O
OH
NH2
RO
HO
O
H
HOOH
O
OH
O
H
HOOH
O
OH
n
(a)
(b) (c)
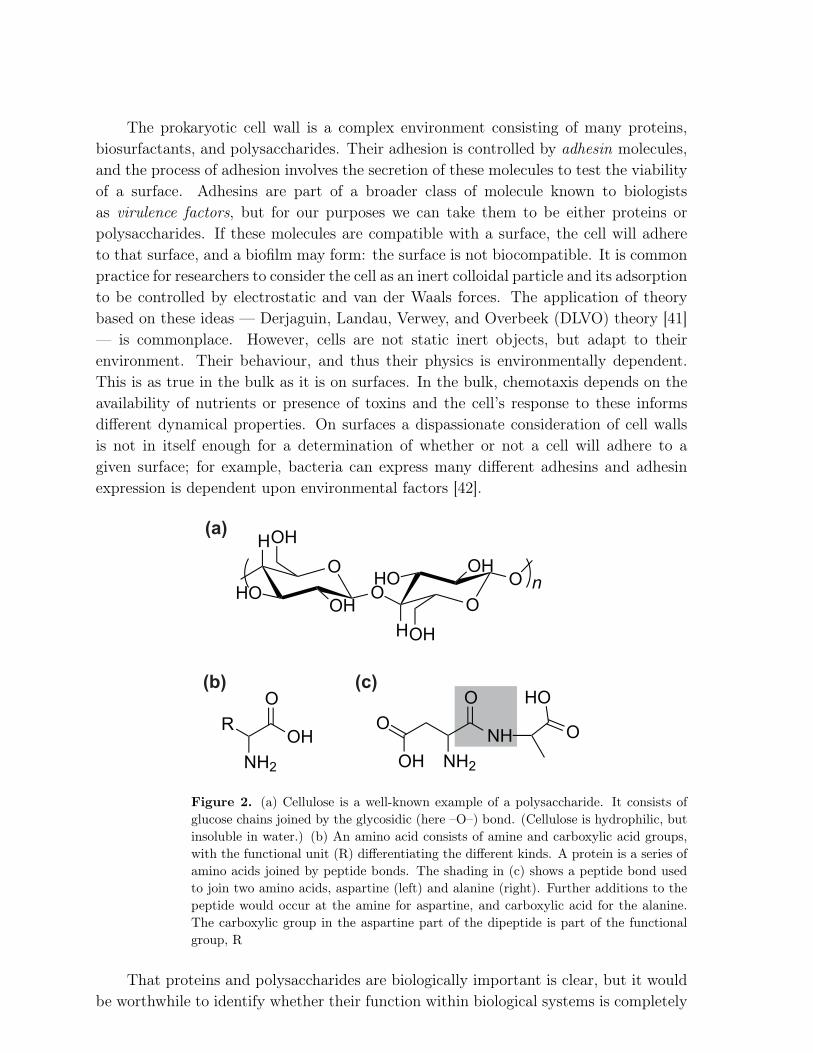
Figure 2. (a) Cellulose is a well-known example of a polysaccharide. It consists ofglucose chains joined by the glycosidic (here –O–) bond. (Cellulose is hydrophilic, butinsoluble in water.) (b) An amino acid consists of amine and carboxylic acid groups,with the functional unit (R) differentiating the different kinds. A protein is a series ofamino acids joined by peptide bonds. The shading in (c) shows a peptide bond usedto join two amino acids, aspartine (left) and alanine (right). Further additions to thepeptide would occur at the amine for aspartine, and carboxylic acid for the alanine.The carboxylic group in the aspartine part of the dipeptide is part of the functionalgroup, R
That proteins and polysaccharides are biologically important is clear, but it wouldbe worthwhile to identify whether their function within biological systems is completely
driven by their chemistry, or whether the underlying physics inherent in large moleculesalso affects their behaviour. A protein is a series of amino acids joined by peptidebonds, and a polysaccharide is a series of sugar molecules joined together by glycosidicbonds. These are shown in Figure 2. In both cases there are plenty of hydroxylgroups that give rise to the hydrophilicity of the components, as they are sources ofhydrogen bonding. Whilst the specific combination of chemical groups or amino acidswill interact individually with their environment, the ability of the chain to work asa single entity, as required for its biological function, is driven by the form of themolecule. This is particularly pertinent in the case of proteins, with their naturallyfolded peptide chains. This type of conformation arises from an energy landscape whereone of the most stable low-energy forms is a “marginally compact tube” [43], whichhas a propensity for generating α-helices and β-sheets, the most important secondarystructures in proteins [44]. Furthermore, proteins have been shown to maintain theirnative folded structure despite amino acid replacement, suggesting that the overall shapeand associated crystalline behaviour is at least partially independent of the chemistryof these large biomolecules [45].
Eukaryotes do not have a cell wall, but rather have a membrane. (Plants, however,can have cellulose-based cell walls surrounding the outer membrane.) Their adhesion tosurfaces is based on a wider array of adhesion molecules, and these are largely proteins.Their purpose is to ensure that tissue binding is complete, and are not optimized tobind to inorganic surfaces. Since their binding is expected to be to biological tissue,eukaryotic cells are best grown on hydrophilic surfaces in contrast to many prokaryotes,which are best cultured on hydrophobic surfaces.
2. Techniques for the structural investigation of surfaces and interfaces
There are numerous experiments that can be performed to understand the nature of asurface or interface. The questions that arise are based loosely around the informationthat is needed. An experiment designed to provide morphological information is notlikely to be useful if the requirements are chemical information. Furthermore, if theinterface is buried, it will be harder to access. It may be necessary to destroy the sampleto access that interface, but there are also techniques that can access covered interfacesin situ, for example by using neutrons. Techniques involving neutrons have their ownlimitations, such as a large associated cost and the requirement for access to facilitiesfor which instrument time may take many months to obtain. Selective deuteration toprovide contrast is often necessary. Most techniques have some requirements on samples;at the very least samples must be very clean for most experiments. Other means ofdifferentiating experimental techniques are those that provide real-space information,and the scattering techniques, which provide data in reciprocal space where detailedunambiguous analysis becomes challenging. Here we shall split our consideration oftechniques for the study of interfaces into those that provide information primarilyabout surfaces, and those that provide information about buried interfaces. The choice
of techniques is subjective, but those considered here have been demonstrated to beimportant over a number of years.
2.1. Surface analysis techniques
Surface analysis is a phrase often used by veterans of the field specifically to meanphotoelectron spectroscopy and secondary-ion mass spectrometry (SIMS). These twotechniques would provide chemical information about the surface. Initially, routinehigh-resolution surface imaging could only be provided by scanning electron microscopy(SEM). Now there is much more choice; photoelectron spectroscopy, SIMS, and SEMare high vacuum techniques and so newer techniques were designed to be somewhatmore flexible. The suite of scanning probe techniques allows much greater choice inhow samples can be measured, and provides a wide variety of data. Neverthless, ifchemical information is needed, photoelectron spectroscopy and SIMS are hard to beat.Infrared techniques, however, can also provide much useful chemical information. Thereare many reviews concerning surface analysis, but if the reader wishes to see a completeoverview, the book edited by Vickerman is to be strongly recommended [46]. Here, withdue deference to its position in the history of polymer surfaces, X-ray photoelectronspectroscopy, which is sometimes called electron spectroscopy for chemical analysis, isdiscussed.
anode
crystal
monochromator
sample
energy analyzer
vacuum pump
focussing lens system
hν
e-
sample input
UHV system
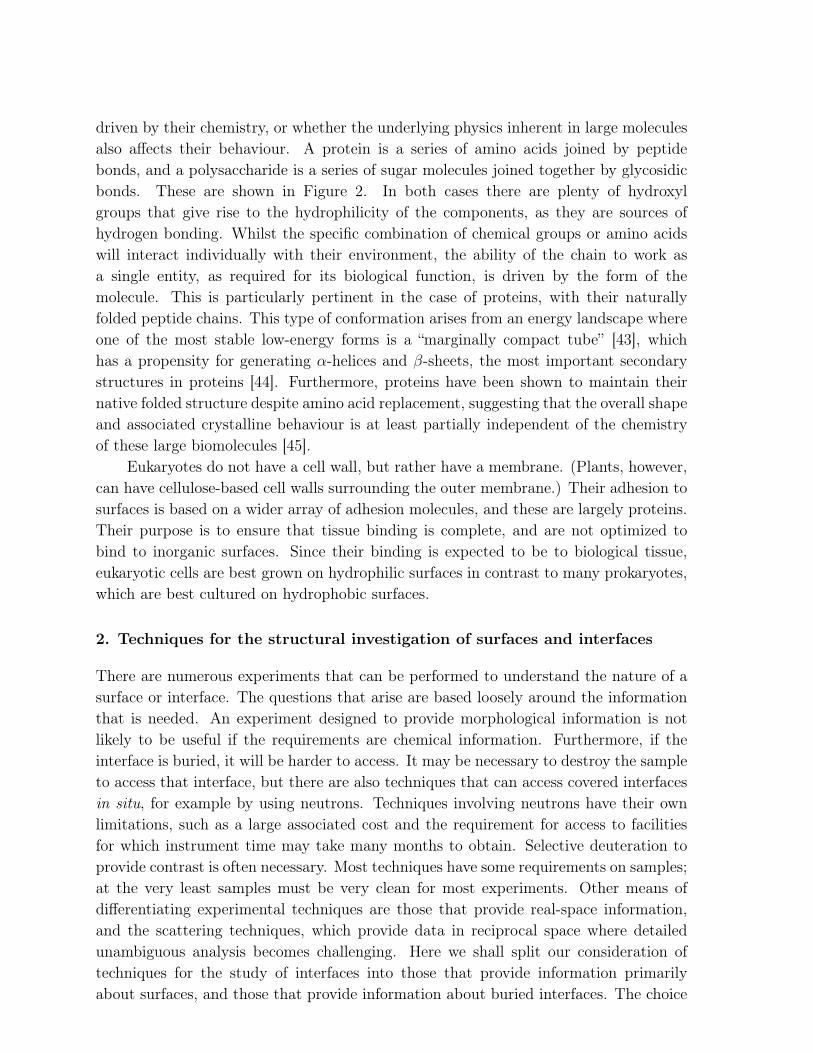
Figure 3. Schematic diagram of a typical XPS set-up. X-rays generated from anappropriate anode are made monochromatic by a crystal grating and then incidenton the sample. Ejected electrons are collected by a focussing system to maximize thecount-rate, before being energy selected by the use of electrostatic fields in an energyanalyser. The voltage across the analyser is scanned and each potential across theanalyser corresponds to a given electron energy
2.1.1. X-ray photoelectron spectroscopy. The two photoelectron techniques, XPS andits longer wavelength sibling, ultraviolet (UV) photoelectron spectroscopy (UPS), offerthe same operating principle although their uses are slightly different. X-rays or UVare used to eject electrons from the sample. The high-energy X-rays are capable ofejecting core electrons and the resultant information (the energy of these electrons)provides information on the chemical composition and bonding in the material underillumination. UV radiation ejects outermost (valence) electrons form the material understudy, and this can enable a better understanding of the electronic structure of thematerial. UPS is often used for measuring density of states in materials. UPS thereforeis mostly (but not exclusively) used for understanding general (bulk) properties and sois of less interest than XPS to those whose primary concern is the surface.
Monochromatic X-rays are generated in a metal source, such as a Kα source ofmagnesium or aluminium, in an ultra-high vacuum (UHV) chamber (Figure 3). TheseX-rays, of energy 1254 eV (Mg Kα) or 1487 eV (Al Kα) are generated in an anode, whichis usually a heated filament. The anode also generates other emission lines as well asthe Kα lines that are often used, and so a crystal monochromator can be employed toremove unwanted lines. (Recent developments include the use of synchrotron radiationin XPS measurements which dispose with the need for a metal source. Furthermorethese are tuneable in energy, and here crystal monochromators are particularly helpful.)X-rays are then incident on the sample and they will eject core electrons. X-rays,being uncharged and highly energetic, have a very strong penetration of most samples,but the photoelectrons ejected in the analysis do not travel far. Indeed, it is only thephotoelectrons generated very near the surface that can escape the sample and thislimits the depth of available information from XPS to no more than 10 nm from thesurface, although in most cases it will be less than this.
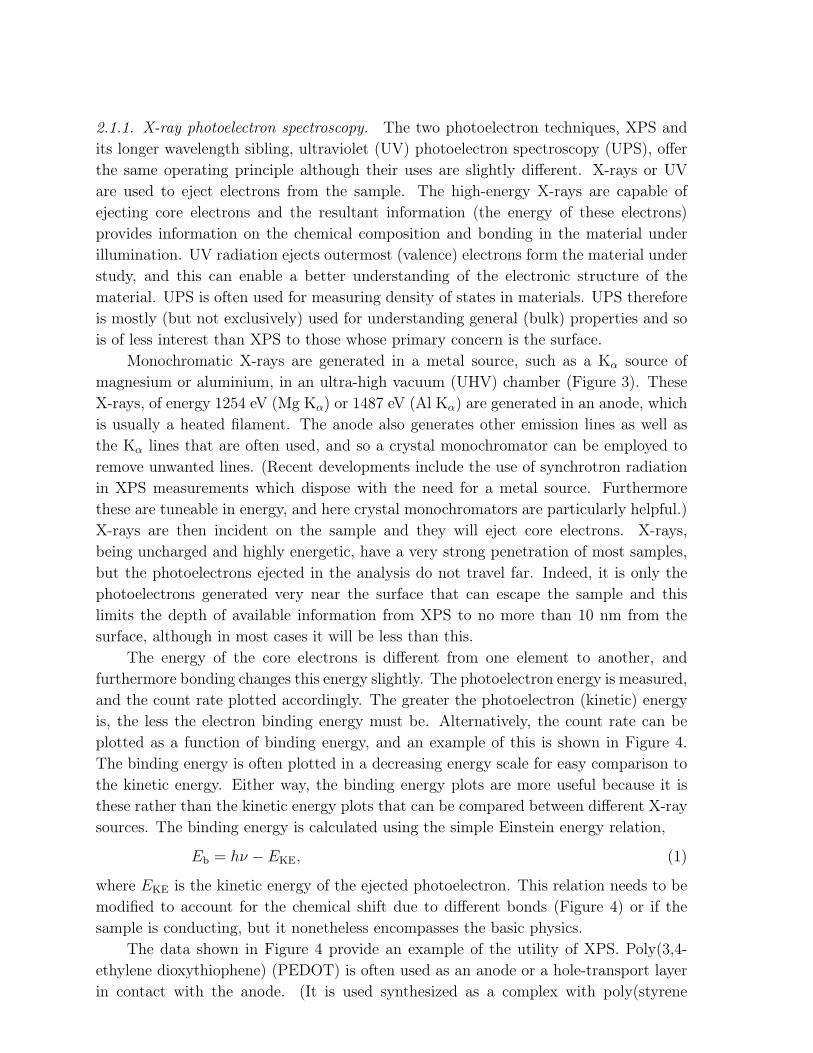
The energy of the core electrons is different from one element to another, andfurthermore bonding changes this energy slightly. The photoelectron energy is measured,and the count rate plotted accordingly. The greater the photoelectron (kinetic) energyis, the less the electron binding energy must be. Alternatively, the count rate can beplotted as a function of binding energy, and an example of this is shown in Figure 4.The binding energy is often plotted in a decreasing energy scale for easy comparison tothe kinetic energy. Either way, the binding energy plots are more useful because it isthese rather than the kinetic energy plots that can be compared between different X-raysources. The binding energy is calculated using the simple Einstein energy relation,
Eb = hν − EKE, (1)
where EKE is the kinetic energy of the ejected photoelectron. This relation needs to bemodified to account for the chemical shift due to different bonds (Figure 4) or if thesample is conducting, but it nonetheless encompasses the basic physics.
The data shown in Figure 4 provide an example of the utility of XPS. Poly(3,4-ethylene dioxythiophene) (PEDOT) is often used as an anode or a hole-transport layerin contact with the anode. (It is used synthesized as a complex with poly(styrene
280 284 288 2920
1000
2000
3000
Binding Energy (eV)
Co
un
ts p
er
se
co
nd
Carbon scanC–OHC–C
0 200 400 600 800 10000
2.104
4.104
6.104
S
CO
Figure 4. XPS data are first obtained with a wide scan to check the presence ofthe elements under study. An example survey scan is shown in the inset, along withthe locations of the primary carbon, oxygen, and sulfur peaks under study. Thesescans are low resolution, but for a detailed study, high resolution scans are thenperformed. The data in the figure are of a C(1S) scan of film of the synthetic metalpoly(3,4-ethylene dioxythiophene) (PEDOT) complexed with poly(styrene sulfonate)(PSS) after crosslinking with glycerol. The data are shown as a solid line, and thebroken lines show fitting to the data. The fitting allows a clear differentiation betweenC–OH and C–C bonds. By comparing the relative areas of the peaks associated withthe relevant elements and their bonds, the surface compositions of the film can bededuced. These data were used in a study of the water resistance of such films byRodríguez et al [47]
sulfonate) (PSS), which acts as a dopant and allows processing of the PEDOT inaqueous solution because PEDOT is generally insoluble. It is known that adding highboiling point alcohols such as glycerol [48] or sorbitol [49] to PEDOT/PSS layers canimprove performance of polymer devices, but optimizing performance is aided by adetailed knowledge of their structure. The XPS data in Figure 4 show that thereis a strong contribution of C–OH bonds in the scan, which is commensurate with asignificant amount of glycerol at the surface [47]. The glycerol is not conducting (orsemiconducting) and so charge transport between this hole-transport layer (or anode)and the semiconducting layer of the device must be though an insulating layer. Whetherthis insulating layer improves the quality of the device is not clear, but it is difficult toremove it because thermodynamics (surface energy) control its presence at the surface.It is known from XPS [50] and neutron reflectometry [51] measurements that, withoutthe alcohols, the PSS is located at the surface, so even then the PEDOT is not in contactwith the semiconducting layer.
2.1.2. Secondary-ion mass spectroscopy. SIMS is a technique whereby medium-energyions are incident on the surface and, on collision, send out fragments of the surface ofthe film which are detected in a mass spectrometer. SIMS complements XPS because,unlike XPS, it can provide molecular information. A SIMS spectrometer uses a beamof ions — argon (Ar+) is typical, but other ions (which may be positive or negatively
Ion
source
sample
vacuum pump
Ion analyzer
sample input
UHV system
Ar+
Mass spectrometer
Detection
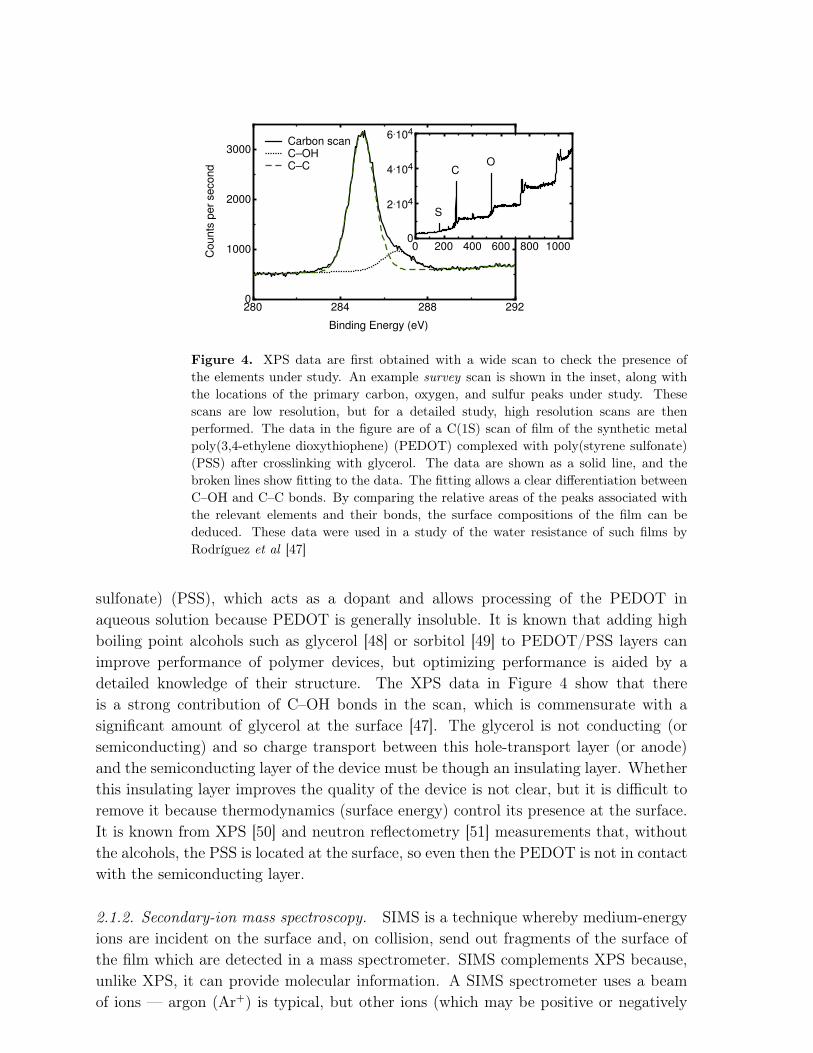
Figure 5. Schematic diagram of a typical SIMS set-up. Charged ions (here Ar+) areincident on the sample, whereupon they create secondary ions (fragments) in the film,which are collected by a lens (ion analyser) and are magnetically selected in a massspectrometer before detection
charged) such as caesium, oxygen, gallium, and xenon are common — accelerated to anenergy of typically 40 keV. This energy is large enough to eject many ions from the film,but, because they are charged, only material in the near surface region can escape, asis also the case for XPS. The typical set-up (Figure 5) is in principle quite similar to anXPS system.
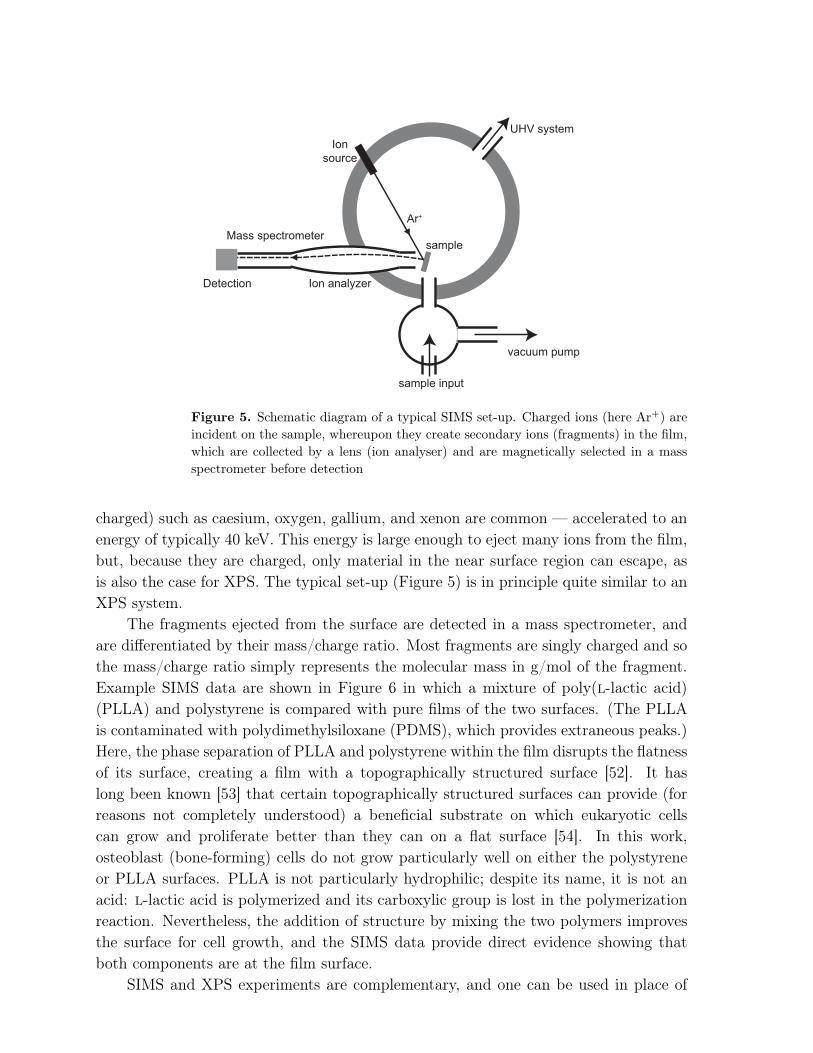
The fragments ejected from the surface are detected in a mass spectrometer, andare differentiated by their mass/charge ratio. Most fragments are singly charged and sothe mass/charge ratio simply represents the molecular mass in g/mol of the fragment.Example SIMS data are shown in Figure 6 in which a mixture of poly(l-lactic acid)(PLLA) and polystyrene is compared with pure films of the two surfaces. (The PLLAis contaminated with polydimethylsiloxane (PDMS), which provides extraneous peaks.)Here, the phase separation of PLLA and polystyrene within the film disrupts the flatnessof its surface, creating a film with a topographically structured surface [52]. It haslong been known [53] that certain topographically structured surfaces can provide (forreasons not completely understood) a beneficial substrate on which eukaryotic cellscan grow and proliferate better than they can on a flat surface [54]. In this work,osteoblast (bone-forming) cells do not grow particularly well on either the polystyreneor PLLA surfaces. PLLA is not particularly hydrophilic; despite its name, it is not anacid: l-lactic acid is polymerized and its carboxylic group is lost in the polymerizationreaction. Nevertheless, the addition of structure by mixing the two polymers improvesthe surface for cell growth, and the SIMS data provide direct evidence showing thatboth components are at the film surface.
SIMS and XPS experiments are complementary, and one can be used in place of
0 20 6040 80 100 120 140 180160 200
(a)
(b)
(c)
m/Z = 91
polystyrene
poly(ʟ-lactic acid)
mass/charge ratio, m/Z
Figure 6. SIMS data for polystyrene (a) and PLLA (c) films. The plots in part (b)show a mixture of PLLA and polystyrene. The abscissae are in units of g mol−1 e−1,where e is a unit of elementary charge. Using the line marked m/Z = 91, it is clearthat the mixture contains little polystyrene at the surface. Adapted with permissionfrom Lim et al. [52]. Copyright (2005) American Chemical Society
the other. In the study of PLLA and polystyrene described here [52], XPS was alsoperformed and a slightly increased polystyrene fraction at the surface was determinedthan for the SIMS experiments, which helps to add limits to the accuracy of theexperiments.
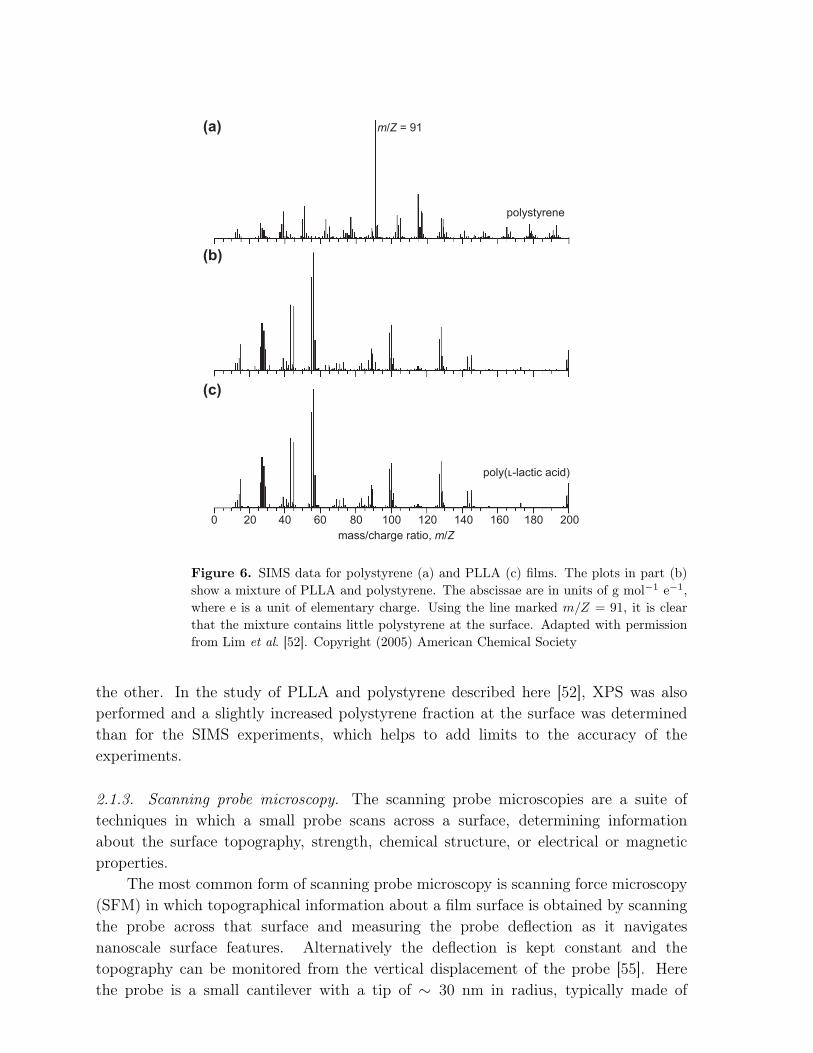
2.1.3. Scanning probe microscopy. The scanning probe microscopies are a suite oftechniques in which a small probe scans across a surface, determining informationabout the surface topography, strength, chemical structure, or electrical or magneticproperties.
The most common form of scanning probe microscopy is scanning force microscopy(SFM) in which topographical information about a film surface is obtained by scanningthe probe across that surface and measuring the probe deflection as it navigatesnanoscale surface features. Alternatively the deflection is kept constant and thetopography can be monitored from the vertical displacement of the probe [55]. Herethe probe is a small cantilever with a tip of ∼ 30 nm in radius, typically made of
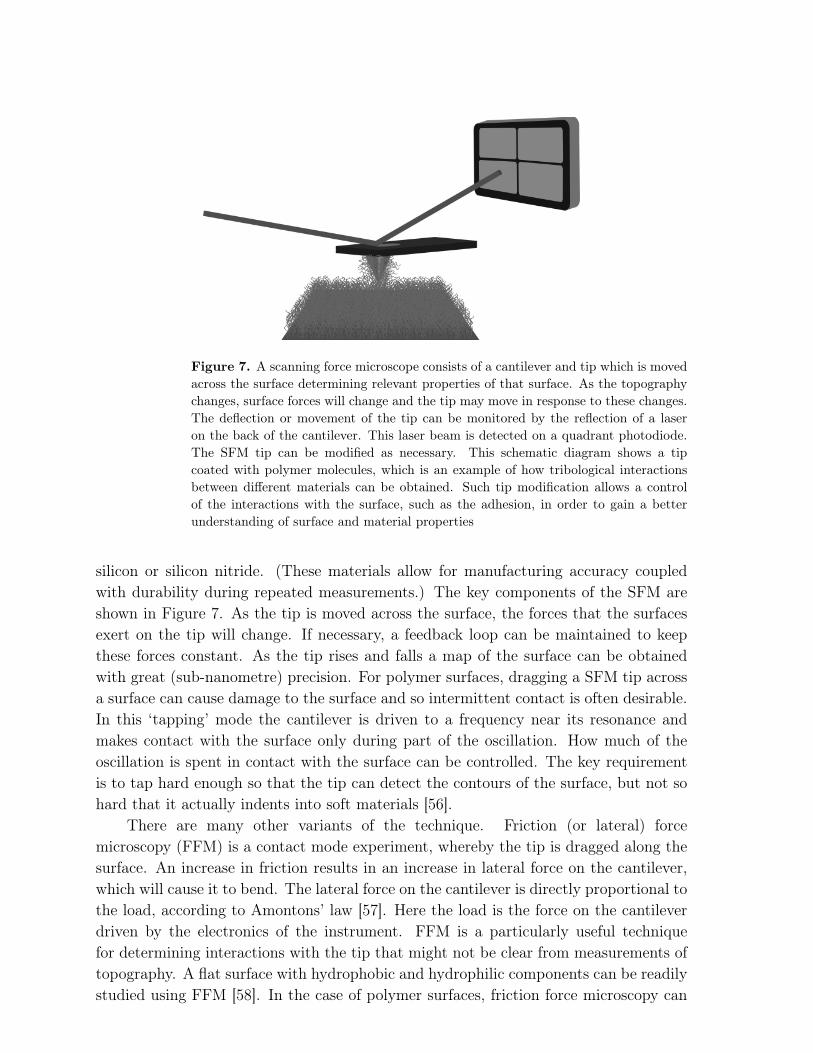
Figure 7. A scanning force microscope consists of a cantilever and tip which is movedacross the surface determining relevant properties of that surface. As the topographychanges, surface forces will change and the tip may move in response to these changes.The deflection or movement of the tip can be monitored by the reflection of a laseron the back of the cantilever. This laser beam is detected on a quadrant photodiode.The SFM tip can be modified as necessary. This schematic diagram shows a tipcoated with polymer molecules, which is an example of how tribological interactionsbetween different materials can be obtained. Such tip modification allows a controlof the interactions with the surface, such as the adhesion, in order to gain a betterunderstanding of surface and material properties
silicon or silicon nitride. (These materials allow for manufacturing accuracy coupledwith durability during repeated measurements.) The key components of the SFM areshown in Figure 7. As the tip is moved across the surface, the forces that the surfacesexert on the tip will change. If necessary, a feedback loop can be maintained to keepthese forces constant. As the tip rises and falls a map of the surface can be obtainedwith great (sub-nanometre) precision. For polymer surfaces, dragging a SFM tip acrossa surface can cause damage to the surface and so intermittent contact is often desirable.In this ‘tapping’ mode the cantilever is driven to a frequency near its resonance andmakes contact with the surface only during part of the oscillation. How much of theoscillation is spent in contact with the surface can be controlled. The key requirementis to tap hard enough so that the tip can detect the contours of the surface, but not sohard that it actually indents into soft materials [56].
There are many other variants of the technique. Friction (or lateral) forcemicroscopy (FFM) is a contact mode experiment, whereby the tip is dragged along thesurface. An increase in friction results in an increase in lateral force on the cantilever,which will cause it to bend. The lateral force on the cantilever is directly proportional tothe load, according to Amontons’ law [57]. Here the load is the force on the cantileverdriven by the electronics of the instrument. FFM is a particularly useful techniquefor determining interactions with the tip that might not be clear from measurements oftopography. A flat surface with hydrophobic and hydrophilic components can be readilystudied using FFM [58]. In the case of polymer surfaces, friction force microscopy can
provide valuable information about the viscoelastic properties of a polymer surface [59]or material interactions, as schematized in Figure 7, through grafting polymers to thetip surface [60].
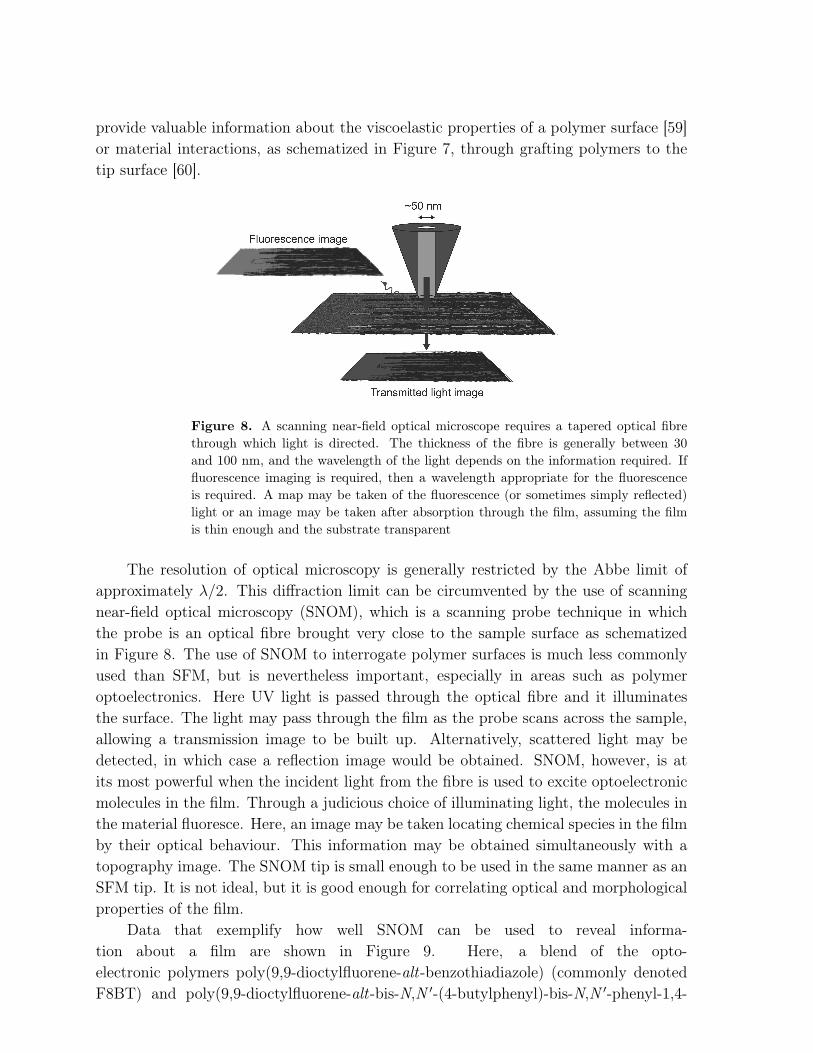
Figure 8. A scanning near-field optical microscope requires a tapered optical fibrethrough which light is directed. The thickness of the fibre is generally between 30and 100 nm, and the wavelength of the light depends on the information required. Iffluorescence imaging is required, then a wavelength appropriate for the fluorescenceis required. A map may be taken of the fluorescence (or sometimes simply reflected)light or an image may be taken after absorption through the film, assuming the filmis thin enough and the substrate transparent
The resolution of optical microscopy is generally restricted by the Abbe limit ofapproximately λ/2. This diffraction limit can be circumvented by the use of scanningnear-field optical microscopy (SNOM), which is a scanning probe technique in whichthe probe is an optical fibre brought very close to the sample surface as schematizedin Figure 8. The use of SNOM to interrogate polymer surfaces is much less commonlyused than SFM, but is nevertheless important, especially in areas such as polymeroptoelectronics. Here UV light is passed through the optical fibre and it illuminatesthe surface. The light may pass through the film as the probe scans across the sample,allowing a transmission image to be built up. Alternatively, scattered light may bedetected, in which case a reflection image would be obtained. SNOM, however, is atits most powerful when the incident light from the fibre is used to excite optoelectronicmolecules in the film. Through a judicious choice of illuminating light, the molecules inthe material fluoresce. Here, an image may be taken locating chemical species in the filmby their optical behaviour. This information may be obtained simultaneously with atopography image. The SNOM tip is small enough to be used in the same manner as anSFM tip. It is not ideal, but it is good enough for correlating optical and morphologicalproperties of the film.
Data that exemplify how well SNOM can be used to reveal informa-tion about a film are shown in Figure 9. Here, a blend of the opto-electronic polymers poly(9,9-dioctylfluorene-alt-benzothiadiazole) (commonly denotedF8BT) and poly(9,9-dioctylfluorene-alt-bis-N,N ′-(4-butylphenyl)-bis-N,N ′-phenyl-1,4-
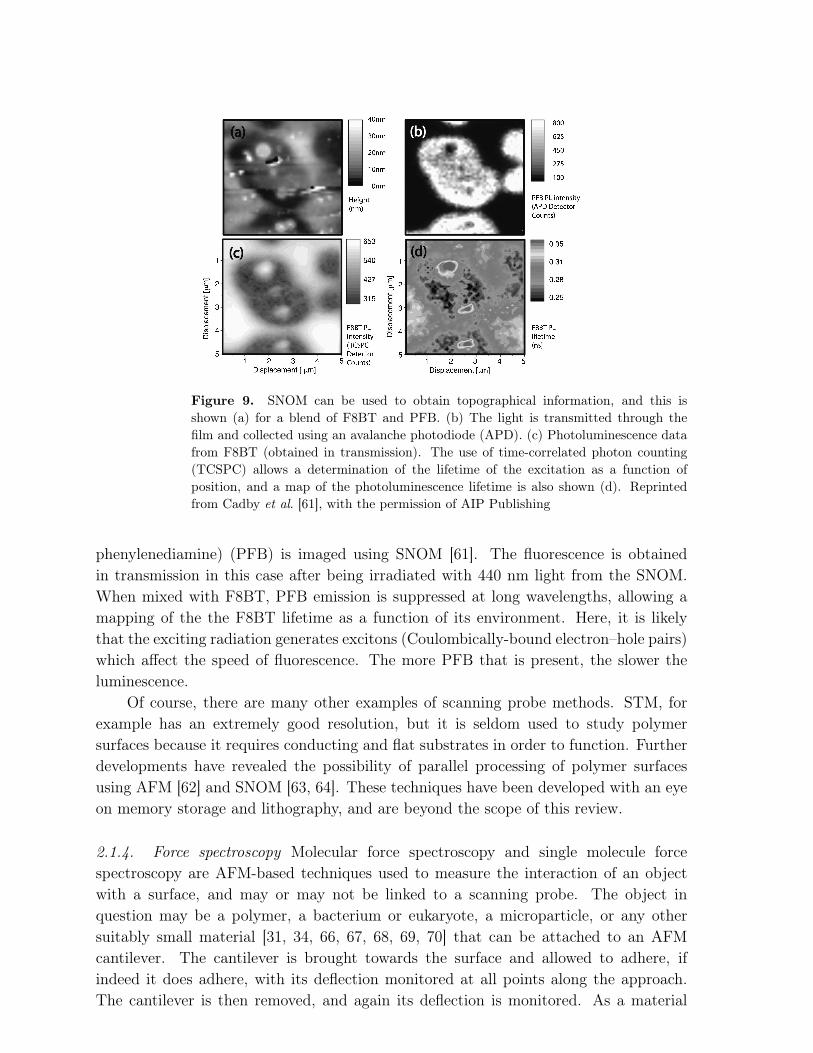
Figure 9. SNOM can be used to obtain topographical information, and this isshown (a) for a blend of F8BT and PFB. (b) The light is transmitted through thefilm and collected using an avalanche photodiode (APD). (c) Photoluminescence datafrom F8BT (obtained in transmission). The use of time-correlated photon counting(TCSPC) allows a determination of the lifetime of the excitation as a function ofposition, and a map of the photoluminescence lifetime is also shown (d). Reprintedfrom Cadby et al. [61], with the permission of AIP Publishing
phenylenediamine) (PFB) is imaged using SNOM [61]. The fluorescence is obtainedin transmission in this case after being irradiated with 440 nm light from the SNOM.When mixed with F8BT, PFB emission is suppressed at long wavelengths, allowing amapping of the the F8BT lifetime as a function of its environment. Here, it is likelythat the exciting radiation generates excitons (Coulombically-bound electron–hole pairs)which affect the speed of fluorescence. The more PFB that is present, the slower theluminescence.
Of course, there are many other examples of scanning probe methods. STM, forexample has an extremely good resolution, but it is seldom used to study polymersurfaces because it requires conducting and flat substrates in order to function. Furtherdevelopments have revealed the possibility of parallel processing of polymer surfacesusing AFM [62] and SNOM [63, 64]. These techniques have been developed with an eyeon memory storage and lithography, and are beyond the scope of this review.
2.1.4. Force spectroscopy Molecular force spectroscopy and single molecule forcespectroscopy are AFM-based techniques used to measure the interaction of an objectwith a surface, and may or may not be linked to a scanning probe. The object inquestion may be a polymer, a bacterium or eukaryote, a microparticle, or any othersuitably small material [31, 34, 66, 67, 68, 69, 70] that can be attached to an AFMcantilever. The cantilever is brought towards the surface and allowed to adhere, ifindeed it does adhere, with its deflection monitored at all points along the approach.The cantilever is then removed, and again its deflection is monitored. As a material
0 20 40 60 80
0
1
2
3
4
5
Distance (nm)
Fo
rce
(n
N)
(a)
0 20 40 60 80
0
1
2
3
4
5(d)
Distance (nm)
Fo
rce
(n
N)
0 20 40 60 80
0
1
2
3
4
5(c)
Distance (nm)
Fo
rce
(n
N)
0 20 40 60 80
0
1
2
3
4
5(b)
Distance (nm)
Fo
rce
(n
N)
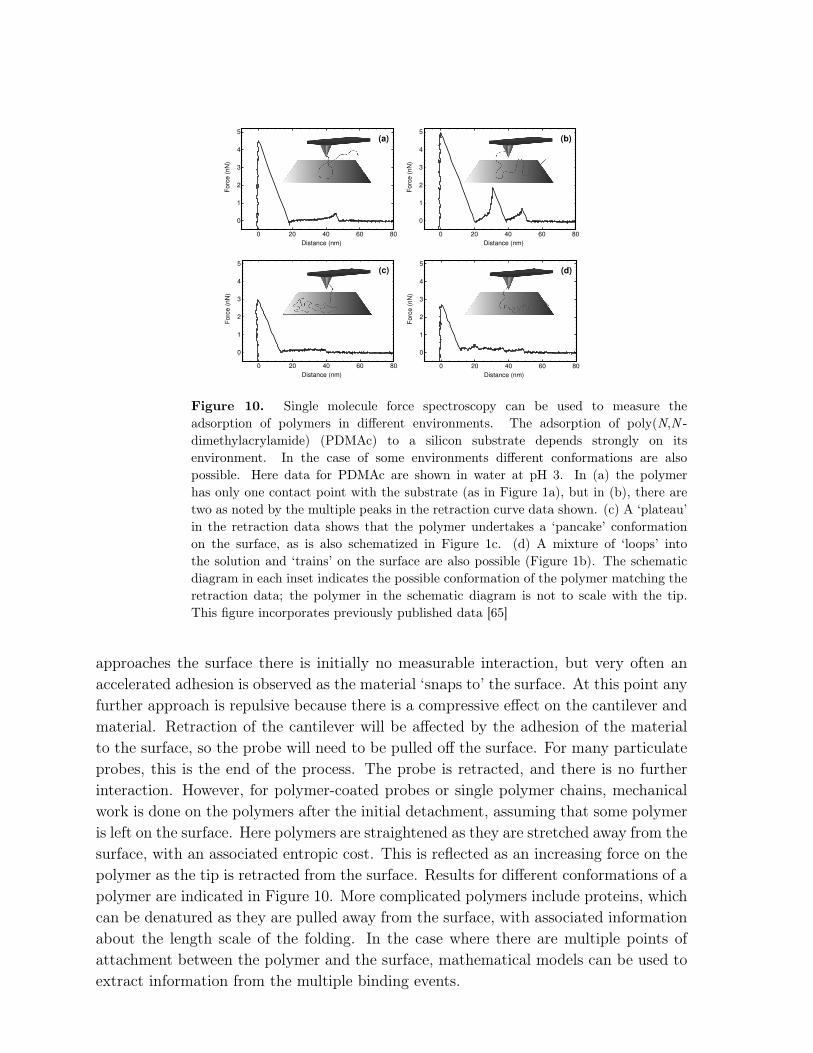
Figure 10. Single molecule force spectroscopy can be used to measure theadsorption of polymers in different environments. The adsorption of poly(N,N -dimethylacrylamide) (PDMAc) to a silicon substrate depends strongly on itsenvironment. In the case of some environments different conformations are alsopossible. Here data for PDMAc are shown in water at pH 3. In (a) the polymerhas only one contact point with the substrate (as in Figure 1a), but in (b), there aretwo as noted by the multiple peaks in the retraction curve data shown. (c) A ‘plateau’in the retraction data shows that the polymer undertakes a ‘pancake’ conformationon the surface, as is also schematized in Figure 1c. (d) A mixture of ‘loops’ intothe solution and ‘trains’ on the surface are also possible (Figure 1b). The schematicdiagram in each inset indicates the possible conformation of the polymer matching theretraction data; the polymer in the schematic diagram is not to scale with the tip.This figure incorporates previously published data [65]
approaches the surface there is initially no measurable interaction, but very often anaccelerated adhesion is observed as the material ‘snaps to’ the surface. At this point anyfurther approach is repulsive because there is a compressive effect on the cantilever andmaterial. Retraction of the cantilever will be affected by the adhesion of the materialto the surface, so the probe will need to be pulled off the surface. For many particulateprobes, this is the end of the process. The probe is retracted, and there is no furtherinteraction. However, for polymer-coated probes or single polymer chains, mechanicalwork is done on the polymers after the initial detachment, assuming that some polymeris left on the surface. Here polymers are straightened as they are stretched away from thesurface, with an associated entropic cost. This is reflected as an increasing force on thepolymer as the tip is retracted from the surface. Results for different conformations of apolymer are indicated in Figure 10. More complicated polymers include proteins, whichcan be denatured as they are pulled away from the surface, with associated informationabout the length scale of the folding. In the case where there are multiple points ofattachment between the polymer and the surface, mathematical models can be used toextract information from the multiple binding events.
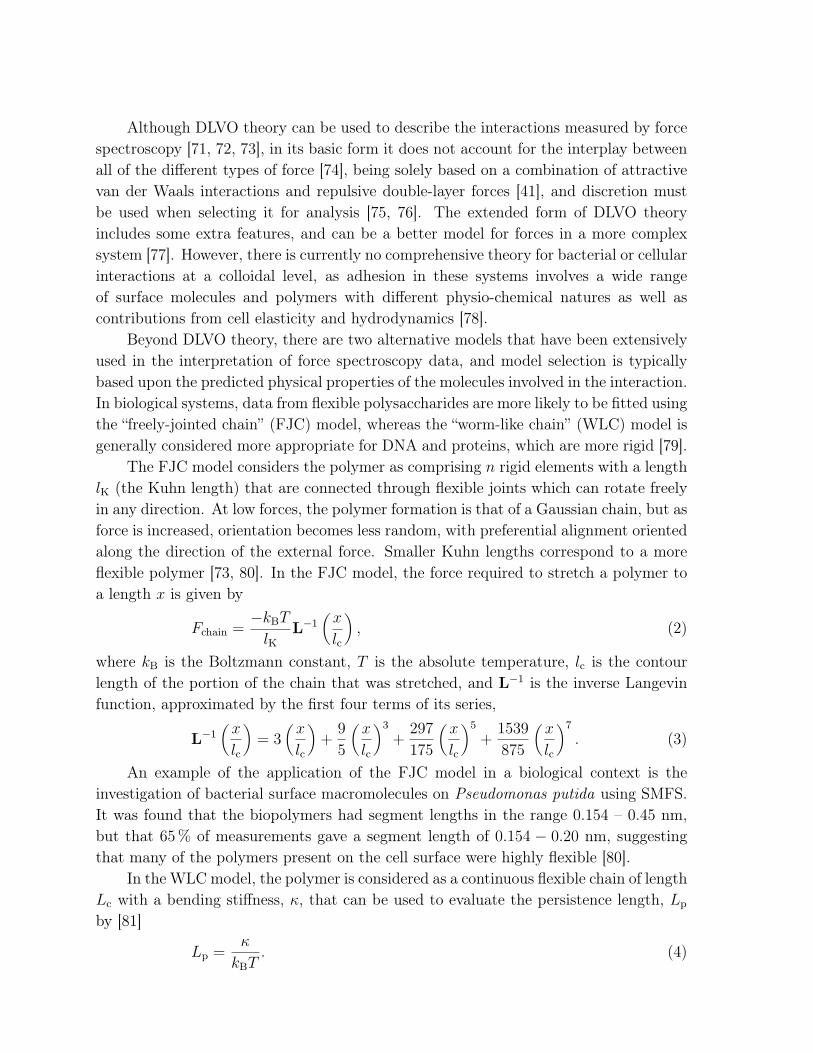
Although DLVO theory can be used to describe the interactions measured by forcespectroscopy [71, 72, 73], in its basic form it does not account for the interplay betweenall of the different types of force [74], being solely based on a combination of attractivevan der Waals interactions and repulsive double-layer forces [41], and discretion mustbe used when selecting it for analysis [75, 76]. The extended form of DLVO theoryincludes some extra features, and can be a better model for forces in a more complexsystem [77]. However, there is currently no comprehensive theory for bacterial or cellularinteractions at a colloidal level, as adhesion in these systems involves a wide rangeof surface molecules and polymers with different physio-chemical natures as well ascontributions from cell elasticity and hydrodynamics [78].
Beyond DLVO theory, there are two alternative models that have been extensivelyused in the interpretation of force spectroscopy data, and model selection is typicallybased upon the predicted physical properties of the molecules involved in the interaction.In biological systems, data from flexible polysaccharides are more likely to be fitted usingthe “freely-jointed chain” (FJC) model, whereas the “worm-like chain” (WLC) model isgenerally considered more appropriate for DNA and proteins, which are more rigid [79].
The FJC model considers the polymer as comprising n rigid elements with a lengthlK (the Kuhn length) that are connected through flexible joints which can rotate freelyin any direction. At low forces, the polymer formation is that of a Gaussian chain, but asforce is increased, orientation becomes less random, with preferential alignment orientedalong the direction of the external force. Smaller Kuhn lengths correspond to a moreflexible polymer [73, 80]. In the FJC model, the force required to stretch a polymer toa length x is given by
Fchain =−kBT
lKL
−1
(
x
lc
)
, (2)
where kB is the Boltzmann constant, T is the absolute temperature, lc is the contourlength of the portion of the chain that was stretched, and L
−1 is the inverse Langevinfunction, approximated by the first four terms of its series,
L−1
(
x
lc
)
= 3(
x
lc
)
+9
5
(
x
lc
)3
+297
175
(
x
lc
)5
+1539
875
(
x
lc
)7
. (3)
An example of the application of the FJC model in a biological context is theinvestigation of bacterial surface macromolecules on Pseudomonas putida using SMFS.It was found that the biopolymers had segment lengths in the range 0.154 – 0.45 nm,but that 65 % of measurements gave a segment length of 0.154 − 0.20 nm, suggestingthat many of the polymers present on the cell surface were highly flexible [80].
In the WLC model, the polymer is considered as a continuous flexible chain of lengthLc with a bending stiffness, κ, that can be used to evaluate the persistence length, Lp
by [81]
Lp =κ
kBT. (4)
There is no analytical solution to the WLC model, but the most commonapproximation is the interpolated WLC [82], given by
F =kBT
Lp
[
1
4
(
1−x
Lc
)
−2
−1
4+
x
Lc
]
, (5)
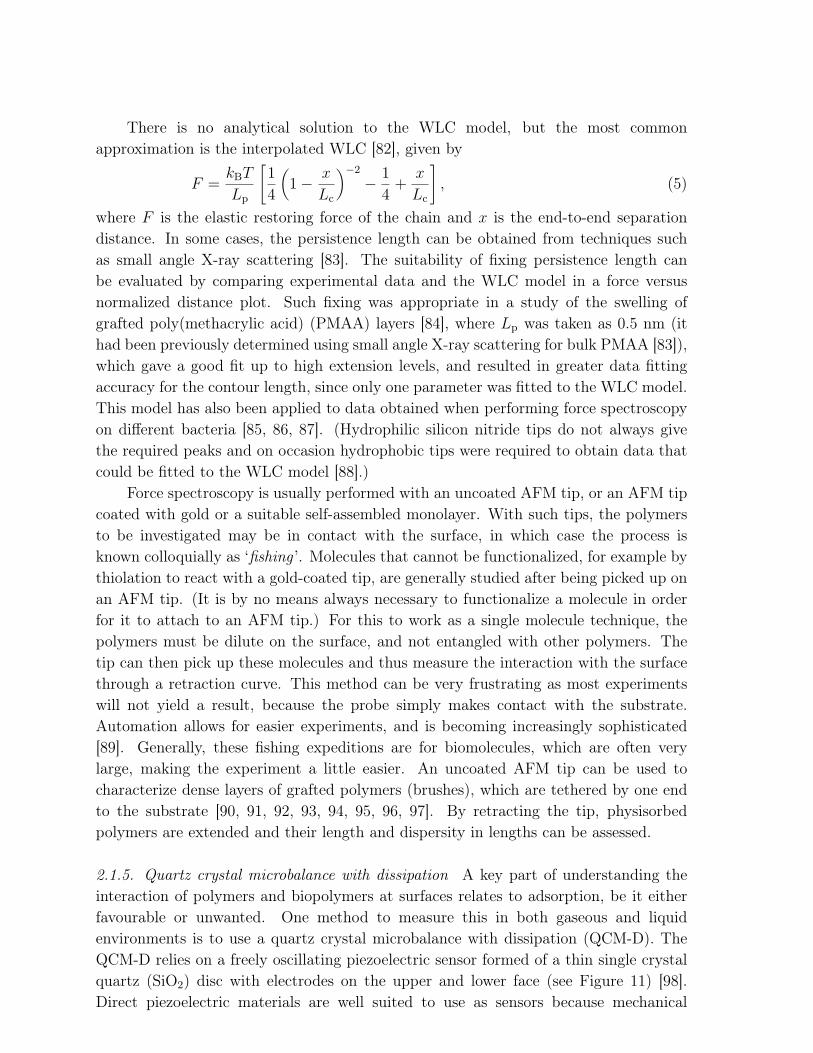
where F is the elastic restoring force of the chain and x is the end-to-end separationdistance. In some cases, the persistence length can be obtained from techniques suchas small angle X-ray scattering [83]. The suitability of fixing persistence length canbe evaluated by comparing experimental data and the WLC model in a force versusnormalized distance plot. Such fixing was appropriate in a study of the swelling ofgrafted poly(methacrylic acid) (PMAA) layers [84], where Lp was taken as 0.5 nm (ithad been previously determined using small angle X-ray scattering for bulk PMAA [83]),which gave a good fit up to high extension levels, and resulted in greater data fittingaccuracy for the contour length, since only one parameter was fitted to the WLC model.This model has also been applied to data obtained when performing force spectroscopyon different bacteria [85, 86, 87]. (Hydrophilic silicon nitride tips do not always givethe required peaks and on occasion hydrophobic tips were required to obtain data thatcould be fitted to the WLC model [88].)
Force spectroscopy is usually performed with an uncoated AFM tip, or an AFM tipcoated with gold or a suitable self-assembled monolayer. With such tips, the polymersto be investigated may be in contact with the surface, in which case the process isknown colloquially as ‘fishing ’. Molecules that cannot be functionalized, for example bythiolation to react with a gold-coated tip, are generally studied after being picked up onan AFM tip. (It is by no means always necessary to functionalize a molecule in orderfor it to attach to an AFM tip.) For this to work as a single molecule technique, thepolymers must be dilute on the surface, and not entangled with other polymers. Thetip can then pick up these molecules and thus measure the interaction with the surfacethrough a retraction curve. This method can be very frustrating as most experimentswill not yield a result, because the probe simply makes contact with the substrate.Automation allows for easier experiments, and is becoming increasingly sophisticated[89]. Generally, these fishing expeditions are for biomolecules, which are often verylarge, making the experiment a little easier. An uncoated AFM tip can be used tocharacterize dense layers of grafted polymers (brushes), which are tethered by one endto the substrate [90, 91, 92, 93, 94, 95, 96, 97]. By retracting the tip, physisorbedpolymers are extended and their length and dispersity in lengths can be assessed.
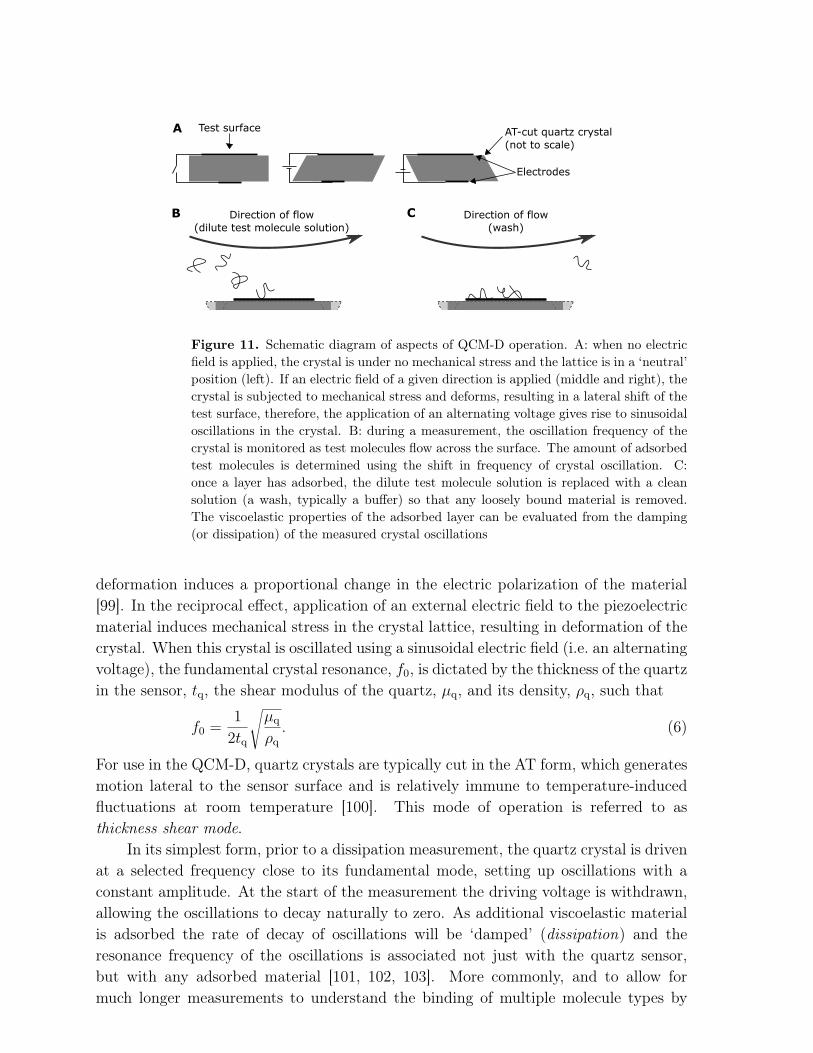
2.1.5. Quartz crystal microbalance with dissipation A key part of understanding theinteraction of polymers and biopolymers at surfaces relates to adsorption, be it eitherfavourable or unwanted. One method to measure this in both gaseous and liquidenvironments is to use a quartz crystal microbalance with dissipation (QCM-D). TheQCM-D relies on a freely oscillating piezoelectric sensor formed of a thin single crystalquartz (SiO2) disc with electrodes on the upper and lower face (see Figure 11) [98].Direct piezoelectric materials are well suited to use as sensors because mechanical
AT-cut quartz crystal
(not to scale)
Electrodes
Test surface
Direction of flow
(dilute test molecule solution)
Direction of flow
(wash)
A
B C
Figure 11. Schematic diagram of aspects of QCM-D operation. A: when no electricfield is applied, the crystal is under no mechanical stress and the lattice is in a ‘neutral’position (left). If an electric field of a given direction is applied (middle and right), thecrystal is subjected to mechanical stress and deforms, resulting in a lateral shift of thetest surface, therefore, the application of an alternating voltage gives rise to sinusoidaloscillations in the crystal. B: during a measurement, the oscillation frequency of thecrystal is monitored as test molecules flow across the surface. The amount of adsorbedtest molecules is determined using the shift in frequency of crystal oscillation. C:once a layer has adsorbed, the dilute test molecule solution is replaced with a cleansolution (a wash, typically a buffer) so that any loosely bound material is removed.The viscoelastic properties of the adsorbed layer can be evaluated from the damping(or dissipation) of the measured crystal oscillations
deformation induces a proportional change in the electric polarization of the material[99]. In the reciprocal effect, application of an external electric field to the piezoelectricmaterial induces mechanical stress in the crystal lattice, resulting in deformation of thecrystal. When this crystal is oscillated using a sinusoidal electric field (i.e. an alternatingvoltage), the fundamental crystal resonance, f0, is dictated by the thickness of the quartzin the sensor, tq, the shear modulus of the quartz, µq, and its density, ρq, such that
f0 =1
2tq
√
µq
ρq. (6)
For use in the QCM-D, quartz crystals are typically cut in the AT form, which generatesmotion lateral to the sensor surface and is relatively immune to temperature-inducedfluctuations at room temperature [100]. This mode of operation is referred to asthickness shear mode.
In its simplest form, prior to a dissipation measurement, the quartz crystal is drivenat a selected frequency close to its fundamental mode, setting up oscillations with aconstant amplitude. At the start of the measurement the driving voltage is withdrawn,allowing the oscillations to decay naturally to zero. As additional viscoelastic materialis adsorbed the rate of decay of oscillations will be ‘damped’ (dissipation) and theresonance frequency of the oscillations is associated not just with the quartz sensor,but with any adsorbed material [101, 102, 103]. More commonly, and to allow formuch longer measurements to understand the binding of multiple molecule types by
sequentially flowing them across the sensor (generally interspersed with flow of awash buffer to remove any non-adherent molecules in between tests, see Figure 11),a continuous resonance mode can be used, where the driving electric field is maintainedthroughout and relative shifts in the crystal frequency (∆f) are measured [100]. TheQCM-D can therefore be used to track adsorption of molecules and biomolecules to thesensor surface [104]. In addition to monitoring the amount of adsorbed material, itcan also provide information about the viscoelasticity of the adsorbed molecules, and istherefore useful for testing for adsorption barriers [105].
The mass of adsorbed material can be evaluated using the Sauerbrey model, whichneglects viscoelastic effects, and assumes a rigid adsorbed layer. According to theSauerbrey equation [106], the frequency change ∆f in the piezoelectric crystal due tothe adsorbed mass ∆m is given by
∆f = −f3/20
√
ηlρlπρqµq
, (7)
where ρl and ηl are the density and viscosity of the fluid, respectively. The adsorbedmass is determined from the changes in viscosity. Masses given include that of anywater that is bound or coupled to the surface. This model is appropriate if changes inenergy dissipation are small and the adsorbed layer is relatively rigid. The use of anunmodified Sauerbrey equation for soft or viscoelastic films can lead to an underestimateof adsorbed mass [102].
Dissipation data may also be obtained to allow analysis of viscoelastic effects; ifthe material is tightly-bound and rigid, then minimal dissipation modification would beexpected, so the greater the dissipation change for a unit change in gained mass, the moreviscoelastic the adsorbed material is [107]. This increase in dissipation can be caused bytwo things: a more viscoelastic molecule or a poorly attached layer causing dissipationdue to friction associated with moving out of synchronization with the resonating crystal.If there is doubt, the origin of the dissipation can be established from thickness dataobtained by methods such as ellipsometry; if the change is related to molecule properties,the layer should be thicker, whereas if it is due to loosely bound material there should bea thinner layer. One might argue that ellipsometry is as versatile a method, but QCM-D offers much higher sensitivity and has been shown to detect single molecule bindingevents, which is beyond the capability of any ellipsometer. However, the benefits ofcombining QCM-D with other surface analysis techniques within a single system (suchas ellipsometry [105] or localized surface plasmon resonance [108]) is not without merit,as this enables additional information to be obtained simultaneously through the samesample and measurement platform.
2.2. Depth profiling and buried interfaces
Techniques that allow us to understand the variation of a particular quantity as afunction of distance from an interface are known as depth-profiling experiments. Theability to provide information away from the exposed surface of a film is very important,
and particularly so in the case of buried interfaces. Experiments in aqueous solutionare important for biological samples; these are often not of interest in a dry state.To image buried interfaces is not easy. If the interfaces are in a low viscosity liquidenvironment then scanning probe techniques can be used, assuming the liquid will notdamage the apparatus, but other techniques described above such as SIMS and XPSare inappropriate due to their vacuum requirements. For these reasons most buriedinterfaces can only be effectively studied in one dimension by depth profiling.
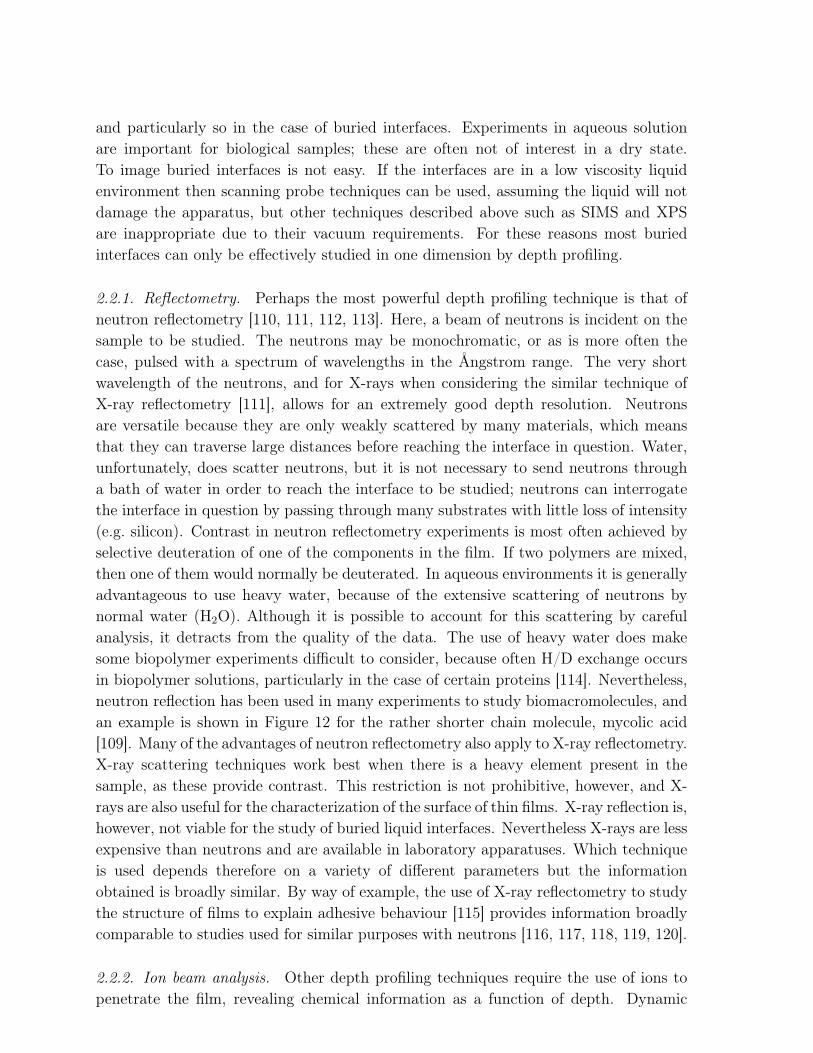
2.2.1. Reflectometry. Perhaps the most powerful depth profiling technique is that ofneutron reflectometry [110, 111, 112, 113]. Here, a beam of neutrons is incident on thesample to be studied. The neutrons may be monochromatic, or as is more often thecase, pulsed with a spectrum of wavelengths in the Ångstrom range. The very shortwavelength of the neutrons, and for X-rays when considering the similar technique ofX-ray reflectometry [111], allows for an extremely good depth resolution. Neutronsare versatile because they are only weakly scattered by many materials, which meansthat they can traverse large distances before reaching the interface in question. Water,unfortunately, does scatter neutrons, but it is not necessary to send neutrons througha bath of water in order to reach the interface to be studied; neutrons can interrogatethe interface in question by passing through many substrates with little loss of intensity(e.g. silicon). Contrast in neutron reflectometry experiments is most often achieved byselective deuteration of one of the components in the film. If two polymers are mixed,then one of them would normally be deuterated. In aqueous environments it is generallyadvantageous to use heavy water, because of the extensive scattering of neutrons bynormal water (H2O). Although it is possible to account for this scattering by carefulanalysis, it detracts from the quality of the data. The use of heavy water does makesome biopolymer experiments difficult to consider, because often H/D exchange occursin biopolymer solutions, particularly in the case of certain proteins [114]. Nevertheless,neutron reflection has been used in many experiments to study biomacromolecules, andan example is shown in Figure 12 for the rather shorter chain molecule, mycolic acid[109]. Many of the advantages of neutron reflectometry also apply to X-ray reflectometry.X-ray scattering techniques work best when there is a heavy element present in thesample, as these provide contrast. This restriction is not prohibitive, however, and X-rays are also useful for the characterization of the surface of thin films. X-ray reflection is,however, not viable for the study of buried liquid interfaces. Nevertheless X-rays are lessexpensive than neutrons and are available in laboratory apparatuses. Which techniqueis used depends therefore on a variety of different parameters but the informationobtained is broadly similar. By way of example, the use of X-ray reflectometry to studythe structure of films to explain adhesive behaviour [115] provides information broadlycomparable to studies used for similar purposes with neutrons [116, 117, 118, 119, 120].
2.2.2. Ion beam analysis. Other depth profiling techniques require the use of ions topenetrate the film, revealing chemical information as a function of depth. Dynamic
0.00 0.05 0.10 0.15–6
–4
–2
0
pD 3.0pD 7.0pD 10.0
Momentum transfer, Q (Å−1)
Ref
lect
ivity
, log
10(R
)
0 20 40 60
0
2
4
6
pD 3.0pD 7.0pD 10.0
SLD
(10
−6 Å
−2)
Depth (nm)
(a)
0 10 20 30 40 500.0
0.2
0.4
0.6
0.8
1.0
pD 3.0pD 7.0pD 10.0
Depth, z (nm)
MA
vol
ume
frac
tion,
φ
(b)
Figure 12. Mycolic acid is a biosurfactant associated with mycobacteria. Here,neutron reflectometry data are shown for an aqueous solution mycolic acid from thehuman tuberculosis bacterium with the carboxylic acid group exposed. The neutronreflectometry data are shown in (a), and in the inset, the scattering length densityprofile is displayed. This scattering length density profile is from a silicon substrate(z = 0), and attains a rather large value of 6.48 Å−2 at large depths; this scatteringlength density corresponds to heavy water. There is a clear extension of the acid atpD 10, but not much change between pD 3.0 and 7.0. (Note the use of pD, ratherthan pH.) The volume fraction profile of the mycolic acid is extracted and shown in(b). The inset in (b) shows the chemical structure of α-mycolic acid, which is one ofa mixture of mycolic acids contained with the sample studied here. Reprinted fromZhang et al. [109]. Copyright (2010), with permission from Elsevier
SIMS, for example, involves the ion beam etching the sample [121, 122]. By knowingthe etching rate, the chemical information yielded can be correlated with the depth.Dynamic SIMS is less often used, partly because of the difficulties in interpreting datawhen different components in the film have different etching rates. Contrast, such asH/D differentiation, although not always necessary, can help data interpretation.
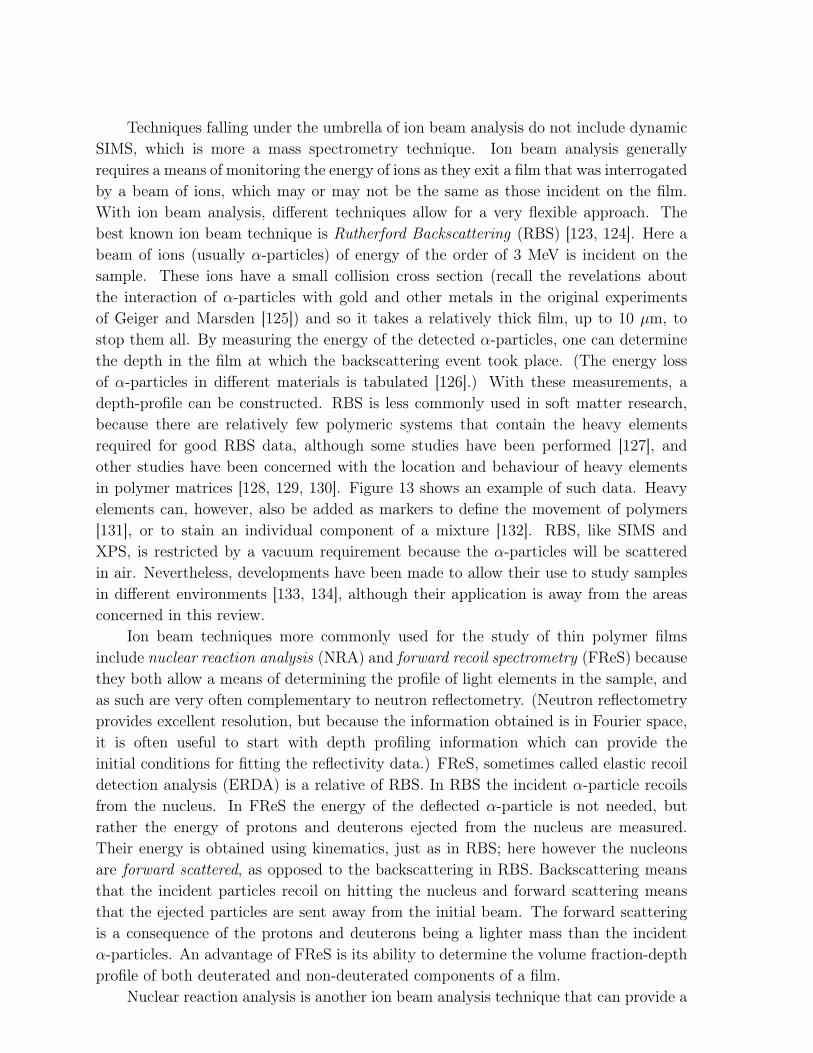
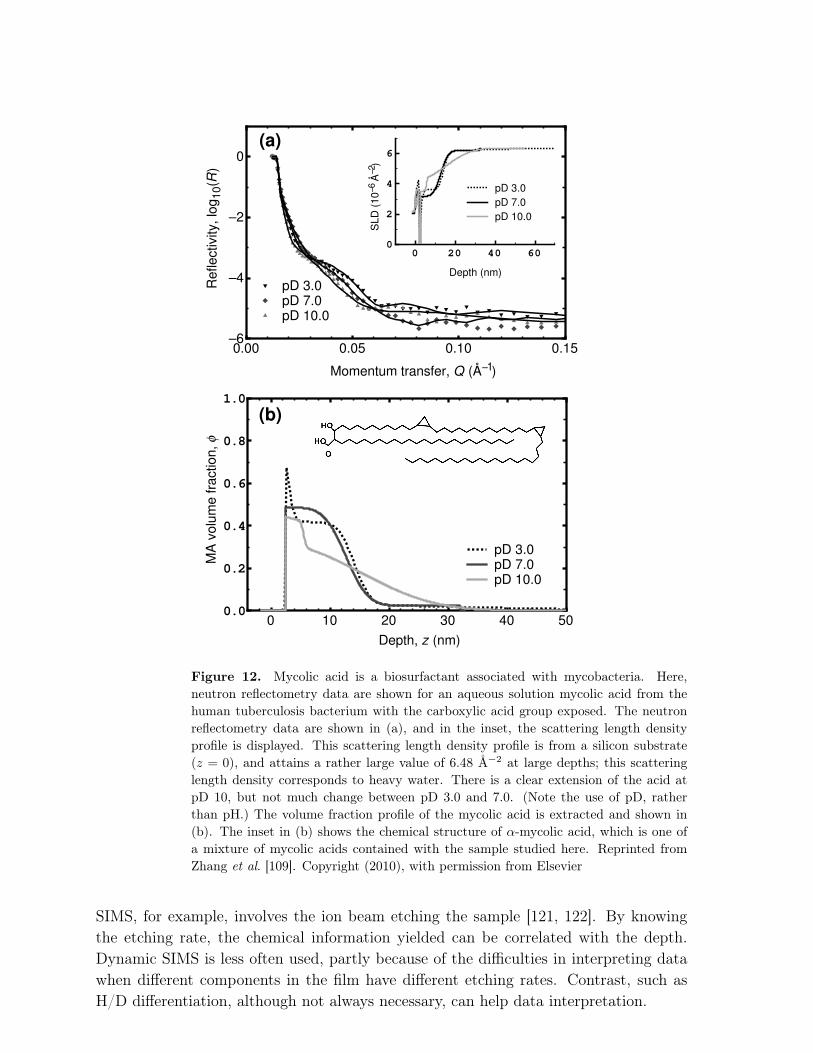
Techniques falling under the umbrella of ion beam analysis do not include dynamicSIMS, which is more a mass spectrometry technique. Ion beam analysis generallyrequires a means of monitoring the energy of ions as they exit a film that was interrogatedby a beam of ions, which may or may not be the same as those incident on the film.With ion beam analysis, different techniques allow for a very flexible approach. Thebest known ion beam technique is Rutherford Backscattering (RBS) [123, 124]. Here abeam of ions (usually α-particles) of energy of the order of 3 MeV is incident on thesample. These ions have a small collision cross section (recall the revelations aboutthe interaction of α-particles with gold and other metals in the original experimentsof Geiger and Marsden [125]) and so it takes a relatively thick film, up to 10 µm, tostop them all. By measuring the energy of the detected α-particles, one can determinethe depth in the film at which the backscattering event took place. (The energy lossof α-particles in different materials is tabulated [126].) With these measurements, adepth-profile can be constructed. RBS is less commonly used in soft matter research,because there are relatively few polymeric systems that contain the heavy elementsrequired for good RBS data, although some studies have been performed [127], andother studies have been concerned with the location and behaviour of heavy elementsin polymer matrices [128, 129, 130]. Figure 13 shows an example of such data. Heavyelements can, however, also be added as markers to define the movement of polymers[131], or to stain an individual component of a mixture [132]. RBS, like SIMS andXPS, is restricted by a vacuum requirement because the α-particles will be scatteredin air. Nevertheless, developments have been made to allow their use to study samplesin different environments [133, 134], although their application is away from the areasconcerned in this review.
Ion beam techniques more commonly used for the study of thin polymer filmsinclude nuclear reaction analysis (NRA) and forward recoil spectrometry (FReS) becausethey both allow a means of determining the profile of light elements in the sample, andas such are very often complementary to neutron reflectometry. (Neutron reflectometryprovides excellent resolution, but because the information obtained is in Fourier space,it is often useful to start with depth profiling information which can provide theinitial conditions for fitting the reflectivity data.) FReS, sometimes called elastic recoildetection analysis (ERDA) is a relative of RBS. In RBS the incident α-particle recoilsfrom the nucleus. In FReS the energy of the deflected α-particle is not needed, butrather the energy of protons and deuterons ejected from the nucleus are measured.Their energy is obtained using kinematics, just as in RBS; here however the nucleonsare forward scattered, as opposed to the backscattering in RBS. Backscattering meansthat the incident particles recoil on hitting the nucleus and forward scattering meansthat the ejected particles are sent away from the initial beam. The forward scatteringis a consequence of the protons and deuterons being a lighter mass than the incidentα-particles. An advantage of FReS is its ability to determine the volume fraction-depthprofile of both deuterated and non-deuterated components of a film.
Nuclear reaction analysis is another ion beam analysis technique that can provide a
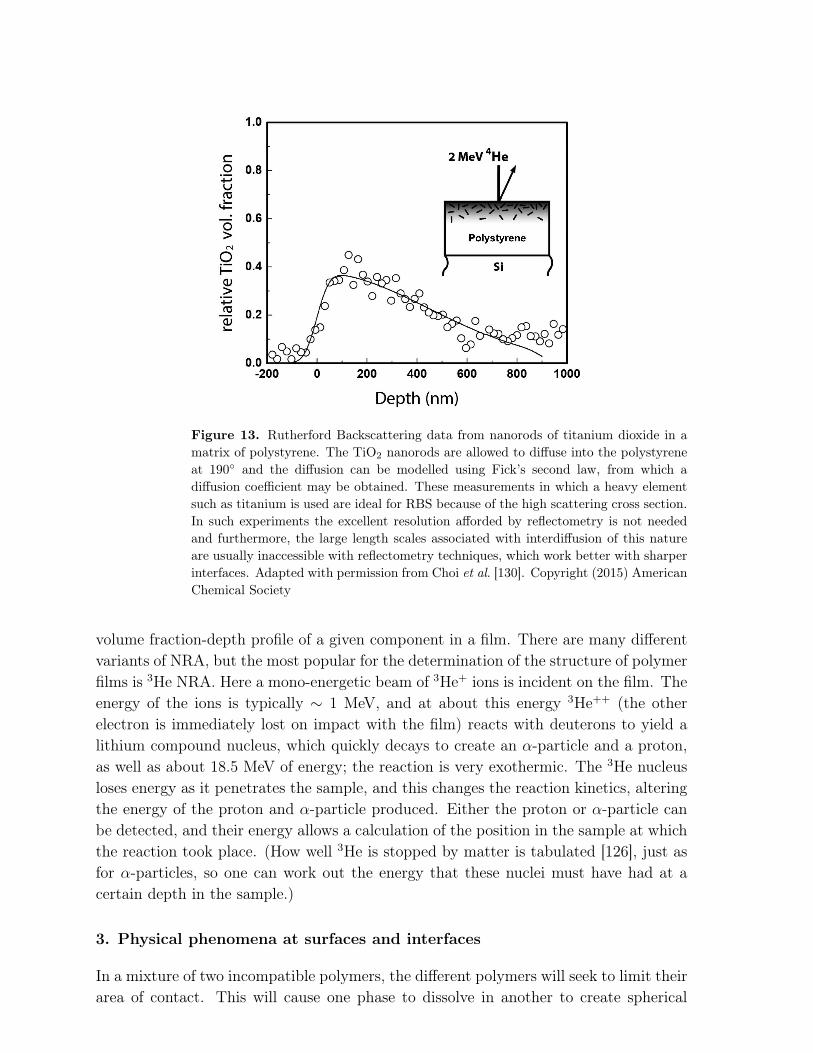
Figure 13. Rutherford Backscattering data from nanorods of titanium dioxide in amatrix of polystyrene. The TiO2 nanorods are allowed to diffuse into the polystyreneat 190◦ and the diffusion can be modelled using Fick’s second law, from which adiffusion coefficient may be obtained. These measurements in which a heavy elementsuch as titanium is used are ideal for RBS because of the high scattering cross section.In such experiments the excellent resolution afforded by reflectometry is not neededand furthermore, the large length scales associated with interdiffusion of this natureare usually inaccessible with reflectometry techniques, which work better with sharperinterfaces. Adapted with permission from Choi et al. [130]. Copyright (2015) AmericanChemical Society
volume fraction-depth profile of a given component in a film. There are many differentvariants of NRA, but the most popular for the determination of the structure of polymerfilms is 3He NRA. Here a mono-energetic beam of 3He+ ions is incident on the film. Theenergy of the ions is typically ∼ 1 MeV, and at about this energy 3He++ (the otherelectron is immediately lost on impact with the film) reacts with deuterons to yield alithium compound nucleus, which quickly decays to create an α-particle and a proton,as well as about 18.5 MeV of energy; the reaction is very exothermic. The 3He nucleusloses energy as it penetrates the sample, and this changes the reaction kinetics, alteringthe energy of the proton and α-particle produced. Either the proton or α-particle canbe detected, and their energy allows a calculation of the position in the sample at whichthe reaction took place. (How well 3He is stopped by matter is tabulated [126], just asfor α-particles, so one can work out the energy that these nuclei must have had at acertain depth in the sample.)
3. Physical phenomena at surfaces and interfaces
In a mixture of two incompatible polymers, the different polymers will seek to limit theirarea of contact. This will cause one phase to dissolve in another to create spherical
domains. These domains seek to merge with other, similar, domains to form biggerspheres, reducing their surface to volume ratio. However, even circular structures arenot necessarily stable, because of the difference in pressure across a surface (the Laplacepressure) and the disjoining pressure caused by having different material phases incontact.
The interface between two polymer components tells us about the competitionbetween entropy and enthalpy, and thus allows us to dissect the interfacial energeticsof a particular set of materials. The structure of a blend or mixture of polymers ata free or fixed interface also will be different to that in the middle of the film. Theseinteractions can lead to stratified or segregated structures, where polymers wet thesurface. Sometimes the film will simply dewet its surface. Finally, polymer films can becontrolled by chemically attaching them to the surface. These are known as polymerbrushes, and have many applications in terms of controlling film stability, adhesion,colloidal stabilization, cell culture, and even in all-polymer electronic devices.
The structure and morphology of polymer blend films has been intensively studiedover the past 25 years, and developments have been made with specific applicationsin mind, such as the use of blends in optoelectronic devices. From a more generalperspective the study of the formation of films during drying is an area of research whereexperimental developments have allowed quantitative studies to take place. Althoughthese subjects will be covered here; films of one homopolymer have been used as a vehiclefor fundamental studies of basic phenomena, such as crystallization, and this will alsobe addressed. Finally, the use of films as actuators will be presented, highlighting therole of brushes in this new area of research.
Perhaps the area of polymer thin film research that has received the most attentionis dewetting and related phenomena. The stability of films and coatings is important inmany areas of technology, and so we consider developments in this area first.
3.1. Wetting and dewetting
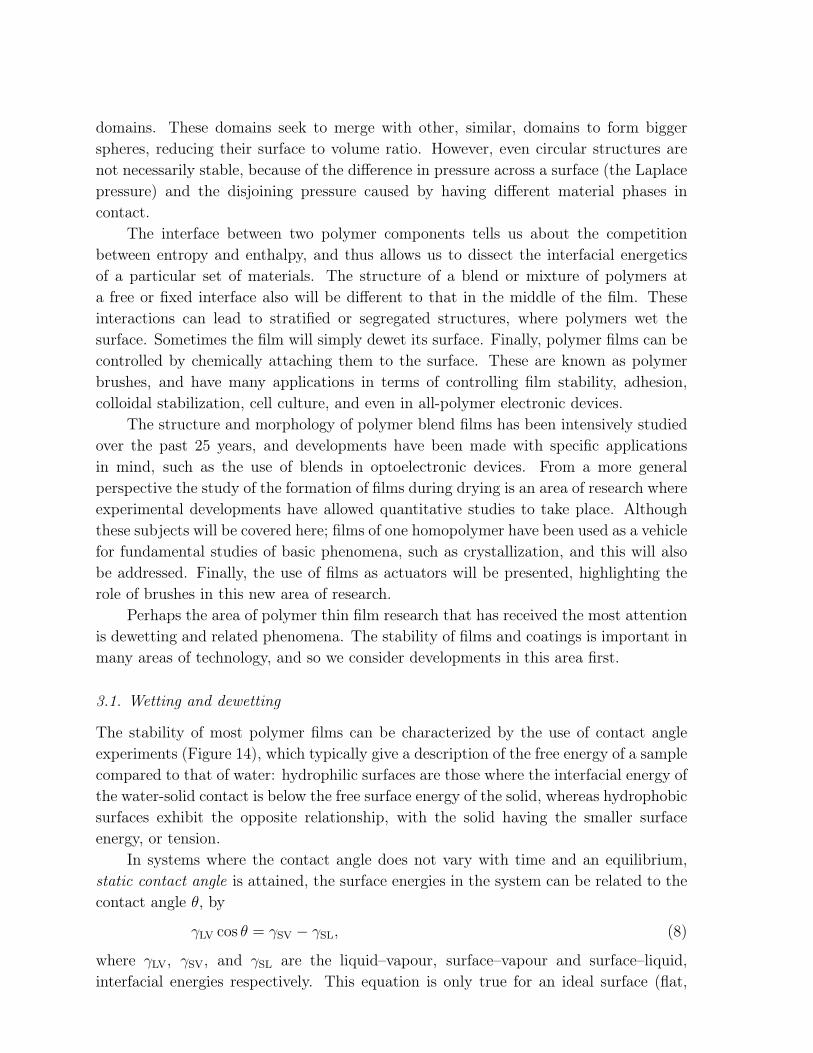
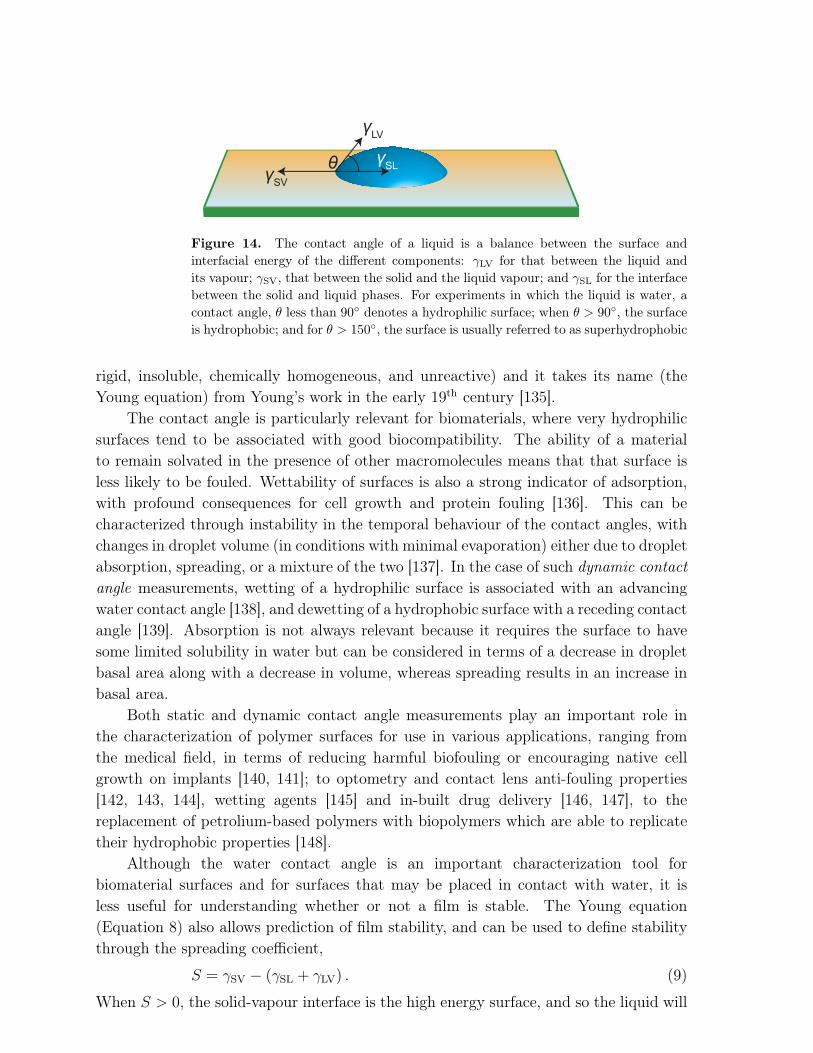
The stability of most polymer films can be characterized by the use of contact angleexperiments (Figure 14), which typically give a description of the free energy of a samplecompared to that of water: hydrophilic surfaces are those where the interfacial energy ofthe water-solid contact is below the free surface energy of the solid, whereas hydrophobicsurfaces exhibit the opposite relationship, with the solid having the smaller surfaceenergy, or tension.
In systems where the contact angle does not vary with time and an equilibrium,static contact angle is attained, the surface energies in the system can be related to thecontact angle θ, by
γLV cos θ = γSV − γSL, (8)
where γLV, γSV, and γSL are the liquid–vapour, surface–vapour and surface–liquid,interfacial energies respectively. This equation is only true for an ideal surface (flat,
θ
γLV
γSL
γSV
Figure 14. The contact angle of a liquid is a balance between the surface andinterfacial energy of the different components: γLV for that between the liquid andits vapour; γSV, that between the solid and the liquid vapour; and γSL for the interfacebetween the solid and liquid phases. For experiments in which the liquid is water, acontact angle, θ less than 90◦ denotes a hydrophilic surface; when θ > 90
◦, the surfaceis hydrophobic; and for θ > 150
◦, the surface is usually referred to as superhydrophobic
rigid, insoluble, chemically homogeneous, and unreactive) and it takes its name (theYoung equation) from Young’s work in the early 19th century [135].
The contact angle is particularly relevant for biomaterials, where very hydrophilicsurfaces tend to be associated with good biocompatibility. The ability of a materialto remain solvated in the presence of other macromolecules means that that surface isless likely to be fouled. Wettability of surfaces is also a strong indicator of adsorption,with profound consequences for cell growth and protein fouling [136]. This can becharacterized through instability in the temporal behaviour of the contact angles, withchanges in droplet volume (in conditions with minimal evaporation) either due to dropletabsorption, spreading, or a mixture of the two [137]. In the case of such dynamic contact
angle measurements, wetting of a hydrophilic surface is associated with an advancingwater contact angle [138], and dewetting of a hydrophobic surface with a receding contactangle [139]. Absorption is not always relevant because it requires the surface to havesome limited solubility in water but can be considered in terms of a decrease in dropletbasal area along with a decrease in volume, whereas spreading results in an increase inbasal area.
Both static and dynamic contact angle measurements play an important role inthe characterization of polymer surfaces for use in various applications, ranging fromthe medical field, in terms of reducing harmful biofouling or encouraging native cellgrowth on implants [140, 141]; to optometry and contact lens anti-fouling properties[142, 143, 144], wetting agents [145] and in-built drug delivery [146, 147], to thereplacement of petrolium-based polymers with biopolymers which are able to replicatetheir hydrophobic properties [148].
Although the water contact angle is an important characterization tool forbiomaterial surfaces and for surfaces that may be placed in contact with water, it isless useful for understanding whether or not a film is stable. The Young equation(Equation 8) also allows prediction of film stability, and can be used to define stabilitythrough the spreading coefficient,
S = γSV − (γSL + γLV) . (9)
When S > 0, the solid-vapour interface is the high energy surface, and so the liquid will
preferentially coat that surface; i.e. the film will wet the surface. Similarly, when S < 0,the film will be unstable on the surface and will want to dewet the substrate.
The stability of thin polymer films depends predominantly on long-rangeinteractions between the film and its environment, and these generally take the form[41]
Wj (x) = −Aijk
12πx2, (10)
where Wj represents the interaction energy of two parallel and planar semi-infinite media(i and k) separated a distance x by a medium j. The parameter Aijk is known as theHamaker constant and depends on all three materials, although approximations can bemade to calculate Aijk from Hamaker constants of the component materials, Aii wherethe two (identical) components are separated by vacuum. A more detailed (Lifshitz)treatment relies on the dielectric properties of the different layers [41].
10 100
10
100
PMMA thickness (nm)
Po
lysty
ren
e t
hic
kn
ess (
nm
)
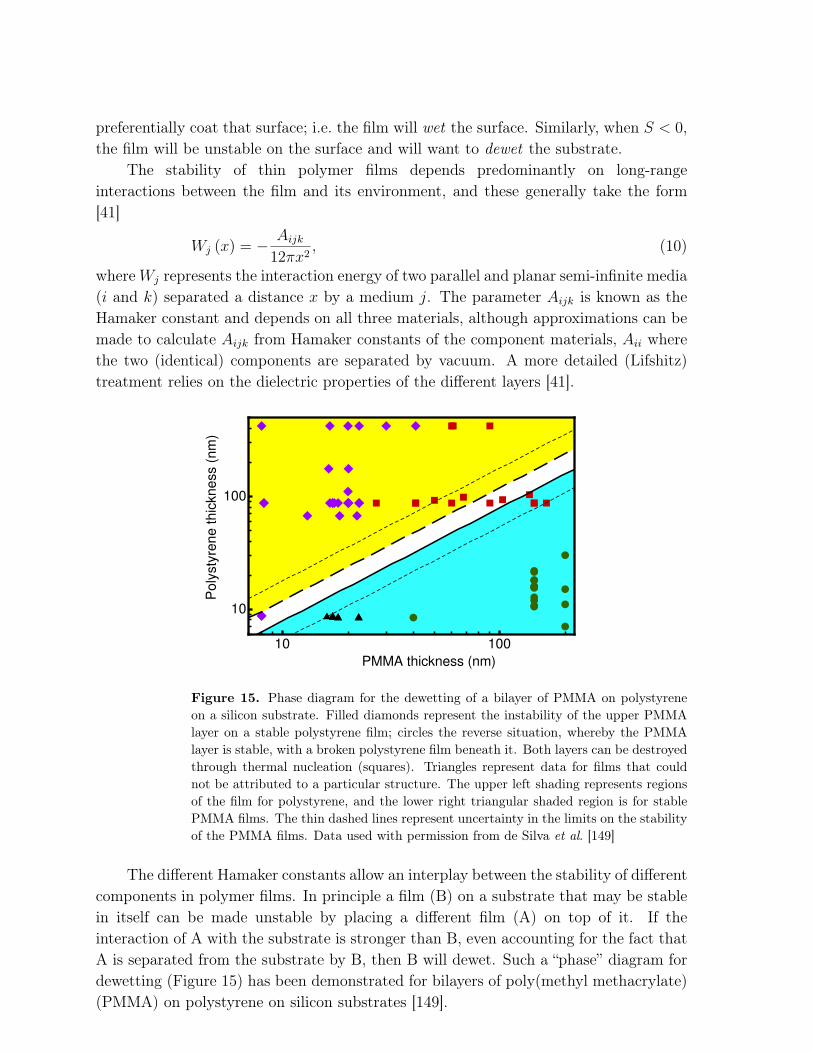
Figure 15. Phase diagram for the dewetting of a bilayer of PMMA on polystyreneon a silicon substrate. Filled diamonds represent the instability of the upper PMMAlayer on a stable polystyrene film; circles the reverse situation, whereby the PMMAlayer is stable, with a broken polystyrene film beneath it. Both layers can be destroyedthrough thermal nucleation (squares). Triangles represent data for films that couldnot be attributed to a particular structure. The upper left shading represents regionsof the film for polystyrene, and the lower right triangular shaded region is for stablePMMA films. The thin dashed lines represent uncertainty in the limits on the stabilityof the PMMA films. Data used with permission from de Silva et al. [149]
The different Hamaker constants allow an interplay between the stability of differentcomponents in polymer films. In principle a film (B) on a substrate that may be stablein itself can be made unstable by placing a different film (A) on top of it. If theinteraction of A with the substrate is stronger than B, even accounting for the fact thatA is separated from the substrate by B, then B will dewet. Such a “phase” diagram fordewetting (Figure 15) has been demonstrated for bilayers of poly(methyl methacrylate)(PMMA) on polystyrene on silicon substrates [149].
Whilst varying the thickness of the layers allows the interaction between the filmsto be tailored to control stability, a film may create its own interface potential thatcan strongly affect film stability. Diblock copolymers with each block containing similarchain sizes will order to form a stacked (lamellar) structure, with the block that lowersthe interfacial energy segregating to the substrate and the block that lowers the surfaceenergy segregating to the surface. These blocks may be the same, or different blocksmay segregate to the different interfaces. A lamellar structure will only form if the ratioof the chain lengths in each block is close to unity and the blocks are immiscible. Asurface will perturb the structure, and even if the two blocks are miscible, they will orderclose to the surface, with the amount of order decaying with distance from the substrate.This creates an oscillating interface potential the minima and maxima of which becomeless pronounced with distance from the substrate, which permits a situation wherethe melt above a residual layer ordered at the substrate may dewet [150]. Here thedewetting of a diblock copolymer containing immiscible blocks (poly(2-vinylpyridine)and polystyrene) occurs to allow a disordered state to exist close to the substrate whilstretaining a lamellar structure at the air interface, and can proceed when the energydriving ordering is weak. However, the differing diblock copolymer film thicknessesat which this dewetting may occur result in discrete contact angles, even though thecomposition of the film is the same.
Other recent challenges in dewetting concern the effect of the preparation of thinfilms on their subsequent behaviour. The microscale morphology of films, and theconformation of polymers within the structures produced by common techniques suchas spin coating, are not expected to be at equilibrium. Indeed, there are no methodscurrently available that routinely produce films at equilibrium. Part of the reason forthe resultant out-of-equilibrium structures is the rapid quench in many drying processes,but also there will be a contribution due to the presence of solvent within the polymerfilm after casting. Later evaporation of the solvent leads to residual stresses within thefilm, which in many cases is already glassy. There is a clear effect on the distribution ofholes in such films, as has been determined by simple optical microscopy experiments[151], where it was observed that the longer the films have to relax, the fewer the numberof holes that appeared in the dewetted film (Figure 16).
Relaxation effects are categorized in terms of a response to “residual stresses” inpolymer films. The nature of these residual stresses is open to some debate, and theyare likely to be dependent on the method of film preparation. Nevertheless, there areother generic factors that may play a significant role across different preparation routes,albeit to different degrees. One of these is the role of entanglements. In confined films,entanglements are expected to remain in films at equilibrium [152], but it is accepted thatthis is unlikely to be observed in experiments and that polymers may have perturbedconformations [1, 153, 154, 155, 156]. Although a molar mass dependence of polystyrenefilm stability was observed on topographically structured surfaces [153] or surfaces witha gradient in surface energy [157], these experiments did not perturb stresses withinthe films. Other experiments have shown that long (polystyrene) chains were capable
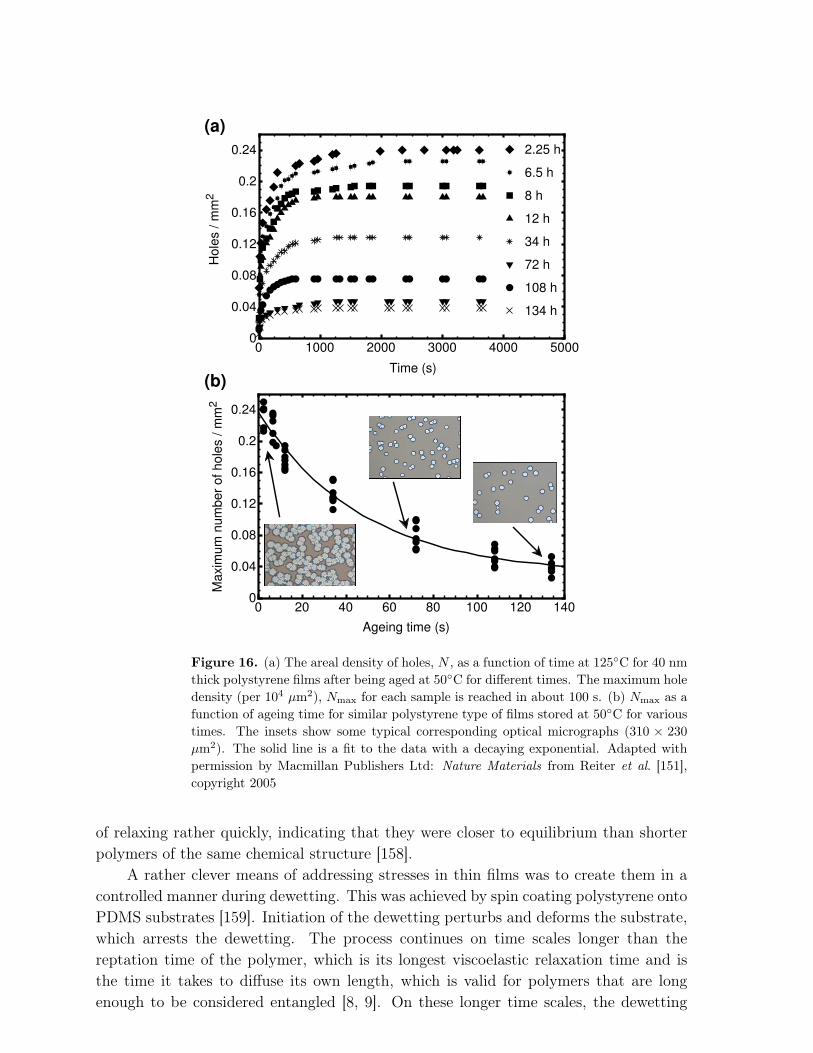
0 20 40 60 80 100 120 1400
0.04
0.08
0.12
0.16
0.2
0.24
Ageing time (s)
Ma
xim
um
nu
mb
er
of
ho
les /
mm
2
0 1000 2000 3000 4000 50000
0.04
0.08
0.12
0.16
0.2
0.24
Time (s)
Ho
les /
mm
2
2.25 h
6.5 h
8 h
12 h
34 h
72 h
108 h
134 h
(a)
(b)
Figure 16. (a) The areal density of holes, N , as a function of time at 125◦C for 40 nmthick polystyrene films after being aged at 50◦C for different times. The maximum holedensity (per 10
4 µm2), Nmax for each sample is reached in about 100 s. (b) Nmax as afunction of ageing time for similar polystyrene type of films stored at 50◦C for varioustimes. The insets show some typical corresponding optical micrographs (310 × 230
µm2). The solid line is a fit to the data with a decaying exponential. Adapted withpermission by Macmillan Publishers Ltd: Nature Materials from Reiter et al. [151],copyright 2005
of relaxing rather quickly, indicating that they were closer to equilibrium than shorterpolymers of the same chemical structure [158].
A rather clever means of addressing stresses in thin films was to create them in acontrolled manner during dewetting. This was achieved by spin coating polystyrene ontoPDMS substrates [159]. Initiation of the dewetting perturbs and deforms the substrate,which arrests the dewetting. The process continues on time scales longer than thereptation time of the polymer, which is its longest viscoelastic relaxation time and isthe time it takes to diffuse its own length, which is valid for polymers that are longenough to be considered entangled [8, 9]. On these longer time scales, the dewetting
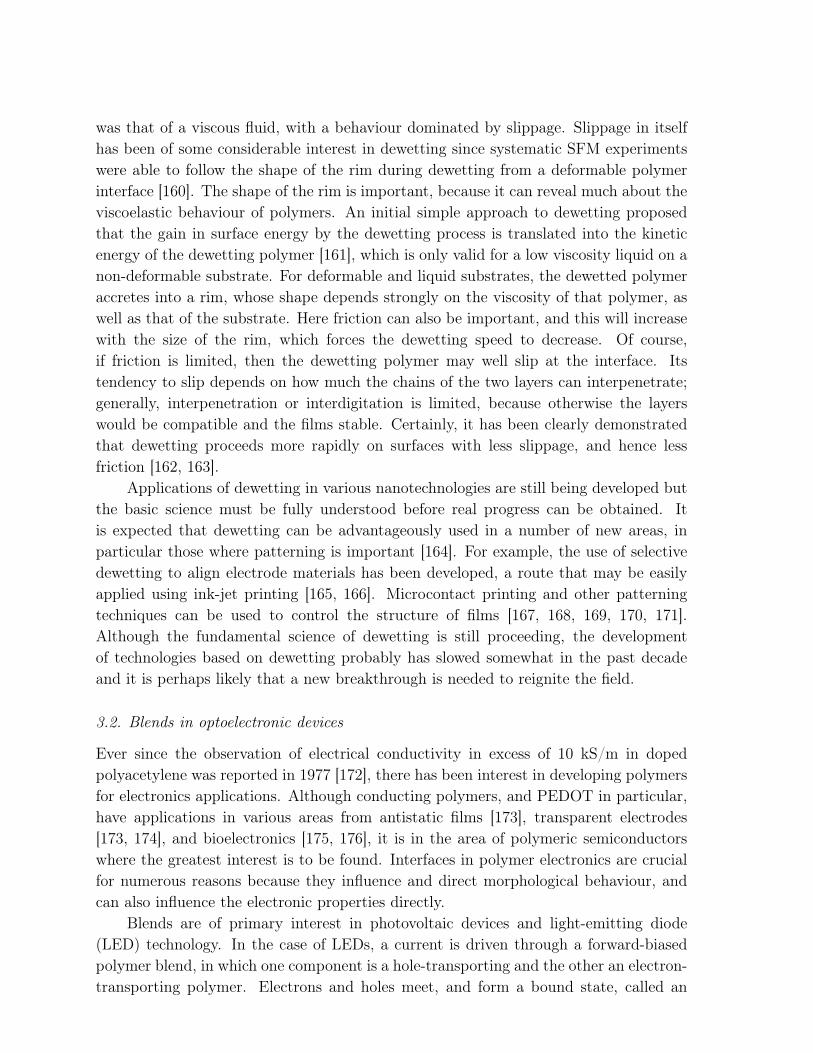
was that of a viscous fluid, with a behaviour dominated by slippage. Slippage in itselfhas been of some considerable interest in dewetting since systematic SFM experimentswere able to follow the shape of the rim during dewetting from a deformable polymerinterface [160]. The shape of the rim is important, because it can reveal much about theviscoelastic behaviour of polymers. An initial simple approach to dewetting proposedthat the gain in surface energy by the dewetting process is translated into the kineticenergy of the dewetting polymer [161], which is only valid for a low viscosity liquid on anon-deformable substrate. For deformable and liquid substrates, the dewetted polymeraccretes into a rim, whose shape depends strongly on the viscosity of that polymer, aswell as that of the substrate. Here friction can also be important, and this will increasewith the size of the rim, which forces the dewetting speed to decrease. Of course,if friction is limited, then the dewetting polymer may well slip at the interface. Itstendency to slip depends on how much the chains of the two layers can interpenetrate;generally, interpenetration or interdigitation is limited, because otherwise the layerswould be compatible and the films stable. Certainly, it has been clearly demonstratedthat dewetting proceeds more rapidly on surfaces with less slippage, and hence lessfriction [162, 163].
Applications of dewetting in various nanotechnologies are still being developed butthe basic science must be fully understood before real progress can be obtained. Itis expected that dewetting can be advantageously used in a number of new areas, inparticular those where patterning is important [164]. For example, the use of selectivedewetting to align electrode materials has been developed, a route that may be easilyapplied using ink-jet printing [165, 166]. Microcontact printing and other patterningtechniques can be used to control the structure of films [167, 168, 169, 170, 171].Although the fundamental science of dewetting is still proceeding, the developmentof technologies based on dewetting probably has slowed somewhat in the past decadeand it is perhaps likely that a new breakthrough is needed to reignite the field.
3.2. Blends in optoelectronic devices
Ever since the observation of electrical conductivity in excess of 10 kS/m in dopedpolyacetylene was reported in 1977 [172], there has been interest in developing polymersfor electronics applications. Although conducting polymers, and PEDOT in particular,have applications in various areas from antistatic films [173], transparent electrodes[173, 174], and bioelectronics [175, 176], it is in the area of polymeric semiconductorswhere the greatest interest is to be found. Interfaces in polymer electronics are crucialfor numerous reasons because they influence and direct morphological behaviour, andcan also influence the electronic properties directly.
Blends are of primary interest in photovoltaic devices and light-emitting diode(LED) technology. In the case of LEDs, a current is driven through a forward-biasedpolymer blend, in which one component is a hole-transporting and the other an electron-transporting polymer. Electrons and holes meet, and form a bound state, called an
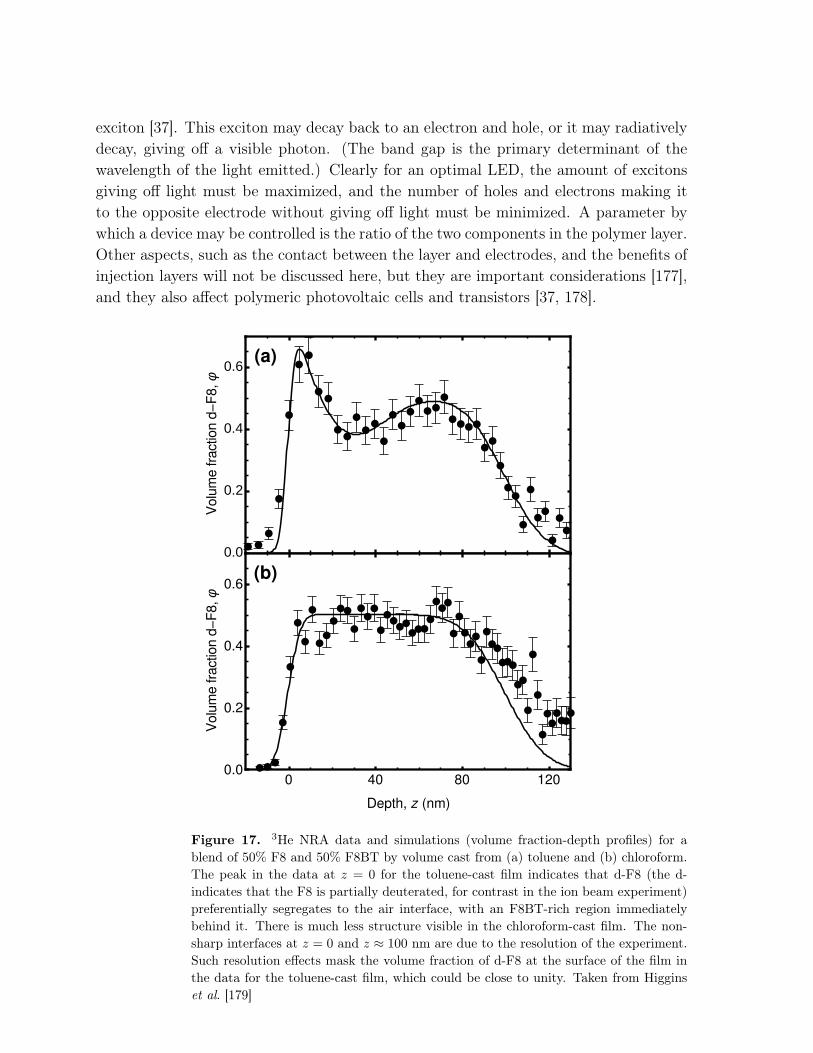
exciton [37]. This exciton may decay back to an electron and hole, or it may radiativelydecay, giving off a visible photon. (The band gap is the primary determinant of thewavelength of the light emitted.) Clearly for an optimal LED, the amount of excitonsgiving off light must be maximized, and the number of holes and electrons making itto the opposite electrode without giving off light must be minimized. A parameter bywhich a device may be controlled is the ratio of the two components in the polymer layer.Other aspects, such as the contact between the layer and electrodes, and the benefits ofinjection layers will not be discussed here, but they are important considerations [177],and they also affect polymeric photovoltaic cells and transistors [37, 178].
0.0
0.2
0.4
0.6
Volu
me fra
ctio
n d
−F
8, φ
Depth, z (nm)
0 40 80 1200.0
0.2
0.4
0.6
Volu
me fra
ctio
n d
−F
8, φ
(a)
(b)
Figure 17. 3He NRA data and simulations (volume fraction-depth profiles) for ablend of 50% F8 and 50% F8BT by volume cast from (a) toluene and (b) chloroform.The peak in the data at z = 0 for the toluene-cast film indicates that d-F8 (the d-indicates that the F8 is partially deuterated, for contrast in the ion beam experiment)preferentially segregates to the air interface, with an F8BT-rich region immediatelybehind it. There is much less structure visible in the chloroform-cast film. The non-sharp interfaces at z = 0 and z ≈ 100 nm are due to the resolution of the experiment.Such resolution effects mask the volume fraction of d-F8 at the surface of the film inthe data for the toluene-cast film, which could be close to unity. Taken from Higginset al. [179]
Solar cells essentially work in the opposite sense to LEDs, with incoming lightcreating an exciton in the blend, which is required to dissociate at an interface betweenthe two components. This dissociation will create electrons and holes, and thesemust dominate over the competing process of re-radiation. A small bias potential isplaced over the cell in order to optimize current collection. The difference between themorphology of the active layer in photovoltaic devices and LEDs is that photovoltaic cellsrequire sharp interfaces at which excitons can dissociate, whereas LEDs benefit from agreater degree of mixing because sharp interfaces can provide charge traps [1, 37], whichare certainly not desired. In both cases, a clear path for the charges to the electrodesis necessary. These requirements for photovoltaics and LEDs are largely based on ourunderstanding of the behaviour of charge transport and excitonic behaviour rather thansystematic experimental studies linking morphology to optoelectronic behaviour.
Despite the difficulties in creating systematic studies, it is possible to linkstructure-property relationships, and this will be exemplified considering a blend ofpoly(9,9-dioctylfluorene) (F8) and F8BT which is commonly used as a model LED.Electroluminescent properties of blends of these two polymers are optimized when filmsare made with 5% F8BT [180]. Varying the composition of F8BT with respect toF8 changes device properties, but also enables a test of the effect of morphology.For example, casting this blend (F8/F8BT) from different solvents reveals differentstructures, as can be seen in Figure 17 for toluene and chloroform [179]. The thin layerof F8 attracted to the surface in the toluene-cast film has a profound effect on thephotoluminescence properties of these blends. In photoluminescence experiments lightis incident on the surface and the radiation emission from the surface is detected. WhenF8 is irradiated with 405 nm wavelength light, it fluoresces at around 430 nm. However,when mixed with F8BT, this fluorescence is quenched and a broad green emission at∼ 500 nm is observed. Here, energy transfer between F8 and F8BT takes place. Forblends cast from chloroform, where the F8 and F8BT are much better mixed, there isindeed energy transfer. However, when the film is cast from toluene, the blue emissionfrom F8 is retained remarkably well even at concentrations as low as 50% F8. The F8layer at the surface is pure enough to fluoresce. The results are shown as a function ofcomposition in Figure 18 [181].
Photoluminescence is not usually an important factor in real devices, but the datashown in figures 17 and 18 illustrate important phenomena, namely how the role of thecasting solvent for the blend can affect device properties. In real devices, other effectscan be important, and the role of crystallinity is particularly important in polymerdevices, because of the strong affect crystallinity has on charge transport. For example,in model solar cells, blends of poly(3-hexylthiophene) (P3HT) and the fullerene-based[6,6]-phenyl-C61-butyric acid methyl ester are particularly susceptible to the crystallinebehaviour of P3HT [182, 183], which emphasizes the importance of understanding thecrystalline structure of P3HT [184, 185]. Structure-property relationships in polymerelectronics is an active and ongoing area of research. New materials are continuouslybeing developed and optimized, so new understanding on how to prepare the optimal
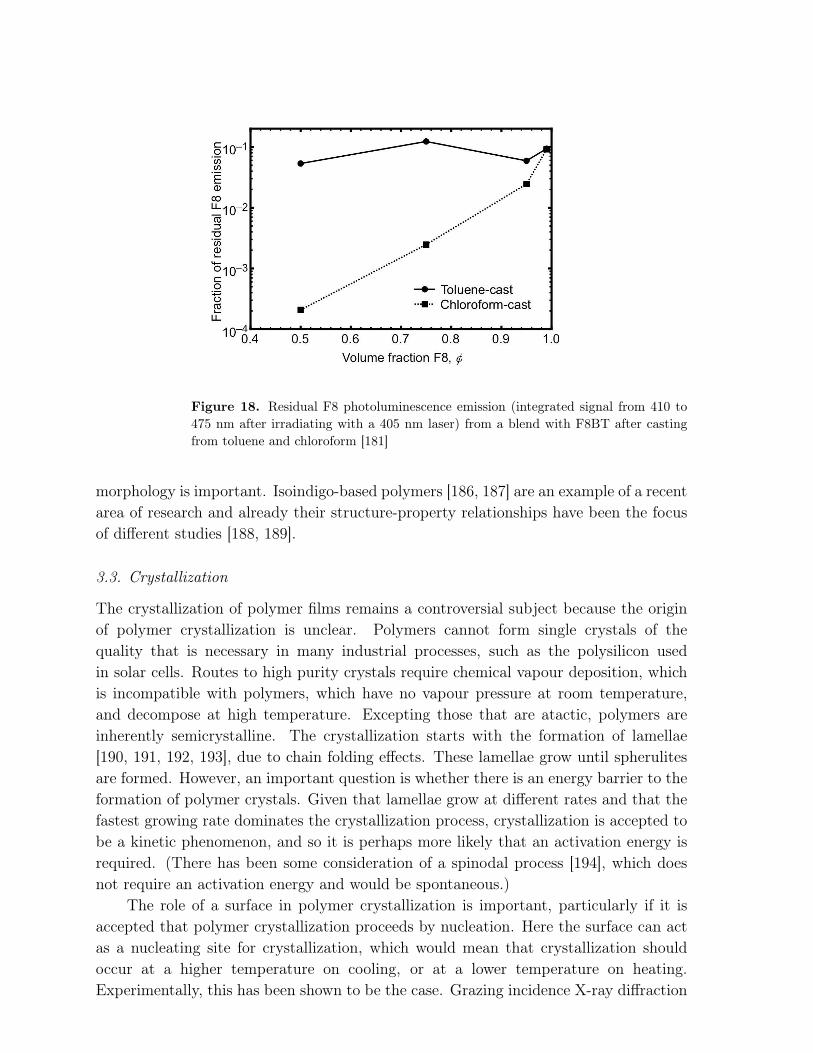
Figure 18. Residual F8 photoluminescence emission (integrated signal from 410 to475 nm after irradiating with a 405 nm laser) from a blend with F8BT after castingfrom toluene and chloroform [181]
morphology is important. Isoindigo-based polymers [186, 187] are an example of a recentarea of research and already their structure-property relationships have been the focusof different studies [188, 189].
3.3. Crystallization
The crystallization of polymer films remains a controversial subject because the originof polymer crystallization is unclear. Polymers cannot form single crystals of thequality that is necessary in many industrial processes, such as the polysilicon usedin solar cells. Routes to high purity crystals require chemical vapour deposition, whichis incompatible with polymers, which have no vapour pressure at room temperature,and decompose at high temperature. Excepting those that are atactic, polymers areinherently semicrystalline. The crystallization starts with the formation of lamellae[190, 191, 192, 193], due to chain folding effects. These lamellae grow until spherulitesare formed. However, an important question is whether there is an energy barrier to theformation of polymer crystals. Given that lamellae grow at different rates and that thefastest growing rate dominates the crystallization process, crystallization is accepted tobe a kinetic phenomenon, and so it is perhaps more likely that an activation energy isrequired. (There has been some consideration of a spinodal process [194], which doesnot require an activation energy and would be spontaneous.)
The role of a surface in polymer crystallization is important, particularly if it isaccepted that polymer crystallization proceeds by nucleation. Here the surface can actas a nucleating site for crystallization, which would mean that crystallization shouldoccur at a higher temperature on cooling, or at a lower temperature on heating.Experimentally, this has been shown to be the case. Grazing incidence X-ray diffraction
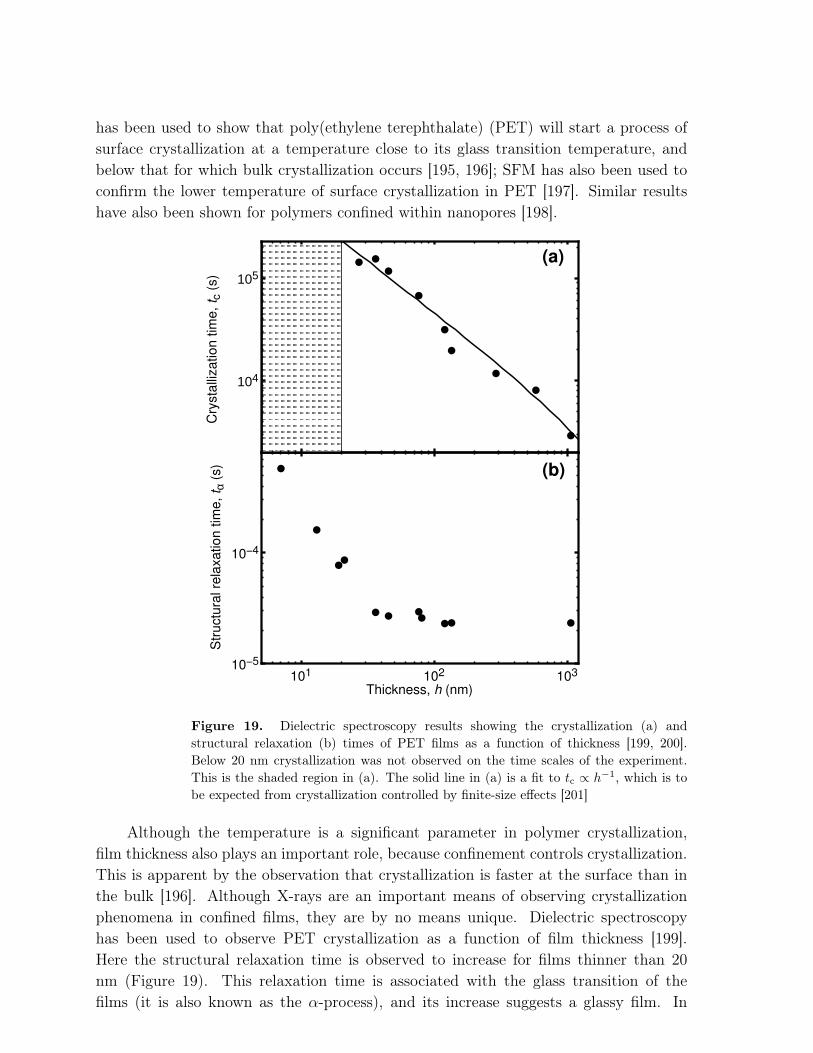
has been used to show that poly(ethylene terephthalate) (PET) will start a process ofsurface crystallization at a temperature close to its glass transition temperature, andbelow that for which bulk crystallization occurs [195, 196]; SFM has also been used toconfirm the lower temperature of surface crystallization in PET [197]. Similar resultshave also been shown for polymers confined within nanopores [198].
101 102 10310−5
10−4
Thickness, h (nm)
Str
uctu
ral re
laxa
tio
n t
ime
,t α
(s)
104
105
Cry
sta
lliza
tio
n t
ime
,t c
(s)
(a)
(b)
Figure 19. Dielectric spectroscopy results showing the crystallization (a) andstructural relaxation (b) times of PET films as a function of thickness [199, 200].Below 20 nm crystallization was not observed on the time scales of the experiment.This is the shaded region in (a). The solid line in (a) is a fit to tc ∝ h−1, which is tobe expected from crystallization controlled by finite-size effects [201]
Although the temperature is a significant parameter in polymer crystallization,film thickness also plays an important role, because confinement controls crystallization.This is apparent by the observation that crystallization is faster at the surface than inthe bulk [196]. Although X-rays are an important means of observing crystallizationphenomena in confined films, they are by no means unique. Dielectric spectroscopyhas been used to observe PET crystallization as a function of film thickness [199].Here the structural relaxation time is observed to increase for films thinner than 20nm (Figure 19). This relaxation time is associated with the glass transition of thefilms (it is also known as the α-process), and its increase suggests a glassy film. In
this case, a layer of PET was observed to be irreversibly adsorbed onto the aluminiumelectrodes (substrate) required for the broadband relaxation spectroscopy experiment.This strong adsorption is responsible for the increased glass transition for these thinnerfilms. For these very thin films, crystallization was not observed and no crystallizationtime was measured. The 20 nm thickness limit on the crystallization suppressionwas approximately twice the thickness of the adsorbed layer. It had been knownpreviously that crystallization was strongly suppressed in ultrathin films [202], butthere is nevertheless a mechanism for the formation of crystallized structures in two-dimensional confinement [203, 204]. In these examples, a monolayer-thick film of PEGcan dewet from its substrate, forming crystalline structures as it does so. Anotherroute to highly confined crystallized structures was demonstrated with the synthesisof polyethylene nanoparticles [205]. These semi-crystalline layers comprised a merefourteen polymer chains, and in this case were not found on the surface, but wereformed sandwiched between amorphous layers.
Much of polymer crystallization research has been dedicated to semiconductingpolymers. Semiconducting polymers are generally rather rigid, with a long persistencelength, which means that they have a smaller entropic cost in forming lamellae thanmore loosely bound polymers. Formally, semiconducting polymers behave as “worm-like chains”, whereas more flexible polymers can often be considered as “freely-jointedchains” (see section 2.1.4) [9]. Furthermore, the ability to form semicrystalline phaseshas advantages in terms of the charge transfer of these polymers. Semiconductingpolymers are often conjugated, which means that they display alternating single anddouble bonds, along which charges can move. Movement of charges along a conjugatedbackbone is impeded by “traps”, which are more likely near a kink. Certainly, thereis experimental evidence linking the size of crystalline domains and charge transportphenomena [206]. It has also been shown that changing the nature of the materialsubstrate will change the way that the film forms, affecting its crystallization. Polymersare known to align on structures that have a direction associated with them; these areoften called alignment layers, and grazing incidence X-ray techniques have been used todetermine the behaviour of polymers on these surfaces [207, 208].
The role of crystallization and its impact on charge transport is an underdevelopedsubject, however, because there is evidence of charge transport remaining good, eventhough interfaces may be rough, or amorphous materials have been added that wouldnormally be expected to limit polymer performance [209, 210]. Similar results havebeen shown to be the case in mixtures of small molecule semiconductors with polymericadditives (binders). The addition of polymers to small-molecule semiconductorsis important because polymeric additives can allow greater control of the solutionviscosity and the creation of good quality films from a variety of different coatingmethods, such as dip-coating, and particularly processing routes appropriate for real-world applications, such as ink-jet printing [211]. The first demonstration concernedthe addition of different polymers to an important small-molecule semiconductor,6,13-bis(triisopropylsilylethynyl) pentacene (TIPS-pentacene) with different polymeric
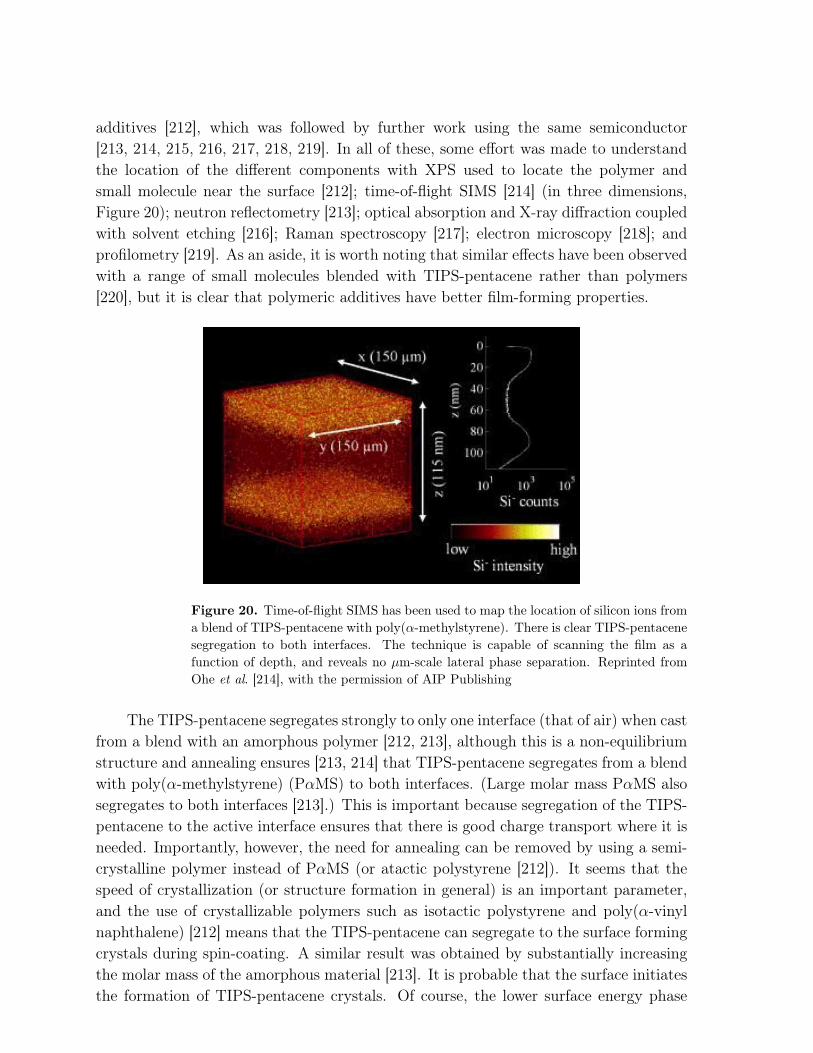
additives [212], which was followed by further work using the same semiconductor[213, 214, 215, 216, 217, 218, 219]. In all of these, some effort was made to understandthe location of the different components with XPS used to locate the polymer andsmall molecule near the surface [212]; time-of-flight SIMS [214] (in three dimensions,Figure 20); neutron reflectometry [213]; optical absorption and X-ray diffraction coupledwith solvent etching [216]; Raman spectroscopy [217]; electron microscopy [218]; andprofilometry [219]. As an aside, it is worth noting that similar effects have been observedwith a range of small molecules blended with TIPS-pentacene rather than polymers[220], but it is clear that polymeric additives have better film-forming properties.
Figure 20. Time-of-flight SIMS has been used to map the location of silicon ions froma blend of TIPS-pentacene with poly(α-methylstyrene). There is clear TIPS-pentacenesegregation to both interfaces. The technique is capable of scanning the film as afunction of depth, and reveals no µm-scale lateral phase separation. Reprinted fromOhe et al. [214], with the permission of AIP Publishing
The TIPS-pentacene segregates strongly to only one interface (that of air) when castfrom a blend with an amorphous polymer [212, 213], although this is a non-equilibriumstructure and annealing ensures [213, 214] that TIPS-pentacene segregates from a blendwith poly(α-methylstyrene) (PαMS) to both interfaces. (Large molar mass PαMS alsosegregates to both interfaces [213].) This is important because segregation of the TIPS-pentacene to the active interface ensures that there is good charge transport where it isneeded. Importantly, however, the need for annealing can be removed by using a semi-crystalline polymer instead of PαMS (or atactic polystyrene [212]). It seems that thespeed of crystallization (or structure formation in general) is an important parameter,and the use of crystallizable polymers such as isotactic polystyrene and poly(α-vinylnaphthalene) [212] means that the TIPS-pentacene can segregate to the surface formingcrystals during spin-coating. A similar result was obtained by substantially increasingthe molar mass of the amorphous material [213]. It is probable that the surface initiatesthe formation of TIPS-pentacene crystals. Of course, the lower surface energy phase
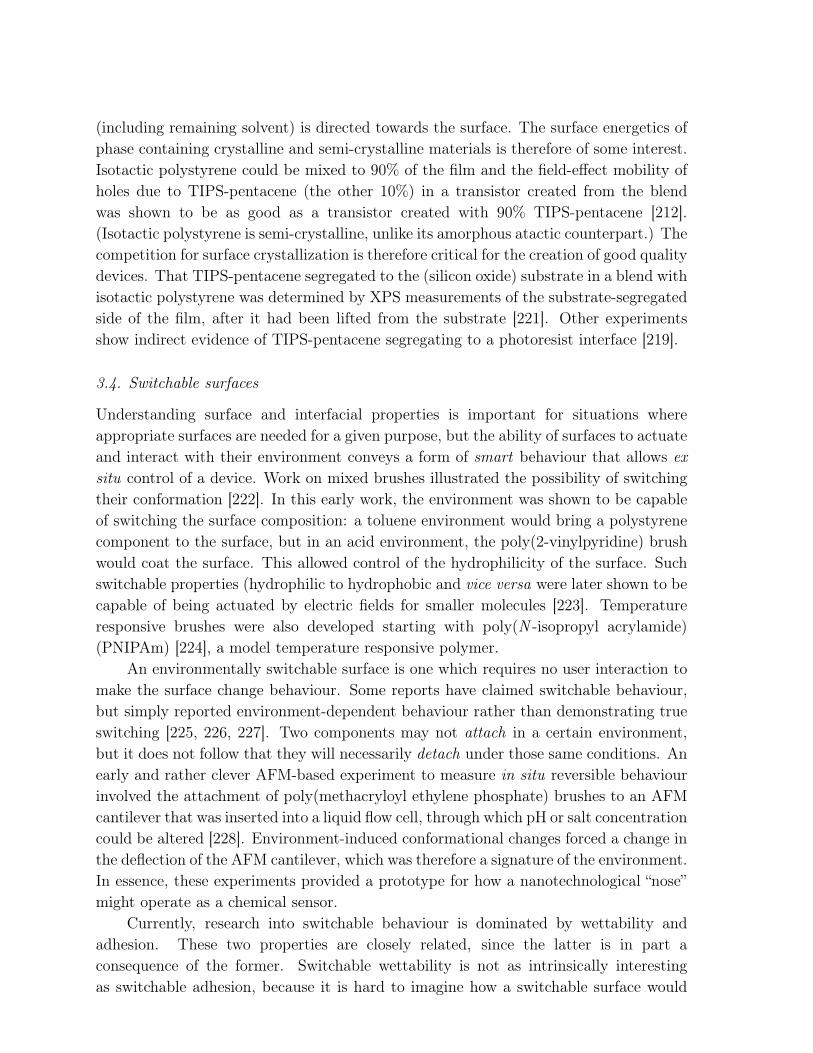
(including remaining solvent) is directed towards the surface. The surface energetics ofphase containing crystalline and semi-crystalline materials is therefore of some interest.Isotactic polystyrene could be mixed to 90% of the film and the field-effect mobility ofholes due to TIPS-pentacene (the other 10%) in a transistor created from the blendwas shown to be as good as a transistor created with 90% TIPS-pentacene [212].(Isotactic polystyrene is semi-crystalline, unlike its amorphous atactic counterpart.) Thecompetition for surface crystallization is therefore critical for the creation of good qualitydevices. That TIPS-pentacene segregated to the (silicon oxide) substrate in a blend withisotactic polystyrene was determined by XPS measurements of the substrate-segregatedside of the film, after it had been lifted from the substrate [221]. Other experimentsshow indirect evidence of TIPS-pentacene segregating to a photoresist interface [219].
3.4. Switchable surfaces
Understanding surface and interfacial properties is important for situations whereappropriate surfaces are needed for a given purpose, but the ability of surfaces to actuateand interact with their environment conveys a form of smart behaviour that allows ex
situ control of a device. Work on mixed brushes illustrated the possibility of switchingtheir conformation [222]. In this early work, the environment was shown to be capableof switching the surface composition: a toluene environment would bring a polystyrenecomponent to the surface, but in an acid environment, the poly(2-vinylpyridine) brushwould coat the surface. This allowed control of the hydrophilicity of the surface. Suchswitchable properties (hydrophilic to hydrophobic and vice versa were later shown to becapable of being actuated by electric fields for smaller molecules [223]. Temperatureresponsive brushes were also developed starting with poly(N -isopropyl acrylamide)(PNIPAm) [224], a model temperature responsive polymer.
An environmentally switchable surface is one which requires no user interaction tomake the surface change behaviour. Some reports have claimed switchable behaviour,but simply reported environment-dependent behaviour rather than demonstrating trueswitching [225, 226, 227]. Two components may not attach in a certain environment,but it does not follow that they will necessarily detach under those same conditions. Anearly and rather clever AFM-based experiment to measure in situ reversible behaviourinvolved the attachment of poly(methacryloyl ethylene phosphate) brushes to an AFMcantilever that was inserted into a liquid flow cell, through which pH or salt concentrationcould be altered [228]. Environment-induced conformational changes forced a change inthe deflection of the AFM cantilever, which was therefore a signature of the environment.In essence, these experiments provided a prototype for how a nanotechnological “nose”might operate as a chemical sensor.
Currently, research into switchable behaviour is dominated by wettability andadhesion. These two properties are closely related, since the latter is in part aconsequence of the former. Switchable wettability is not as intrinsically interestingas switchable adhesion, because it is hard to imagine how a switchable surface would
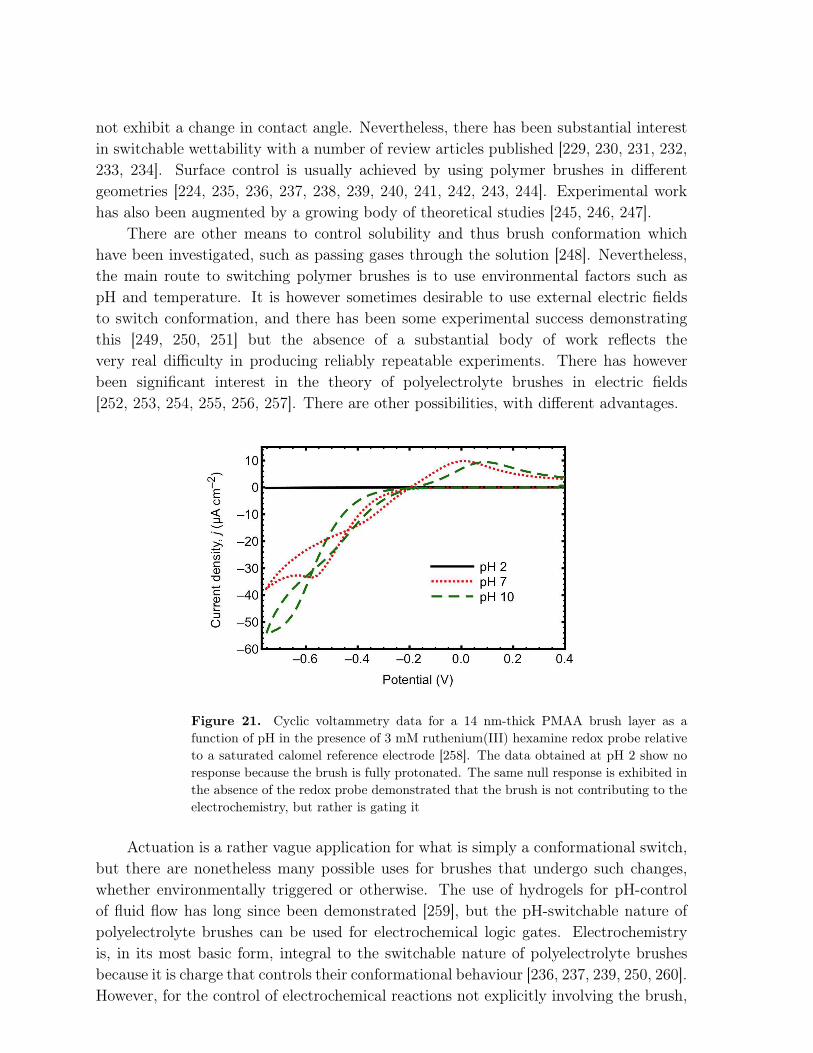
not exhibit a change in contact angle. Nevertheless, there has been substantial interestin switchable wettability with a number of review articles published [229, 230, 231, 232,233, 234]. Surface control is usually achieved by using polymer brushes in differentgeometries [224, 235, 236, 237, 238, 239, 240, 241, 242, 243, 244]. Experimental workhas also been augmented by a growing body of theoretical studies [245, 246, 247].
There are other means to control solubility and thus brush conformation whichhave been investigated, such as passing gases through the solution [248]. Nevertheless,the main route to switching polymer brushes is to use environmental factors such aspH and temperature. It is however sometimes desirable to use external electric fieldsto switch conformation, and there has been some experimental success demonstratingthis [249, 250, 251] but the absence of a substantial body of work reflects thevery real difficulty in producing reliably repeatable experiments. There has howeverbeen significant interest in the theory of polyelectrolyte brushes in electric fields[252, 253, 254, 255, 256, 257]. There are other possibilities, with different advantages.
Figure 21. Cyclic voltammetry data for a 14 nm-thick PMAA brush layer as afunction of pH in the presence of 3 mM ruthenium(III) hexamine redox probe relativeto a saturated calomel reference electrode [258]. The data obtained at pH 2 show noresponse because the brush is fully protonated. The same null response is exhibited inthe absence of the redox probe demonstrated that the brush is not contributing to theelectrochemistry, but rather is gating it
Actuation is a rather vague application for what is simply a conformational switch,but there are nonetheless many possible uses for brushes that undergo such changes,whether environmentally triggered or otherwise. The use of hydrogels for pH-controlof fluid flow has long since been demonstrated [259], but the pH-switchable nature ofpolyelectrolyte brushes can be used for electrochemical logic gates. Electrochemistryis, in its most basic form, integral to the switchable nature of polyelectrolyte brushesbecause it is charge that controls their conformational behaviour [236, 237, 239, 250, 260].However, for the control of electrochemical reactions not explicitly involving the brush,
a mechanism has been shown that involves polyanionic brushes (polycations can also beused in the appropriate circumstances) attracting redox probes to the brush, which inturn allows electron transfer to take place at the substrate surface. If the pH is adjusted(lowered for polyanions), the polyelectrolyte loses its charge and the function is turnedoff (Figure 21). Electrochemical switching was seen to work well using standard siliconsubstrates [258], eliminating the need for the metal surfaces used in earlier work [260].It is probable that the ability to replace standard metallic electrodes with silicon islikely to be of greater importance than the switchability aspect, and to this extentpolyelectrolytes are not necessary [261].
The control of adhesion by environmental change remains a particularly appealinguse of switchable surfaces. The demonstration of environmentally switchable adhesionusing polymer brush layers has been achieved by a number of groups [117, 262, 263,264, 265]. The simplest example is that where pH controls the adhesion, and herea polyelectrolyte brush has been shown to have its adhesion with hydrogels switchedoff when the pH is changed in aqueous solution. The hydrogel used need not itselfbe a polyelectrolyte [263], but oppositely charged polyelectrolytes are certainly veryeffective [117, 265]. Switchable adhesion between oppositely charged polyelectrolytebrushes has also been demonstrated [262], although in this case the “switch” was notpH, but rather the ionic strength of the medium. Adding NaCl was observed to causethe adhesion to fail. Since the adhesion was due to the electrostatic interaction betweenthe two brushes, the salt was able to shield these charges and interfere with adhesion.This phenomenon is interesting, because it affects materials that are already adhering,which is important because it presents another means of controlling adhesion. However,it also demonstrates the challenge of applying such switchable adhesion in biologicalsystems, which have considerable salt present. Bonding between two identical brushlayers has also been demonstrated, in which polyzwitterions were shown to adhere dueto long-range forces between the components [264]. However, in this case a change intemperature caused the brushes to swell, terminating the adhesion. Despite these efforts,application development is still not forthcoming. This is perhaps surprising becausethere are a number of areas where reversible glues could be useful, with a headlineexample being in wound dressing; removing dressings from a wound has risks of infectionand numerous therapeutic challenges [266]. Recycling is another area because separatingparts without damaging individual components decreases waste [267], with perhaps theautomotive industry leading the way in separation technologies [268]. Despite these andmany other needs, it is an open question as to whether brushes are robust enough towithstand the wear to which they may be subjected, and there is also the problem ofease of use because “one-pot” reversible adhesives of this nature are currently lacking.Nevertheless, these problems are related to development and it is inconceivable thatthere are no uses for what is likely to be a relatively inexpensive and versatile technology.
That surface switchability is exhibited more often than not in aqueous environmentsand that many water soluble polymers are biocompatible leaves open the possibility ofengineering switchable surfaces with biological applications. An early example of this is
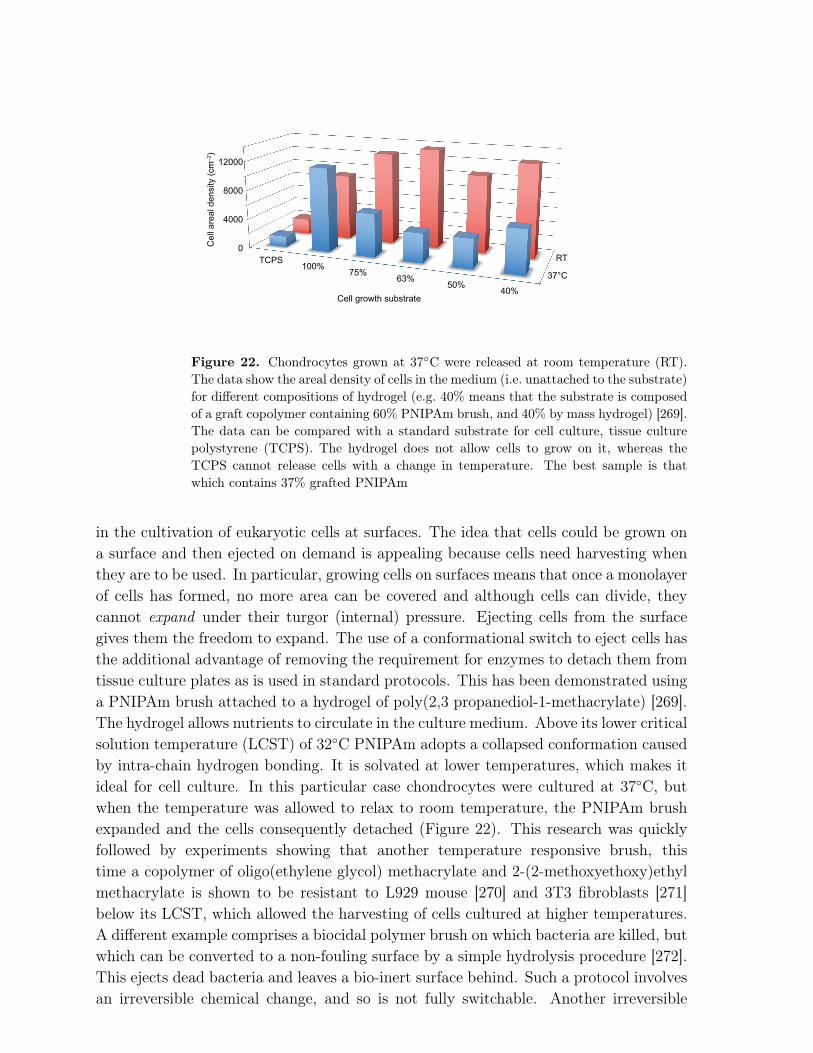
0
4000
8000
12000
TCPS100%
75%63%
50%40%
RT
37°C
Ce
ll a
rea
l d
en
sity (
cm
–2)
Cell growth substrate
Figure 22. Chondrocytes grown at 37◦C were released at room temperature (RT).
The data show the areal density of cells in the medium (i.e. unattached to the substrate)for different compositions of hydrogel (e.g. 40% means that the substrate is composedof a graft copolymer containing 60% PNIPAm brush, and 40% by mass hydrogel) [269].The data can be compared with a standard substrate for cell culture, tissue culturepolystyrene (TCPS). The hydrogel does not allow cells to grow on it, whereas theTCPS cannot release cells with a change in temperature. The best sample is thatwhich contains 37% grafted PNIPAm
in the cultivation of eukaryotic cells at surfaces. The idea that cells could be grown ona surface and then ejected on demand is appealing because cells need harvesting whenthey are to be used. In particular, growing cells on surfaces means that once a monolayerof cells has formed, no more area can be covered and although cells can divide, theycannot expand under their turgor (internal) pressure. Ejecting cells from the surfacegives them the freedom to expand. The use of a conformational switch to eject cells hasthe additional advantage of removing the requirement for enzymes to detach them fromtissue culture plates as is used in standard protocols. This has been demonstrated usinga PNIPAm brush attached to a hydrogel of poly(2,3 propanediol-1-methacrylate) [269].The hydrogel allows nutrients to circulate in the culture medium. Above its lower criticalsolution temperature (LCST) of 32◦C PNIPAm adopts a collapsed conformation causedby intra-chain hydrogen bonding. It is solvated at lower temperatures, which makes itideal for cell culture. In this particular case chondrocytes were cultured at 37◦C, butwhen the temperature was allowed to relax to room temperature, the PNIPAm brushexpanded and the cells consequently detached (Figure 22). This research was quicklyfollowed by experiments showing that another temperature responsive brush, thistime a copolymer of oligo(ethylene glycol) methacrylate and 2-(2-methoxyethoxy)ethylmethacrylate is shown to be resistant to L929 mouse [270] and 3T3 fibroblasts [271]below its LCST, which allowed the harvesting of cells cultured at higher temperatures.A different example comprises a biocidal polymer brush on which bacteria are killed, butwhich can be converted to a non-fouling surface by a simple hydrolysis procedure [272].This ejects dead bacteria and leaves a bio-inert surface behind. Such a protocol involvesan irreversible chemical change, and so is not fully switchable. Another irreversible
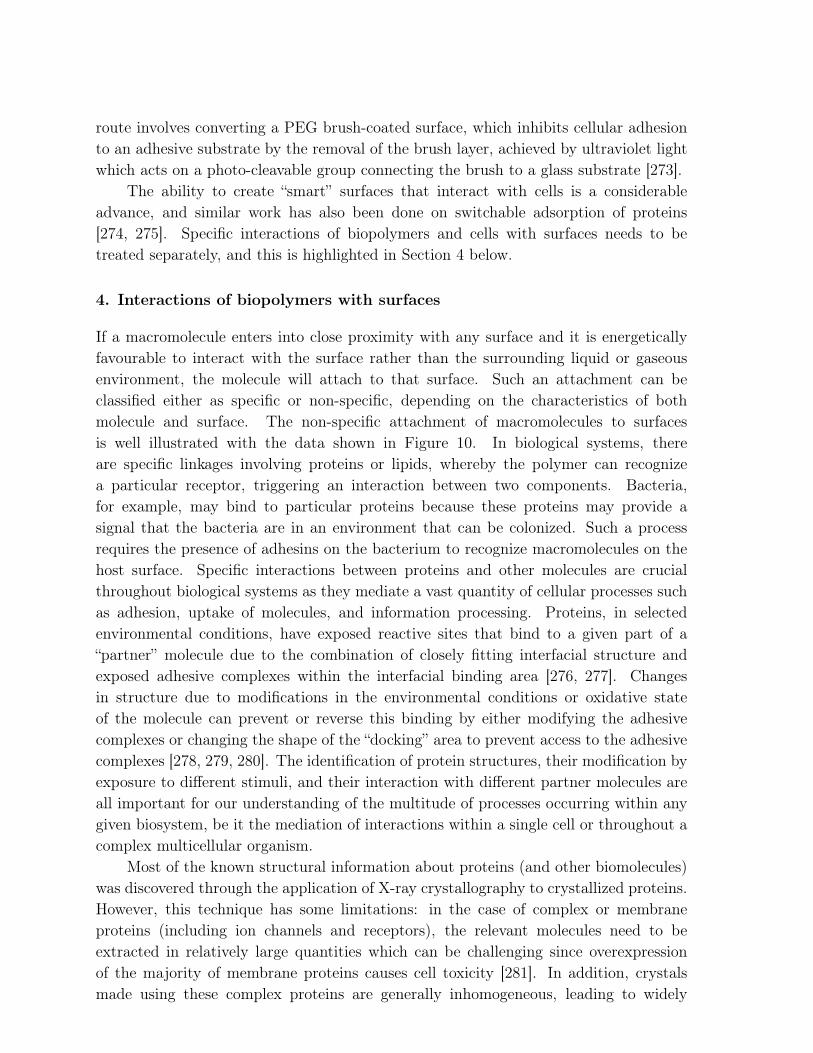
route involves converting a PEG brush-coated surface, which inhibits cellular adhesionto an adhesive substrate by the removal of the brush layer, achieved by ultraviolet lightwhich acts on a photo-cleavable group connecting the brush to a glass substrate [273].
The ability to create “smart” surfaces that interact with cells is a considerableadvance, and similar work has also been done on switchable adsorption of proteins[274, 275]. Specific interactions of biopolymers and cells with surfaces needs to betreated separately, and this is highlighted in Section 4 below.
4. Interactions of biopolymers with surfaces
If a macromolecule enters into close proximity with any surface and it is energeticallyfavourable to interact with the surface rather than the surrounding liquid or gaseousenvironment, the molecule will attach to that surface. Such an attachment can beclassified either as specific or non-specific, depending on the characteristics of bothmolecule and surface. The non-specific attachment of macromolecules to surfacesis well illustrated with the data shown in Figure 10. In biological systems, thereare specific linkages involving proteins or lipids, whereby the polymer can recognizea particular receptor, triggering an interaction between two components. Bacteria,for example, may bind to particular proteins because these proteins may provide asignal that the bacteria are in an environment that can be colonized. Such a processrequires the presence of adhesins on the bacterium to recognize macromolecules on thehost surface. Specific interactions between proteins and other molecules are crucialthroughout biological systems as they mediate a vast quantity of cellular processes suchas adhesion, uptake of molecules, and information processing. Proteins, in selectedenvironmental conditions, have exposed reactive sites that bind to a given part of a“partner” molecule due to the combination of closely fitting interfacial structure andexposed adhesive complexes within the interfacial binding area [276, 277]. Changesin structure due to modifications in the environmental conditions or oxidative stateof the molecule can prevent or reverse this binding by either modifying the adhesivecomplexes or changing the shape of the “docking” area to prevent access to the adhesivecomplexes [278, 279, 280]. The identification of protein structures, their modification byexposure to different stimuli, and their interaction with different partner molecules areall important for our understanding of the multitude of processes occurring within anygiven biosystem, be it the mediation of interactions within a single cell or throughout acomplex multicellular organism.
Most of the known structural information about proteins (and other biomolecules)was discovered through the application of X-ray crystallography to crystallized proteins.However, this technique has some limitations: in the case of complex or membraneproteins (including ion channels and receptors), the relevant molecules need to beextracted in relatively large quantities which can be challenging since overexpressionof the majority of membrane proteins causes cell toxicity [281]. In addition, crystalsmade using these complex proteins are generally inhomogeneous, leading to widely
varying diffraction quality within a single sample and causing difficulties in terms ofdata interpretation [282].
X-ray crystallography cannot image proteins in vivo or probe the strength of bondsbetween a protein and itself or external partner molecules. Many proteins undergophysical modifications as part of their biological role, so it is useful to be able to trackchanges to their structure. Isolating and crystallizing proteins at these defined stagesis challenging given the short timescales of the movement; folding and unfolding eventsgenerally occur in the range of microseconds to tens of seconds [283], except in the caseof ultrafast folding proteins which can undergo folding in timescales from 10 µs downto several hundred nanoseconds [284, 285]. There have been advances in time-resolvedX-ray crystallography that enable changes in structure to be tracked, e.g. the carboxy todeoxy state modifications of a L29F myoglobin mutant [286] and structural relaxationand ligand migration in the L29W myoglobin mutant following photodissociation ofcarbon monoxide from the heme (porphyrin encapsulated) iron [287].
There are several competing techniques which have been suggested to eitherenhance or replace X-ray crystallography data. Methodologies that are able toprovide information about protein folding include vibrational and optical spectroscopytechniques such as fluorescence resonance energy transfer and infrared spectroscopy[288], and single molecule force spectroscopy (see Section 2.1.4).
The discussion is limited to force spectroscopy and QCM-D (see Section 2.1.5).Force spectroscopy enables quantitative information to be obtained, offering a versatileapproach to understanding molecular interactions and the forces and structures whichgovern these interactions on nano- to micro-scales. QCM-D is then discussed as amethod of understanding molecular binding on a macroscopic scale, using a population ofmolecules to examine binding trends over time and in different environmental conditions;research that has importance in understanding biofouling and also in the developmentof sensor technology [98].
4.1. Force mapping of cells
A challenging aspect of research of polymers at surfaces is involved in understandingthe behaviour of complex biopolymers which are integrated into the outer wall ofeukaryotic and prokaryotic cells. More generally, the interactions of biomacromoleculeswith living organisms, a means of testing molecular recognition, is a rapidly growingarea of research, which is benefitting from the use of the SMFS-based techniques[289, 290, 291, 292]. Various forms of force mapping evolved simultaneously, withexperiments performed using unmodified AFM tips [293, 294], chemically modifiedprobes [295] (i.e. probes functionalized with a self-assembled monolayer), and probesfunctionalized with biopolymers [296]. The use of SMFS has revolutionalized thedetermination of cellular adhesion forces; previously micro-mechanical techniques wereused [297], which were crude and did not allow mapping. An additional benefit of SMFSor SFM is that force-distance curves contain much information about the interaction
between the tip and the surface; whilst adhesive and repulsive forces are related to theportion of the force-distance curve that is in solution, the portion of the curve where thetip is in contact with and pressing into the sample surface contains information aboutthe mechanical properties of the sample, and thus, with a well characterized probe [298],the viscoelastic properties of the sample can also be profiled. This technique has beenapplied to a wide range of samples including lipid bilayers [299], polymers and films[300, 301, 302, 303, 304], and whole cells [305, 306, 307, 308, 309, 310, 311, 312].
Figure 23. (a) Deflection image taken under a buffer solution of a dividing mutantLactococcus lactis bacterium lacking its exopolysaccharides. (b) Adhesion force map(400×400 nm2) recorded in the area denoted by the square in (a). (c, d) Adhesion forcemaps (500× 500 nm2) of another cell, taken of the same area but with the cell rotatedby 90
◦ between the two measurements. Bright pixels represent a positive interaction,i.e. adhesion. Dashed red lines are to guide the eye and lie parallel to the short cell axis.All force maps were obtained using a lysin-modified tip and a peak applied force of 250pN. Reprinted with permission by Macmillan Publishers Ltd: Nature Communicationsfrom Andre et al. [313], copyright 2010
To exemplify the use of AFM tips modified with a biopolymer to explore the locationof adhesive moieties on a living cell, work examining a mutant strain of Lactococcus
lactis bacteria can be considered [313]. This strain lacks the exopolysaccharides thatnormally coat the wild type of this Gram-positive bacterium and so SFM images and
corresponding force maps were obtained using tips modified with a selectively bindingpeptidoglycan lysin motif: a recombinant AcmA protein cell wall-binding domain [314].Using this chemically modified tip, localized distributions of peptidoglycan molecules(which give bacteria structural integrity and are a substantial component of the massof lactococci) in lines parallel to the septum of the dividing bacterium were identified(Figure 23). The lines were still visible upon rotation of the cell by 90◦, illustratingthat the lines are a feature of the cell and not caused by imaging artefacts. Selectivityof adhesion was confirmed by adding unbound peptidoglycan to the imaging media andtaking another force map, which revealed few adhesion events. Similar specific forcemapping has recently been applied in studies of a wide range of substrates with biologicalrelevance, including the presence of microRNA in neuron cells [315], the orientation andarrangement of P1 adhesin on Streptococcus mutans [316], biofilm-forming propertiesin genetic mutants of Candida albicans [317], clustering of adhesins on pathogenicbacterium Bordetella pertussis [318], and collagen-binding activity on Staphylococcus
epidermidis [319].While force mapping provides a wealth of spatially resolved information about
the adhesion between the probe and the sample, it is important to consider that themagnitude and distance from the sample surface at which binding events occur isdependent on the selected experimental conditions (including the applied force, andprobe speed and spring constant) [320, 321], so they must be selected with care andcaution should be used in any direct comparisons of force spectroscopy data.
4.2. Dynamic force spectroscopy
Dynamic force spectroscopy [323, 324] offers a a means of exploring molecular bindingwithout spatial resolution, but with an appreciation of the impact that the probe settingshave upon the binding energetics of the system: measuring molecular interactions asa function of loading rate [325, 326]. This allows a measurement of the strength ofmolecular interactions and a determination of binding constants. To exemplify theutility of dynamic force spectroscopy, the interaction of mucins with molecules froma bacterial surface will be used. Mucins are glycoproteins with different biologicalfunctions involving the immune system, where they attach to pathogens, or in thelubrication of epithelial cells [327]. Their presence can also be used in cancer diagnosis[328]. The important question that follows is with which molecules on the cell surfaceare the mucins interacting, and what components in the mucin participate in thatinteraction. Much is known about what molecules are contained on the cell surface,and it is possible to harvest many of these to coat a surface, or an AFM tip, as in theexample presented here. In Figure 24 data describing the interaction of a mucin withsoybean agglutinin (SBA), a carbohydrate-binding protein (lectin) are presented [322].In this case, the mucin, which will be referred to herein by the authors’ abbreviation ofTnPSM (which abbreviates a modified porcine submaxillary mucin, which is secretedfrom the salivary glands of pigs), was attached to an AFM tip and the SBA attached to
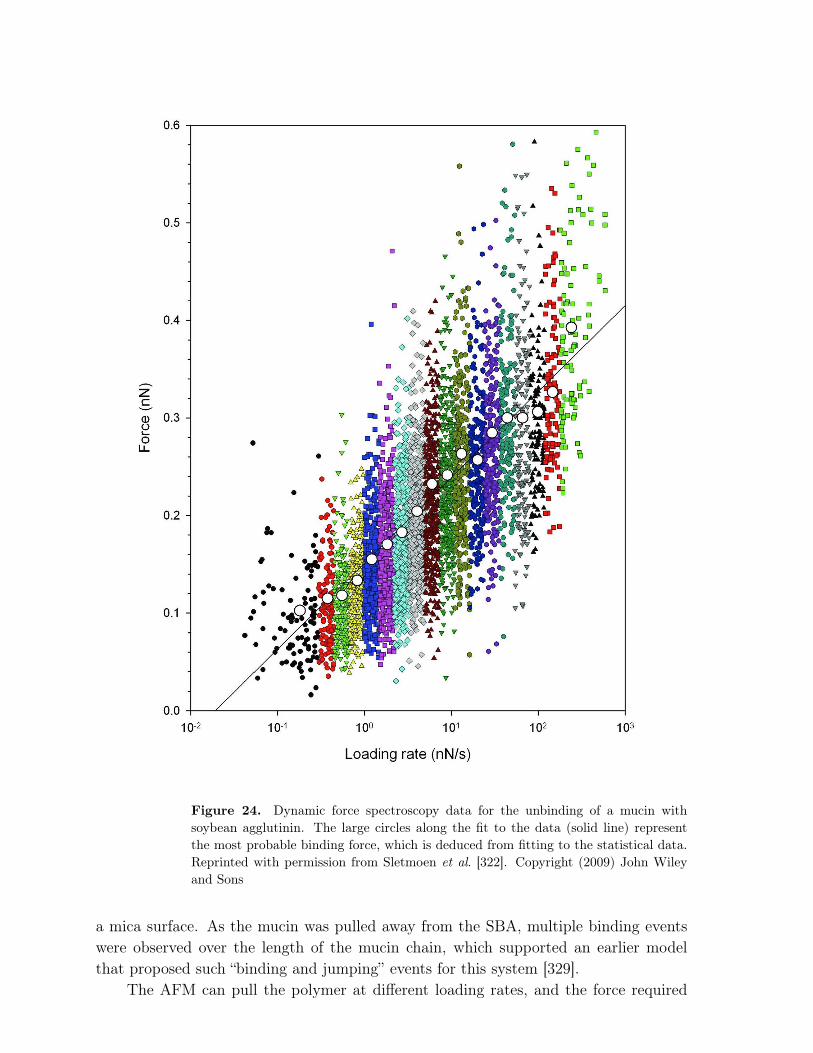
Figure 24. Dynamic force spectroscopy data for the unbinding of a mucin withsoybean agglutinin. The large circles along the fit to the data (solid line) representthe most probable binding force, which is deduced from fitting to the statistical data.Reprinted with permission from Sletmoen et al. [322]. Copyright (2009) John Wileyand Sons
a mica surface. As the mucin was pulled away from the SBA, multiple binding eventswere observed over the length of the mucin chain, which supported an earlier modelthat proposed such “binding and jumping” events for this system [329].
The AFM can pull the polymer at different loading rates, and the force required
to break these bonds (i.e. to unbind) is very much dependent upon the speed of thetip [330], since slower speeds correlate with a smaller loading rate. Slower loading ratesallow the polymer to explore a broader energy landscape and so there is more chance ofthe polymer unbinding. Correspondingly, faster loading rates require a larger force tounbind. Dynamic force spectroscopy allows the calculation of thermodynamic energiesof binding, and also the size (in nm) of the potential barrier over which the bindingtakes place.
Analysis of dynamic force spectroscopy data is typically based upon a modifiedBell-Evans model [331, 332, 333], with the theory described in detail elsewhere[324, 320, 334, 335, 336, 337]. In brief, an unbinding force, F , is applied to the bond,reducing the energy of the potential barrier, E by Fxb, where xb is the distance betweenthe potential minimum and the potential barrier, along the direction of the applied force.The lifetime of the bond is dependent on the potential barrier height [333], and thereforethe probability of the bond breaking under the applied unbinding force is dependent onthe size of the applied force (as the barrier energy effectively becomes smaller whenlarger forces are applied). In the Bell-Evans model, at a constant loading rate, theprobability distribution of the unbinding force, P , is described as
P = Pn exp
(
(F − F ∗)xb
kBT
)
exp
[
1− exp
(
(F − F ∗)xb
kBT
)]
, (11)
where F ∗ is the most frequent rupture force and Pn is a normalization constant. F ∗
can be obtained from the histogram of measured unbinding forces obtained at a givenloading rate, and is linearly dependent on the logarithm of the loading rate, dF/dt by
F ∗ =kBT
xb
[
lndFdt
+ ln(
τbxb
kBT
)
]
, (12)
where τb is the lifetime of the molecular bond [324, 335, 337]. Following from Equation12, the width of the potential barrier can be obtained from the gradient of therelationship between F ∗ and ln F , since the slope is proportional to x−1
b . In the exampleshown in Figure 24, the potential energy barrier is of width 0.1 nm, which is quite small,and the lifetime of the interaction between the mucin and the SBA was determined tobe more than 1 s, which is long. It was concluded in this case that the SBA was ableto move along the TnPSM some distance before detaching. Clearly therefore, dynamicforce spectroscopy reveals quite sophisticated biological information from a relativelysimple experiment, and has been used in a wide range of biologially-relevant fields,including work with yeast [338], embryonic zebrafish cells [339], lipid bilayers [340] andproteins [341, 342]. The technique is also finding utility in synthetic polymer systems[22, 343, 344, 345] and can be undertaken in parallel with other high sensitivity force-measuring tools such as optical tweezers [346].
4.3. Protein adsorption to surfaces
Whereas force mapping and dynamic force spectroscopy are employed to understandand characterize molecular binding in detail, the use of the QCM-D to interrogate
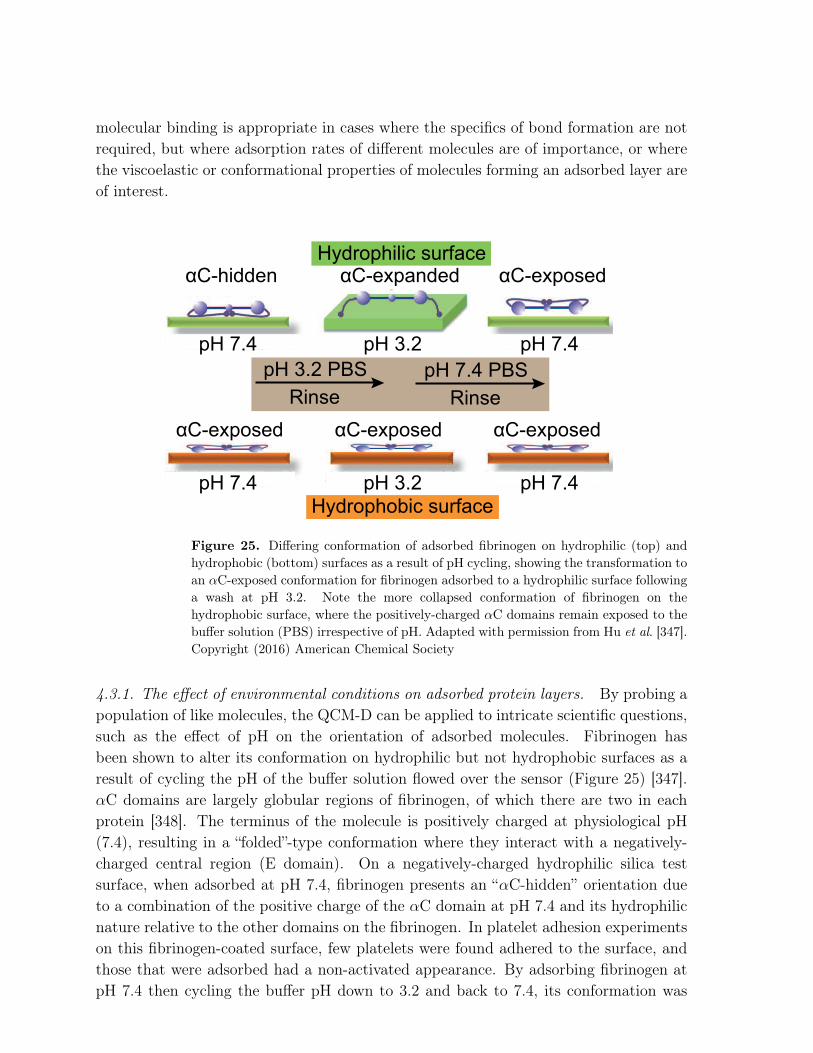
molecular binding is appropriate in cases where the specifics of bond formation are notrequired, but where adsorption rates of different molecules are of importance, or wherethe viscoelastic or conformational properties of molecules forming an adsorbed layer areof interest.
pH 7.4 pH 3.2 pH 7.4
pH 7.4 pH 3.2 pH 7.4
αC-hidden αC-expanded αC-exposed
αC-exposed αC-exposed αC-exposed
pH 3.2 PBS
Rinse
pH 7.4 PBS
Rinse
Hydrophobic surface
Hydrophilic surface
Figure 25. Differing conformation of adsorbed fibrinogen on hydrophilic (top) andhydrophobic (bottom) surfaces as a result of pH cycling, showing the transformation toan αC-exposed conformation for fibrinogen adsorbed to a hydrophilic surface followinga wash at pH 3.2. Note the more collapsed conformation of fibrinogen on thehydrophobic surface, where the positively-charged αC domains remain exposed to thebuffer solution (PBS) irrespective of pH. Adapted with permission from Hu et al. [347].Copyright (2016) American Chemical Society
4.3.1. The effect of environmental conditions on adsorbed protein layers. By probing apopulation of like molecules, the QCM-D can be applied to intricate scientific questions,such as the effect of pH on the orientation of adsorbed molecules. Fibrinogen hasbeen shown to alter its conformation on hydrophilic but not hydrophobic surfaces as aresult of cycling the pH of the buffer solution flowed over the sensor (Figure 25) [347].αC domains are largely globular regions of fibrinogen, of which there are two in eachprotein [348]. The terminus of the molecule is positively charged at physiological pH(7.4), resulting in a “folded”-type conformation where they interact with a negatively-charged central region (E domain). On a negatively-charged hydrophilic silica testsurface, when adsorbed at pH 7.4, fibrinogen presents an “αC-hidden” orientation dueto a combination of the positive charge of the αC domain at pH 7.4 and its hydrophilicnature relative to the other domains on the fibrinogen. In platelet adhesion experimentson this fibrinogen-coated surface, few platelets were found adhered to the surface, andthose that were adsorbed had a non-activated appearance. By adsorbing fibrinogen atpH 7.4 then cycling the buffer pH down to 3.2 and back to 7.4, its conformation was
modified, becoming “αC-exposed” (Figure 25). Platelet adhesion experiments on thissurface showed increased platelet adherence and activation. This conformation changeis due to the charge of the E domain at lower pH: it holds a positive charge at pH 3.2and therefore electrostatic repulsion occurs between it and the two αC domains. Thefibrinogen molecule therefore unfolds, adopting an extended conformation which leadsto an increase in the rigidity of the adsorbed layer. When the pH is returned to pH7.4, the E domain regains a negative charge and attracts the αC domains, re-foldingthe fibrinogen. However, the side nearest the surface is no longer accessible due to theassociated unfavourable entropic cost, and so the αC domains re-bind on top of themolecule, resulting in the αC-exposed conformation.
On the hydrophobic surface, the fibrinogen tends to adsorb with the αC domainsuppermost due to the substantially more hydrophobic nature of the other domainson the molecule, meaning that it is αC-exposed even at pH 7.4. The combinedhydrophobic interactions along the molecule are so strong that the fibrinogen formsa very thin layer (1.3 nm compared to 3.3 nm for the layer adsorbed to the hydrophilicsurface), suggesting that it might have become denatured as a result of the stronginteractions [347]. This type of experiment illustrates that QCM-D can play a role in theinterrogation of biomolecule-surface interactions beyond simple mass adsorption, withthe mass, thickness and viscoelasticity of the adsorbed material bringing new insightsto the understanding of molecule–surface interactions and the effect of environment onthe behaviour of adsorbed molecules.
Similarly, detailed QCM-D analysis can be used to explore the interaction of waterwith molecules at the test surface, and the influence of molecular architecture upon thatinteraction, such as in the case of synthetic hydrophilic random and block copolymerson different nanocellulose fibril-coated surfaces, which explored the possibility of waterexpulsion from the interface as a result of copolymer deposition and the driving forcesbehind that interaction (in this case, predicted to be of an electrostatic nature) [349].In some cases this too can be linked to pH responsivity, such as in the case of mycolicacid monolayers [109].
4.3.2. Preventing protein adsorption. Protein adsorption is significant in large part dueto the formation of largely unwanted biofilms which can lead to health issues. Theseareas include sanitation i.e. biofilm formation in water delivery systems; and medicineand dentistry, such as infection caused by bacterial colony formation on the teethand post-surgical implant-related complications. Interface engineering can help preventprotein adsorption, either by making it energetically unfavourable or by out-competingthe unwanted protein with a less damaging alternative. Water-soluble polymers are thebasis for protein-resistant surfaces because they can remain solvated, which makes itmore difficult for proteins to adsorb. This field is large and there are already substantialreviews [350, 351, 352, 353]. Here, examples are limited to those that exemplify the useof the QCM-D.
The fouling of surfaces is of much more than academic interest, and QCM-D can
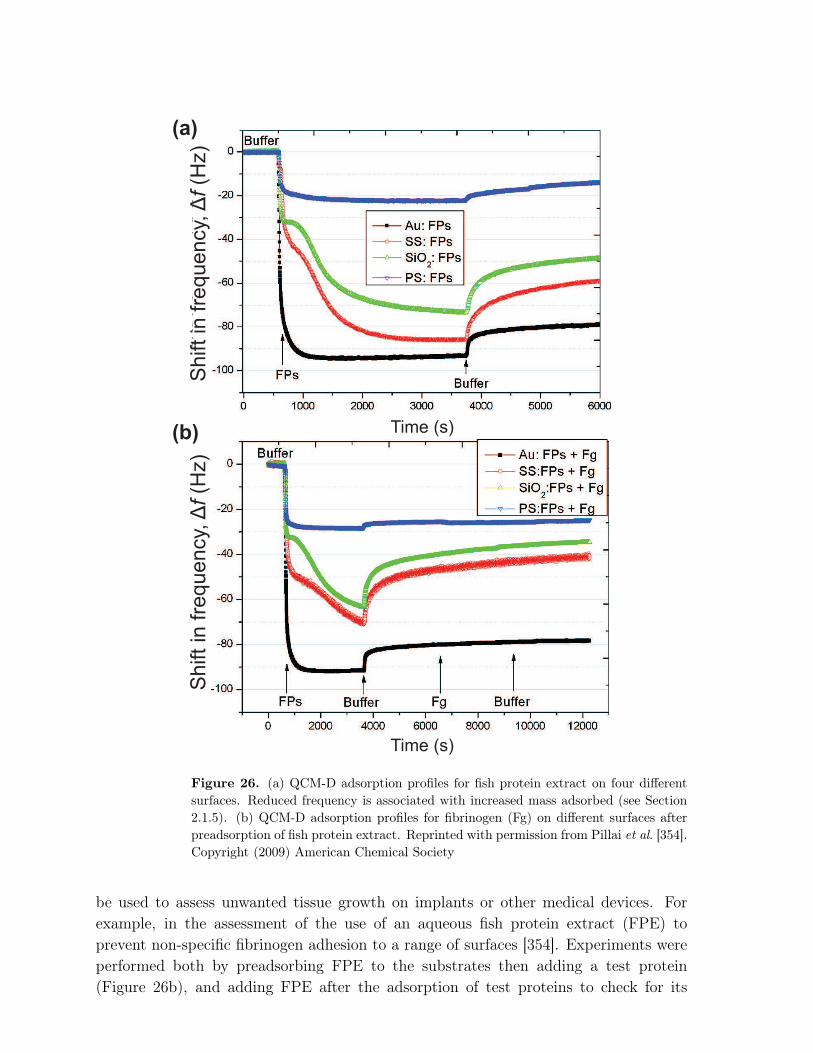
Sh
ift
in f
req
ue
ncy,
Δf (H
z)
Shift in
fre
quency,
Δf (H
z)
Time (s)
Time (s)
(a)
(b)
Figure 26. (a) QCM-D adsorption profiles for fish protein extract on four differentsurfaces. Reduced frequency is associated with increased mass adsorbed (see Section2.1.5). (b) QCM-D adsorption profiles for fibrinogen (Fg) on different surfaces afterpreadsorption of fish protein extract. Reprinted with permission from Pillai et al. [354].Copyright (2009) American Chemical Society
be used to assess unwanted tissue growth on implants or other medical devices. Forexample, in the assessment of the use of an aqueous fish protein extract (FPE) toprevent non-specific fibrinogen adhesion to a range of surfaces [354]. Experiments wereperformed both by preadsorbing FPE to the substrates then adding a test protein(Figure 26b), and adding FPE after the adsorption of test proteins to check for its
ability to out-compete previously attached molecules. Of the four substrates used (gold(Au), stainless steel (SS), silicone dioxide (SiO2) and polystyrene (PS)), FPE was shownto adsorb most effectively to gold, while polystyrene exhibited the least FPE adsorption(Figure 26a). These surfaces are different and it is difficult to fully explain the adsorptionbehaviour. For example, the limited adsorption on polystyrene is likely to be due to acombination of the smoothness of the polystyrene compared to the other surfaces, and itshydrophobicity. Increased surface hydrophobicity means that the adsorbed proteins mayhave a smaller, more collapsed, conformation; the entropic penalty of water being closeto the sample surface results in the proteins being less hydrated. (This depends on therelative balance of interactions between polymer, fluid, and surface.) In contrast, morehydrophilic silicon oxide, gold, and stainless steel surfaces encourage protein swelling,enabling a more elongated polymer conformation and allowing easier diffusion towardsthe surface.
Adsorbed FPE was effective at preventing fibrinogen adsorption (Figure 26b), butless so human serum albumin (HSA). HSA is comparatively small, which may allow itto exploit any gaps in the adsorbed FPE layer (there is also a lower entropic cost tostretch a small chain towards a surface compared to a long one e.g. HSA compared tofibrinogen) [354]. It was also shown that the orientation of FPE in the adsorbed layerdid not affect the repellant properties, irrespective of test protein. This independenceof adsorption blocking and molecular arrangement in the layer indicates that stericrepulsion is the main contributor to the repulsion and so is independent of substrate.The post-fibrinogen/HSA FPE addition experiments showed that FPE is able to replacepre-adsorbed HSA and fibrinogen, indicating that the interfacial energy is comparativelylower for an FPE coating than for fibrinogen or HSA.
Of the four substrates tested, the three hydrophilic surfaces showed more FPE lossupon rinsing (Figure 26a), suggesting that the more hydrated proteins are less stronglybound than those on the polystyrene. Consideration of the dissipation confirmed thisby suggesting that the protein on the hydrophilic surfaces exhibited more viscoelastic(hydrated) behaviour. The observed differences in levels of FPE on the contrastingsurfaces could be at least partly explained by the amount of water close to the surfaceand involved in protein swelling [354]. Here, however, is an example of the compromisesinvolved in such experiments. The higher energy hydrophilic surfaces are not expectedto have many contact points with the proteins, but where they exist, it is quite possiblethat they are very adhesive. The hydrophobic surfaces are unlikely to have strongcontacts, but the number of these contacts ensures that the proteins remain bound to thesurface. In the case of these experiments, the hydrophobic surfaces retained more proteinthan the hydrophilic ones after rinsing, but a true test of how strongly the proteins arebound would require direct measurements using, for example, SMFS. The benefit of thiscombined approach is becoming more widely appreciated, with SMFS being employedincreasingly in partnership with QCM-D measurements. This enables bulk behaviourto be linked to the adhesion strength of individual molecules and individual bindingsites along the length of a single molecule [355, 356, 357]. An example of this is the
interaction of 16 amino acid-long random coil peptides with different inorganic surfaces,where a positive trend was observed between the total mass uptake as measured withQCM-D and the single molecule adhesion force on the same test substrate [358].
The creation of protein-resistant surfaces is directed towards retarding adsorptionrather than stopping it; ultimately resistance is futile and surfaces will be coated. QCM-D remains an attractive technique for the study of the growth of biofilms in order tohelp address the mechanism of formation. The formation of biofilms is ubiquitous butdifferent processes occur as the bacteria attach to the surface from an initial deposition toa final virtually immovable film. The early stages of this process are notoriously complexand can be followed in real time using QCM-D [359]. Considerable effort is devoted tothe preparation of hydrophilic protein-resistant surfaces [351, 360, 361, 362], and it isalso possible to convey protein resistance to hydrophobic polymers, by decorating themwith hydrophilic side chains [363, 364].
5. Conclusions
The importance of polymers at surfaces and interfaces has developed over the pastthirty years from fundamental concepts to being applied in different technologies forcoatings, lubrication, and electronics amongst others. The state-of-the-art has developedto include non-uniform structured surfaces and, particularly, biomaterials. Despiteimpressive developments, many areas of polymer surface science still remain unclear.The role of surfaces in crystallization is still the subject of much research, as is the effectof aging on thin films. However, whereas twenty years ago, much of our understandingof polymer films was achieved by the use of depth profiling techniques, today it isatomic force microscopy-based techniques that provide much of our information. Inthis review the use of force spectroscopy in particular has been highlighted. Here,polymers in inaccessible environments can be interrogated. This is of great utility inour understanding of living cells. The ability to quantify specific interactions, andmeasure their strength in media that work as a proxy for real-world environments isparticularly important.
The outlook is difficult to predict given the rapid progress made in biopolymers atsurfaces as well as polymer electronics over the past twenty years. However, controllingthe behaviour of polymers at surfaces will receive substantial attention, with significanteffort dedicated to specific interactions. This is not limited to biological materials,because it is also important in patterning technologies. The solution to the longstandingproblems of crystallization and other areas such as the polymer glass transition [365] maybe closer in the coming years, but it is very likely that a paradigm shift in understandingwould be required, after which case future developments will arrive at a very rapid pace.
Acknowledgement
ARH is grateful to the Engineering and Physical Sciences Research Council for theprovision of a doctoral studentship. Simone Napolitano, Guido Panzarasa, and GünterReiter are acknowledged for the provision of data.
References
[1] M Geoghegan and G Krausch. Wetting at polymer surfaces and interfaces. Prog. Polym. Sci.,28:261–302, 2003.
[2] G Krausch. Surface induced self assembly in thin polymer films. Mater. Sci. Eng. R, 14:1–94,1995.
[3] C J van Oss, R J Good, and M K Chaudhury. The role of van der Waals forces and hydrogenbonds in “hydrophobic interactions” between biopolymers and low energy surfaces. J. ColloidInterface Sci., 111:378–390, 1986.
[4] R R Netz and D Andelman. Neutral and charged polymers at interfaces. Phys. Rep., 380:1–95,2003.
[5] S Reich and Y Cohen. Phase separation of polymer blends in thin films. J. Polym. Sci.: Polym.Phys. Ed., 19:1255–1267, 1981.
[6] Q S Bhatia, D H Pan, and J T Koberstein. Preferential surface adsorption in miscible blends ofpolystyrene and poly(vinyl methyl ether). Macromolecules, 21:2166–2175, 1988.
[7] P J Flory. Principles of Polymer Chemistry. Cornell University Press, Ithaca, 1953.[8] P-G de Gennes. Scaling Concepts in Polymer Physics. Cornell University Press, Ithaca, 1979.[9] M Rubinstein and R H Colby. Polymer Physics. Oxford University Press, Oxford, 2003.
[10] J W Cahn. Critical point wetting. J. Chem. Phys., 66:3667–3672, 1977.[11] I Schmidt and K Binder. Model calculations for wetting transitions in polymer mixtures. J.
Physique, 46:1631–1644, 1985.[12] R A L Jones, E J Kramer, M H Rafailovich, J Sokolov, and S A Schwarz. Surface enrichment in
an isotopic polymer blend film. Phys. Rev. Lett., 62:280–283, 1989.[13] P C Jukes, S Y Heriot, J S Sharp, and R A L Jones. Time-resolved light scattering studies of phase
separation in thin film semiconducting polymer blends during spin-coating. Macromolecules,38:2030–2032, 2005.
[14] S Y Heriot and R A L Jones. An interfacial instability in a transient wetting layer leads to lateralphase separation in thin spin-cast polymer-blend films. Nature Mater., 4:782–786, 2005.
[15] M Souche and N Clarke. Interfacial instability in bilayer films due to solvent evaporation. Eur.Phys. J. E, 28:47–55, 2009.
[16] P Mokarian-Tabari, M Geoghegan, J R Howse, S Y Heriot, R L Thompson, and R A L Jones.Quantitative evaluation of evaporation rate during spin-coating of polymer blend films: Controlof structure through defined-atmosphere solvent-casting. Eur. Phys. J. E, 33:1829–1839, 2010.
[17] S Ebbens, R Hodgkinson, A J Parnell, A Dunbar, S J Martin, P D Topham, N Clarke, and J RHowse. In situ imaging and height reconstruction of phase separation processes in polymerblends during spin coating. ACS Nano, 5:5124–5131, 2011.
[18] Y Mouhamad, P Mokarian-Tabari, N Clarke, R A L Jones, and M Geoghegan. Dynamics ofpolymer film formation during spin coating. J. Appl. Phys., 116:123513, 2014.
[19] M Mears, D S Tarmey, and M Geoghegan. Single macromolecule diffusion in confinedenvironments. Macromol. Rapid Commun., 32:1411–1418, 2011.
[20] S A Sukhishvili, Y Chen, J D Mller, E Gratton, K S Schweizer, and S Granick. Diffusion ofa polymer ‘pancake’. Nature, 406:146, 2000.
[21] J Zhao and S Granick. Polymer lateral diffusion at the solid liquid interface. J. Am. Chem. Soc.,126:6242–6243, 2004.
[22] P Burgos, Z Zhang, R Golestanian, G J Leggett, and M Geoghegan. Directed single moleculediffusion triggered by surface energy gradients. ACS Nano, 3:3235–3243, 2009.
[23] G E Khalil, A M Adawi, A M Fox, A Iraqi, and D G Lidzey. Single molecule spectroscopy ofred- and green-emitting fluorene-based copolymers. J. Chem. Phys., 130:044903, 2009.
[24] M J Rust, M Bates, and X Zhuang. Sub-diffraction-limit imaging by stochastic opticalreconstruction microscopy (STORM). Nature Meth., 3:793–796, 2006.
[25] N Mullin and J K Hobbs. Direct imaging of polyethylene films at single-chain resolution withtorsional tapping atomic force microscopy. Phys. Rev. Lett., 107:197801, 2011.
[26] N Kalashnyk, J T Nielsen, E H Nielsen, T Skrydstrup, D E Otzen, E Lgsgaard, C Wang,F Besenbacher, N C Nielsen, and T R Linderoth. Scanning tunneling microscopy revealssingle-molecule insights into the self-assembly of amyloid fibrils. ACS Nano, 6:6882–6889,2012.
[27] L Gross, F Mohn, N Moll, P Liljeroth, and G Meyer. The chemical structure of a moleculeresolved by atomic force microscopy. Science, 325:1110–1114, 2009.
[28] A D L Humphris, M J Miles, and J K Hobbs. A mechanical microscope: High-speed atomic forcemicroscopy. Appl. Phys. Lett., 86:034106, 2005.
[29] N Kodera, D Yamamoto, R Ishikawa, and T Ando. Video imaging of walking myosin V byhigh-speed atomic force microscopy. Nature, 468:72–76, 2010.
[30] I Raguzin, G Stoychev, M Stamm, and L Ionov. Single molecule investigation of complexes ofoppositely charged bottle brushes. Soft Matter, 9:359–364, 2013.
[31] X Michalet and S Weiss. Single-molecule spectroscopy and microscopy. C. R. Phys., 3:619–644,2002.
[32] D A Smith, D J Brockwell, R C Zinober, A W Blake, G S Beddard, P D Olmsted, and S ERadford. Unfolding dynamics of proteins under applied force. Phil. Trans. R. Soc. London A,361:713–730, 2003.
[33] M Hughes and L Dougan. The physics of pulling polyproteins: a review of single molecule forcespectroscopy using the AFM to study protein unfolding. Rep. Prog. Phys., 79:076601, 2016.
[34] Y F Dufrêne. Using nanotechniques to explore microbial surfaces. Nature Rev. Microbiol., 2:451–460, 2004.
[35] P F van Hutten, V V Krasnikov, and G Hadziioannou. Role of interfaces in semiconductingpolymer optoelectronic devices. In W R Salaneck, K Seki, A Kahn, and J-J Pireaux, editors,Conjugated Polymer and Molecular Interfaces, pages 113–152. Marcel Dekker, New York, 2001.
[36] M Grell. Electronic and electro-optic molecular materials and devices. In R W Kelsall, I WHamley, and M Geoghegan, editors, Nanoscale Science and Technology, pages 282–342. Wiley,Chichester, 2005.
[37] M Geoghegan and G Hadziioannou. Polymer Electronics. Oxford University Press, Oxford, 2013.[38] C Groves. Simulating charge transport in organic semiconductors and devices: a review. Rep.
Prog. Phys., 80:026502, 2017.[39] D S Goodsell and A J Olson. Structural symmetry and protein function. Annu. Rev. Biophys.
Biomol. Struct., 29:105–153, 2000.[40] D Lee, O Redfern, and C Orengo. Predicting protein function from sequence and structure.
Nature Rev. Mol. Cell Biol., 8:995–1005, 2007.[41] J N Israelachvili. Intermolecular and Surface Forces 3rd ed. Academic Press, Massachusetts,
2011.[42] W M Dunne. Bacterial adhesion: Seen any good biofilms lately? Clin. Microbiol. Rev., 15:155–
166, 2002.[43] J R Banavar and A Maritan. Physics of proteins. Annu. Rev. Biophys. Biomol. Struct., 36:261–
280, 2007.[44] M Tsutsumi and J M Otaki. Parallel and antiparallel β-strands differ in amino acid composition
and availability of short constituent sequences. J. Chem. Inf. Model., 51:1457–1464, 2011.[45] J R Banavar, T X Hoang, F Seno, A Trovato, and A Maritan. Protein sequence and structure:
Is one more fundamental than the other? J. Stat. Phys., 148:637–646, 2012.[46] J C Vickerman. Surface Analysis — The Principal Techniques. Wiley, Chichester, 1997.[47] A B Rodríguez, M M Voigt, S J Martin, T J Whittle, R M Dalgliesh, R L Thompson, D G
Lidzey, and M Geoghegan. Structure of films of poly(3,4-ethylene dioxythiophene)-poly(styrenesulfonate) crosslinked with glycerol. J. Mater. Chem., 21:19324–19330, 2011.
[48] T Nyberg. An alternative method to build organic photodiodes. Synth. Met., 140:281–286, 2004.[49] F Zhang, M Johansson, M R Andersson, J C Hummelen, and O Inganäs. Polymer photovoltaic
cells with conducting polymer anodes. Adv. Mater., 14:662–665, 2002.[50] G Greczynski, T Kugler, and W R Salaneck. Characterization of the pedot-pss system by means
of x-ray and ultraviolet photoelectron spectroscopy. Thin Solid Films, 354:129–135, 1999.[51] P C Jukes, S J Martin, A M Higgins, M Geoghegan, R A L Jones, S Langridge, A Wehrum,
and S Kirchmeyer. Controlling the surface composition of poly(3,4-ethylene dioxythiophene)-poly(styrene sulfonate) blends by heat treatment. Adv. Mater., 16:807–811, 2004.
[52] J Y Lim, J C Hansen, C A Siedlecki, R W Hengstebeck, J Cheng, N Winograd, and H J Donahue.Osteoblast adhesion on poly(l-lactic acid)/polystyrene demixed thin film blends: effect ofnanotopography, surface chemistry, and wettability. Biomacromolecules, 6:3319–3327, 2005.
[53] R G Harrison. The reaction of embryonic cells to solid structures. J. Expt. Zool., 17:521–544,1914.
[54] H N Kim, A Jiao, N S Hwang, M S Kim, D H Kang, D H Kim, and K-Y Suh. Nanotopography-guided tissue engineering and regenerative medicine. Adv. Drug Deliv. Rev., 65:536–558, 2013.
[55] S N Magonov and D H Reneker. Characterization of polymer surfaces with atomic forcemicroscopy. Annu. Rev. Mater. Sci., 27:175–222, 1997.
[56] A Knoll, R Magerle, and G Krausch. Tapping mode atomic force microscopy on polymers: Whereis the true sample surface? Macromolecules, 34:4159–4165, 2001.
[57] G Amontons. De la resistance causée dans les machines. Hist. Acad. R. Sci., pages 206–227,1699.
[58] G J Leggett, N J Brewer, and K S L Chong. Friction force microscopy: towards quantitativeanalysis of molecular organisation with nanometre spatial resolution. Phys. Chem. Chem.Phys., 7:1107–1120, 2005.
[59] T Kajiyama, K Tanaka, N Satomi, and A Takahara. Surface relaxation process of monodispersepolystyrene film based on lateral force microscopic measurements. Macromolecules, 31:5150–5151, 1998.
[60] M Raftari, Z J Zhang, S R Carter, G J Leggett, and M Geoghegan. Nanoscale contact mechanicsbetween two grafted polyelectrolyte surfaces. Macromolecules, 48:6272–6279, 2015.
[61] A Cadby, G Khalil, A M Fox, and D G Lidzey. Mapping exciton quenching in photovoltaic-applicable polymer blends using time-resolved scanning near-field optical microscopy. J. Appl.Phys., 103:093715, 2008.
[62] P Vettiger, M Despont, U Drechsler, U Durig, W Haberle, MI Lutwyche, H E Rothuizen, R Stutz,R Widmer, and G K Binnig. The “millipede” — more than one thousand tips for future AFMdata storage. IBM J. Res. Dev., 44:323–340, 2000.
[63] E ul Haq, Z Liu, Y Zhang, S A Alang Ahmad, L-S Wong, S P Armes, J K Hobbs, G J Leggett,J Micklefield, C J Roberts, and J M R Weaver. Parallel scanning near-field photolithography:The Snomipede. Nano Lett., 10:4375–4380, 2010.
[64] F Huo, G Zheng, X Liao, L R Giam, J Chai, X Chen, W Shim, and C A Mirkin. Beam penlithography. Nature Nanotech., 5:637–640, 2010.
[65] Z Zhang, M R Tomlinson, R Golestanian, and M Geoghegan. The interfacial behaviour of singlepoly(N,N -dimethylacrylamide) chains as a function of pH. Nanotechnology, 19:035505, 2008.
[66] W Zhang and X Zhang. Single molecule mechanochemistry of macromolecules. Prog. Polym.Sci., 28:1271–1295, 2003.
[67] S Minko and Y Roiter. AFM single molecule studies of adsorbed polyelectrolytes. Curr. Opin.Colloid Interface Sci., 10:9–15, 2005.
[68] R Merkel. Force spectroscopy on single passive biomolecules and single biomolecular bonds.Phys. Rep., 346:343–385, 2001.
[69] M I Giannotti and G J Vancso. Interrogation of single synthetic polymer chains andpolysaccharides by AFM-based force spectroscopy. ChemPhysChem, 8:2290–2307, 2007.
[70] T A Camesano, Y Liu, and M Datta. Measuring bacterial adhesion at environmental interfaceswith single-cell and single-molecule techniques. Adv. Water Resour., 30:1470–1491, 2007.
[71] M Hermansson. The dlvo theory in microbial adhesion. Colloids Surf. B, 14:105–119, 1999.[72] T A Camesano and B E Logan. Probing bacterial electrosteric interactions using atomic force
microscopy. Environ. Sci. Technol., 34:3354–3362, 2000.[73] N I Abu-Lail and T A Camesano. Role of ionic strength on the relationship of biopolymer
conformation, DLVO contributions, and steric interactions to bioadhesion of Pseudomonasputida KT2442. Biomacromolecules, 4:1000–1012, 2003.
[74] L S Dorobantu, S Bhattacharjee, Julia M Foght, and M R Gray. Analysis of force interactionsbetween afm tips and hydrophobic bacteria using dlvo theory. Langmuir, 25:6968–6976, 2009.
[75] J M Thwala, M Li, M C Y Wong, S Kang, E M V Hoek, and B B Mamba. Bacteria–polymericmembrane interactions: Atomic force microscopy and XDLVO predictions. Langmuir,29:13773–13782, 2013.
[76] G Francius, R Henry, J F L Duval, E Bruneau, J Merlin, A Fahs, and N Leblond-Bourget.Thermo-regulated adhesion of the Streptococcus thermophilus δrgg0182 strain. Langmuir,29:4847–4856, 2013.
[77] Y Chen, H J Busscher, H C van der Mei, and W Norde. Statistical analysis of long- and short-range forces involved in bacterial adhesion to substratum surfaces measured using afm. Appl.Environ. Microbiol., 77:5065–5070, 2011.
[78] J Ubbink and P Schär-Zammaretti. Probing bacterial interactions: integrated approachescombining atomic force microscopy, electron microscopy and biophysical techniques. Micron,36:293–320, 2005.
[79] P Polyakov, C Soussen, J Duan, J F L Duval, D Brie, and G Francius. Automated force volumeimage processing for biological samples. PLoS One, 6:e18887, 2011.
[80] T A Camesano and N I Abu-Lail. Heterogeneity in bacterial surface polysaccharides, probed ona single-molecule basis. Biomacromolecules, 3:661–667, 2002.
[81] M Castelain, E Koutris, M Andersson, K Wiklund, O Björnham, S Schedin, and O Axner.Characterization of the biomechanical properties of T4 pili expressed by Streptococcuspneumoniae—a comparison between helix-like and open coil-like pili. ChemPhysChem,10:1533–1540, 2009.
[82] C Bustamante, J F Marko, E D Siggia, and S Smith. Entropic elasticity of λ-phage DNA.Science, 265:1599–1600, 1994.
[83] Y Muroga, T Yoshida, and S Kawaguchi. Conformation of poly(methacrylic acid) in acidicaqueous solution studied by small angle X-ray scattering. Biophys. Chem., 81:45–57, 1999.
[84] A J Parnell, S J Martin, C C Dang, M Geoghegan, R A L Jones, C J Crook, J R Howse, and A JRyan. Synthesis, characterization and swelling behaviour of poly(methacrylic acid) brushessynthesized using atom transfer radical polymerization. Polymer, 50:1005–1014, 2009.
[85] N I Abu-Lail and T A Camesano. Elasticity of Pseudomonas putida kt2442 surface polymersprobed with single-molecule force microscopy. Langmuir, 18:4071–4081, 2002.
[86] B H Lower, R Yongsunthon, F P Vallano III, and S K Lower. Simultaneous force and fluorescencemeasurements of a protein that forms a bond between a living bacterium and a solid surface.J. Bacteriol., 187:2127–2137, 2005.
[87] M Diao, E Taran, S Mahler, T A H Nguyen, and A V Nguyen. Quantifying adhesion of acidophilicbioleaching bacteria to silica and pyrite by atomic force microscopy with a bacterial probe.Colloids Surf. B, 115:229–236, 2013.
[88] Y Hu, J Ulstrup, J Zhang, S Molin, and V Dupres. Adhesive properties of Staphylococcusepidermidis probed by atomic force microscopy. Phys. Chem. Chem. Phys., 13:9995–10003,
2011.[89] J Struckmeier, R Wahl, M Leuschner, J Nunes, H Janovjak, U Geisler, G Hofmann, T Jähnke,
and D J Müller. Fully automated single-molecule force spectroscopy for screening applications.Nanotechnology, 19:384020, 2008.
[90] S Yamamoto, Y Tsujii, and T Fukuda. AFM study of stretching a single polymer chain in apolymer brush. Macromolecules, 33:5995–5998, 2000.
[91] S Al-Maawali, J E Bemis, B B Akhremitchev, R Leecharoen, B G Janesko, and G C Walker.Study of the polydispersity of grafted poly(dimethylsiloxane) surfaces using single-moleculeatomic force microscopy. J. Phys. Chem. B, 105:3965–3971, 2001.
[92] D Goodman, J N Kizhakkedathu, and D E Brooks. Molecular weight and polydispersityestimation of adsorbing polymer brushes by atomic force microscopy. Langmuir, 20:3297–3303,2004.
[93] D Goodman, J N Kizhakkedathu, and D E Brooks. Evaluation of an atomic force microscopypull-off method for measuring molecular weight and polydispersity of polymer brushes: Effectof grafting density. Langmuir, 20:6238–6245, 2004.
[94] S Cuenot, S Gabriel, R Jérôme, C Jérôme, C-A Fustin, A M Jonas, and A-S Duwez. First insightsinto electrografted polymers by AFM-based force spectroscopy. Macromolecules, 39:8428–8433,2006.
[95] A AL-Baradi, M R Tomlinson, Z J Zhang, and M Geoghegan. Determination of the molar massof surface-grafted weak polyelectrolyte brushes using force spectroscopy. Polymer, 67:111–117,2015.
[96] J D Willott, T J Murdoch, G B Webber, and E J Wanless. Nature of the specific anionresponse of a hydrophobic weak polyelectrolyte brush revealed by AFM force measurements.Macromolecules, 49:2327–2338, 2016.
[97] T Tischer, R Gralla-Koser, V Trouillet, L Barner, C Barner-Kowollik, and C Lee-Thedieck.Direct mapping of RAFT controlled macromolecular growth on surfaces via single moleculeforce spectroscopy. ACS Macro Lett., 5:498–503, 2016.
[98] S Tadigadapa and K Mateti. Piezoelectric MEMS sensors: state-of-the-art and perspectives.Meas. Sci. Technol., 20:092001, 2009.
[99] G Gautschi. Background of piezoelectric sensors. In Piezoelectric Sensorics, pages 5–11. Springer-Verlag, Berlin, 2002.
[100] K A Marx. Quartz crystal microbalance: A useful tool for studying thin polymer films andcomplex biomolecular systems at the solution-surface interface. Biomacromolecules, 4:1099–1120, 2003.
[101] F Höök, M Rodahl, P Brezezinski, and B Kasemo. Energy dissipation kinetics for proteinand antibody - antigen adsorption under shear oscillation on a quartz crystal microbalance.Langmuir, 14:729–734, 1998.
[102] F Höök, B Kasemo, T Nylander, C Fant, K Sott, and H Elwing. Variations in coupled water,viscoelastic properties, and film thickness of a Mefp-1 protein film during adsorption and cross-linking: A quartz crystal microbalance with dissipation monitoring, ellipsometry, and surfaceplasmon resonance study. Anal. Chem., 73:5796–5804, 2001.
[103] E F Irwin, J E Ho, S R Kane, and K E Healy. Analysis of interpenetrating polymer networksvia quartz crystal microbalance with dissipation monitoring. Langmuir, 21:5529–5536, 2005.
[104] M Rodahl, F Höök, C Fredriksson, C A Keller, A Krozer, P Brzezinski, M Voinova, and B Kasemo.Simultaneous frequency and dissipation factor QCM measurements of biomolecular adsorptionand cell adhesion. Faraday Discuss., 107:229–246, 1997.
[105] M Edvardsson, S Svedhem, G Wang, R Richter, M Rodahl, and B Kasemo. QCM-D andreflectometry instrument: Applications to supported lipid structures and their biomolecularinteractions. Anal. Chem., 81:349–361, 2009.
[106] K K Kanazawa and J G Gordon. Frequency of a quartz microbalance in contact with liquid.Anal. Chem., 57:1770–1771, 1985.
[107] S Geißler, A Barrantes, P Tengvall, P B Messersmith, and H Tiainen. Deposition kinetics ofbioinspired phenolic coatings on titanium surfaces. Langmuir, 32:8050–8060, 2016.
[108] A R Ferhan, J A Jackman, and N-J Cho. Integration of quartz crystal microbalance-dissipationand reflection-mode localized surface plasmon resonance sensors for biomacromolecularinteraction analysis. Anal. Chem., 88:12524–12531, 2016.
[109] Z Zhang, Y Pen, R G J Edyvean, S A Banwart, R M Dalgliesh, and M Geoghegan. Adhesiveand conformational behaviour of mycolic acid monolayers. Biochim. Biophys. Acta, 1798:1829–1839, 2010.
[110] J Penfold and R K Thomas. The application of the specular reflection of neutrons to the studyof surfaces and interfaces. J. Phys.: Condens. Matter, 2:1369–1412, 1990.
[111] T P Russell. X-ray and neutron reflectivity for the investigation of polymers. Mater. Sci. Rep.,5:171–271, 1990.
[112] G Reiter and M Geoghegan. Avantages de la réflectométrie des neutrons pour l’étude despolymères en couches minces. In A Brûlet and G Chaboussant, editors, École ThématiqueSurfaces, Interfaces, Milieux Confinés par Diffusion de Neutrons, volume 8 of Collection de laSociété Française de la Neutronique, pages 103–113. EDP Sciences, Les Ulis, 2007.
[113] D G Bucknall and J S Higgins. Neutron reflection studies of polymer-polymer interfaces.In H Hommell, editor, Polymer Surfaces and Interfaces - a Versatile Combination: RecentResearch Developments in Polymer Science, pages 161–199. Research Signpost, Trivandrum,India, 1998.
[114] A Liebmann-Vinson, L M Lander, M D Foster, W J Brittain, E A Vogler, C F Majkrzak, andS Satija. A neutron reflectometry study of human serum albumin adsorption in situ. Langmuir,12:2256–2262, 1996.
[115] A Diethert and P Müller-Buschbaum. Probing the near-surface composition profile of pressuresensitive adhesive films with x-ray reflectivity. J. Adhes., 87:1167–1190, 2011.
[116] R Schach, Y Tran, A Menelle, and C Creton. Role of chain interpenetration in the adhesionbetween immiscible polymer melts. Macromolecules, 40:6325–6332, 2007.
[117] R La Spina, M R Tomlinson, L Ruiz-Pérez, A Chiche, S Langridge, and M Geoghegan. Controllingnetwork-brush interactions to achieve switchable adhesion. Angew. Chem. Int. Ed., 46:6460–6463, 2007.
[118] G Sudre, D Hourdet, C Creton, F Cousin, and Y Tran. Probing pH-responsive interactionsbetween polymer brushes and hydrogels by neutron reflectivity. Langmuir, 30:9700–9706, 2014.
[119] C White, K T Tan, D Hunston, K Steffens, D L Stanley, S K Satija, B Akgun, and B D Vogt.Mechanisms of criticality in environmental adhesion loss. Soft Matter, 11:3994–4001, 2015.
[120] L Alfhaid, R La Spina, M R Tomlinson, A R Hall, W D Seddon, Williams N H, F Cousin,S Gorb, and Geoghegan M. Adhesion between oppositely charged polyelectrolytes. J. Adhes.,93:10.1080/00218464.2016.1265947, 2017.
[121] G Coulon, T P Russell, V R Deline, and P F Green. Surface-induced orientation of symmetric,diblock copolymers: A secondary ion mass spectrometry study. Macromolecules, 22:2581–2589,1989.
[122] S A Schwarz, B J Wilkens, M A A Pudensi, M H Rafailovich, J Sokolov, X Zhao, W Zhao,X Zheng, T P Russell, and R A L Jones. Studies of surface and interface segregation inpolymer blends by secondary ion mass spectrometry. Mol. Phys., 76:937–950, 1992.
[123] M Geoghegan. MeV ion beam profiling of polymer surfaces and interfaces. In R W Richardsand S K Peace, editors, Polymer Surfaces and Interfaces III, pages 43–73. Wiley, Chichester,1999.
[124] R J Composto, R M Walters, and J Genzer. Application of ion scattering techniques tocharacterize polymer surfaces and interfaces. Mater. Sci. Eng. R, 38:107–180, 2002.
[125] H Geiger and E Marsden. On a diffuse reflection of the α-particles. Proc. R. Soc. London A,82:495–500, 1909.
[126] J F Ziegler, J P Biersack, and U Littmark. The Stopping Powers and Ranges of Ions in Solids.
Pergamon Press, New York, 1985.[127] E L Jablonski, R E Gorga, and B Narasimhan. Interdiffusion and phase behavior at
homopolymer/random copolymer interfaces. Polymer, 44:729–741, 2003.[128] P J Mills, C J Palmstrøm, and E J Kramer. Concentration profiles of non-Fickian diffusants
in glassy polymers by Rutherford backscattering spectrometry. J. Mater. Sci., 21:1479–1486,1986.
[129] M S Kunz, K R Shull, and A J Kellock. Colloidal gold dispersions in polymeric matrices. J.Colloid Interface Sci., 156:240–249, 1993.
[130] J Choi, M Cargnello, C B Murray, N Clarke, K I Winey, and R J Composto. Fast nanoroddiffusion through entangled polymer melts. ACS Macro Lett., 4:952–956, 2015.
[131] E J Kramer, P Green, and C J Palmstrøm. Interdiffusion and marker movements in concentratedpolymer–polymer diffusion couples. Polymer, 25:473–480, 1984.
[132] M Geoghegan, R A L Jones, A S Clough, and J Penfold. The morphology of as-cast films of apolymer blend: Dependence on polymer molecular weight. J. Polym. Sci. B: Polym. Phys.,33:1307–1311, 1995.
[133] U K Krieger, T Huthwelker, C Daniel, U Weers, T Peter, and W A Lanford. Rutherfordbackscattering to study the near-surface region of volatile liquids and solids. Science, 295:1048–1050, 2002.
[134] F Mathis, B Moignard, L Pichon, O Dubreuil, and J Salomon. Coupled PIXE and RBS usinga 6 MeV 4He2+ external beam: A new experimental device for particle detection and dosemonitoring. Nucl. Instr. Meth. B, 240:532–538, 2005.
[135] T Young. An essay on the cohesion of fluids. Phil. Trans. R. Soc. London, 95:65–87, 1805.[136] Y Xu, M Takai, and K Ishihara. Protein adsorption and cell adhesion on cationic, neutral, and
anionic 2-methacryloyloxyethyl phosphorylcholine copolymer surfaces. Biomaterials, 30:4930–4938, 2009.
[137] S Farris, L Introzzi, P Biagioni, T Holz, A Schiraldi, and L Piergiovanni. Wetting of biopolymercoatings: Contact angle kinetics and image analysis investigation. Langmuir, 27:7563–7574,2011.
[138] Y Xu, M Takai, and K Ishihara. Phospholipid polymer biointerfaces for lab-on-a-chip devices.Ann. Biomed. Eng., 38:1938–1953, 2010.
[139] H Shahsavan, D Arunbabu, and B Zhao. Biomimetic modification of polymeric surfaces: Apromising pathway for tuning of wetting and adhesion. Macromol. Mater. Eng., 297:743–760,2012.
[140] P G Gezer, S Brodsky, A Hsiao, G L Liu, and J L Kokini. Modification of thehydrophilic/hydrophobic characteristic of zein film surfaces by contact with oxygen plasmatreated PDMS and oleic acid content. Colloids Surf. B, 135:433–440, 2015.
[141] A E Wiącek, K Terpiłowski, M Jurak, and M Worzakowska. Low-temperature air plasmamodification of chitosan-coated PEEK biomaterials. Polym. Test., 50:325–334, 2016.
[142] C-H Lin, Y-H Yeh, W-C Lin, and M-C Yang. Novel silicone hydrogel based on PDMS andPEGMA for contact lens application. Colloids Surf. B, 123:986–994, 2014.
[143] M Bianco, V Guarino, G Maruccio, G Galli, E Martinelli, G Montani, R Rinaldi, and V Arima.Non-biofouling fluorinated block copolymer coatings for contact lenses. Sci. Adv. Mater.,7:1387–1394, 2015.
[144] W Cheng, C Yang, X Ding, A C Engler, J L Hedrick, and Y Y Yang. Broad-spectrumantimicrobial/antifouling soft material coatings using poly(ethylenimine) as a tailorablescaffold. Biomacromolecules, 16:1967–1977, 2015.
[145] S M Paterson, L Liu, M A Brook, and H Sheardown. Poly(ethylene glycol)-or silicone-modifiedhyaluronan for contact lens wetting agent applications. J. Biomed. Mater. Res. A, 103:2602–2610, 2015.
[146] X Hu and X Gong. A new route to fabricate biocompatible hydrogels with controlled drugdelivery behavior. J. Colloid Interface Sci., 470:62–70, 2016.
[147] F Lasowski and H Sheardown. Atropine and roscovitine release from model silicone hydrogels.Optom. Vis. Sci., 93:404–411, 2016.
[148] A Milionis, R Ruffilli, and I S Bayer. Superhydrophobic nanocomposites from biodegradablethermoplastic starch composites (Mater-Bi R©), hydrophobic nano-silica and lycopodium spores.RSC Adv., 4:34395–34404, 2014.
[149] J P de Silva, M Geoghegan, A M Higgins, G Krausch, M-O David, and G Reiter. Switching layerstability in a polymer bilayer by thickness variation. Phys. Rev. Lett., 98:267802, 2007.
[150] M Ilton, P Stasiak, M W Matsen, and K Dalnoki-Veress. Quantized contact angles in thedewetting of a structured liquid. Phys. Rev. Lett., 112:068303, 2014.
[151] G Reiter, M Hamieh, P Damman, S Sclavons, S Gabriele, T Vilmin, and E Raphaël. Residualstresses in thin polymer films cause rupture and dominate early stages of dewetting. NatureMater., 4:754–758, 2005.
[152] A Silberberg. Distribution of conformations and chain ends near the surface of a melt of linearflexible macromolecules. J. Colloid Interface Sci., 90:86–91, 1982.
[153] N Rehse, C Wang, M Hund, M Geoghegan, R Magerle, and G Krausch. Stability of thin polymerfilms on a corrugated substrate. Eur. Phys. J. E, 4:69–76, 2001.
[154] J-U Sommer. About the role of non-equilibrium effects for polymers at surfaces. Eur. Phys. J.E, 9:417–419, 2002.
[155] M Geoghegan, C Wang, N Rehse, R Magerle, and G Krausch. Thin polymer films on chemicallypatterned, corrugated substrates. J. Phys.: Condens. Matter, 17:S389–S402, 2005.
[156] R Mukherjee and A Sharma. Instability, self-organization and pattern formation in thin softfilms. Soft Matter, 11:8717–8740, 2015.
[157] K M Ashley, D Raghavan, J F Douglas, and A Karim. Wetting-dewetting transition line in thinpolymer films. Langmuir, 21:9518–9523, 2005.
[158] P Damman, S Gabriele, S Coppé, S Desprez, D Villers, T Vilmin, E Raphaël, M Hamieh,S Al Akhrass, and G Reiter. Relaxation of residual stress and reentanglement of polymersin spin-coated films. Phys. Rev. Lett., 99:036101, 2007.
[159] S Al Akhrass, G Reiter, S Y Hou, M H Yang, Y L Chang, F C Chang, C F Wang, and A C-MYang. Viscoelastic thin polymer films under transient residual stresses: Two stage dewettingon soft substrates. Phys. Rev. Lett., 100:178301, 2008.
[160] P Lambooy, K C Phelan, O Haugg, and G Krausch. Dewetting at the liquid-liquid interface.Phys. Rev. Lett., 76:1110–1113, 1996.
[161] F Brochard Wyart, P Martin, and C Redon. Liquid/liquid dewetting. Langmuir, 9:3682–3690,1993.
[162] R Fetzer, K Jacobs, A Münch, B Wagner, and T P Witelski. New slip regimes and the shape ofdewetting thin liquid films. Phys. Rev. Lett., 95:127801, 2005.
[163] O Bäumchen, R Fetzer, M Klos, M Lessel, L Marquant, H Hähl, and K Jacobs. Slippage andnanorheology of thin liquid polymer films. J. Phys.: Condens. Matter, 24:325102, 2012.
[164] D Gentili, G Foschi, F Valle, M Cavallini, and F Biscarini. Applications of dewetting in microand nanotechnology. Chem. Soc. Rev., 41:4430–4443, 2012.
[165] H Sirringhaus, T Kawase, R H Friend, T Shimoda, M Inbasekaran, W Wu, and E P Woo. High-resolution inkjet printing of all-polymer transistor circuits. Science, 290:2123–2126, 2000.
[166] J Z Wang, Z H Zheng, H W Li, W T S Huck, and H Sirringhaus. Dewetting of conductingpolymer inkjet droplets on patterned surfaces. Nature Mater., 3:171–176, 2004.
[167] Y Xia and G M Whitesides. Soft lithography. Angew. Chem. Int. Ed., 37:550–575, 1998.[168] H-L Zhang, D G Bucknall, and A Dupuis. Uniform nanoscopic polystyrene patterns produced
from a microscopic mold. Nano Lett., 4:1513–1519, 2004.[169] E Bystrenova, M Facchini, M Cavallini, M G Cacace, and F Biscarini. Multiple length-scale
patterning of DNA by stamp-assisted deposition. Angew. Chem. Int. Ed., 45:4779–4782, 2006.[170] A Verma, S Sekhar, P Sachan, P D S Reddy, and A Sharma. Control of morphologies and length
scales in intensified dewetting of electron beam modified polymer thin films under a liquid

solvent mixture. Macromolecules, 48:3318–3326, 2015.[171] N Bhandaru, A Das, and R Mukherjee. Confinement induced ordering in dewetting of ultra-thin
polymer bilayers on nanopatterned substrates. Nanoscale, 8:1073–1087, 2016.[172] C K Chiang, C R Fincher Jr, Y W Park, A J Heeger, H Shirakawa, E J Louis, S C Gau, and A G
MacDiarmid. Electrical conductivity in doped polyacetylene. Phys. Rev. Lett., 39:1098–1101,1977.
[173] L Groenendaal, F Jonas, D Freitag, H Pielartzik, and J R Reynolds. Poly(3,4-ethylenedioxythiophene) and its derivatives: past, present, and future. Adv. Mater., 12:481–494, 2000.
[174] Y Xia, K Sun, and J Ouyang. Solution-processed metallic conducting polymer films astransparent electrode of optoelectronic devices. Adv. Mater., 24:2436–2440, 2012.
[175] J Rivnay, R M Owens, and G G Malliaras. The rise of organic bioelectronics. Chem. Mater.,26:679–685, 2014.
[176] D T Simon, E O Gabrielsson, K Tybrandt, and M Berggren. Organic bioelectronics: Bridgingthe signaling gap between biology and technology. Chem. Rev., 116:13009–13041, 2016.
[177] F So, B Krummacher, M K Mathai, D Poplavskyy, S A Choulis, and V-E Choong. Recentprogress in solution processable organic light emitting devices. J. Appl. Phys., 102:091101,2007.
[178] H Sirringhaus. Device physics of solution-processed organic field-effect transistors. Adv. Mater.,17:2411–2425, 2005.
[179] A M Higgins, S J Martin, R L Thompson, J Chappell, M Voigt, D G Lidzey, R A L Jones, andM Geoghegan. Surface segregation and self-stratification in blends of spin-cast polyfluorenederivatives. J. Phys.: Condens. Matter, 17:1319–1328, 2005.
[180] J Morgado, E Moons, R H Friend, and F Cacialli. De-mixing of polyfluorene-based blends bycontact with acetone: Electro- and photo-luminescence probes. Adv. Mater., 13:810–814, 2001.
[181] M Voigt, J Chappell, T Rowson, A Cadby, M Geoghegan, R A L Jones, and D G Lidzey.The interplay between the optical and electronic properties of light-emitting-diode applicableconjugated polymer blends and their phase-separated morphology. Org. Electron., 6:35–45,2005.
[182] H W Ro, B Akgun, B T O’Connor, M Hammond, R J Kline, C R Snyder, S K Satija, A L Ayzner,M F Toney, C L Soles, and D M DeLongchamp. Poly(3-hexylthiophene) and [6,6]-phenyl-C-butyric acid methyl ester mixing in organic solar cells. Macromolecules, 45:6587–6599, 2012.
[183] D Deribew, E Pavlopoulou, G Fleury, C Nicolet, C Renaud, S-J Mougnier, L Vignau, E Cloutet,C Brochon, F Cousin, G Portale, M Geoghegan, and G Hadziioannou. Crystallization-driven enhancement in photovoltaic performance through block copolymer incorporation intoP3HT:PCBM blends. Macromolecules, 46:3015–3024, 2013.
[184] M Brinkmann. Structure and morphology control in thin films of regioregular poly(3-hexylthiophene). J. Polym. Sci. B: Polym. Phys., 49:1218–1233, 2011.
[185] J Balko, R H Lohwasser, M Sommer, M Thelakkat, and T Thurn-Albrecht. Determination of thecrystallinity of semicrystalline poly(3-hexylthiophene) by means of wide-angle x-ray scattering.Macromolecules, 46:9642–9651, 2013.
[186] J Mei, K R Graham, R Stalder, and J R Reynolds. Synthesis of isoindigo-based oligothiophenesfor molecular bulk heterojunction solar cells. Org. Lett., 12:660–663, 2010.
[187] T Lei, Y Cao, Y Fan, C-J Liu, S-C Yuan, and J Pei. High-performance air-stable organic field-effect transistors: isoindigo-based conjugated polymers. J. Am. Chem. Soc., 133:6099–6101,2011.
[188] T Lei, J-Y Wang, and J Pei. Design, synthesis, and structure-property relationships of isoindigo-based conjugated polymers. Acc. Chem. Res., 47:1117–1126, 2014.
[189] C Grand, S Baek, T-H Lai, N Deb, W Zajaczkowski, R Stalder, K Mllen, W Pisula, D GBucknall, F So, and J R Reynolds. Structureproperty relationships directing transport andcharge separation in isoindigo polymers. Macromolecules, 49:4008–4022, 2016.
[190] A Keller and S Z D Cheng. The role of metastability in polymer phase transitions. Polymer,39:4461–4487, 1998.
[191] M Muthukumar. Nucleation in polymer crystallization. In S A Rice, editor, Advances in ChemicalPhysics, volume 128, chapter 1, pages 1–63. Wiley, Hoboken, NJ, 2003.
[192] G Strobl. Laws controlling crystallization and melting in bulk polymers. Rev. Mod. Phys.,81:1287–1300, 2009.
[193] J K Hobbs, O E Farrance, and L Kailas. How atomic force microscopy has contributed to ourunderstanding of polymer crystallization. Polymer, 50:4281–4292, 2009.
[194] P D Olmsted, W C K Poon, T C B McLeish, N J Terrill, and A J Ryan. Spinodal-assistedcrystallization in polymer melts. Phys. Rev. Lett., 81:373–376, 1998.
[195] M Durell, J E Macdonald, D Trolley, A Wehrum, P C Jukes, R A L Jones, C J Walker, andG Brown. The role of surface-induced ordering in the crystallisation of PET films. Europhys.Lett., 58:844–850, 2002.
[196] P C Jukes, A Das, M Durell, D Trolley, A M Higgins, M Geoghegan, J E Macdonald, R A LJones, S Brown, and P Thompson. The kinetics of surface crystallization in thin films ofpoly(ethylene terephthalate). Macromolecules, 38:2315–2320, 2005.
[197] K Shinotsuka, V N Bliznyuk, and H E Assender. Near-surface crystallization of PET. Polymer,53:5554–5559, 2012.
[198] R M Michell, I Blaszczyk-Lezak, C Mijangos, and A J Müller. Confinement effects on polymercrystallization: From droplets toalumina nanopores. Polymer, 54:4059–4077, 2013.
[199] B Vanroy, M Wübbenhorst, and S Napolitano. Crystallization of thin polymer layers confinedbetween two adsorbing walls. ACS Macro Lett., 2:168–172, 2013.
[200] S Napolitano, D Prevosto, M Lucchesi, P Pingue, M D’Acunto, and P Rolla. Influence of areduced mobility layer on the structural relaxation dynamics of aluminum capped ultrathinfilms of poly(ethylene terephthalate). Langmuir, 23:2103–2109, 2007.
[201] S Napolitano and M Wübbenhorst. Anomalous decoupling of translational and rotational motionunder 1D confinement, evidences from crystallization and diffusion experiments. In F Kremer,editor, Dynamics in Geometrical Confinement, pages 279–306. Springer, Heidelberg, 2014.
[202] C W Frank, V Rao, M M Despotopoulou, R F W Pease, W D Hinsberg, R D Miller, and J FRabolt. Structure in thin and ultrathin spin-cast polymer films. Science, 273:912–915, 1996.
[203] G Reiter and J-U Sommer. Crystallization of adsorbed polymer monolayers. Phys. Rev. Lett.,80:3771–3774, 1998.
[204] G Reiter and J-U Sommer. Polymer crystallization in quasi-two dimensions. I. Experimentalresults. J. Chem. Phys., 112:4376–4383, 2000.
[205] C H M Weber, A Chiche, G Krausch, S Rosenfeldt, M Ballauff, L Harnau, I Göttker-Schnetmann,Q Tong, and S Mecking. Single lamella nanoparticles of polyethylene. Nano Lett., 7:2024–2029,2007.
[206] L Kinder, J Kanicki, and P M Petroff. Structural ordering and enhanced carrier mobility inorganic polymer thin film transistors. Synth. Met., 146:181–185, 2004.
[207] S Kawana, M Durrell, J Lu, J E Macdonald, M Grell, D D C Bradley, P C Jukes, R A L Jones,and S L Bennett. X-ray diffraction study of the structure of thin polyfluorene films. Polymer,43:1907–1913, 2002.
[208] A Bolognesi, C Botta, C Mercogliano, W Porzio, P C Jukes, M Geoghegan, M Grell, M Durell,D Trolley, A Das, and J E Macdonald. Structural features in aligned poly(3-alkylthiophene)films revealed by grazing incidence x-ray diffraction. Polymer, 45:4133–4138, 2004.
[209] G Lu, J Blakesley, S Himmelberger, P Pingel, J Frisch, I Lieberwirth, I Salzmann, M Oehzelt,R di Pietro, A Salleo, N Koch, and D Neher. Moderate doping leads to high performance ofsemiconductor/insulator polymer blend transistors. Nature Commun., 4:1588, 2013.
[210] A B Rodríguez, M R Tomlinson, S Khodabakhsh, J-F Chang, F Cousin, D Lott, H Sirringhaus,W T S Huck, A M Higgins, and M Geoghegan. All-polymer field effect transistors using abrush gate dielectric. J. Mater. Chem. C, 1:7736–7741, 2013.
[211] M-B Madec, P J Smith, A Malandraki, N Wang, J G Korvink, and S G Yeates. Enhancedreproducibility of inkjet printed organic thin film transistors based on solution processablepolymer-small molecule blends. J. Mater. Chem., 20:9155–9160, 2010.
[212] M-B Madec, D Crouch, G Rincon Llorente, T J Whittle, M Geoghegan, and S G Yeates. Organicfield effect transistors from ambient solution processed low molar mass semiconductor-insulatorblends. J. Mater. Chem., 18:3230–3236, 2008.
[213] J Kang, N Shin, D Y Jang, V M Prabhu, and D Y Yoon. Structure and properties of smallmolecule-polymer blend semiconductors for organic thin film transistors. J. Am. Chem. Soc.,130:12273–12275, 2008.
[214] T Ohe, M Kuribayashi, R Yasuda, A Tsuboi, K Nomoto, K Satori, M Itabashi, and J Kasahara.Solution-processed organic thin-film transistors with vertical nanophase separation. Appl.Phys. Lett., 93:053303, 2008.
[215] J-H Kwon, S-I Shin, K-H Kim, M J Cho, K N Kim, D H Choi, and B-K Ju. Organic thin filmtransistors using 6,13-bis(tri-isopropylsilylethynyl)pentacene embedded into polymer binders.Appl. Phys. Lett., 94:013506, 2009.
[216] J H Park, K H Lee, S Mun, G Ko, S J Heo, J H Kim, E Kim, and S Im. Self-assembly of organicchannel/polymer dielectric layer in solution process for low-voltage thin-film transistors. Org.Electron., 11:1688–1692, 2010.
[217] D T James, B K Kjellander, W T T Smaal, G H Gelinck, C Combe, I McCulloch, R Wilson,J H Burroughes, D D C Bradley, and J-S Kim. Thin-film morphology of inkjet-printedsingle-droplet organic transistors using polarized raman spectroscopy: Effect of blending tips-pentacene with insulating polymer. ACS Nano, 5:9824–9835, 2011.
[218] Z He, D Li, D K Hensley, A J Rondinone, and J Chen. Switching phase separation mode byvarying the hydrophobicity of polymer additives in solution-processed semiconducting small-molecule/polymer blends. Appl. Phys. Lett., 103:113301, 2013.
[219] I Bose, K Tetzner, K Borner, and K Bock. Homogeneous crystallization of micro-dispensed tips-pentacene using a two-solvent system to enable printed inverters on foil substrates. Electronics,4:565–581, 2015.
[220] Z He, J Chen, J K Keum, G Szulczewski, and D Li. Improving performance of tips pentacene-based organic thin film transistors with small-molecule additives. Org. Electron., 15:150–155,2014.
[221] M-B Madec, D J Crouch, G Rincon-Llorente, T J Whittle, M Geoghegan, and S G Yeates.Organic semiconductor-polymer insulator blends: a morphological study of the guest-hostinteraction. e-J. Surf. Sci. Nanotechnol., 7:455–458, 2009.
[222] A Sidorenko, S Minko, K Schenk-Meuser, H Duschner, and M Stamm. Switching of polymerbrushes. Langmuir, 15:8349–8355, 1999.
[223] J Lahann, S Mitragotri, T-N Tran, H Kaido, J Sundaram, I S Choi, S Hoffer, G A Somorjai, andR Langer. A reversibly switching surface. Science, 299:371–374, 2003.
[224] D M Jones, J R Smith, W T S Huck, and C Alexander. Variable adhesion of micropatternedthermoresponsive polymer brushes: AFM investigations of poly(N -isopropylacrylamide)brushes prepared by surface-initiated polymerization. Adv. Mater., 14:1130–1134, 2003.
[225] H Retsos, G Gorodyska, A Kiriy, M Stamm, and C Creton. Adhesion between chemicallyheterogeneous switchable polymeric brushes and an elastomeric adhesive. Langmuir, 21:7722–7725, 2005.
[226] A Synytska, E Svetushkina, N Puretskiy, G Stoychev, S Berger, L Ionov, C Bellmann, K-J Eichhorn, and M Stamm. Biocompatible polymeric materials with switchable adhesionproperties. Soft Matter, 6:5907–5914, 2010.
[227] E Svetushkina, N Puretskiy, L Ionov, M Stamm, and A Synytska. A comparative study onswitchable adhesion between thermoresponsive polymer brushes on flat and rough surfaces.Soft Matter, 7:5691–5696, 2011.
[228] F Zhou, W Shu, M E Welland, and W T S Huck. Highly reversible and multi-stage cantilever
actuation driven by polyelectrolyte brushes. J. Am. Chem. Soc., 128:5326–5327, 2006.[229] I Luzinov, S Minko, and V V Tsukruk. Adaptive and responsive surfaces through controlled
reorganization of interfacial polymer layers. Prog. Polym. Sci., 29:635–698, 2004.[230] I Luzinov, S Minko, and V V Tsukruk. Responsive brush layers: from tailored gradients to
reversible assembled nanoparticles. Soft Matter, 4:714–725, 2008.[231] A Sun and J Lahann. Dynamically switchable biointerfaces. Soft Matter, 5:1555–1561, 2009.[232] M P Weir and A J Parnell. Water soluble responsive polymer brushes. Polymers, 3:2107–2132,
2011.[233] X Liu, Y Liang, F Zhou, and W Liu. Extreme wettability and tunable adhesion: biomimicking
beyond nature? Soft Matter, 8:2070–2086, 2012.[234] S H Anastasiadis. Development of functional polymer surfaces with controlled wettability.
Langmuir, 29:9277–9290, 2013.[235] M C LeMieux, Y-H Lin, P D Cuong, H-S Ahn, E R Zubarev, and V V Tsukruk. Microtribological
and nanomechanical properties of switchable Y-shaped amphiphilic polymer brushes. Adv.Funct. Mater., 15:1529–1540, 2005.
[236] S Moya, O Azzaroni, T Farhan, V L Osborne, and W T S Huck. Locking and unlocking ofpolyelectrolyte brushes: Toward the fabrication of chemically controlled nanoactuators. Ang.Chem. Int. Ed., 44:4578–4581, 2005.
[237] O Azzaroni, A A Brown, and W T S Huck. Tunable wettability by clicking counterions intopolyelectrolyte brushes. Adv. Mater., 19:151–154, 2007.
[238] M Motornov, R Sheparovych, R Lupitskyy, E MacWilliams, and S Minko. Superhydrophobicsurfaces generated from water-borne dispersions of hierarchically assembled nanoparticlescoated with a reversibly switchable shell. Adv. Mater., 20:200–205, 2008.
[239] E Spruijt, E-Y Choi, and W T S Huck. Reversible electrochemical switching of polyelectrolytebrush surface energy using electroactive counterions. Langmuir, 24:11253–11260, 2008.
[240] K Hinrichs, D Aulich, L Ionov, N Esser, K-J Eichhorn, M Motornov, M Stamm, and S Minko.Chemical and structural changes in a pH-responsive mixed polyelectrolyte brush studied byinfrared ellipsometry. Langmuir, 25:10987–10991, 2009.
[241] K Y Tan, J E Gautrot, and W T S Huck. Island brushes to control adhesion of water in oildroplets on planar surfaces. Soft Matter, 7:7013–7020, 2011.
[242] Z Hua, J Yang, T Wang, G Liu, and G Zhang. Transparent surface with reversibly switchablewettability between superhydrophobicity and superhydrophilicity. Langmuir, 29:10307–10312,2013.
[243] J-J Li, Y-N Zhou, and Z-H Luo. Thermo-responsive brush copolymers with structure-tunableLCST and switchable surface wettability. Polymer, 55:6552–6560, 2014.
[244] M Raftari, Z Zhang, S R Carter, G J Leggett, and M Geoghegan. Frictional properties of apolycationic brush. Soft Matter, 10:2759–2766, 2014.
[245] H Merlitz, G-L He, J-U Sommer, and C-X Wu. Reversibly switchable polymer brushes withhydrophobic/hydrophilic behavior: A Langevin dynamics study. Macromolecules, 42:445–451,2009.
[246] H Merlitz, G-L He, C-X Wu, and J-U Sommer. Nanoscale brushes: How to build a smart surfacecoating. Phys. Rev. Lett., 102:115702, 2009.
[247] S de Beer. Switchable friction using contacts of stimulus-responsive and nonresponding swollenpolymer brushes. Langmuir, 30:8085–8090, 2014.
[248] S Kumar, X Tong, Y L Dory, M Lepage, and Y Zhao. A CO2-switchable polymer brush forreversible capture and release of proteins. Chem. Commun., 49:90–92, 2013.
[249] M P Weir, S Y Heriot, S J Martin, A J Parnell, S A Holt, J R P Webster, and R A L Jones.Voltage-induced swelling and deswelling of weak polybase brushes. Langmuir, 27:11000–11007,2011.
[250] G J Dunderdale and J P A Fairclough. Coupling pH-responsive polymer brushes to electricity:Switching thickness and creating waves of swelling or collapse. Langmuir, 29:3628–3635, 2013.
[251] H Zeng, Y Zhang, S Mao, H Nakajima, and K Uchiyama. A reversibly electro-controllablepolymer brush for electro-switchable friction. J. Mater. Chem. C, 5:5877–5881, 2017.
[252] H Ouyang, Z Xia, and J Zhe. Static and dynamic responses of polyelectrolyte brushes underexternal electric field. Nanotechnology, 20:195703, 2009.
[253] T Yamamoto and P A Pincus. Collapse of polyelectrolyte brushes in electric fields. EPL,95:48003, 2011.
[254] C Drummond. Electric-field-induced friction reduction and control. Phys. Rev. Lett., 109:154302,2012.
[255] Y-F Ho, T N Shendruk, G W Slater, and P-Y Hsiao. Structure of polyelectrolyte brushes subjectto normal electric fields. Langmuir, 29:2359–2370, 2013.
[256] C Tong. Numerical self-consistent field theory study of the response of strong polyelectrolytebrushes to external electric fields. J. Chem. Phys., 143:054903, 2015.
[257] F Zhang, H-D Ding, C Duan, S-L Zhao, and C-H Tong. Molecular dynamics simulation ofthe response of bi-disperse polyelectrolyte brushes to external electric fields. Chin. Phys. B,26:088204, 2017.
[258] G Panzarasa, M Dübner, V Pifferi, G Soliveri, and C Padeste. ON/OFF switching of siliconwafer electrochemistry by pH-responsive polymer brushes. J. Mater. Chem. C, 4:6287–6294,2016.
[259] D J Beebe, J S Moore, J M Bauer, Q Yu, R H Liu, C Devadoss, and B-H Jo. Functional hydrogelstructures for autonomous flow control inside microfluidic channels. Nature, 404:588–590, 2000.
[260] E Katz, V M Fernández, and M Pita. Switchable bioelectrocatalysis controlled by pH changes.Electroanalysis, 27:2063–2073, 2015.
[261] G Panzarasa, M Dübner, V Pifferi, G Soliveri, and C Padeste. Tuning the electrochemicalproperties of silicon wafer by grafted-from micropatterned polymer brushes. J. Mater. Chem.C, 4:340–347, 2016.
[262] M Kobayashi, M Terada, and A Takahara. Reversible adhesive-free nanoscale adhesion utilizingoppositely charged polyelectrolyte brushes. Soft Matter, 7:5717–5722, 2011.
[263] G Sudre, L Olanier, Y Tran, D Hourdet, and C Creton. Reversible adhesion between a hydrogeland a polymer brush. Soft Matter, 8:8184–8193, 2012.
[264] M Kobayashi and A Takahara. Environmentally friendly repeatable adhesion using a sulfobetaine-type polyzwitterion brush. Polym. Chem., 4:4987–4992, 2013.
[265] L Alfhaid, W D Seddon, N H Williams, and M Geoghegan. Double-network hydrogels improvepH-switchable adhesion. Soft Matter, 12:5022–5028, 2016.
[266] J Boateng and O Catanzano. Advanced therapeutic dressings for effective wound healing—areview. J. Pharm. Sci., 104:3653–3680, 2015.
[267] J M Garcia and M L Robertson. The future of plastics recycling. Science, 358:870–872, 2017.[268] Y Lu, J Broughton, and P Winfield. A review of innovations in disbonding techniques for repair
and recycling of automotive vehicles. Int. J. Adhes. Adhes., 50:119–127, 2014.[269] J Collett, A Crawford, P V Hatton, M Geoghegan, and S Rimmer. Thermally responsive
polymeric hydrogel brushes: synthesis, physical properties and use for the culture ofchondrocytes. J. R. Soc. Interface, 4:117–126, 2007.
[270] E Wischerhoff, K Uhlig, A Lankenau, H G Börner, A Laschewsky, C Duschl, and J-F Lutz.Controlled cell adhesion on PEG-based switchable surfaces. Angew. Chem. Int. Ed., 47:5666–5668, 2008.
[271] S Desseaux and H-A Klok. Temperature-controlled masking/unmasking of cell-adhesive cues withpoly(ethylene glycol) methacrylate based brushes. Biomacromolecules, 15:3859–3865, 2014.
[272] G Cheng, H Xue, Z Zhang, S Chen, and S Jiang. A switchable biocompatible polymer surfacewith self-sterilizing and nonfouling capabilities. Angew. Chem. Int. Ed., 47:8831–8834, 2008.
[273] C G Rolli, H Nakayama, K Yamaguchi, J P Spatz, R Kemkemer, and J Nakanishi. Switchableadhesive substrates: revealing geometry dependence in collective cell behavior. Biomaterials,33:2409–2418, 2012.
[274] J Hyun, W-K Lee, N Nath, A Chilkoti, and S Zauscher. Capture and release of proteins onthe nanoscale by stimuli-responsive elastin-like polypeptide “switches”. J. Am. Chem. Soc.,126:7330–7335, 2004.
[275] S Burkert, E Bittrich, M Kuntzsch, M Müller, K-J Eichhorn, C Bellmann, P Uhlmann, andM Stamm. Protein resistance of PNIPAAm brushes: Application to switchable proteinadsorption. Langmuir, 26:1786–1795, 2010.
[276] N Malod-Dognin, A Bansal, and F Cazals. Characterizing the morphology of protein bindingpatches. Proteins, 80:2652–2665, 2012.
[277] Y Watanabe, T Kobayashi, H Yamamoto, H Hoshida, R Akada, F Inagaki, Y Ohsumi, and N NNoda. Structure-based analyses reveal distinct binding sites for Atg2 and phosphoinositides inAtg18. J. Biol. Chem., 287:31681–31690, 2012.
[278] R Kumar and E B Thompson. Folding of the glucocorticoid receptor N-terminal transactivationfunction: Dynamics and regulation. Mol. Cell. Endocrinol., 348:450–456, 2012.
[279] B Zhang, J C Crack, S Subramanian, J Green, A J Thomson, N E Le Brun, and M K Johnson.Reversible cycling between cysteine persulfide-ligated [2Fe-2S] and cysteine-ligated [4Fe-4S]clusters in the fnr regulatory protein. Proc. Natl Acad. Sci. USA, 109:15734–15739, 2012.
[280] J M Berrisford and L A Sazanov. Structural basis for the mechanism of respiratory complex I.J. Biol. Chem., 284:29773–29783, 2009.
[281] T A Nguyen, S S Lieu, and G Chang. An Escherichia coli -based cell-free system for large-scaleproduction of functional mammalian membrane proteins suitable for X-ray crystallography. J.Mol. Microbiol. Biotechnol., 18:85–91, 2010.
[282] G Evans, D Axford, and R L Owen. The design of macromolecular crystallography diffractionexperiments. Acta Crystallogr. D: Biol. Crystallogr., 67:261–270, 2011.
[283] S Piana, K Lindorff-Larsen, and D E Shaw. Protein folding kinetics and thermodynamics fromatomistic simulation. Proc. Natl Acad. Sci. USA, 109:17845–17850, 2012.
[284] J Kubelka, J Hofrichter, and W A Eaton. The protein folding ‘speed limit’. Curr. Opin. Struct.Biol., 14:76–88, 2004.
[285] J Kubelka, T K Chiu, D R Davies, W A Eaton, and J Hofrichter. Sub-microsecond proteinfolding. J. Mol. Biol., 359:546–553, 2006.
[286] F Schotte, M Lim, T A Jackson, A V Smirnov, J Soman, J S Olson, G N Phillips Jr, M Wulff,and P A Anfinrud. Watching a protein as it functions with 150-ps time-resolved X-raycrystallography. Science, 300:1944–1947, 2003.
[287] M Schmidt, K Nienhaus, R Pahl, A Krasselt, S Anderson, F Parak, G U Nienhaus, andV Šrajer. Ligand migration pathway and protein dynamics in myoglobin: A time-resolvedcrystallographic study on l29w MbCO. Proc. Natl Acad. Sci. USA, 102:11704–11709, 2005.
[288] A L Serrano, M M Waegele, and F Gai. Spectroscopic studies of protein folding: Linear andnonlinear methods. Protein Sci., 21:157–170, 2012.
[289] C-K Lee, Y-M Wang, L-S Huang, and S Lin. Atomic force microscopy: determination ofunbinding force, off rate and energy barrier for protein-ligand interaction. Micron, 38:446–461, 2007.
[290] D P Allison, N P Mortensen, C J Sullivan, and M J Doktycz. Atomic force microscopy ofbiological samples. Wiley Interdisc. Rev. Nanomed. Nanobiotechnol., 2:618–34, 2010.
[291] S Senapati and S Lindsay. Recent progress in molecular recognition imaging using atomic forcemicroscopy. Acc. Chem. Res., 49:503–510, 2016.
[292] U Maver, T Velnar, M Gaberšček, O Planinšek, and M Finšgar. Recent progressive use of atomicforce microscopy in biomedical applications. Trends Anal. Chem., 80:96–111, 2016.
[293] E A-Hassan, W F Heinz, M D Antonik, N P D’Costa, S Nageswaran, C-A Schoenenberger, andJ H Hoh. Relative microelastic mapping of living cells by atomic force microscopy. Biophys.J., 74:1564–1578, 1998.
[294] A Touhami, B Nysten, and Y F Dufrêne. Nanoscale mapping of the elasticity of microbial cellsby atomic force microscopy. Langmuir, 19:4539–4543, 2003.
[295] Y F Dufrêne. Direct characterization of the physicochemical properties of fungal spores usingfunctionalized AFM probes. Biophys. J., 78:3286–3291, 2000.
[296] M Gad, A Itoh, and A Ikai. Mapping cell wall polysaccharides of living microbial cells usingatomic force microscopy. Cell Biol. Int., 21:697–706, 1997.
[297] E Evans, D Berk, and A Leung. Detachment of agglutinin-bonded red blood cells. I. Forces torupture molecular-point attachments. Biophys. J., 59:838–848, 1991.
[298] H K Nguyen, S Fujinami, and K Nakajima. Elastic modulus of ultrathin polymer filmscharacterized by atomic force microscopy: The role of probe radius. Polymer, 87:114–122,2016.
[299] J K Li, R M A Sullan, and S Zou. Atomic force microscopy force mapping in the study ofsupported lipid bilayers. Langmuir, 27:1308–1313, 2011.
[300] M Keshavarz, H Engelkamp, J Xu, E Braeken, M B J Otten, H Uji-i, E Schwartz, M Koepf,A Vananroye, J Vermant, R J M Nolte, F De Schryver, J C Maan, J Hofkens, P C MChristianen, and A E Rowan. Nanoscale study of polymer dynamics. ACS Nano, 10:1–13,2016.
[301] P C Chung, E Glynos, G Sakellariou, and P F Green. Elastic mechanical response of thinsupported star-shaped polymer films. ACS Macro Lett., 5:439–443, 2016.
[302] A K Denisin and B L Pruitt. Tuning the range of polyacrylamide gel stiffness for mechanobiologyapplications. ACS Appl. Mater. Interfaces, 8:21893–21902, 2016.
[303] I A Morozov. Structural-mechanical AFM study of surface defects in natural rubber vulcanizates.Macromolecules, 49:5985–5992, 2016.
[304] Y-Y Kim, M Semsarilar, J D Carloni, K R Cho, A N Kulak, I Polishchuk, C T Hendley,P J M Smeets, L A Fielding, B Pokroy, C C Tang, L A Estroff, S P Baker, S P Armes,and F C Meldrum. Structure and properties of nanocomposites formed by the occlusion ofblock copolymer worms and vesicles within calcite crystals. Adv. Funct. Mater., 26:1382–1392,2016.
[305] F M Hecht, J Rheinlaender, N Schierbaum, W H Goldmann, B Fabry, and T E Schäffer. Imagingviscoelastic properties of live cells by AFM: power-law rheology on the nanoscale. Soft Matter,11:4584–4591, 2015.
[306] Y Pen, Z J Zhang, A L Morales-García, M Mears, D S Tarmey, R G Edyvean, S A Banwart,and M Geoghegan. Effect of extracellular polymeric substances on the mechanical propertiesof Rhodococcus. Biochim. Biophys. Acta., 1848:518–526, 2015.
[307] X Wang, R Bleher, M E Brown, J G N Garcia, S M Dudek, G S Shekhawat, and V P Dravid.Nano-biomechanical study of spatio-temporal cytoskeleton rearrangements that determinesubcellular mechanical properties and endothelial permeability. Sci. Rep., 5:11097, 2015.
[308] A X Cartagena-Rivera, W-H Wang, R L Geahlen, and A Raman. Fast, multi-frequency, andquantitative nanomechanical mapping of live cells using the atomic force microscope. Sci.Rep., 5:11692, 2015.
[309] A Rigato, F Rico, F Eghiaian, M Piel, and S Scheuring. Atomic force microscopy mechanicalmapping of micropatterned cells shows adhesion geometry-dependent mechanical response onlocal and global scales. ACS Nano, 9:5846–5856, 2015.
[310] A X Cartagena-Rivera, J S Logue, C M Waterman, and R S Chadwick. Actomyosin corticalmechanical properties in nonadherent cells determined by atomic force microscopy. Biophys.J., 110:2528–2539, 2016.
[311] G Smolyakov, C Formosa-Dague, C Severac, R E Duval, and E Dague. High speed indentationmeasures by FV, QI and QNM introduce a new understanding of bionanomechanicalexperiments. Micron, 85:8–14, 2016.
[312] N Gavara and R S Chadwick. Relationship between cell stiffness and stress fiber amount, assessedby simultaneous atomic force microscopy and live-cell fluorescence imaging. Biomech. Model.Mechanobiol., 15:511–523, 2016.
[313] G Andre, S Kulakauskas, M-P Chapot-Chartier, B Navet, M Deghorain, E Bernard, P Hols, and
Y F Dufrêne. Imaging the nanoscale organization of peptidoglycan in living Lactococcus lactiscells. Nature Commun., 1:27, 2010.
[314] G Buist, A Steen, J Kok, and O P Kuipers. LysM, a widely distributed protein motif for bindingto (peptido)glycans. Mol. Microbiol., 68:838–847, 2008.
[315] H Koo, I Park, Y Lee, H J Kim, J H Jung, J H Lee, Y Kim, J-H Kim, and J W Park. Visualizationand quantification of microRNA in a single cell using atomic force microscopy. J. Am. Chem.Soc., 138:11664–11671, 2016.
[316] K P Heim, R M A Sullan, P J Crowley, S El-Kirat-Chatel, A Beaussart, W Tang, R Besingi,Y F Dufrene, and L J Brady. Identification of a supramolecular functional architecture ofStreptococcus mutans adhesin p1 on the bacterial cell surface. J. Biol. Chem., 290:9002–9019,2015.
[317] V Cabral, S Znaidi, L A Walker, H Martin-Yken, E Dague, M Legrand, K Lee, M Chauvel,A Firon, T Rossignol, M L Richard, C A Munro, S Bachellier-Bassi, and C D’Enfert. Targetedchanges of the cell wall proteome influence Candida albicans ability to form single- and multi-strain biofilms. PLoS Pathog., 10:e1004542, 2014.
[318] L Arnal, G Longo, P Stupar, M F Castez, N Cattelan, R C Salvarezza, O M Yantorno, S Kasas,and M E Vela. Localization of adhesins on the surface of a pathogenic bacterial envelopethrough atomic force microscopy. Nanoscale, 7:17563–17572, 2015.
[319] P Herman-Bausier and Y F Dufrêne. Atomic force microscopy reveals a dual collagen-bindingactivity for the staphylococcal surface protein SdrF. Mol. Microbiol., 99:611–621, 2016.
[320] A Noy. Chemical force microscopy of chemical and biological interactions. Surf. Interface Anal.,38:1429–1441, 2006.
[321] A Ptak, H Gojzewski, M Kappl, and H-J Butt. Influence of humidity on the nanoadhesionbetween a hydrophobic and a hydrophilic surface. Chem. Phys. Lett., 503:66–70, 2011.
[322] M Sletmoen, T K Dam, T A Gerken, B T Stokke, and C F Brewer. Single-molecule pair studiesof the interactions of the α-GalNAc (Tn-antigen) form of porcine submaxillary mucin withsoybean agglutinin. Biopolymers, 91:719–728, 2009.
[323] E Evans. Probing the relation between force–lifetime–and chemistry in single molecular bonds.Annu. Rev. Biophys. Biomol. Struct., 30:105–128, 2001.
[324] C Friedsam, A K Wehle, F Kühner, and H E Gaub. Dynamic single-molecule force spectroscopy:bond rupture analysis with variable spacer length. J. Phys.: Condens. Matter, 15:S1709–S1723,2003.
[325] R W Friddle. Theoretical models in force spectroscopy. In A R Bizzarri and S Cannistraro,editors, Dynamic Force Spectroscopy and Biomolecular Recognition, pages 51–91. CRC press,Boca Raton, 2012.
[326] J T Bullerjahn, S Sturm, and K Kroy. Theory of rapid force spectroscopy. Nat. Commun.,5:4463, 2014.
[327] R Bansil and B S Turner. Mucin structure, aggregation, physiological functions and biomedicalapplication. Curr. Opin. Colloid Interface Sci., 11:164–170, 2006.
[328] S Rachagani, M P Torres, N Moniaux, and S K Batra. Current status of mucins in the diagnosisand therapy of cancer. Biofactors, 35:509–527, 2009.
[329] T K Dam, T A Gerken, B S Cavada, K S Nascimento, T R Moura, and C F Brewer. Bindingstudies of α-GalNAc-specific lectins to the α-GalNAc (Tn-antigen) form of porcine submaxillarymucin and its smaller fragments. J. Biol. Chem., 282:28256–28263, 2007.
[330] E Evans and K Ritchie. Dynamic strength of molecular adhesion bonds. Biophys. J., 72:1541–1555, 1997.
[331] G I Bell. Models for the specific adhesion of cells to cells. Sci., 200:618 – 627, 1978.[332] E Evans. Energy landscapes of biomolecular adhesion and receptor anchoring at interfaces
explored with dynamic force spectroscopy. Faraday Discuss., 111:1–16, 1998.[333] R Merkel, P Nassoy, a Leung, K Ritchie, and E Evans. Energy landscapes of receptor-ligand
bonds explored with dynamic force spectroscopy. Nature, 397:50–53, 1999.
[334] F Hanke and H. J. Kreuzer. Breaking bonds in the atomic force microscope: Theory and analysis.Phys. Rev. E, 74:031909, 2006.
[335] A Taninaka, Y Hirano, O Takeuchi, and H Shigekawa. Force measurement enabling preciseanalysis by dynamic force spectroscopy. Int. J. Mol. Sci., 13:453–465, 2012.
[336] A R Bizzarri. Biological applications of dynamic force spectroscopy. In A R Bizzarri andS Cannistraro, editors, Dynamic Force Spectroscopy and Biomolecular Recognition, pages 193–241. CRC press, Boca Raton, 2012.
[337] S Getfert and P Reimann. Hidden multiple bond effects in dynamic force spectroscopy. Biophys.J., 102:1184–1193, 2012.
[338] J te Riet, I Reinieren-Beeren, C G Figdor, and A Cambi. AFM force spectroscopy reveals howsubtle structural differences affect the interaction strength between Candida albicans and DC-SIGN. J. Mol. Recognit., 28:687–698, 2015.
[339] V Vásquez, M Krieg, D Lockhead, and M B Goodman. Phospholipids that containpolyunsaturated fatty acids enhance neuronal cell mechanics and touch sensation. Cell Rep.,6:70–80, 2014.
[340] A Alessandrini and P Facci. Nanoscale mechanical properties of lipid bilayers and their relevancein biomembrane organization and function. Micron, 43:1212–1223, 2012.
[341] M Ritzefeld, V Walhorn, D Anselmetti, and N Sewald. Analysis of DNA interactions usingsingle-molecule force spectroscopy. Amino Acids, 44:1457–1475, 2013.
[342] J Tao, K C Battle, H Pan, E A Salter, Y-C Chien, A Wierzbicki, and J J De Yoreo. Energeticbasis for the molecular-scale organization of bone. Proc. Natl. Acad. Sci. USA, 112:326–331,2015.
[343] B Eslami, E A López-Guerra, M Raftari, and S D Solares. Evolution of nano-rheologicalproperties of Nafion R© thin films during pH modification by strong base treatment: a staticand dynamic force spectroscopy study. J. Appl. Phys., 119:165301, 2016.
[344] E Spruijt, M A Cohen Stuart, and J van der Gucht. Dynamic force spectroscopy of oppositelycharged polyelectrolyte brushes. Macromolecules, 43:1543–1550, 2010.
[345] L Sonnenberg, J Parvole, F Kühner, L Billon, and H E Gaub. Choose sides: Differential polymeradhesion. Langmuir, 23:6660–6666, 2007.
[346] O Axner, M Andersson, O Bjoernham, M Castelain, J Klinth, E Koutris, and S Schedin. Assessingbacterial adhesion on an individual adhesin and single pili level using optical tweezers. InD Linke and A Goldman, editors, Bacterial Adhesion: Chemistry, Biology and Physics, volume715 of Advances in Experimental Medicine and Biology, pages 301–313. Springer, Berlin, 2011.
[347] Y Hu, J Jin, H Liang, X Ji, J Yin, and W Jiang. pH dependence of adsorbed fibrinogenconformation and its effect on platelet adhesion. Langmuir, 32:4086–4094, 2016.
[348] J W Weisel and L Medved. The structure and function of the αC domains of fibrinogen. Ann.N. Y. Acad. Sci., 936:312–327, 2001.
[349] M Vuoriluoto, H Orelma, L-S Johansson, B Zhu, M Poutanen, A Walther, J Laine, and O J Rojas.Effect of molecular architecture of PDMAEMA-POEGMA random and block copolymers ontheir adsorption on regenerated and anionic nanocelluloses and evidence of interfacial waterexpulsion. J. Phys. Chem. B, 119:15275–15286, 2015.
[350] A Hucknall, S Rangarajan, and A Chilkoti. In pursuit of zero: Polymer brushes that resist theadsorption of proteins. Adv. Mater., 21:2441–2446, 2009.
[351] S Chen, L Li, C Zhao, and J Zheng. Surface hydration: Principles and applications towardlow-fouling/nonfouling biomaterials. Polymer, 51:5283–5293, 2010.
[352] M Krishnamoorthy, S Hakobyan, M Ramstedt, and J E Gautrot. Surface-initiated polymerbrushes in the biomedical field: applications in membrane science, biosensing, cell culture,regenerative medicine and antibacterial coatings. Chem. Rev., 114:10976–1026, 2014.
[353] J O Zoppe, N C Ataman, P Mocny, J Wang, J Moraes, and H-A Klok. Surface-initiated controlledradical polymerization: State-of-the-art, opportunities, and challenges in surface and interfaceengineering with polymer brushes. Chem. Rev., 117:1105–1318, 2017.
[354] S Pillai, A Arpanaei, R L Meyer, V Birkedal, L Gram, F Besenbacher, and P Kingshott.Preventing protein adsorption from a range of surfaces using an aqueous fish protein extract.Biomacromolecules, 10:2759–2766, 2009.
[355] E Pensini, C M Yip, D O’Carroll, and B E Sleep. Carboxymethyl cellulose binding to mineralsubstrates: Characterization by atomic force microscopy-based Force spectroscopy and quartz-crystal microbalance with dissipation monitoring. J. Colloid Interface Sci., 402:58–67, 2013.
[356] A Eleta-Lopez, J Etxebarria, N-C Reichardt, R Georgieva, H Bäumler, and J L Toca-Herrera.On the molecular interaction between albumin and ibuprofen: An AFM and QCM-D study.Colloids Surfaces B Biointerfaces, 134:355–362, 2015.
[357] C Gutiérrez Sánchez, Q Su, H Schönherr, M Grininger, and G Nöll. Multi-ligand-bindingflavoprotein dodecin as a key element for reversible surface modification in nano-biotechnology.ACS Nano, 9:3491–3500, 2015.
[358] S-O Kim, J A Jackman, M Mochizuki, B K Yoon, T Hayashi, and N-J Cho. Correlating single-molecule and ensemble-average measurements of peptide adsorption onto different inorganicmaterials. Phys. Chem. Chem. Phys., 18:14454–14459, 2016.
[359] I M Marcus, M Herzberg, S L Walker, and V Freger. Pseudomonas aeruginosa attachment onQCM-D sensors: The role of cell and surface hydrophobicities. Langmuir, 28:6396–6402, 2012.
[360] H Ma, D Li, X Sheng, B Zhao, and A Chilkoti. Protein-resistant polymer coatings on siliconoxide by surface-initiated atom transfer radical polymerization. Langmuir, 22:3751–3756, 2006.
[361] A M Alswieleh, N Cheng, I Canton, B Ustbas, X Xue, V Ladmiral, S Xia, R E Ducker, O El Zubir,M L Cartron, C N Hunter, G J Leggett, and S P Armes. Zwitterionic poly(amino acidmethacrylate) brushes. J. Am. Chem. Soc., 136:9404–9413, 2014.
[362] Y Teramura, K Kuroyama, and M Takai. Influence of molecular weight of PEG chain oninteraction between streptavidin and biotin-PEG-conjugated phospholipids studied with QCM-D. Acta Biomater., 30:135–143, 2016.
[363] J M Medley, E J Beane, S C Sundararaj, E Kaplan, D A Puleo, and T D Dziubla. Blockcopolymers for the rational design of self-forming postsurgical adhesion barriers. ActaBiomater., 6:72–82, 2010.
[364] C Ma, H Zhou, B Wu, and G Zhang. Preparation of polyurethane with zwitterionic side chainsand their protein resistance. ACS Appl. Mater. Interfaces, 3:455–461, 2011.
[365] S Napolitano, E Glynos, and N B Tito. Glass transition of polymers in bulk, confined geometries,and near interfaces. Rep. Prog. Phys., 80:036602, 2017.