Embed Size (px)
Citation preview

www.wjpps.com Vol 4, Issue 12, 2015.
722
Ahmad et al. World Journal of Pharmacy and Pharmaceutical Sciences
POLYMORPHISM AND SOLID STATE TRANSITION OF
ANTIHYPERLIPIDEMIC DRUG SIMVASTATIN: PREPRATION,
CHARACTERIZATION AND OPTIMIZATION BY USING CCD & RSM
Shmmon Ahmad* and Harpinder Kaur Gill.
Departments of Quality Assurance, Chandigarh College of Pharmacy, Landran, Mohali,
Punjab -140307.
ABSTRACT
Recently it has been growing interest in investing solid state transition
forms prepared by different technique. The majority of drugs are
administered in solids form. Among all newly discovered chemical
entities about 40% drugs are lipophillic and fail to reach market due to
their poor aqueous solubility. Problem of solubility is a major
challenge for formulation scientist, which can be resolved by different
technological approaches. Simvastatin belong to class of
antihyperlipidemic drugs having very low solubility and falls in
category II Class of BCS. Polymorphism and solid state transitions
change the solid-state property which is significantly influence the
performance of the final product such as solubility, Melting Point,
Dissolution Rate and flow property. Optimization process like RCM
and CCD design was used to study the effect of variables such as solubility and melting point
for quality determination of formulation. Solvent evaporation method is used in this study to
prepare new transition form. This technique has more advantages and it is preferred method
over others such as spray drying, sonication and homogenization. Through the characterized
analysis (SEM, XRD, ATR, DSC, Solublity and melting point) of optimised form, given
reliably confirmation data that the new solid state transition forms is amorphous form. It is
more soluble than crystalline form.
KEYWORDS: Polymorphism, Solid state transition, Simvastatin, Dissolution, DSC, SEM,
ATR.
WORLD JOURNAL OF PHARMACY AND PHARMACEUTICAL SCIENCES
SJIF Impact Factor 5.210
Volume 4, Issue 12, 722-736 Research Article ISSN 2278 – 4357
Article Received on
06 Oct 2015,
Revised on 27 Oct 2015,
Accepted on 16 Nov 2015
*Correspondence for
Author
Shmmon Ahmad
Departments of Quality
Assurance, Chandigarh
College of Pharmacy,
Landran, Mohali, Punjab -
140307.

www.wjpps.com Vol 4, Issue 12, 2015.
723
Ahmad et al. World Journal of Pharmacy and Pharmaceutical Sciences
INTRODUCTION
Polymorphism
Polymorphism is the ability of a particular solid substance to exist in multiple solid states
forms as a result of different arrangements and/or confirmations of its molecules. These
crystalline forms are chemically similar but structurally dissimilar. For example the diamond
and graphite are polymorphs of carbon.
Each crystal polymorphs has a well-defined region of thermodynamic stability in the phase
diagram of the substance, and first-order phase transitions from one polymorph to another are
observed through changes in temperature T or pressure P (P. H. Poole).[1]
Crystalline Form
Crystalline form contains highly ordered arrangement of molecules and atoms held together
by non-covalent interactions. Inorganic salt (sodium chloride) we can consider as a simple
example the unit cell.
Amorphous Form
Amorphous form increase intermolecular distance due which increase the absorption surface.
Main advantage as compared to conventional crystalline drugs is their considerably improved
solubility and bioavailability.
Higher dissolution rate (can give better bioavailability)
Better compression characteristics
Optimum stability of macromolecules
Phase transition
Phase transition is the process of transformation of one polymorph into another, which may
also occur on storage or during processing. Two types of polymorphous transitions are
distinguished, Enantiotropic and Monotropic (D.Giron).[2]
Both enantiotropism and
monotropism are important properties of polymorphs. Uncontrolled phase transitions of
unstable polymorphs into more stable ones are a big problem of pharmaceutical industry.
Thermal analysis techniques are being used extensively for determination of the
thermodynamic relationships between different phases: enantiotrope or monotrope transitions
between true polymorphs, transitions between different solvates or hydrates and polymorphs,
glass transition of amorphous form (B.Kratochvíl).[3]
www.wjpps.com Vol 4, Issue 12, 2015.
724
Ahmad et al. World Journal of Pharmacy and Pharmaceutical Sciences
A phase transition is the transformation of a thermodynamic system from one phase or state
of matter to another one by heat transfer. The term most commonly used to describe
transition between solid, liquid and gases state of matter. In the three states of matter, solids
possess the most structural diversity. Whereas gases and liquids consist of discrete molecules
that are randomly distributed due to thermal motion, solids consist of molecules, atoms, or
ions that are statically positioned. Solid can be further divided in Crystalline and amorphous
solids (B.D.Fahalman).[4]
Now-a-days various varieties of pharmacological molecules have been discovered. But the
great majority of these molecules have poor bioavailability, mostly of these molecules
associated with their low solubility in water, low absorption of drugs in to systemic
circulation. So the manufacturing units highly concentrate on the investigation of crystal
polymorphism to optimize the physicochemical properties and assure the stability of API
before the drug product development (Vellaisamy).[5]
Among these drugs, simvastatin is the
most frequently used, despite its poor solubility in water (M. Rúbia).[6]
Problem of solubility
is making a challenge to researcher, which can be resolved by different technological
approaches (M.Limbachiya).[7]
Simvastatin belong to class of antihyperlipidemic drugs
having very low solubility and falls in category II Class of BCS (M. Rao).[8]
This class
represents the drugs having low solubility and high permeability. This category of drugs
needs special attention and modifications to show better solubility and hence bioavailability.
A number of methodologies can be adapted to improve solubilisation of poor water soluble
drug and further to improve its bioavailability. Orally administered drugs completely absorb
only when they show fair solubility in gastric medium and then such drugs shows good
bioavailability (A.Chaudhary).[9]
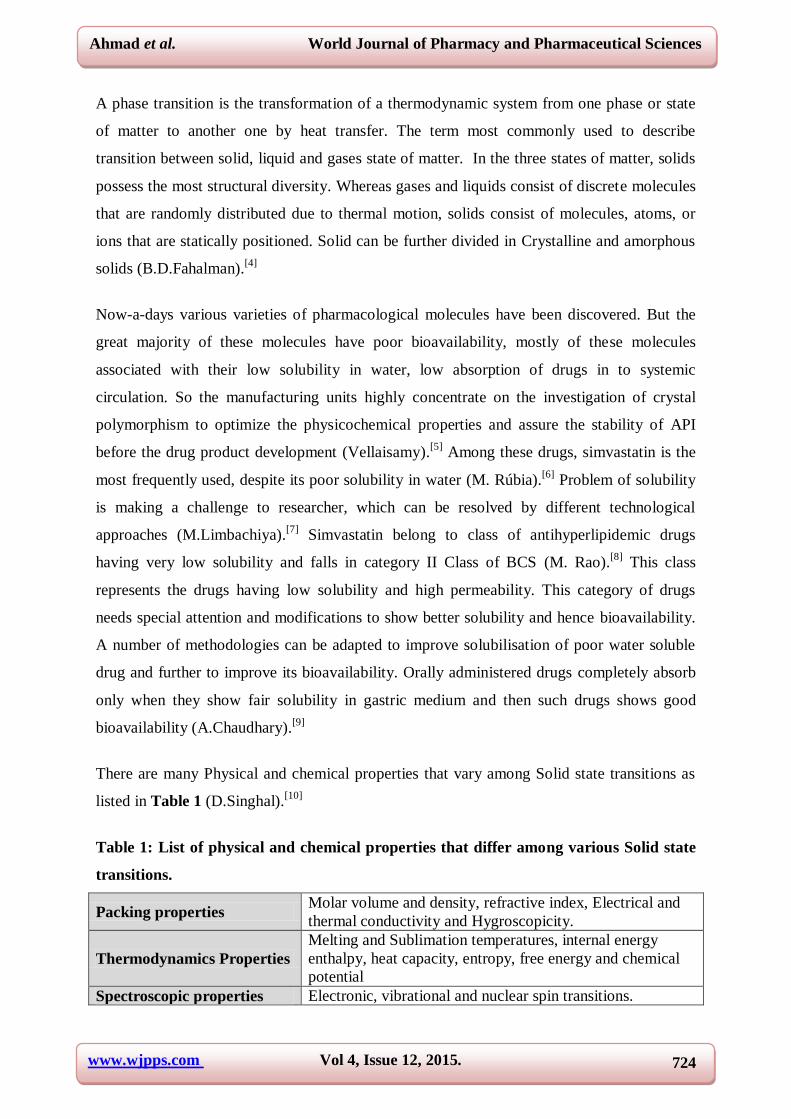
There are many Physical and chemical properties that vary among Solid state transitions as
listed in Table 1 (D.Singhal).[10]
Table 1: List of physical and chemical properties that differ among various Solid state
transitions.
Packing properties Molar volume and density, refractive index, Electrical and
thermal conductivity and Hygroscopicity.
Thermodynamics Properties
Melting and Sublimation temperatures, internal energy
enthalpy, heat capacity, entropy, free energy and chemical
potential
Spectroscopic properties Electronic, vibrational and nuclear spin transitions.

www.wjpps.com Vol 4, Issue 12, 2015.
725
Ahmad et al. World Journal of Pharmacy and Pharmaceutical Sciences
Kinetic properties Dissolution rate, rate of solid state reactions, stability,
Bioavailability, Tmax, Cmax and AUC
Surface properties Surface free energy, surface chemistry, colour morphology
Mechanical properties Hardness, tensile strength, compatibility handling, flow and
blending
The physical properties of the solid state can be seen in crystals and powders in both drugs
and pharmaceutical excipients. They are of interest because they can affect both the
production of dosage forms and the performance of the finished product (A.T.Florence).[11]
MATERIAL AND METHODS
Materials
Simvastatin was kindly gifted by Ranbaxy Laboratories Ltd. Mohali, India and the drug was
used without further purification. Distilled water was prepared in laboratory. All the solvents
and chemicals used in study were of AR grade/all materials used for study conformed to
USP-24 standards.
Method
Solid state transition was performed by crystallisation from single solvent evaporation
method (A.Poornaprajna).[12]
In this method, product was obtained by dissolving weighed
amount of drug in water immiscible solvent Dichloromethane in a beaker at 10-55°C. It was
kept on magnetic stirrer for different time in between 3-50min. The undissolved drug was
filtered off. When the solvent concentrated, then added Petroleum ether as anti-solvent and
this solution was kept on water bath at 5-10°C for 30min with continuous stirring. The
saturated solution was evaporated on water bath. After 2-4 hours crystals were obtained.
Optimization
Throgh Polymorphisim/solid state transitions we can obtain various form which have
different properties (listed in Table1). So optimisation should be, based on parameters such as
solubility, hygroscopicity, crystallinity, stability, and ease of production. Optimization
process like RCM (Response Surface Methodology) and CCD (Central Composite Design)
design was used to study the effect of variables such as solubility and melting point for
quality determination of formulation. RCM is a collection of mathematical and statistical
techniques based on the fit of a polynomial equation to the experimental data, which must
describe the behaviour of a data set with the objective of making statistical provisions. A
www.wjpps.com Vol 4, Issue 12, 2015.
726
Ahmad et al. World Journal of Pharmacy and Pharmaceutical Sciences
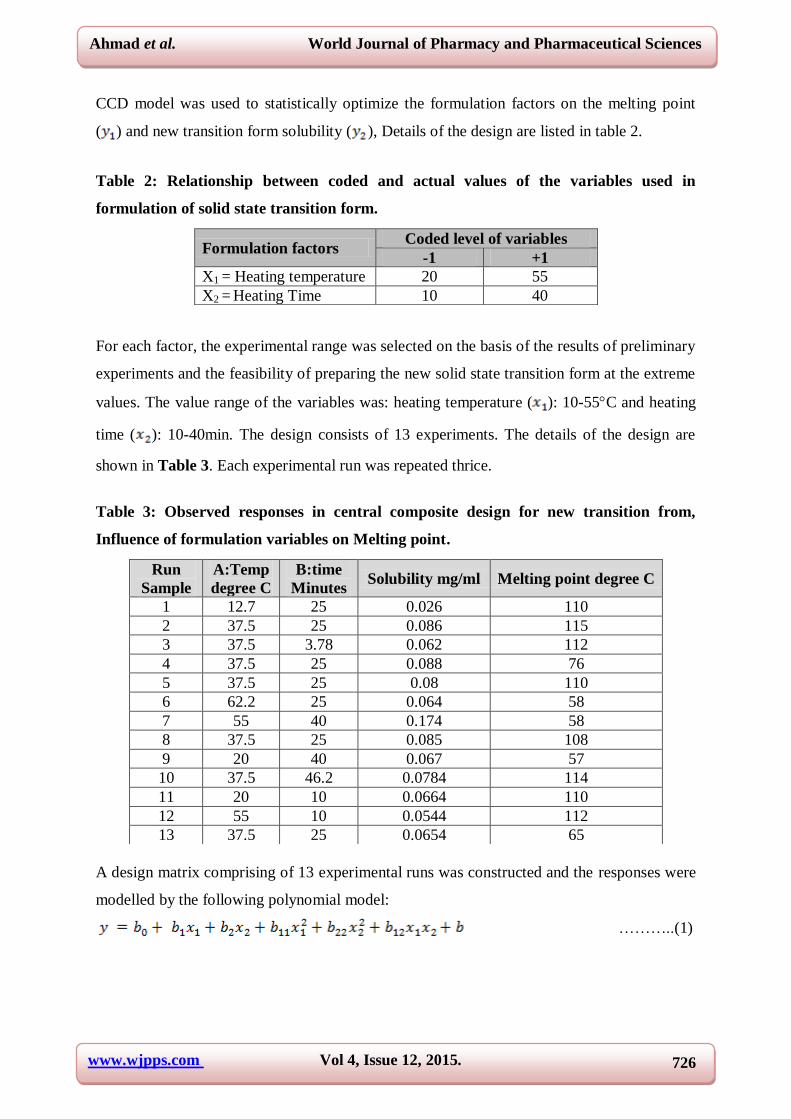
CCD model was used to statistically optimize the formulation factors on the melting point
( ) and new transition form solubility ( ), Details of the design are listed in table 2.
Table 2: Relationship between coded and actual values of the variables used in
formulation of solid state transition form.
For each factor, the experimental range was selected on the basis of the results of preliminary
experiments and the feasibility of preparing the new solid state transition form at the extreme
values. The value range of the variables was: heating temperature ( ): 10-55C and heating
time ( ): 10-40min. The design consists of 13 experiments. The details of the design are
shown in Table 3. Each experimental run was repeated thrice.
Table 3: Observed responses in central composite design for new transition from,
Influence of formulation variables on Melting point.
A design matrix comprising of 13 experimental runs was constructed and the responses were
modelled by the following polynomial model:
………..(1)
Formulation factors Coded level of variables
-1 +1
X1 = Heating temperature 20 55
X2 = Heating Time 10 40
Run
Sample
A:Temp
degree C
B:time
Minutes Solubility mg/ml Melting point degree C
1 12.7 25 0.026 110
2 37.5 25 0.086 115
3 37.5 3.78 0.062 112
4 37.5 25 0.088 76
5 37.5 25 0.08 110
6 62.2 25 0.064 58
7 55 40 0.174 58
8 37.5 25 0.085 108
9 20 40 0.067 57
10 37.5 46.2 0.0784 114
11 20 10 0.0664 110
12 55 10 0.0544 112
13 37.5 25 0.0654 65

www.wjpps.com Vol 4, Issue 12, 2015.
727
Ahmad et al. World Journal of Pharmacy and Pharmaceutical Sciences
The ranges for each of the variables in were chosen taking into account our preliminary
experiments. Table 3 shows the experimental results concerning the tested variables on mean
melting point and solubility. These two responses were individually fitted to a second order
polynomial model. For each response, the model which generated a higher F value was
identified as the best fitted model. Each obtained model was validated by ANOVA. Three
dimensional response surface plots were drawn for the optimization of new transition form.
These types of plots are useful in studying the effects of two factors on the response at one
time, when the third factor is kept constant.
Melting Point is a critical factor for Solid state transition. Stability and various compression
factors are directly affected by melting point. Generally higher melting point of product show
good stability and decrease the chance sticking, picking, weight variation in tablet, because
lower melting point product melt during compression and stick with punch and create
problem.
108.7315648+1.714856731* Temp -2.06293771* time -
0.000952381*Temp * time-0.029265306* Temp2 +
0.024611111* time2
...............(2)
Design-Expert® SoftwareFactor Coding: ActualMelting point (degree C)
Design points above predicted valueDesign points below predicted value115
57
X1 = A: TempX2 = B: time
10
16
22
28
34
40
20
27
34
41
48
55
20
40
60
80
100
120
140
160
180
Me
ltin
g p
oin
t (d
eg
re
e C
)
A: Temp (degree C)B: time (Minutes)
Figure 1: Three dimensional response surface plots showing the effect of variables on
responses: - Melting point.
A positive value in regression equation for a response represents an effect that favours the
optimization (synergistic effect); while a negative value indicates an inverse relationship
(antagonistic effect) between the factors and the response (M.Singh).[13]

www.wjpps.com Vol 4, Issue 12, 2015.
728
Ahmad et al. World Journal of Pharmacy and Pharmaceutical Sciences
The reduced quadratic model was found to be non significant with an F value of 0.85 (p <
0.0500), which indicates that response variable and the set of formulation variables were
significantly not related. The high R2 value indicated that 37.79% of variation in melting
point was explained by the regression on formulation factors.
Table 4: Comparison of the experimental and predicted values of new transition form
prepared under the predicted optimum conditions.
S.No Response Predicted value Experimental value Bias (%)a
1 Melting Point 112.9 110 2.56
2 Solubility (mg %) 6.98 6.64 5.00
aBias
Influence of Preparation Factors on Solubility
In this study, the solubility of new transition form reached up to 6.64% (Table 4). High
solubility is advantageous since it transports enough drugs at the target site and increase the
residence time of the drug. The high solubility of optimised form can be attributed to several
factors.
The optimised variables show a good fit to the reduced quadratic model (Equation 3) with an
F value of 5.71 (p < 0.0500), which indicates that response variable and the set of
formulation variables were significantly related. The high R2 value indicated that 71.3% of
variation in solubility was explained by the regression on formulation factors.
The statistical analysis of the results generated a quadratic response for optimised form
solubility is as follows
=0.113196873-0.001770904*Temp-
0.003055057*Time+0.000113333*Temp*Time ..............(3)

www.wjpps.com Vol 4, Issue 12, 2015.
729
Ahmad et al. World Journal of Pharmacy and Pharmaceutical Sciences
Design-Expert® SoftwareFactor Coding: ActualSolubility (mg/ml)
Design points above predicted valueDesign points below predicted value0.174
0.026
X1 = A: TempX2 = B: time
10
16
22
28
34
40
20
27
34
41
48
55
0
0.05
0.1
0.15
0.2
So
lub
ilit
y (m
g/m
l)
A: Temp (degree C)
B: time (Minutes)
Figure 2: Three dimensional response surface plots showing the effect of variable on
the response: - Optimised form solubility.
EVALUATION
Tenth formulation was selected which have highest solubility. The Optimised form was
evaluated by different techniques including Dissolution studies, SEM, DSC, XRD and ATR.
Dissolution (In Vitro release) Study
Dissolution testing of optimized form was performed according to USP 32 (USP).[14]
Apparatus 2 (paddle) at 50 rpm; 37 ± 0.5°C; 900mL of pH 7.0 phosphate buffer (0.01 M)
with 0.5% SDS(sodium dodecyl sulphate). The dissolution medium was prepared by
dissolving 4.5 gm of sodium dodecyl sulphate in 900 mL of water and adjusting the pH to 7.0
with monobasic sodium phosphate. SDS was added in concentrations of 0.1–0.5% w/v.
Simvastatin release was quantified by UV spectrophotometric analysis of the dissolution
samples at 237.5 nm.
The dissolution studies were carried for 30min, at 37±05ºC paddles rotating at 50 rpm. The
5ml aliquots sample were withdrawn and analyzed after 5, 10, 15, 30 minutes and same
quantity was replaced to dissolution medium (N.Singla) (G.Singhvi).[15][16]

www.wjpps.com Vol 4, Issue 12, 2015.
730
Ahmad et al. World Journal of Pharmacy and Pharmaceutical Sciences
Figure 3: In vitro release profile of simvastatin pure drug and optimised transition
form.
The dissolution profiles of the optimised form and pure drug (SIM) are shown in Figure 3. It
is evident that the dissolution rate of optimised form was higher as compared to the pure
drug. Simvastatin drug substance showed poor dissolution profile i.e. only 15.57 % of drug
was released at the end of 30 minutes, where as Solid state transition form showed excellent
release 70.42 % drug at the end of 30 minutes.
The improved dissolution due to amorphous form with decrease particle sizes its deposition
on the surface of the carrier and improved wettability. In vitro dissolution profile shows that
percentage drug release is good in Solid state transition form.
Screening Electron Microscopy
For their external morphology studies of unchanged drug and Solid state transition form the
SEM was used. The sample were visualized using scanning electron microscopy (JSM-6510
from SAI Labs, Thapar University, Patiala) operated at 10Kv. The small amount of powder
samples was manually dispersed on a metal stub with double adhesive tape and coated with
Platinum/Palladium alloy under vacuum. The shape and surface characteristic of the
Optimised form and pure drug was observed in electron micro analyzer and photographs
(C.T.K.H.Stadtlander) (K.Dandu).[17][18]

www.wjpps.com Vol 4, Issue 12, 2015.
731
Ahmad et al. World Journal of Pharmacy and Pharmaceutical Sciences
Figure 4: SEM of pure drug simvastatin.
Figure 5: SEM of optimized Solid state transition form.
DSC thermograms of drug
The Differential scanning calorimetry of drug was carried out by (DSC Q10 V9.4 Build 287
USA) instrument. Samples weighing between 1 and 10 mg were loaded into open aluminium
pan and placed into the DSC cell. The cell had a nitrogen purge flowing at approximately
40cm3/min. The DSC was used to analyze the samples from 10–350°C with a 10°C/min
heating rate. Obtained DSC thermograms were match to reference simvastatin thermograms
(P.Pandya).[19]

www.wjpps.com Vol 4, Issue 12, 2015.
732
Ahmad et al. World Journal of Pharmacy and Pharmaceutical Sciences
Figure 6: DSC thermogram of pure Drug.
Figure 7: DSC thermograms of optimised solid state transition form.
DSC and their thermo grams of simvastatin drug are shown in Figure 6. SIM thermograms
exhibits a single, sharp melting endotherm at 138.73°C which is corresponding to its melting
point with onset 135.90°C, endset 143.29°C and fusion enthalpy of -64.76 J/g.
Due to the conversion of SIM crystalline to amorphous form the thermograms of optimised
form showed endothermic peaks at less temperature 49.98°C with onset 15.12°C, endset
87.28°C and fusion enthalpy of -52.59 J/g (Figure 7). Amorphous forms of simvastatin show
a higher recrystallization tendency at the higher temperature conditions. The amorphous form
was cold crystallised by heating and showed an exothermic peak at 158.43°C with fusion
enthalpy 146.8J/g.

www.wjpps.com Vol 4, Issue 12, 2015.
733
Ahmad et al. World Journal of Pharmacy and Pharmaceutical Sciences
Attenuated Total Reflectance (ATR)
Attenuated Total Reflectance (ATR) spectra of moisture free powdered samples of
simvastatin pure/Solid state transitional form were obtained using a spectrophotometer
(Bruker Alpha). The procedure consists of placed the powdered sample on the crystal. The
scanning range was 400-4000 cm -1
and the resolution was 4 cm-1. Polystyrene was used to
check the spectrophotometer calibration (D. Mandal).[20]
C:\Program Files\OPUS_65\MEAS\Simvastatin.0 Simvastatin Solid 26/08/2014
3725
.75
3661
.54
3542
.51
3391
.33
3207
.74
3136
.84
2947
.92
2874
.32
2747
.47
2630
.57
2555
.36
2496
.39
2332
.92
2135
.03
2004
.95
1702
.84
1451
.75
1375
.66
1262
.01
1162
.39
1057
.27
865.
94
755.
12
653.
39
100015002000250030003500
Wavenumber cm-1
2040
6080
100
Tran
smitt
ance
[%]
Page 1/1
Figure 8: ATR spectra of pure form simvastatin.
C:\Program Files\OPUS_65\MEAS\C3B.1 C3B Solid 26/08/2014
3727
.90
3657
.94
3598
.53
3543
.26
3416
.28
3330
.41
3252
.01
3144
.72
3057
.16
2959
.07
2876
.48
2810
.44
2699
.52
2620
.96
2555
.08
2478
.03
2378
.30
2311
.99
2251
.50
2172
.79
2119
.10
2044
.53
1987
.92
1880
.72
1808
.41
1700
.50
1454
.21
1375
.88
1260
.75
1161
.03
1053
.04
864.
28
747.
30
651.
98
100015002000250030003500
Wavenumber cm-1
2040
6080
100
Tra
nsm
itta
nce
[%]
Page 1/1
Figure 9: ATR Spectra of optimised form.
Spectra 8 and 9 show ATR spectrum of simvastatin and simvastatin optimised form. Spectra
of simvastatin 1702.84cm-1
(C=O), 1057.27cm-1
(C-O), 3542.51cm-1
(OH bonded) and
1262.01cm-1
(lactones -C-O-C- bend).

www.wjpps.com Vol 4, Issue 12, 2015.
734
Ahmad et al. World Journal of Pharmacy and Pharmaceutical Sciences
All above peak appear in drug optimised form. It indicates that there was no interaction
between drug and solvent DCM. But the intensity of the peak at 3598.53 cm-1
(free O-H) and
2959.07cm-1
(methyl C-H) is higher than pure simvastatin. The OH bond region (3650–3200
cm-1
) showed significant peak shifts and broadening, which indicated that amorphization is
associated with a change in intermolecular hydrogen bonding.
CONCLUSION
Solid state transitions of drug Simvastatin were prepared successfully using solvent
evaporation technique. The preparation method was simple and inexpensive to obtain
reproducible optimised form with an enhanced impact on solubility and in-vitro release.
An increase in solubility was obtained when the optimised form were obtained at 20ºC for 10
minutes. The temperature and heating time were optimised by design expert Software
Version 9. All the studies have been reported to be carried out at 10-55ºC for heating time
near about 10-40 minutes.
Solubility of optimized form was 0.0664mg/ml, whereas the pure drug showed a solubility of
0.0192mg/ml. Therefore the optimised solid state transition form of simvastatin showed
solubility enhancement by 3-4 folds as compared to the crystalline form. Solubility
enhancement is the key to ensure the goals of a good formulation like good oral
bioavailability, reduce frequency of dosing and better patient compliance combined with a
low cost of production.
The optimized solid state transition form also shows valuable increased In vitro release in
comparison to crystalline simvastatin. Optimised form showed a release of 70.42 % release as
compared to 15.57% release in case of crystalline simvastatin. Higher dissolution rate have
greatest influences on their absorption characteristics from the GIT and also the biological
availability of the drug.
ACKNOWLEDGEMENTS
I am very thankful to Chandigarh College of Pharmacy for provision of facilities for this
research work.
REFERENCES
1. Poole PH, Grandea T, Sciortinod F, Stanle HE, Angel CA. Amorphous polymorphism.
Computational materials Science. Elsevier, 1995; 4: 373-382.

www.wjpps.com Vol 4, Issue 12, 2015.
735
Ahmad et al. World Journal of Pharmacy and Pharmaceutical Sciences
2. Giron D, Investigations of polymorphism and pseudo-polymorphism in pharmaceuticals
by combined thermoanalytical techniques. Journal Of Thermal Analysis And
Calorimetry, 2001; 64: 37-60.
3. Kratochvíl B, Solid forms of pharmaceutical molecules. Springer, 2009; 1-8.
4. B.D.Fahalman, Materials chemistry: Solid state chemistry. Springer, 2011; 13-156.
5. Vellaisamy Ethiraj Thiruvengadam and Ganeshan, Polymorphism in pharmaceutical
ingredients. World Journal of Pharmacy and Pharmaceutical Sciences, 2014; 3(3):
621-633.
6. Rúbia M, Raffin FN, Accioly TF, Strategies used for to improve aqueous solubility of
simvastatin. Journal of Basic and Applied Pharmaceutical Sciences. 2012; 4: 495-507.
7. Limbachiya M, Agrawal M, Sapariya A, Soni S, Solubility Enhancement Technqiues for
Poorly Soluble Drugs, International Journal of Pharmaceutical Research and
Development, 2012; 4: 71-86.
8. Rao M, Mandage Y, Thanki K, Bhise B, Dissolution Improvement of Simvastatin by
Surface Solid Dispersion Technology, Dissolution Technologies, 2010; 27-33.
9. Chaudhary A, Nagaich U, Gulati N, Sharma V K, Khosa RL, Enhancement of
solubilization and bioavailability of poorly soluble drugs by physical and chemical
modifications. Journal of Advanced Pharmacy Education & Research, 2012; 2: 32-67.
10. Singhal D, Curatolo W, Drug Solid state transitionism and dosage form design. a
practical perspective Advanced Drug Delivery Reviews, 2004; 56: 335–347.
11. Florence AT, Attwood D, Solids, 4th Edn. Pharmaceutical Press London, 2005; 7-43.
12. Poornaprajna A, Mathew j, Sajankila j, Srinilayam G, Novel Form of Simvastatin. WO
2004/069819 A1. India, 2004.
13. Singh M, Hagan DO, The Prepration and Characterization of Polymeric Antigen Delivery
System for Oral Admnistration, Advance Drug Delivery review, 1998; 34: 285-304.
14. United State Pharmacopeia, Simvastatin, 2009; 3(3): 3558.
15. Singhvi G, Singh M, In-vitro drug release characterization models, International Journal
of Pharmaceutical Studies and Research, 2011; 2: 77-84.
16. Singla N, Gupta GD, Kohli K, Singla AK, A Discriminatory and Biorelevant Dissolution
Test Method for Simvastatin Drug Products, Dissolution Technologies, 2009; 1-3.
17. Stadtlander CTKH, Scanning Electron Microscopy and Transmission Electron
Microscopy of Mollicutes: Challenges and Opportunities, Modern Research and
Educational Topics in Microscopy, 2007; 125-131.

www.wjpps.com Vol 4, Issue 12, 2015.
736
Ahmad et al. World Journal of Pharmacy and Pharmaceutical Sciences
18. Dandu K, Narra N, Mohammad FA, Rapolu KE, Design, Characterization and Evaluation
of Solid state transitionism of Amlodipine Besylate, International Journal of Biological
& Pharmaceutical Research, 2012; 3: 89-104.
19. Pandya P, Gattani S, Jain P, Khirwal L, Surana S, Co-solvent Evaporation Method for
Enhancement of Solubility and Dissolution Rate of Poorly Aqueous Soluble Drug
Simvastatin: In vitro–In vivo Evaluation, American Association of Pharmaceutical
Scientists, 2008; 9: 1247-1252.
20. Mandal D, Ojha PK, Nandy BC, Ghosh LK, Effect of Carriers on Solid Dispersions of
Simvastatin (Sim): Physico Chemical Characterizations and Dissolution Studies, Der
Pharmacia Lettre, 2010; 2: 47-56.