Embed Size (px)
Citation preview

REC-OCE-70-30 i Code z532 (Do~e)
POND LININGS FOR DESALTING
PLANT EFFLUENTS
Field and laboratory evaluation of four types of lining materials for seepage control in brine disposal ponds
W. R. Morrison R. A. Dodge J. Merriman
L. M. EIIsperman Division of Research Office of Chief Engineer
Bureau of Reclamation
September 1970
Prepared for OFFICE OF SALINE WATER Washington, D.C. 20240

BM-230 (6-70) Bureau of Rec lamat ion , ' TECHHIQAL R
REC-0CE- 70- 30 i ! iS~!!i~@lii~.~ '~ ~ , ~ ~ 4 ~ ~ ~,~ ~ ~ ~ , ~ 4. T I T L E AND SUBT ITLE
POND LININGS FOR DESALTING PLANT EFFLUENTS Field and laboratory evaluation of four types of lining materials for seepage control in brine disposal ponds
7. AUTHOR(S)
W. R. Morrlson, R. A. Dodge, J. Merriman, L. M. Ellsperman
9. PERFORMING ORGANIZATION NAME AND ADDRESS
Division of Research Office of Chief Engineer Bureau of Reclamation Denver, Colorado 80225
12, SPONSORING AGENCY NAME AND ADDRESS
Office of Saline Water Washington , D.C. 202~0
R E P O R T S T A N D A R D T I T L E PAGE 3. RECIPIENT 'S CATALOG NO.
5. REPORT DATE
September 1970 6. PERFORMING ORGANIZATION CODE
8. PERFORMING ORGANIZATION REPORT NO.
10. WORK UNIT NO.
11. C O N T R A C T ~ I ~ K K ~ N 0 .
14-Ol-O001-1306 1S. TYPE OF REPORT AND PERIOD
COVERED
14. SPONSORING AGENCY CODE
15. SUPPLEMENTARY NOTES
16, ABSTRACT
A field and laboratory evaluation of lining materials proposed for use in brine disposal ponds was conducted. Flexible membrane linings were the most effective for seepage control, followed by hard-surface lin- ings, compected earth, and soil sealants. The investigation and other studies show that soll sealants only reduce seepage and do not affect a complete seal, and that the service llfe of soll sealants is question- able. Recommendations on a monitoring system for measuring seepage losses from brine disposal ponds are included.
t7. KEY WORDS AND DOCUMENT ANALYSIS
a DESCR,PTORS--/ *research and development/ * l in ings / seepage/ soil tests *ponds/ earth linings / flexible linings/ *soll treatment/ polyethylenes/ laboratory tests/ *field tests/ soll cement/ asphaltic concrete/ seepage losses/ asphalt/ disposal/ *plastics/ *instrumentation/ *brine disposal/
'water stage recorders/ temperature sensors/ *soll sealants b ;DENTIFIERS-~ Office of Saline Water/ polyvlnyl chloride/ permeability
tests c. COSATI Field~group
119. SECURITY CLASS 121, NO. OF PAGE: 18. DISTRIBUTION STATEMENT I (THIS REPORT) I
Available from the Clearinghouse for Federal Scientif ic and Technical j UNCLASSIFIED I 112 Information. National Bureau of Standards, U,S. Department of Commerce, 120. SECURITY CLASS |22. PRICE Springfield, Virginia 22t51. I (TH~S PA~¢)
I UNCLASSIFIED I $3 ,00

REC-OCE-70-30
POND LININGS FOR DESALTING
PLANT EFFLUENTS
Field and laboratory evaluation of four types of lining materials for seepage control in brine disposal ponds
by
W. R. Morrison R. A. Dodge
J. Merriman
L. M. EIIsperman
September 1970
Division of Research Office of Chief Engineer Denver, Colorado
UNITED STATES DEPARTMENT OF THE INTERIOR Walter J. Hickel Secretary
BUREAU OF RECLAMATION Ellis L. Armstron~j Commissioner

A C K N O W L E D G M E N T
This study was conducted under the supervision of L. M. EIIsperman, Program Coordinator. C. W. Jones assisted in the supervision of the laboratory and field soil and soil-cement testing. Field investigation was conducted by W. R. Morrison, R. A. Dodge, K. B. Goral, and J. Merriman. C. K. Beebe, L. J. Cox, C. T. Coffey, R. C. Hatcher, and M. E. Hickey assisted in field construction. Laboratory tests were conducted by L. J. Cox, F. B. Larcom, Ko B. Goral, and Wo R. Morrison. Photographs by W. M. Batts and N. L. Russell.
Reprint or republication of any of this material should give appropriate credit to the Bureau of Reclamation, Department of the Interior.
The information contained in this report regarding commercial products or firms may not be used for advertising or promotional purposes and is not to be construed as an endorsement of any product or firm by the Bureau of Reclamation.
b

CONTENTS
Page
I ntrod uct ion . . . . . . . . . . . . . . . . . . . . . . . . . . . . 1
Water Pol lut ion Regulations . . . . . . . . . . . . . . . . . . . . . . . 1 Lining Materials Investigated . . . . . . . . . . . . . . . . . . . . . . . 2
Compacted Earth Linings . . . . . . . . . . . . . . . . . . . . . . . . 2 Flexible Membrane Linings . . . . . . . . . . . . . . . . . . . . . . 2 Hard-Surface Linings . . . . . . . . . . . . . . . . . . . . . . . . 3 Soil Sealants . . . . . . . . . . . . . . . . . . . . . . . . . . . . 3
Conclusions . . . . . . . . . . . . . . . . . . . . . . . . . . . . . 4
Field Investigation . . . . . . . . . . . . . . . . . . . . . . . . . 4 Laboratory Investigation . . . . . . . . . . . . . . . . . . . . . . . 5
Init ial Investigations . . . . . . . . . . . . . . . . . . . . . . . . . . 6
Roswell, New Mexico . . . . . . . . . . . . . . . . . . . . . . . . 6 Webster, South Dakota . . . . . . . . . . . . . . . . . . . . . . . . 6 Dalpra Farm . . . . . . . . . . . . . . . . . . . . . . . . . . . 6
Field Instal lat ion . . . . . . . . . . . . . . . . . . . . . . . . . . . 6
General . . . . . . . . . . . . . . . . . . . . . . . . . . . . . 6
Moni tor ing System for Seepage and Evaporation Measurements . . . . . . . . . 10
Field Test Results . . . . . . . . . . . . . . . . . . . . . . . . . . . 12
General . . . . . . . . . . . . . . . . . . . . . . . . . . . . . 12 Effectiveness of Lining Materials . . . . . . . . . . . . . . . . . . . . . 12 Evaluation of Seepage Measurements . . . . . . . . . . . . . . , . . . . . 15
Laboratory Investigations . . . . . . . . . . . . . . . . . . . . . . . . 21 Laboratory Test Results . . . . . . . . . . . . . . . . . . . . . . 21
2i Soil Testing . . . . . . ~ . . . . . . . . . . . . . . . . . . . . .
Soil Sealants . . . . . . . . . . . . . . . . . . . . . . . . . . . 21 Flexible Membrane Linings . . . . . . . . . . . . . . . . . . . . . 22 Asphalt ic Concrete . . . . . . . . . . . . . . . . . . . . . . . . . 22
23 Soil~:ement . . . . . . . . . . . . . . . . . . . . . . . . . . . . Spray-applied L iquid Asphalt . . . . . . . . . . . . . . . . . . . . 23
Recommendations . . . . . . . . . . . . . . . . . . . . . . . . . . 23
General . . . . . . . . . . . . . . . . . . . . . . . . . . . . . 23 Lining Materials . . . . . . . . . . . . . . . . . . . . . . . . . . 23 Seepage Moni tor ing for Brine Disposal Ponds . . . . . . . . . . . . . . . . 25
Future Field Tests . . . . . . . . . . . . . . . . . . . . . . . . . . 29 3O References . . . . . . . . . . . . . . . . . . . . . . . . . . . . .
Materials Listing . . . . . . . . . . . . . . . . . . . . . . . . . . . 31

CONTENTS-Continued
Appendix I-Summary of Field Seepage Measurements . . . . . . . . . . . Appendix I I -Laboratory Test Results Appendix II I -Construct ion of Test Ponds . . . . . . . . . . . . . . . . Appendix IV-Laboratory Test Methods . . . . . . . . . . . . . . . . .
Page
33 45 95
101
TABLES
Title Number
Comparison of Seepage Losses . . . . . . . . . . . . . . . . . 1 Thermocouple Readings . . . . . . . . . . . . . . . . . . . 2 Evaporation Data 3 Evaporation Data (Metric Units) . . . . . . . . . . . . . . . . 3A Temperature Effects, on Evaporation Rate • . . . . . . . . . . . 4 Estimated Errors i'n Water Level Measurements . . . . . . . . . . . 5 Soil Use Chart . . . . . . . . . . . . . . . . . . . . . . 6 Seepage Losses
Nylon-reinforced Butyl Rubber . . . . . . . . . . . . . . . 7 Polyethylene Plastic Lining . . . . . . . . . . . . . . . . . . 8 Asphaltic-concrete Lining . . . . . . . . . . . . . . . . . 9 Soil-cement Lining . . . . . . . . . . . . . . . . . . . . 10 Compacted-earth Lining . . . . . . . . . . . . . . . . . . 11 CMC plus ALUM 12 Attapullogite Clay Formulation . . . . . . . . . . . . . . . 13 Liquid Asphalt . . . . . . . . . . . . . . . . . . . . . 14 Natural Soil . . . . . . . . . . . . . . . . . . . . . . 15
Soil Test Data-Roswell Soil . . . . . . . . . . . . . . . . . 16 Soil Test Data-Dalpra Soil . . . . . . . . . . . . . . . . . . 17 Chemical Analysis of Soil and Water from Roswell . . . . . . . . . 18 Chemical Analysis of Dalpra Brine Effluent . . . . . . . . . . . . 19 Permeability Data-Roswell . . . . . . . . . . . . . . . . . . 20 Permeability Data-Dalpra 21 Physical Properties of PVC Lining 22 Physical Properties of Polyethylene Lining . . . . . . . . . . . . 23 Puncture Resistance of Plastic Films . . . . . . . . . . . . . . . 24 Physical Properties of Nylon Butyl Rubber . . . . . . . . . . . . 25 Asphaltic Concrete Lining
Asphalt-cement Properties . . . . . . . . . . . . . . . . . 26 Aggregate Gradation . . . . . . . . . . . . . . . . . . . 27 Immersion-compression Test Data 28 Sustained Load Test Data . . . . . . . . . . . . . . . . . 29 Permeability Test Data . . . . . . . . . . . . . . . . . . 30
Soil-cement-Unconfined Compression and Permeability Test Data . . . . L iqu id Asphalt
31
Physical Properties " . . . . . . . . . . . . . . . . . . . . 32 Penetration Test Data . . . . . . . . . . . . . . . . . . . 33
Page
12 16 17 18 20 20 26
35 36 37 38 39 40 41 42 43
49 51 53 54 57 61 67 68 69 70
73 74 75 76 77
81
89 90
. i i

CONTENTS-Continued
Title
Unconfined Compressive Strength Data
23 ° C and 50 percent RH . . . . . . . . . . . . . . . . 60 ° C and oven cured . . . . . . . . . . . . . . . . . .
In-place Density Test Data . . . . . . . . . . . . . . . . . .
FIGURES
Title
Location Map . . . . . . . . . . . . . . . . . . . . . . . Dalpra Farm Test Site . . . . . . . . . . . . . . . . . . . . Seepage from Test Ponds . . . . . . . . . . . . . . . . . . . Evaporation Rates vs Temperature Change . . . . . . . . . . . . Corrections for Evaporation Rate . . . . . . . . . . . . . . . . Standard Soil Properties-Roswell . . . . . . . . . . . . . . . Standard Soil Properties-Dalpra . . . . . . . . . . . . . . . . Soil-cement Compaction Test Data . . . . . . . . . . . . . . . Soil-cement Durability Data, 6 Percent Cement . . . . . . . . . . . Soil-cement Durability Data, 8 Percent Cement . . . . . . . . . . . Soil-cement Durability Data, 10 Percent Cement . . . . . . . . . . Mechanical Analysis Sand Pad . . . . . . . . . . . . . . . . . Radial Flow Permeability Test . . . . . . . . . . . . . . . . .
Number
34 35
36
Number
1 2 3 4 5 6 7 8 9
10 11 12 13
Page
91 92
98
Page
7 8
13 19 28 50 52 82 83 84 85 99
112
PHOTOGRAPHS
Title
Dalpra Farm Test Site . . . . . . . . . . . . . . . . . . . .
Asphaltic Concrete . . . . . . . . . . . . . . . . . . .
Penetration of Liquid Asphalt . . . . . . . . . . . . . . . . . Lining Construction Sequence . . . . . . . . . . . . . . . . . Tank Installation . . . . . . . . . . . . . . . . . . . . . Laboratory Soil Permeability Tests . . . . . . . . . . . . . . . Environmental Control Chamber . . . . . . . . . . . . . . . . Tensile Strength and Elongation Tests . . . . . . . . . . . . . . Soil Burial Test . . . . . . . . . . . . . . . . . . . . . . Puncture Resistance Test . . . . . . . . . . . . . . . . . . . Sustained Load Test . . . . . . . . . . . . . . . . . . . .
Number
1 2 3 4 5 6 7 8 9
10 11
Page
9 24 24 96 97
105 106 106 107 108 110
iii

INTRODUCTION
In the production of potable water at inland desalting plants, a large quantity of concentrated brine (effluent) is also produced. One method for the disposal of the effluent is the use of evaporation ponds. In June of 1967, the Bureau of Reclamation (USBR) was authorized by the Office of Saline Water (OSW), under Agreement No. 14-01-0001-1306, to conduct an eight-point program entitled "Surface Facilities for Disposal of Desalting Plant Effluents." The objective of the program was to develop design and operating criteria for brine disposal ponds.
Briefly the eight-point program, completed in June of 1970, consisted of:
a. Preparation of a "State-of-the-Art" bibliography and review on brine disposal ponds. Included in the review is a survey of 50 States and the Federal Water Quality Administration* on water pollution regulations pertaining to brine disposal ponds)
b. Explore and evaluate soil samples for proposed brine disposal pond sites.
c. Laboratory evaluation of pond lining materials and soil sealants.
d. Development of a monitoring system for continuous and routine measurements of seepage losses.
e. Develop and evaluate techniques for increasing evaporation rates. Spraying to increase evaporation rates was investigated and reported by OSW?
f. Conduct field tests on pond linings and soil sealants.
g. Preparation of a manual on the design, construction, and operation of brine disposal ponds .3
h. Conduct an economic study of salt disposal. Results o f this study are summarized in the manual.3
This report summarizes thb laboratory and field evaluation of various pond lining materials and soil sealants. Field studies were conducted at Dalpra Farm; a field test installation near Longmont, Colorado, where the USBR, under another OSW contract, is evaluating various desalting equipment. Included in the field tests were two soil sealants recommended by Diamond Shamrock Corporation, Painesville, Ohio, who conducted earlier studies for OSW on soil sealants.4., s In the laboratory evaluation, soils from both Dalpra Farm and the Roswell, New Mexico OSW Desalting Plant area were used. Also included in the report are recommendations on a monitoring system for measuring seepage losses from brine disposal ponds.
WATER POLLUTION REGULATIONS
The feasibility of using brine disposal ponds will depend primarily on the development of low-cost pond liners and sealers. Such materials will also have to provide adequate seepage control as dictated by local water pollution regulations.
In the survey of state regulations concerning brine disposal ponds, 1 most states do not have specific regulations on maximum permissible seepage losses from brine disposal ponds, but many have some provisions for seepage control under other regulations. Many states appear to be studying the problem and may publish specific regulations in the future. Only four states listed any quantitative figure for seepage limits and these they inferred from other waste and sewage requirements. Minnesota gave a figure of 0.01 ft/day (3.7 x 10 - 6 cm/sec) maximum. Idaho, Nebraska, and Washington required seepage less than 0.02 ft/day (7.5 x 10 - 0 cm/sec).
In soils engineering, soils are customarily regarded as impervious if the coefficient of permeability** is less than 1 f t /yr (1 x 10 - 6 cm/sec) or about 0.003 ft/day. 6 Seepage over 0.003 ft/day (1 x 10 - 6 cm/sec) may be excessive in certain areas for brine disposal ponds, ~ and regulations for impervious ponds may specify seepage less than 0.003 ft/day (1 x 10 - 6 cm/sec) or even 0.
*Formerly Federal Water Pollution Control Administration (FWPCA). i 2 3 4 s 6 References listed on page 30. **The coefficient of soil permeability is based on a unit head of water on a unit depth of soil of unit area. Seepage through canal and pond linings are usually expressed in terms of volume of water loss over a unit area per unit of time (as cubic feet per square feet per day-cfd) regardless of water depth. In this report seepage Units have beer abbreviated to velocity terms (as feet per day, or feet per year where values are very small).

LINING MATERIALS INVESTIGATED
Four types of lining materials were investigated for possible use in brine disposal ponds, and they include: compacted earth, flexible membrane linings, hard-surface linings, and soil sealants.
Compacted Earth Linings
Compacted-earth lined ponds often are the lowest in construction costs. The costs range from $0.60 to $0.90 per square yard, depending upon thickness and density required for desired seepage control. Factors to be determined with compacted-earth lined ponds are: is the pond sufficiently impermeable, does the brine effect permeability, and is there assurance of continued impermeability over the life of the pond.
As in other earth construction, the design of earth lining for evaporation ponds will depend, in part, on the properties of the soil used. Because of the variation in soil composition, testing is required to define the properties needed for design purposes. For these evaporation ponds the effect of brine on the soil properties must also be evaluated. This can be accomplished by incorporating the brine into the soil test procedure wherever feasible.
In addition to the soils studied in this investigation there are some data available on an earth lined pond used for salinity alleviation at Malaga Bend Division of the McMillan-Delta Project near Carlsbad, New Mexico. Because of the similarity between this pond and the ponds proposed for desalting plant effluents, the available information is pertinent to this study.
The problem in the Malaga Bend area was the seepage of highly mineralized water into a 3-mile (4.8-kin) reach of the Pecos River. This seepage increased the salt load in the river by about 430 tons (390 metric tons) per day. Alleviation of this contamination was accomplished by lowering the water table to below the river level by pumping from wells into a compacted~a~h lined evaporation pond. The area of this pond is approximately 85 acres (34 ha) with a capacity of about 1,000 acre-feet (1.2 x 10⁶ cu m).
The earth lined pond was constructed by scarifying the native soil, a lean to plastic clay, to a depth of 18 inches (46 cm) and compacting the full 18 inches (46 cm) from the surface in one layer. The soil was compacted to at least 98 percent of maximum density
3 7Op ' cit. p. 1.
with 22 passes of a 18,900-pound (8,600-kg) vibratory roller. Available information shows that seepage through the lining was estimated to be 0.5 ft/yr (4 x 10 - 7 cm/sec).
Although the available information is limited it does show that an effective earth lining can be obtained when clayey soils are used. The unit cost for this lining was about $0.70 per cubic yard in 1963 when the pond was constructed under USBR Specifications No. 500C-126. A report on theperformance of this pond is being prepared by the U.S. Geological Survey Office at Carlsbad.
Flexible Membrane Linings
Polyvinyl chloride (PVC) and polyethylene are presently the most widely used plastic film materials for lining applications. 7 These flexible linings are easy to install, requiring a minimum of equipment and skilled labor. The linings are placed on prepared subgrades and normally covered with earth material to protect them from the elements and physical damage. Rastic membranes are low in cost, with complete installation, including cover materials, ranging in Cost from $1.00 to $1.50 per square yard.
PVC is more resiStent to puncture, more readily available in large fabricated sheets, and more easily repaired and field spliced than polyethylene. PVC is supplied in widths up to 65 feet (20 m) and to any length practical for handling, to minimize the amount of field joining required. This lining is generally supplied accordion folded in both directions so that the liner can readily be unfolded from a truck traveling on the subgrade.
For installing a PVC lining, adjacent sheets are joined using a 4-inch (10.2-cm) minimum width bonded-lap joint with solvent adhesive recommended by the PVC lining manufacturer.
A PVC lining, 10 mils (0.25 mm) thick, was evaluated in this study. The lining installed at the Dalpra Farm test site was shop fabricated in one piece to fit the interior vertical surface and base configuration of the test tank. USBR specifications 3..7 require that factory bonded seems shall be watertight and the strength of the bonded seams either in the machine or transverse direction of the film shall be not less than 80 p~'cent of the breaking strength of the film when tested in a similar direction.
2

Polyethylene plastic lining is lower in cost than PVC and exhibits greater resistance to soil bacteriological deterioration. This is primarily because the use of plasticizers is not necessary in the manufacturing of polyethylene. Some low-grade plasticizers used in the manufacturing of PVC to impart f lexibi l i ty may be vulnerable to micro-organism attack and water leaching.
Polyethylene is available in seamless widths to 40 feet (12 m) and normally in custom roll lengths of 100 feet (30 m). An accordion-fold seam is used to join polyethylene lining. This type seam should be bonded together with tape or adhesive as recommended by the manufacturer.
A custom roll of polyethylene plastic, 6 mils (0.15 mm) thick, was obtained for evaluation at Dalpra Farm. The roll was wide enough to provide a seamless lining. This f i lm was primarily manufactured for agricultural- and industrial-type use. Such a fi lm occasionally has defects such as pinholes and blisters and is not expected to be as watertight as PVC.
A 45-mi l - (1.14-mm-) thick, nylon-reinforced butyl-rubber liner was evaluated at Dalpra Farm. The lining was shop fabricated from 54-inch- (137.2-cm-) wide sheets. The sheets were joined using a 4-inch- (t0.2-cm-) wide lap seam bonded with butyl adhesive. The rubber liner was originally scheduled for use in the evaporation monitoring pond but due to some seam problems it was not used for this purpose. Rubber linitlgs are relatively high in cost ($2 to $3 per square yard installed) and this limits their use to only special installations.
Hard-surface Linings
Either asphaltic-concrete or soil-cement linings could be designed for use in brine disposal ponds requiring a durable, hard-surface lining. The use of such linings is primarily dependent upon source and type of locally available aggregate.
Asphaltic concrete is a carefully cont[olled mixture of asphalt cement and well-graded aggregate, thoroughly mixed and compacted while hot into a uniform, dense mass. Properly mixed and placed, asphaltic concrete forms a watertight, durable, erosion and chemically resistant lining for brine disposal ponds. These mixtures are higher in asphalt binder and mineral fi l ler contents than asphaltic-concrete mixes used for highway surfacing. The higher contents are required to produce an essentially voidless mix for water
8 9 10 11 12Op. c i t . p ' 1.
impermeability.8 9 A hydraulic-type mix, based on the USBR asphaltic-concrete lining specifications was installed at Dalpra Farm. Construction costs for a 2- to 3-inch- (5.1- to 7.6-cm-) thick compacted lining, which is generally sufficient for shallow evaporation ponds, will vary between $1.50 to $2.00 per square yard.
Soil~:ement is a mixture of soil, portland cement and water. As the cement hydrates, the mixture becomes hard, and would form a hard-surface type of lining. In USBR experimentation with soil-cement as a canal lining, performance has been variable depending upon the soils, amount of cement, care taken during construction, and climatic conditions, s o A well-graded sand with 15- to 30-percent fines passing a No. 200 sieve is usually best. Where such soil is readily available, the USBR sometimes uses soil-cement as an alternative lining for fresh-water reservoirs. Also, in locations where rock is scarce, soil-cement is used as an a l te rna t i ve to rock riprap for facing earth embankments containing bodies of water. ~ i In this investigation, laboratory tests were conducted on Dalpra Farm soil with Type V portland cements of 6, 8, and 10 percent by weight by dry soil. Also, one seepage test of soil-cement at Dalpra Farm was conducted; although Type V sulfate-resistant cement would normally be recommended, Type I cement was inadvertently used in the seepage test. Detrimental effects of sulfates in the brine on soil-cement would require time, probably a longer period than covered by these tests. Therefore, the use of the less resistant Type I cement allowed a more critical evaluation of performance within the relatively short test period.
On a recent soil-cement lining for a 160-acre (64.8-ha) pond, soil-cement cost $6.32/cu yd ($8.27/cu m); this amounts to $1.05/sq yd ($1.26/sq m) for a 6 inch (15 cm) thickness.
Soil Sealants
Over the years the USBR has investigated 12 a number of admixtures and chemical agents for controlling seepage in canals. These materials ranged from the rather common products such as portland cement and sodium carbonate to specifically formulated asphalt emulsions, resinous polymers, petroleum emulsions, and various compounded agents.
The action of the agents can be physical plugging of pores, the formation of a distinct impermeable membrane, or chemical reactions with soil constituents. Application methods include surface spraying, subsurface injection, addition to water or

brine for subsequent deposition in the subgrade, and mixing with soil. Most of these materials will produce specific results with certain soils, but produce highly variable results with different soils.
Prior to the USBR involvement in the OSW program, Diamond Shamrock conducted studies on soil sealants for OSW. The work was primarily concerned with evaluating the effectiveness of various chemical products in rendering soil from Roswell, New Mexico, impervious to waste brine. 4 Diamond Shamrock conducted additional studies in cooperation with the USBR. Their contract work was completed and reported in June of 1968. s
In these studies, over 160 formulations using 25 materials and several secondary additives were tested. Generally, the materials were mixed into the soil and then compacted to achieve seepage reduction.
Diamond Shamrock reported four classes of additives were effective in rendering local soil suitably impervious to brine effluent from the Roswell, New Mexico desalination plant. The four additives were: lignin derivatives gelled with sodium chromate or alum, carboxymethyl cellulose with alum, petroleum emulsions and an attapulgite clay formulation. In their tests conducted with Dalpra Farm soil, soil Sample No. 48D-11 was rendered satisfactorily impervious with either carboxymethyl cellulose and alum or the attapulgite clay formulation. However, a second soil sample (48D-18) could not be adequately sealed. Sample No. 48D-18 was a more sandy material than 48D-11.
Two mixtures were recommended by Diamond Shamrock for field testing at Dalpra Farm. These mixtures, along with their costs at the recommended applications rates, are listed below:
1. Two percent attapulgite clay formulation; material cost-$0.21 per square yard.
2. Combination of 0.25 percent medium molecular weight carboxymethyl cellulose with 0.05 percent alum; material cost-$0.46 per square yard.
Percentages are based on dry weight of soil. Alum is used to produce a stiffer gel product.
Based upon the ease of application, minimum subgrade p r e p a r a t i o n , low-cos t , and w a t e r p r o o f i n g characteristics, a liquid cutback asphalt was selected
4 SOp . cit. p. 1. 13Op. cit. p. 1. *Gallons per square yard.
for evaluation as possible lining material for" brine disposal ponds. The liquid asphal~t, Code B-5876, is a proprietary product formulated for deep penetration, and produces a hard-base asphalt residue upon solvent evaporation. Earlier USBR laboratory studies 13 indicated the proprietary product was superior to standard emulsified or cutback asphalt materials for stabilizing sandy soils. The material is easily spray-applied with conventional equipment. Cost of the liquid asphalt for a brine pond application would vary between $0.50 to $0.75 per square yard depending upon quantities involved. An application rate of 2 gsy* (9.2 I/m 2) was used at Dalpra Farm.
CONCLUSIONS
Field Investigation
The conclusions listed below are based on the field inves t iga t ion conducted under the following conditions:
A. Natural soil at Dalpra Farm is a relatively pervious silty sand. The average seepag, e rate during the test season was 75 ft /yr (7.5 x 10 - ° cm/sec).
B. Brine effluent had an average pH of 8.2 and contained over 80 percent sodium salts. The average Total Dissolved Solids (TDS) was about 3,000 parts per million (ppm).
C. Test season was from about May 1 to December 1, 1969.
D. Seepage comparisons are based on the assumption that all seepage losses occurred through the bottom of the ponds.
1. The four types of lining materials evaluated, listed generally in the order of decreasing effectiveness for seepage control are: flexible membrane l in ings; hard-surface linings; compacted-earth linings and soil sealants.
2. The PVC plastic was the most effective lining material. Field tests and visual observations indicated the PVC provided a watertight lining. Because of its impermeability the PVC-lined pond was used to measure the evaporation rate required in the water budget monitoring system. The nylon-reinforced butyl rubber was nearly as effective as the PVC lining. However, some
4

prob lems were encountered in obtaining watertight seams. Field measurements indicated the thin polyethylene plastic had some material defects and was inadequate as a lining. Thicker polyethylene plastic film specially formulated for l in ing purposes would probably" perform
effect ively.
3. Of the two hard-surface linings evaluated, asphaltic concrete was the most effective and provided a satisfactory lining. As tested at Dalpra Farm, the asphaltic concrete did not deteriorate. Some cracking occurred to the soil-cement lining after winter exposure. The cracking was probably caused by either frost-heave or chemical reaction between the brine and soil-cement lining. For soil-cement linings to be satisfactory, Type V (sulfate resistant) cement should be used, and careful testing evaluation of the chemical and physical characteristics of the brine, available soil, and cement content would be needed for durability and imperviousness.
4. Although the compacted-earth lining provided a significant reduction in seepage, the soil used is not the type which would give the best lining. Use of clay material such as the Roswell soil would provide a much better compacted-earth lining.
5. This investigation and other studies have shown soil sealants to only reduce seepage and not affect a complete seal. Also, the service life of soil sealants is questionable. At this time, no soi l sealant has provided all of the sealing properties needed for brine disposal ponds.
6. Of the three soil sealants evaluated, the liquid asphalt, spray applied over the natural, untreated soil, showed the most seepage reduction. Some seepage reduc t i on was noted for the carboxymethyl cellulose and alum mixture. However, seepage was increasing at the end of the test season. The attapulgite clay formulation was not effective in reducing seepage. Its seepage characteristics were very similar to the natural, untreated soil.
7. The average evaporation computed from data obtained at the test site was about 38 in./yr (97 cm/yr). This compares with Weather Bureau averages for lake evaporation of 39 in./yr (99 cm/yr) and pan evaporation of 55 in./yr (140 cm/yr) for the years 1946 to 1955.
8. The instrumentation and analyses used at Dalpra Farm measured seepage to plus or minus one-third of a foot (10 cm) per year, which is adequate for these tests and generally for monitoring brine disposal ponds.
Laboratory Investigation
Laboratory tests were conducted primarily to determine: (1) the effectiveness of various soil sealants for reducing seepage in Roswell and Dalpra soil, and (2) physical properties of the lining material installed at Dalpra Farm. Based on the laboratory investigation, the following conclusions were indicated:
1. In the permeability tests conducted on lean,clay soil from the Roswell Desalting Plant area, compacted to above 80 percent maximum density, the effect of soil sealants was not evident. At 80 percent maximum density the effect of the sealants is more discernable. Within these data the methyl cellulose performed best as a sealant, reducing the permeability to zero. The other sealants, sodium silicate and lignin, performed well in some tests and poorly in others. Generally it appears that the most practical way to treat soils of this nature is to compact them to near maximum density end not use a sealant.
2. Permeability tests on Dalpra soil treated with the attapulgite clay formulation showed a reduction in permeability of 50 percent while tests with the carboxymethyl-cellulose- and alum-treated soil showed a reduction in permeability of 75 percent.
3. Laboratory tests conducted on the plastics and butyl-rubber lining materials indicated they had satisfactory physical properties for use in brine disposal ponds. However, the puncture resistance of the polyethylene, since it was thinner, was much lower than the puncture resistance for the PVC. Also, for the nylon-reinforced butyl, test results showed the bonded seams had low peel strength, and cracking was noted during the accelerated ozone test.
4. L a b o r a t o r y tests showed a satisfactory h y d r a u l i c - t y p e mix was used in the asphaltic~concrete lining and that adequate compac t i on was used during construction. Permeability tests conducted on core samples of the in-place lining indicated the asphaltic concrete was impervious.
5

5. Laboratory testing indicated that soil-cement contaihing 8 percent Type V portland cement would be adequate. Strength and/durabil i ty test results were satisfactory, and permeability test results showed the soil-cement to be nearly impervious.
6. The liquid asphalt material, spray applied over the natural soil at a rate of 2 gsy (9.2 I/m2), penetrated 1 to 1.5 inches (2.54 to 3.81 cm). The liquid asphalt was slow curing in Dalpra soil. Laboratory permeability tests were not reliable because of piping. However, no deterioration was noted in the permeability sample from exposure to the Dalpra brine effluent.
INITIAL INVESTIGATIONS
Roswell, New Mexico
The field test site was originally scheduled to be constructed at the Roswell Demonstration Plant. In August 1967 a field investigation was made at the Roswell site. Soil and well-water samples were obtained for laboratory testing, Also, some general observations were made concerning the area around the plant. It appeared that the high ground-water table, the clay soil in the area, and the lack of sufficient surface area would present construction problems. A tentative plan was made involving purchase of higher ground adjacent to the plant area to reduce the ground-water effect, and the installation of a drainage system to carry seepage from the test ponds. Drainage was necessary to avoid the effect of the relatively impervious soil.
Pending approval of this plan, laboratory testing was initiated. This testing included standard soils testing, chemical analyses of well water and soil, and a series of permeability tests. Test results are summarized in Appendix II ; Tables 16, 18, and 20; and Figure 6.
In subsequent meetings between the USBR, OSW, and Diamond Shamrock, it was decided that the test installation construction problems, the difficulties OSW was having in purchasing sufficient land for the test installation, and the problems which would inevitiably arise in administration of the program from Denver, made use of the Roswell site impractical.
Webster, South Dakota
Init|ally another desalting plant located at Webster, South Dakota, was tentatively considered as a field test
site. However, when it was discovered that this plant was located within the Webster city limits, and that no suitable areas were available for the test installation, this installation was discarded. No field or laboratory testing was performed.
Dalpra Farm
The site finally selected for the field test installation is located on the Gilbert O. Dalpra Farm near Longmont, Colorado. This site, shown on location map, Figure 1, offers several advantages over the other proposed sites. It is approximately 35 miles (56 km) from the Denver Federal Center, so daily trips to the site are practical and management of the tests is not diff icult. The natural soil is a silty sand with a relatively high permeability rate thus eliminating drainage problems. In addition, a demineralizer plant operated by the USBR under contract for OSW is located at the field site. Various membrane-type demineralization units are evaluated using brackish, natural well water. The brine effluent from the plant is piped to a waste pond adjacent to the evaporation test pond area. The effluent is then readily available for pumping to the various test ponds.
Preliminary field investigation at the Dalpra Farm test site included field permeameter tests to evaluate the in-place soil permeability; logging of the subsurface soil to a depth of 10 feet (3 m) by visually classifying the soil taken from auger holes; in-place soil density testing, and procurement of soil samples for laboratory testing. Laboratory testing included gradation analysis, soi l consistency tests, compaction tests, and permeability tests. Test results are summarized in Appendix II, Tables 17 and 21, and Figure 7.
FIELD INSTALLATION
General
The field test site at Dalpra Farm is shown in Figure 2 and Photograph 1. After consultation with Diamond S h a m r o c k , 1 8 - f o o t - ( 5 . 5 - m - ) d iameter corrugated-metal, bottomless tanks were selected for use as the evaporation ponds. The construction of the test ponds was done primarily under contract, USBR Specifications No. DC-6668 (SF). The construction phase is discussed in Appendix III.
Ten bottomless tanks were installed, and each had a different lining material for evaluation, as listed below. Briefly, the linings included:

~ LONG~IONT
COLO, I I 9
D A L P ~ A FARM
COLO. 52
h
DAC0 NA COCO, 6 2
FT. LU PTON
= c o l o . 7 ¶ ' rLAFAYETT E
I
It r
~j
1% 00 ui
COLO. 7
81~IGHTON
,=8 l D E N V E R
LOCATION M A P
7 Figure 1. Location map.

3oo" I T M
L 80" -~ ~ ~ o ' ~ = - - ~ 4 . - r F ~°" {
CI-IL O~OlDE ~
, w
C O N C R £ T E E A I ~ T H C E M E N T .~ o I I I ~
I
r ~ ~ ~ L NATUI?AL SOIL
~. C O N T I ~ O L P O N D ) ¢
t I a I i l I I I I I I I | ~ I I i
! I
[Vosfe Pond
I i I I I I I I I I ' I I i I ! m u I i ~ . !
Rood
~ ~ . x o ' ~ h * n g ~ n c e
W E A T H E , O srAno~ -~
[ ]
INS TRUMENT TRAILER --~
O0
J u ~
k=~,o o':/~
t ' , "
a t ~ , Z,-~ 0 qC = n.r. ~=b; /=
t?. - . ,,," . . .
(3 : - " a n - - " "
~.tFF a==. = ~. . . , c~ 0 0 ~ o.
=c= I~ < w
DA L P R A FAI?M TEST 31TE"
Z O C A T / O / ~ P L A T
Figure 2. Dalpra Farm test site=Location plat.

,~=~- ~ : ~ . , ~ ~ ~.~..-~G~Lt~% • ~ . ~
General view of test site. Brine effluent pond for demineralizer plant is shown in foreground.
View of evaporation pond showing stilling well, water level gage and thermocouples.
Water level gage.
Photograph 1. Dalpra Farm test site for evaluation of lining materials for use in surface facilities for disposal of desalting plant effluents,
9

1. Polyvinyl chloride, 10 mils (0.25 mm) thick. Tank No. 2.
2. Polyethylene, 6 mils (0.15 mm) thick. Tank No. 3.
3. Nylon-reinforced butyl rubber; 45 mils (1.14 mm) thick. Tank No. 5.
4. Asphaltic~concrete lining, 2 inches (5.08 cm) thick. Hydraulic-type mix containing 7.1 percent asphalt based on dry weight of aggregate. Tank No. 7.
5. SoilCement, 6 inches (15.2 cm) thick, containing 8 percent cement based on dry weight of soil. Tank No. 9.
6. Compacted~arth lining, 12 inches (30.5 cm) thick. Tank No. 8.
7. Chemical soil sealant recommended by Diamond Shamrock Company, 6-inch- (15.2¢m-) thick lining containing 2 percent attapulgite clay formulation, based on dry weight of soil. Tank No. 4.
8. Chemical soil sealant recommended by Diamond Shamrock Company, 6-inch- (15.2-cm-) thick lining containing 0.26 percent carboxymethyl cellulose and 0.05 percent alum, based on dry weight of soil. Tank No. 1.
9. Liquid cutback asphalt, B-5876, spray-applied over the natural soil at an application rate of 2 gsy (9.2 I/m2). Tank No. 6.
10. Natural soil, untreated. Tank No. 10.
With the exception of the natural so~l, Tank No. 10, the linings were placed over previously prePared sand drainage pads. All tanks ware 6 feet (1.8 m) high, except for the 8-foot- (2.4-m-)high tank used for the compacted~earth lining. The tanks were installed in the ground as shown in Figure 2. A nylon-reinforced butyl-rubber liner was placed on the interior vertical surface to insure uniform evaporation and thermal conditions for all ponds.
Equipment was installed to measure seepage and evaporation losses, brine temperature at both the water surface and at the interface of the lining, and to monitor the weather conditions.
The linings were tested using a 3-foot (0.9-m) head of brine effluent to provide a realistic measurement of the
liners' seepage control effectiveness. A 50-gpm (180-1~'min) pump was installed, along with a firehose, to supply brine from the demineralizer plant's waste pond to the various tanks. A watermeter, calibrated for reading to 0.1 gallon (0.38 I), was installed in the pumping system to measure the volume of brine inflow to each pond.
Construction of the ponds was completed in late September of 1968. Installation of the pumping, seepage, and evaporation monitoring systems was completed in mid-October, and initial filling of the ponds was started. However, during initial filling some leakage through the vertical (field) seams of the sides in several metal tanks was encountered. These tanks!were dewatered so that additional mastic material could be placed over the problem seems to correct the leakage. Necessary repairs were completed in November. However, due to subfreezing weather, field tests were discontinued for the winter.
Field testing was resumed in the spring of 1969 and ran through the first week in December. The !,field evaluation of the various linings materials was based primarily on this test season. Generally, at least one trip per week was made to the field site to perfor m the following functions:
1. Fill the ponds as required to maintain a 3ofoot (0.9-m) brine level. After each filling the water,level recorder charts were changed. The new chartswere referenced by siphoning the brine surface leve!/over the walls of the ponds and setting the charts to relate to 3.0-foot- (0.9-m-) depth marks on the outside of each pond. Average seepage, and evaporation rates were based generally on weekly water-level recorder history.
2. Change weather and water temperature recording charts, and record anemometer and odometers readings for determining wind velocity history at the site.
3. Observe and note any unusual changes in the field tests and perform general maintenance as required.
Monitoring System for Seepage and Evaporation Measurements
Instrumentation was set up at the test site to record the variables needed to evaluate the lining materials tested and to obtain field measurement experience. Such experience w a s necessary in making recommendations for instrumentation required, for
1 0

proper operation and maintenance of brine evaporation ponds.
Seepage must be determined and its direct measurement is dif f icult. Since watertight ponds were the goal of this study, any seepage was expected to be small and of the same magnitude as evaporation. Thus, evaporation must be accurately determined.
Evaporation rates are affected b y the fol lowing variables:
1. The amount of solar radiation energy absorbed by the body of the water.
2. Saturation vapor pressure, surface tension, and wave roughness of the water at the air interface.
3. The relative humidity, temperature, velocity, and boundary layer characteristics of the air above the water.
4. Salinity of the water.
The water budget, an accounting for all water gains and losses, is the simplest accurate means to determine evaporation or seepage, providing one of these is known. The PVC-lined pond was watertight and was selected for monitoring evaporation.
During operation, the water level for all ponds was kept the same within practical limits, so that similar exposure to wind and thermal conditions was maintained for all the tanks.
Instrumentation was installed to measure and record water-level changes caused by brine and precipitation inf low and evaporation and seepage outf low for water budget computat ions. Measurements of other meteorological factors were made to verify the evaporation determinations and to help explain any seepage anomalies that might occur during the test season. Instrumentation included:
1. Recording water level gages.-Both evaporation and seepage determinations are dependent upon good water-level records. Counter-weighted 5-inch (12.7~m) float-type water level gages were used to measure and record weekly histories of water level in the test ponds. These gages were designed to respond from a static condition to a O.01-foot (O.3~m) change in water level. However, experience with this equipment at the test site suggested better accuracy because lag was minimized since stage reversal was rare and enough water surface wave actio n was present to keep the mechanism moving.
Still ing wells were used to shield the floats and weights from effects of wind. Brine input was metered to provide a check against the other water-level measurements.
2. Rain gage.-To account for precipitation inf low in the water budget, a bucket collecting recording rain gage was installed at the test site. The bucket is mounted on a spring-type weighing mechanism which converts weight into inches of rainfall. The pen reverses at 6 inches (15.2 cm) to give a ful l scale of 12 inches (30.4 cm). The gage was calibrated by a set of weights. The manufacturer claims an accuracy of 0.5 of 1 percent full scale (plus or minus 0.06 of an inch rainfall). The smallest division on the chart is 0.05 inch (1.27 ram).
3. Tempera tu re and relative humid i t y . -A hygrothermograph was used to record temperature sensed by a bimetal assembly and simultaneously records relative humidity by means of a human hair sensing element. The manufacturer claims that errors of relative humidi ty rarely exceed 4 percent. The hygrothermograph was calibrated before the test season in a laboratory temperature controlled 50 percent relative humidity room. After the test season the calibrations were checked again. The temperature read about 1 ° F (0.5 ° C) high and the relative humidity read about 2 percent units high. Reading on the 8-day recorder chart can be estimated to 1 ° F (0.5 ° C) and 1 percent relative humidity with the smallest divisions being 2 ° F (1.1 ° C) and 2 percent relative humidity.
4. Wind measurement.-A standard cup-type weather anemometer fitted with a battery-powered odometer was set at about the same elevation as the top of the test tanks. The anemometer and odometer totalized miles of wind passing over the test site.
5. Atmospheric pressure.-A microbarograph with a bellows-type sensh~g element was used to measure and record atmospheric pressure. The smallest division on the recorder chart is 0.02 inch (0.51 mm) of mercury. The instrument was calibrated before the test season with a laboratory mercury barometer. After the test season the calibration was checked and the microbarograph read 0.02 inch (0.51 mm) high.
6. Water temperature measurements.-To sense water temperatures in all of the test tanks, lead (Pb) protected acid vat-type thermocouples were used. One was installed on the bottom lining interface, and another 2.5 feet (0.76 m) directly above the
11

bottom thermocouple, and 1 foot (0.3 m) away from the wall of the tanks. For thermal comparison the pair of thermocouples was mounted on the north side of each tank.
FIELD TEST RESULTS
General
expressed as ft/yr, and by 1.12; a constant for correcting for the difference in the lined area compared to the surface area of the water in the pond. The results of seepage determinations for the individual linings are summarized in Tables 7 to 15 in Appendix I. Also shown are the corresponding water surface elevations during the time interval.
Effectiveness of Lining Materials
Seepage losses as presented ware obtained by taking the total drop in water level during periods when the ponds were operating satisfactorily and dividing this value by the number of days of operation. After accounting for evaporation and precipitation, this value was multiplied by 365 to obtain the yearly value,
Summary of seepage losses for the lining materials is listed on Table 1 and shown graphically in Figure 3. Based on the results, flexible membrane linings were generally the most effective for seepage control; followed by hard-surface linings, compacted-earth lining, and soil sealants.
Table 1
COMPARISON OF SEEPAGE LOSSES FOR THE LINING MATERIALS EVALUATED AT DALPRA FARM
Lining material Code Initial
Seepage losses ft/yr (cm/sec x 10 -6)
Final Average
Polyvinyl chloride plastic PVC 0 0 0 Nylon-reinforced butyl NBR 0.57 0.06 0.25 Aspha Itic concrete AC 10.9" 0.82 2.32 Polyethylene plastic PE 2.72 6.34 3.96 Soil-cement SC 7.98 5.73 6.60 Sprayed liquid asphalt LA 15.9 6.14 10.7 Compacted earth CE 34.8 6.02 16.1 Carboxymethyl cellulose CMC 15.9 13.9 11.0 Natural soil (untreated) NS 164.0 36.0 75.0 Attapulgite clay formula ACF 124.0 36.0 75.0
* Includes small seepage loss through base perimeter joint.
1. Flexible membrane linings.-The PVC plastic was the most effective lining material evaluated for sealing the test ponds at Dalpra Farm. Seepage measurements, comparison to rain gage readings, and visual observations indicated this material provided a watertight lining. The TDS content of the PVC-lined pond increased from 3,900 to 5,900 ppm over a 10-month period. (Table 19 in Appendix II summarized the chemical analyses for the brine effluent at Dalpra Farm.)
The nylon-reinforced butyl-rubber lining, 45 mils (1.4 mm) thick, was nearly as effective as the PVC lining for seepage control. However, some problems
were encountered in obtaining watertight seams. Placement of the rubber sheeting to fit the configuration of the circular metal tank resulted in occasional bends and folds in the lining. At several bends and folds, some separation of the bonded seams occurred and allowed a seepage path through the lining. Low peel strength of the bonded seams was also noted in laboratory tests.
After the problem seams were repaired with butyl-rubber adhesive and neoprene caulk, blose comparison of water-level histories was noted between the butyl- and PVC-lined ponds. Data for the two ponds during the lest 84 days of the test
12

I 0 0 0 100 Z 1100 100 600
BOO
400
3 0 0
,tOO
N5 CE ACF CMC LA AC ~(,.. PE HBR PVC
NATURAL SOIL COM,OA C T~'D EA ~ TH A TTAPULLG/7"£ CLAY' CA R B OX Y/VlE THYL CEL L UL O.~E L/QUID ASPHALT A SPHA L TI C CONCI~£ T~ . . b u I J - - L~-M~.IVI
POL Y£ TWYL £ N £ NYLON-BUTYL RUB BEb2 POLYV/NYL CHLORI~E---
Z F_R O ,.5"[ EPA G . 1" .-- AND NO T PL 0 TrgD
DAL DRA TE3 T 51TE .SEEDA6E FROM TEST PONDS
I Nsj ~ ' ~ ' 7 " ~ ' " - "
,oo ,o ,o A c , ' - " ~ ' . _ - - . ~ 70 ~ o ~ '~ ~ ' ~ " " " " " "~' ~" '
' ° I . ~ / ' , N~ jo -CE""~- "
LA_ t ~ . ~ cMc"-..-" ~.: -.- . . , . ' ~ . . ~ . . . . cMc
. . . - 1 - , I , - , ~ . - ~ . ~ - - - ~ _ - - . ~ . . , , -
j _ %%___ _ ~. '~ '~"
I .9 ,11 .¥ .6 . |
.4
.J
, t
. I O ZO
NB~
I 40 6o jo
ELAPSED TIME- DAYS
". AC
N8~ 10
Figure 3. Dalpra test site-Seepage from test ponds.
13

season showed only a difference of water loss of 0.024 foot (0.73 cm). Some ozone cracking was noted in areas of the butyl liner subjected to high stress, especially at the rim of the tank where the butyl was folded and secured.
Field seeppge measurements indicated the 6-mil- (0.15-mm-) thick polyethylene lining had small tears or pinholes. One suspicious area is near the 3-foot (0.9-m) brine level. Generally a significant increase in seepage occurred when the test pond was filled to this devation. After a slight decrease in brine level, an abrupt decrease in seepage was noted. A thorough visual examination of this lining will be made when it is replaced with the 10-mil (0.25-mm) polyethylene lining.
2. Hard-surface linings.--Of the two hard-surface linings evaluated, asphaltic concrete appeared to be the more effective. Seepage measurements and visual observations indicated the 2-inch- (5.8-cm-) thick asphaltic concrete surfacing provided a satisfactory lining. The average seepage loss was 3.35 f t /y r (3.3 x 10 - 6 cm/sec). During the early stages of the test season, some problems were encountered in obtaining a watertight seal at the inside base perimeter joint. The pond had to be dewatered several times for repairs.
Some cracking occurred to the soil-cement lining after winter exposure. The cracks, which were up to 1 inch (2.5 cm) in width at the top, were probably caused by either frost action or chemical reaction between the brine and soil-cement lining. In May 1970 samples of the lining were obtained to further study the effect of brine on soil-cement.
Major cracks in the soil-cement were repaired before the start of the 1969 season. The seepage loss for the lining remained fairly constant at 6.6 f t /yr (6.6 x 10 - 6 cm/sec) as shown in Figure 3. Seepage probably occurred primarily through the fine cracks rather than through the soil-cement lining. Inspection of this lining in May 1970 showed that the condition was essentially the same as after repair before the test season in 1969. At that time about one-fourth inch (0 .6 cm) of fine soil had accumulated as sediment on the surface of the soil-cement. This had apparently blown in from surrounding cultivated land and this sediment may have slightly reduced seepage in this and in the other ponds. Field testing was discontinued on the soil cement in May 1970.
3. Compacted-earth l in ing.-After the saturation period for the 12-inch- (30.5~:m-) thick compacted
native soil, the seepage steadily decreased from 35 f t /yr (35 x 10 - 6 cm/sec) to 6 f t /yr (6 x 10 - 6 cm/sec) at the end of the test season.
The lining appeared to be in good condition after the 1968-69 win ter season. No apparent deterioration was noted. Several observation holes were dug around the tank to observe the effectiveness of the sand drainage pad. No free water was found, indicating satisfactory drainage. Density tests will be conducted on this lining after seepage measurements are concluded in 1970.
4. Chemical soil sealants.-The attapulgite clay formulation was not effective in reducing seepage through the Dalpra-type soil (silty sand). The seepage losses were very similar to the natural soil as shown in Figure 3. Field testing was discontinued on this lining at the end of 1969 season.
The carboxymethyl cellulose and alum mixture provided some seepage control in the silty sand. The seepage loss for the 6-inch- (15.2~:m-) thick lining decreased to 7.12 f t /yr (7.1 x 10 --6 cm/sec) at the approximate midpoint of its test season, Figure 3. However, at the end of the test season the seepage loss was 13.9 f t /yr (14 x 10 - 6 cm/sec) and was continuing to increase. Additional field testing will be conducted in 1970 to study this trend.
After surface drying, some shrinkage cracking and peeling were noted for both chemical soil sealant linings. However, upon rewetting, this condition generally disappeared.
The liquid asphalt B-5876, spray-applied over the natural soil, was most effective of the soil sealants in reducing seepage. The initial seepage loss was 15.9 f t /yr (16 x 10 - 6 cm/sec) and decreased to 6.14 f t /yr (6.1 x 10 - 6 cm/sec) at the end of the test season. Some evidence of saturation was noted at several areas around this pond. The penetration depth of the asphalt and condition o f lining due to brine exposure will be determined after seepage measurements are concluded in 1970.
5. Natural, untreated soi l .-The initial seepage loss of the natural soil at Dalpra Farm was about 164 f t /yr (164 x 10 - 6 cm/sec). At the end of the test season the seepage loss had decreased to 36 f t /yr (36 x 10 - 6 cm/sec). Some saturation was noted at several areas around the test tank. Also observed at several locations around the test pond were small boreholes about one-fourth inch (0.6 cm) in diameter. These holes were probably caused by water-seeking insects.
14

Upon surface drying, the natural soil had a greater tendency for shrinkage cracking than either the compacted-earth or the chemical soil sealant linings.
Evaluation of Seepage Measurements
Seepage determinations are only as accurate as the measurements required for water budget computations. That is as accurate as measurements of brine and precipitation inflow and evaporation outflow. For sufficient accuracy at least one watertight pond must be used to account for evaporation in the other test ponds. As previously mentioned, the PVC-lined pond was watertight and was selected for evaporation monitoring. Also to use the evaporation rate in the other test pond water budgets, the ponds should be ve r i f i ed as being thermally similar to the evaporation-monitoring pond. Assuming that all ponds are thermally similar, have the same wind exposure, and are evaporating at about the same rate, then the water temperature at similar points should be nearly equal.
To verify this assumption, the water surface temperature of the PVC pond, as measured by the top thermocouple, was compared to the water surface temperature for several other ponds. The comparison was based on temperature readings for two different days; August 3, one of the hottest days when the largest thermal difference would be expected, and September 18, an average seasonal day.
The comparison is summarized in Table 2. The mean difference from the PVC reading for August 3 was 0.3 ° F (02 ° C) and for September 18 -0.05 ° F (-0.03 ° C), with standard deviations of 0.9 ° F (0.5 ° C) and 0.3 ° F (0.2 ° C). The largest difference, 2.4 ° F (1.3 ° C), occurred on August 3 during the hottest part of the day. The results of the comparison ~dicate the ponds are thermally similar; and therefore, the evaporation rate determined from the PVC pond can be used for the othe r ponds.
A summary of weather and PVC pond measurements related to evaporation is listed in Table 3. The data in the table are averaged over the same time intervals used to determine average seepage loss rates for the different lin!ng materials. Also shown in the table is the increase in salinity for the PVC pond as measured by the TDS content. Although the effect of salinity on evaporation was not investigated in this study, other investigators have found that 20,000-ppm brine reduces evaporation by 3 percent. ~ Therefore, the salinity concentrations measured in this study, up to 6,000-ppm total
dissolved solids, would not produce, significant reductions in evaporation rates.
To assess the evaporation error caused by difference of temperatures between the evaporation monitoring pond and the other ponds, correlations of evaporation versus temperature data were made. The data and curves representing the least square f i t equations are shown in Figure 4. The index of determination for the air temperature curve is 0.906 with 1.0 indicating a perfect fit. The index for the water temperature curve is 0.873. Using the water temperature correlation, the change of evaporation rate was computed for 1 ° F (0.5 ° C) difference of water temperature. The results are listed in Table 4. The changes are also shown in Table 4 as a percentage of the annual tank evaporation.
The air temperature correlation also provided comparison with long-term meteorological data. Using average temperature data for the years 1931 to 1960 and the correlation curve, an average .annual evaporation rate of 38 in./yr (97 cm/yr) for the test site was computed. This value compares to 39 in./yr (99 cm/yr) and 55 in./yr (140 cm/yr), the area's average lake and Class A pan evaporation, respectively.
Water surface readings approaching an accuracy of plus or minus 0.002 f t (0.06 cm) are the best to be expected with the type of monitoring system used at Dalpra Farm. The effect of a plus or minus 0.002 f t (0.06 cm) error in water-level measurement is shown in Table 5 as percent of the tentative seepage limits.
It is recognized that in addition to measurement errors, the deviation of the data points from the curves shown in Figure 4 result from using two variable correlations that do not account for wind velocity and relative humidity (vapor pressure). The use of these variables in evaporat ion determinations is discussed under "Seepage Monitoring for Brine Disposal Ponds."
It was expected that a watertight pond would give more representative values of precipitation than a small bucket rain gage. To determine the rain from the water-level gage, the chart trends before and after a storm were extended toward the storm time, and the difference between the extended lines were measured at the middle of the storm.
The precipitation values from the rain gage and from the PVC pond water-level gage charts were compared for 16 storms. There was .no significant difference of rainfall determined by the two methods of measuring
Op. cil:. p. 1.
15

Table 2
COMPARISON OF TOP THERMOCOUPLE TEMPERATURE READINGS WITH PVC POND
Pond* lining
material
Average depth
feet meter
Temperatu re Tern peratu re difference difference at 6 a.m. at 10 a.m.
o F o C o F o C August 3, 1969
Temperature Temperature difference difference at 3 p.m. at 9 p.m.
o F o C o F o C
NBR 2.91 0.887 PE 2.78 0.847 LA 2.84 0.866 SC 2.85 0.869
-0.1 -0.05 -0.7 -0.4 -0.4 -0.2 0.2 0.1 -0.3 -0.15 -0.2 -0.1 • 0.7 -0.4 0.0 0.0
2.0 1.1 0.5 0.3 1.5 0.8 -0.1 -0.05 0.7 0.4 0.0 0.0 2.4 1.3 0.1 0.05
Average = -0.3 o F (0.15 °C)
Standard Deviation = 0.9 OF (0.5 °C)
September 18, 1969
NBR 2.99 0.911 0.1 0.05 0.1 0.05 PE 2.95 0.899 -0.1 -0.05 -0.1 -0.05 LA 2.94 0.896 0.2 0.1 0.5 0.3 AC 2.89 0.881 -0.1 °0.05 0.1 0.05 SC 2.91 0.887 -0.6 -0.3 0.0 0.0 CMC 2.87 0.875 -0.4 -0.2 0.0 0.0
0.3 0.15 0.1 0.05 -0.6 -0.3 -0.1 -0.05 -0.2 -0.1 -0.2 -0.1 • 0.4 -0.2 -0.3 -0.15 0.8 0.4 -0.1 -0.05
-0.2 -0.1 -0.2 -0.1
Average = -0.06 OF (0.03 °C)
Standard Deviation = 0.3 OF (0.15°C)
*Code in Table 1.
16

Date From
5-16-69 5-21-69 5-24-69 6-1-69 6-6-69 6-6-69 6-11-69 6-18-69 6-23-69 6-27-69 7-2-69 7-7-69 7-14-69 7-22-69 7-29-69 8 J, -69 8-11-69 8-18-69 8-25-69 9-2-69 9-9-69 9-15-69 9-22-69 9-29-69 10-7-69 10-20-69 10-27-69 11-3-69 11-10-69 11 - 17-69 11-24-69 12-1-69
Table 3
EVAPORATION DATA
Air Inside Evapo- temper- tank Water Relative
To ration ature bottom surface humidity feet/year o F o F o F percent
5-21-69 5.48 62.3 - - 57 5-24-69 2.43 49.3 - - 71 5-31-69 9.18 69.3 66.1 71.3 48 6-6-69 6.21 54.3 65.0 70.2 44 6-8-69 4.93 62.3 67.8 68.8 66 6-10-69 3.65 63.3 64.3 68.1 63 6-15-69 2.74 49.3 57.8 59.7 72 6-23-69 5.84 66.3 .64.4 70.3 53 6-27-69 8.22 61.4 65.7 67.4 46 7-2-69 7.81 69.7 68.2 73.1 46 7-7-69 6.57 67.1 70.0 74.0 58 7-14-69 8.35 74.7 73.7 77.6 45 7-21-69 7.09 72.5 74.4 77.5 54 7-29-69 7.67 73.8 75.7 80.2 48 8J,-69 5.96 73.6 77.2 79.4 53 8-11-69 8.14 73.9 76.0 78.9 48 8-18-69 6.78 70.4 74.5 75.2 51 8-25-69 5.27 70.1 73.5 74.9 56 9-2-69 5.20 69.3 - - 51 9-9-69 5.27 66.8 71.4 72.6 56 9-15-69 4.26 62.0 66.4 67.2 58 9-22-69 4.17 61.0 66.5 68.0 58 9-29-69 4.54 61.2 54.1 66.1 - 10-7-69 3.97 56.4 58.1 59.3 50 1 0-20-69 1.09 40.9 45.6 46.1 58 10-27-69 1.51 44.7 49.6 51.0 56 11-3-69 0.68 40.0 44.9 45.2 - 11-10-69 1.41 41.3 - - 58 11-17-69 1.30 40.3 - - 62 11-24-69 0.57 ~, 35.3 - - 62 12-1-69 0.57 32.3 - - 65 12-8-69 1.04 29.3 - - 63
Wind velocity
mph
4.70 4.71 4.76 3.90 3.65 3.54 3.44 3.71 5.65 4.74 3.49 3.27 3.25 1.98 2.31 2.34 2.43 1.88 1.80 2.36 2.15 2.00 2.52 4.46 3.90 2.66 4.01 2.03 2.97 3.34 0.80 2.61
Water depth
feet
2.98 2.94 2.85 2.72 2.66 3.00 3.03 3.02 2.97 2.86 2.98 2.89 2.88 2.90 2.79 2.66 2.97 2.88 2.78 2.68 2.98 2.97 2.92 3.03 3.14 3.19 3.21 3.23 3.20 3.20 3.19 3.17
TDS ppm
4,480
4,880
4,968
5,856
5,928
17

Date From
5-16.69 5-21-69 5-24-69 6-1.69 6-6-69 6-8-69 6-11-69 6-18-69 6-23-69 6-27-69 7-2-69 7-7-69 7-14-69 7-22-69 7-29.69 8.~,-69 8-11-69 8-18-69 8-25-69 9-2-69 9-9-69 9-15-69 9-22-69 9-29-69 10-7-69 10-20.69 10-27-69 11-3-69 11 - 10-69 11-17-69 11-24-69 12-1-69
To
5-19-69 5-24-69 5-31-69 6-6-69 6-8-69 6-10-69 6-15-69 6-23-69 6-27-69 7-2 -69 7-7-69 7-14-69 7-21-69 7 -29 -69 84-69 8-11-69 8-18-69 8-25-69 9-2-69 9-9-69 9-15-69 9-22-69 9-29-69 10-7-69 10-20-69 10-27-69 11-3-69 11-10-69 11-17-69 11-24.69 12-1-69 12-8-69
Evapo- ration
cm/year
Table 3A
EVAPORATION DATA (METRIC UNITS)
Air Inside temper- tank Water Relative
ature bottom su r face humidity o C o C o C percent
Wind velocity km/hr
Water depth meters
167.0 16.8 - - 57 7.56 0.908 74.1 9.6 - - 71 7.58 0.896
279.8 20.7 18.9 21.8 48 7.66 0.869 189.3 17.9 17.8 21.2 44 6.28 0.829 150.3 16.8 19.8 20.4 66 5.87 0.811 111.3 17.4 17.9 20.0 63 5.70 0.914 83.5 9.6 14.3 15.4 72 5.53 0.924
178.0 19.0 18.0 21.2 53 5.97 0.920 250.5 16.3 18.7 19.6 46 9.09 0.905 238.0 20.9 20.1 22.8 46 7.63 0.872 200.3 19.5 21.1 23.3 58 5.62 0.908 254.5 23.7 23.1 25.3 45 5.26 0.881 216.1 22.5 23.5 25.3 54 5.23 0.878 233.8 23.0 24.2 26.8 48 3.19 0.884 181.7 23.1 25.1 26.3 53 3.80 0.850 248.1 23.3 24.4 26.0 48 3.77 0.811 206.7 21.3 23.6 24.0 51 3.91 0.905 160.6 21.1 23.0 23.8 56 3.02 0.878 158.5 20.7 - - 51 2.90 0.847 160.6 19.3 21.9 22.5 56 3.80 0,817 129.8 16.6 19.1 19.5 58 2.46 0.908 127.1 16.1 19.1 20.0 58 3.22 0.905 141.4 16.2 17.9 18.9 - 4.05 0.890 121.0 13.5 14.5 15.2 50 7.18 0.924 33.2 4.9 7.5 7.8 58 6.28 0.957 46.0 7.0 9.8 10.5 56 4.28 0.972 20.7 4.4 7.2 7.3 - 6.45 0.978 43.0 5.2 - - 58 3.27 0.984 39.6 4.6 - - 62 4.78 0.975 17.4 1.8 - - 62 5.37 0.975 17.4 0 - - 65 1.29 0.972 31.7 -1.5 - - 63 4.20 0.966
TDS ppm
4,480
4,880
4,968
5,856
5,928
18

/0
8
Y
\ ~6 t
c~
K
~2
0
E)
0
E)
E)
E - / . 8 4 x I O ' S , , ; . - - _ _ _
0
I I I 30 40 50 60
TE'MPE~DA TLI~OE - o F"
E) A
Q A
Yk/:, z~
\__..._-- E= 334 . /0" ~ °'°° __. Wafer
70 80 90
Figure 4. Relationship of Evaporation rate s to temperature. Dalpra test site.
19

Table 4
THE EFFECTS OF TEMPERATURE ON" RATE OF EVAPORATION
Temperature of water o F o C
Rate of change of evaporation ft/week/° F cm/week/° C
Percent of annual tank evaporation
80 26.7 0.0082 0.451 13 70 21.1 0.0056 0.308 9 65* 18.3 0.0045 0.248 6 50 10.0 0.0021 0.138 3 30 -1.1 0.0005 0.028 1
*The average water temperature during the test season.
Table 5
ESTIMATED ERRORS IN WATER-LEVEL MEASUREMENTS
Tentative seepage limit ft/day cm/day
Percent error +0.002 ft (0.06 cm) is of per day limit
Tentative seepage limit ft/week cm/week
Percent error +0.002 ft (0.06 cm) is of per week limit
0.003 0.091 0.010 0.305 0.020 0.610 0.030 0.914
67.0 20.0 10.0 6.7
0.021 0.147 0.070 2.135 0.140 4.270 0.210 6.398
9.6 2.9 1.4 1.0
20

precipitation. The differences were within the plus or minus 0.002 foot (0.06 cm) reading from the water-level charts.
In summary, to use a water budget for monitoring a brine disposal pond, the instrumentation used at Dalpra Farm was adequate, but t h e following modifications would be advantageous:
1. Provide larger floats on the water-level recorders to increase recorder response.
2. Arrange enough water-level recorders, for example, three to four per large pond to account for t i l t of water surface caused by the prevailing winds.
3. Install permanent hook gage in each pond for referencing the water-level charts.
4. Use one floating thermocouple per pond and provide it with solar shielding. This should help attain more exact correlation of evaporation.
5. Provide two or three anemometers to verify that the wind velocity is being measured and that one or more of them do not need maintenance.
6. Use digital encoders and telemetering systems to reduce the drudgery of reading, collecting, storing and recovering data.
LABORATORY INVESTIGATION
Laboratory testing was conducted primarily to determine:
1. Soil properties data for field construction control and other laboratory tests.
2. Effectiveness of various chemical soil sealants for reducing seepage in Roswell and Dalpra soil.
3. Physical properties of the plastic linings, rubber lining, asphaltic concrete, soil-cement, and liquid asphalt installed at Dalpra Farm. Similar tests will be conducted when the linings are removed to determine any significant changes caused by the brine exposure.
The results of all laboratory tests are presented in tabular or graphical form in Appendix II. Laboratory test methods are described in Appendix IV. I=
*POunds per cubic foot.
LABORATORY TEST RESULTS
Soil Testing
1. Roswell ~ soil.-Standard tests run on samples from the Roswell Desalting Plant area show the soil to have the following properties:
a. Soil is a lean clay with about 91 percent of the particles finer than 0.074 mm and about 25 percent finer than 0.001 mm.
b. The maximum density is 108.8 pcf* (1.74 g/cc) at an optimum moisture content of 17 percent.
c. The liquid limit is 33 percent and the plasticity index is 17 percent.
Table 16 and Figure 6 of Appendix II summarize all the results of standard properties tests run on this soil.
2. Dalpra soil.-Standard tests run on composite samples from Dalpre Farm show the soil to have the following properties:
a. Soil is a silty sand with about 70 percent fine to medium sand and about 30 percent finer than 0.074 mm.
b. The maximum density is 119 pcf (1.91 g/cc) at an optimum moisture content of 12 percent.
c. The liquid limit is 20 percent and the plasticity index is 3 percent.
Table 17 and Figure 7 of Appendix II summarize all the results of standard properties tests run on Dalpra soil.
Soil Sealants
1. Roswell soil.-Permeability tests were run to determine the effectiveness of chemical soil sealants in reducing seepage through this soil. Forty-nine tests were run to include a variation in placement density, the type of mix and permeant water used, and the type of sealant applied. Test results are summarized in Table 20, Appendix II.
The soil was placed at one of four densities; 80, 85, 90, or 95 percent of maximum density. Denver
21

tapwater and a synthetic Roswell effluent were both used in wetting the soil for compaction and as the permeant fluid. The synthetic effluent was manufactured in the USBR chemical laboratory to simulate as closely as possible the chemical analysis of the actual effluent from the Roswell plant. The water analyses of the Roswell effluent is shown in Table 18, Appendix I1. Sealants used included 0.3 percent sodium silicate, 10 percent lignin, and 1 percent methyl cellulose.
No firm conclusion can be drawn from the results of these tests. The soil without sealant at densities above 80 percent maximum has a low permeability rate. At 80 percent maximum density there is sufficient flow to indicate the effect of the sealants. Within these data the methyl cellulose performed best as a sealant, reducing the permeability to zero. The other sealants performed well in some tests and poorly in others.
2. Dalpra soil.-Permeability tests were conducted on composite soil Sample No. 48D-X35 treated with the two chemical soil sealant mixtures recommended by Diamond Shamrock Company. Duplicate tests were run using each sealant and duplicate tests without sealant were run for comparison.
Test results are summarized in Table 21 in Appendix II. The results indicate an average reduction in permeability due to sealant application of about 50 percent for the 2 percent attapulgite clay formulation, and 75 percent for the combination of 0.25 percent carboxymethyl cellulose with 0.05 percent alum.
Flexible Membrane Linings
1. Plastic linings.-Physical properties test results for the PVC and polyethylene plastic linings are summarized in Tables 22 to 24 in Appendix I1. Tentative USBR specifications are also listed in the tables for comparison. Laboratory test results indicate the plastic films have satisfactory physical properties for use as evaporation pond liners. However, the 6-mil (0.15-mm) polyethylene had a low puncture resistance of 12.5 psi (0.9 kg/cm 2) tested over fine aggregate, as compared to 22.5 psi (1.6 kg/crns,2s,) for the 10-mil- (0.25-mm-) thick PVC tested over coarse aggregate.
2. N y l o n - r e i n f o r c e d b u t y l - r u b b e r lining.-Laboratory test results are summarized in Table 25 in Appendix I1. Results indicate the following conclusions:
a. The 45-mil (1.14-mm) nylon-reinforced butyl-rubber lining had satisfactory breaking and tear strength.
b. The Mullen test indicated the reinforced rubber had satisfactory hydrostatic resistance characteristics.
c. The reinforced rubber appeared to have excellent resistance to age deterioration as noted in the heat-aging tests.
d. Some ozone cracking was noted after 3 days of tests at 100 ° F (37.7 ° C) and 50 pphm (parts per hundred million.)
e. Peel strengths of the bonded seams were generally low. An average peel strength of 2.9 pounds per inch (0.52 kg/cm) was obtained in laboratory tests. A tentative minimum requirement would be near 3.5 pounds per inch (0.7 kg/cm).
Asphaltic Concrete
The laboratory test results are summarized in Tables 26 to 30 in Appendix I1. A sample of the in-place lining is shown in Photograph 2. The following conclusions are indicated from the laboratory tests:
1. An asphalt content of 7.06 percent (based on the dry weight of aggregate) was determined for the in-place sample (B-5686). An asphalt content of 7 to 8 percent was specified.
2. Physical properties tests conducted on the extracted asphalt indicated a 40-50 penetration grade asphalt conforming to Federal Specification SSA-706c.
3. Sieve analyses indicated the aggregate portion of the mix was within the specification limits. The specific gravity of the aggregate was determined to be 2.59.
4. The average density of the in-place lining sample was 143.36 pcf (2.296 g/cc). This value was 99.2 percent of laboratory stanclard density and shows that satisfactory compaction was used during the construction of the lining. Generally, specification requirements are a minimum of 98 percent of laboratory standard density.
5. The results of the immersion<:ompression tests on the remolded mixes (B-5576) indicated the sampled mix produced satisfactory density, water
22

absorption, volume swell, and compressive strength properties. Visual examination of the remolded specimens at the end of the water curing did not reveal any clay popouts or surface blistering which is indicative of good quality materials.
6. Sustained load tests conducted at 140 ° F (60 ° C) showed excellent mix stability.
7. Permeability tests conducted on two core specimens obtained from the in-place lining sample indicated the asphaltic concrete should provide a watertight lining.
Soil Cement
The laboratory test results are summarized in Table 31 and Figures 8 to 11 in Appendix I1. The following conclusions are indicated from the test results:
1. Of the three cement contents evaluated; 6, 8, and 10 percent, results show that the 8-percent cement content to be adequate for Dalpra soil.
2. At 8 percent cement content the weight loss after 12 test cycles was about 8.5 percent from the freeze-thaw test and about 5 percent from the wet-dry test.
3. Unconfined compression strength test results for specimens with 8 percent cement content were determined to be: 363 psi (_25.5 kg/cm 2) for 3-day curing; 475 psi (33.2 kg/cm 2) for 7-day curing; and 647 psi (45.3 kg/cm z) for 28-day curing.
4. Permeability test results show an average of about 2.0 f t /yr (2.0 x 10 - 6 cm/sec) for the soil cement with 8 percent cement content.
Spray-applied Liquid Asphalt
Laboratory test results are summarized in Tables 32 to 35 in Appendix I1. The following observations were noted during the laboratory evaluation:
1. At the total application treatment rate of 2 gsy (9.2 I/m 2) of the liquid asphalt, a penetration depth from 1 to 1.5 inches (2.54 to 3.81 cms) can be expected in Dalpra soil. Penetration characteristics are shown in Photograph 3.
2. Compressive strength test results indicate the liquid asphalt treated samples are slow curing, and generally had lower compressive strength values than the untreated samples. The slow curing may be
possible due to the absorption of a large portion of the liquid asphalt by the rather high fines content (30 percent) of the soil. Such a condition could reduce the rate of solvent evaporation.
3. Laboratory permeability tests were not reliable because of suspected piping. However, no deterioration was noted in the permeability sample
f r om exposure to the Dalpra brine effluent..
RECOMMENDATIONS
General
Each proposed brine disposal pond site must be given individual consideration relative to selection and usage of materials. Soil analyses including field and laboratory testing are necessary to provide data for design purposes, material selection, and construction control.
The primary requirement for lining brine disposal ponds will be determined by local regulations and/or the amount of seepage control necessary to prevent pollution of soil or ground water. Prior to the design and construction of any brine disposal pond, the state and the Federal Water Quality Administration should be contacted for their latest regulations on brine disposal ponds. Addresses for the state agencies are listed in Reference 1.
Pond operating conditions have to be considered in the selection of lining material. For example, desalting plant operations involving salt recovery may require the use of hard-surface linings. Also, brine disposal ponds could be designed for multipurpose use; i.e., recreational, game preservation; such uses may require a combination of lining materials.
Lining Materials
Physical properties requirements and construction guidelines for the flexible membranes, asphaltic concrete, soil cement, and compacted-earth linings are discussed in Reference 3.
F lex ib l e membrane linings.-These linings are recommended for use in areas where stringent seepage control is required. The most widely used materials include PVC plastic, polyethylene plastic formulated as a waterproof liner, and asphalt membrane linings. A 10-rail- (0.25-mm-) thick plastic lining is generally accepted as the best from a durability and economy standpoint. Also, for the plastic lining particular
23

|
Photograph 2. Cross-sectional view of asphaltic concrete lining installed at Dalpra Farm.
i2
• " i
;i . . . . ' . . . . . . s . J
~=5 I 2
! i "
Photograph 3. Penetration of liquid asphalt B-5876 into 2- by 2-inch (5.08- by 5.08-cm) compacted Dalpra soil at application rates of 0.5, 1.0, and 2.0 gsy (2.3, 4.6, and 9.2 I/m2). Maximum penetration was about 1.6 inches (4.06 cm).
24

attention should be given when making field seams to ensure they are watertight.
Hard-surface linings.-Asphaltic concrete could be designed for use in brine disposal ponds requiring a durable, hard-surface lining. Such a design would involve a hydraulic-type mix. Tile use of such a lining is primarily d~pendent upon source and type of locally available aggregate. Costs for this lining is generally higher than for either compacted earth or flexible membrane linings.
At this time we believe that the performance of soil cement, if used as a general type of lining in brine disposal ponds, would be quite variable. Much would depend upon the types and concentrations of salts in the brine as well as upon the soil properties and the quality of construction. For resistance to sulfate action, Type V cement would be required. Each particular installation proposed would require careful investigation to insure that there would not be adverse reactions between the brine and soil cement to cause deterioration.
Compacted-earth linings.-These linings consist of natural or processed soil placed and compacted to a specified thickness and density to achieve desired seepage control. Although originally determined for canal linings, the criteria set forth in Table 6 will assist in selecting soils for compacted-earth linings. Generally, compacted clayey gravels (GC), clayey sands (SC), and clays of low to high plasticity (CL, CH, and OH) would provide a sufficiently impervious layer for most situations. In less critical areas, compacted silty gravels (GM), silty sands (SM), silts (ML, OL, and MH) may be sufficiently impermeable. 6
Soil sealants.-Three recently developed materials are presently under evaluation for possible use in brine disposal ponds. The materials are:
1. A modified vinyl polymer (B-5800) supplied at 60 percent solids in water. The material is spray-applied to form a vinyl film. Material cost is about $0.50 per square yard.
2. A water-soluble polymer (B-5604) that penetrates into the soil and causes sealing by absorption onto clays.
3. A particular gel material (B-5605) which never does dissolve in water, but it swells up into a very soft pliable particle. It can penetrate and enter into
60p. cit. p. 1.
larger cracks or capillaries and become lodged and plug the flow channel by this mechanism.
The water-soluble polymer and gel material are used in combination and in equal amounts. Material costs are from $0.10 to $0.80 per square yard depending on quantities used. Preliminary laboratory permeability tests summarized in Table 21, Appendix II, indicate the three materials provided satisfactory seepage control in Dalpra soil. Field testing will be conducted at Dalpra Farm to further evaluate the sealant materials.
Seepage Monitoring for Brine Disposal Ponds
Accurate determinations of brine seepage losses may be required by statute or regulation. This requirement should be determined in advance of the preliminary design since the brine disposal ponds should be arranged, instrumented, and operated in such a manner to provide the required accuracy in the determination of seepage losses.
Ideally, an evaporation pond system should consist of similar ponds. One or more of the ponds should be watertight and would be used to monitor evaporation. All the pondsshould have the same structural configuration, should be oriented so that the long side of the individual ponds is in the direction of the prevailing wind and should be operated at equal brine depths. Similar wind and solar exposure will result in similar evaporation conditions for all ponds. However, it should be recognized that topographic conditions, availability of land, and other factors may combine to require irregular pond layouts.
The evaporation-monitoring pond should be made as watertight as possible, using impermeable lining materials. Field tests conducted at Dalpra Farm indicated that polyvinylChloride (PVC) plastic lining was the most efficient lining material. Even though local regulations might permit use of less impervious linings, the evaporation-monitoring ponds should still be impervious. For economy, smaller ponds or diked-off portions of the larger ponds could be made impervious and used to monitor evaporation. However, precautions are needed to assure that the smaller ponds represent evaporation in the larger ponds. I f one smaller pond is used, it should be centered in the system. Several smaller ponds could be distributed over the system for better averaging of relative humidity and wind exposure.
25

Tab le 6
• Important physical, properties o~ soils and their uses ~or canal linings ( Iden t i f i ca t ions based on Unif ied Soil Class i f ica t ion S y s t e m )
M A J O R D I V I S I O N S OF S O I L S .
T Y P I C A L N A M E S OF S O I L G R O U P S
Z . ; --
2
; =
Z g .-"
g_=
Z 4 -
4 -
~ ' ~ u > . -
!'ii ~ LI~I ~r'
L= U 0 . • ~J) ~ ~ . _ ~ e ~ o 1~ 7 ~ u c A =
U ' - - 4 - O • 0 4 - 4~ 41~
~2g~ ~ a = ~ N z . , . " ~_ -~.=_
= o = ~ m o_"-
>,
. j ~ o U E m
' - c= O o z . ~ < g = ~ ' - _ j U
m
(/) )-
o . .+-_ .~ (J E =
m .-~'~
H I G H L Y • . O R G A N I C • S O I L S
weli-groded grovels, grovel:sond mixtures, l i t t le or no fines
Poorly graded grovels,grovel-sond mixtures, l i t t l e or no fines
Si Ity grovels, poorly groded grovel-sond- si I t mixtures
SOIL SUITABILITY PROPERTIES FOR CANALS
(n o • ! =_o=
; o - - 4 - =~. o = = ~ o==3 = =
EI~ ( J I : (J utin a.
GW 14 16 i~ 2
GP 16 14 8 3
GM 12 I0 12 5 6
Clayey grovels, poorly graded grovel -sohd-c loy mixtures GC 6 B II 4 2
I Grovel with sand-clay binder GW-6C 8 13 16 I I
Well.graded sonds, grovel ly sands, l i t t l e or no fines SW 13 15 13 e - -
Poorly groded sands, grave l ly sands, l i t t l e or no fines
9 SP 15 II 7 co•rle
S i l t y sands, poorly graded sand- s i l t mixtures SM
Clayey sands, poor ly graded sand-c loy mix tures SC
[Sand wi th cloy binder SW-SC
7 I ! 9 I0 10 Erosion
coarse Critical
5 7 9 7 4
7 12 14 6 - 3
8 I0 5 5 D Erosion
Critical
3 6 6 I I 5
Inorgonic s i l t s and very f ine sonds, rock f lour, s i l t y or cloyey f ine ML sonds with s l igh t p l os t i c i t y
Inorganic cloys of low to medium p los t ic i f y , grovel ty cloys, sondy CL clays, s i l ty cloys, leon cloys
OL 4 2 3
MH 9 3 2
Organic s i l ts and organic s i l t - cloys of low p l o s t i c i t y
Inorganic si l t , micoceous or diatomaceous f ine sandy or s i l t y so i l s ,e las t i c s i l ts
Inorganic cloys of high plasticity, CH fa t cloys
I 4 4
Organic cloys of medium to high p las t i c i t y OH 2 I
9 - - Erosion
Critical
I0 • 12 Volume
Change Criticol
Peat and other highly organic soils Pt oX- -~(-~,~
,-'{." Numbers above indicate the order of increasing values for the physical p roper ty named -X--~ Numbers above indicate re lat ive su i t 0b i l i t y (I = best )
26

I f all the ponds are evaporating at the same rate in the same weather environment, the water surface temperatures would be the same. To verify that evaporation values obtained apply to all ponds, water surface temperature measurements are required. To monitor temperature, solar-shielded thermocouples should be placed in as nearly similar positions as possible near the water surface of all ponds. If the mean daily water surface temperature of any of the ponds deviates more than plus or minus 2 ° F (1 ° C) from the evaporation-monitoring ponds for two days or longer, then evaporation Values from the evaporation-monitoring ponds should be corrected before using them for computing seepage in another pond. Any variable that changes evaporation rate also changes water surface temperature. Therefore to correct evaporation rates, least square fits or correlation of the form presented in Figure 4, showing evaporation versus water surface temperature can be used. A plot, Figure 5, of the change of evaporation rate per degree of temperature change determined from the correlation is useful for making approximate corrections. The rate of change of evaporation rate is read from Figure 5 at the average of the evaporation-monitoring pond and the other pond temperature. This rate of change is multiplied by the quantity temperature in the evaporation-monitoring pond minus the temperature in the other pond. This product is subtracted form the evaporation rate for the evaporation-monitoring pond.
Another approach for making more exact corrections that ful ly accounts for wind velocity and relative humidity (vapor pressure) is the use of the evaporation relation expressed as:
E = Nu (Pw - Pa)
where E is the evaporation, N is the mass transfer coefficient, u is the wind velocity, and Pw and Pa are water vapor pressures of the water surface and air. For an operating pond,
E o = Nu ( P w - Pa)o
and for the evaporation-monitoring pond,
E m = Nu (Pw - Pa)m
hence
Eo = (Pw-" Pa)o Em I PW - Palm
14 Op. cit. p. 1.
This method of correction more closely represents the true physics of evaporation.
Both evaporation and seepage values are dependent upon goodwater-level measurements. C0unterweighted float-type water-level gages are convenient for measuring and recording weekly histories of water level in the ponds. To shield the float and counterweights from wind, stilling wells should be used. These wells should be made of brine-resistant material or coated to prevent corrosion. To dampen out water surface wave disturbances, the port area into the wells should be 1/1,000 of the well area. The wells are set within the ponds. Since the top of the wells act as support for the water-level gages, the wells must be anchored f i rmly to the pond bank so that gage reference will not change.
In ponds with sloping banks, platforms independent from the well support need to be constructed to provide access for reading and maintenance. These platforms should be wide, firm, and extend over the water sufficiently to make a satisfactory and safe work area. If the ponds are-large, three or four water-level gages might be required to account for t i l t of water surface due to prevailing winds. Hook gages with a stilling well should be provided in each pond for water-level gage referencing. The hook gage should be mounted on a separate support, should be readable from the platform and carefully ~ referenced to a permanent bench mark. Referencing of water-level gages to hook gages should be done on calm days to prevent lag due to fluctuating water level affecting the gage readings.
One or more standard weather rain gages should be used to measure rainfall. Experience at the test site indicated that watertight ponds can also be used to check rain gage measurements if distinction can be made between rain and brine inflow.
Water budgets will both detect and measure seepage from brine disposal ponds. There are other methods that only detect seepage. Some localities require chemical tests of soil and perimeter well water to determine contamination of soil and pollution of ground water. The perimeter wells also might detect changes of ground water level related to seepage. Chemical analyses do not alwa~/s indicate the source of pollution. Ponds could be tagged with fluorescent dyes or other tracers. 14 As a further precaution, each pond could be tagged with a different tracer which would help the operators determine which pond should be taken out of service, inspected and repaired.
27

I
: ~ . 0 0 8
.007
~.~6
~ .OO4
~ .00 3
.002
I ~ .001
I 30 ,;0 50 60 70 80
WATER SURFACE TEMPE~A TU, q £ - o F
Figure 5. Computed Corrections for evaporation rate at different temperatures. Dalpra test site.'\
28
Documentation should be kept of weather data, pond water surface temperature, plant brine movements, brine concentrations of the ponds, plant inflow and perimeter well water and the water loss from the evaporation-monitoring ponds. These records will prove that local minimum seepage requirements are being met, will provide protection from pollution complaints and will help to attain more efficient operation of the pond disposal system.
FUTURE FIELD TESTS
Field tests will be conducted at Dalpra Farm (OSW Agreement No. 14-30-2532, Work Order No. 4) to evaluate three newly developed soil sealants for low-cost seepage control in brine disposal ponds.
The water-soluble polymer, B-5604, and the gel material, B-5605, will be applied by two methods: (1) mixed into the natural soil and compacted to achieve seepage reduction, and (2) ponded. Application rate
for both methods will be 500 Ib/acre (0.057 kg/m 2) of each material. The vinyl polymer formulation, B°5800, will be spray applied in a concentrated mixture (three parts B-5800 to one part water) to form a continuous film. An application rate of 0.5 gpsy (2.3 I/m 2) will be used to attain a film thickness of about 30 mils (0.76 mm). Before the concentrated mixture is applied, a dilute mixture (1 part B-5800 to 19 parts water) will be used to stabilize the natural soil.
Besides evaluating the new soil sealants, the 6-mil (0.15-mm) polyethylene lining will be replaced with a 10-mil (0.25-mm) polyethylene lining. The thicker material will be formulated and manufactured for use in waterproofing applications. It is anticipated that the 10-mil (0.25-mm) polyethylene lining will provide seepage control similar to the PVC lining. In addition, field tests will continue on the original linings as required.
The contract work is scheduled to be completed and reported on or before March 1, 1971.
29

REFERENCES
~Depuy, G. W., "Disposal of Brine Effluents from Inland Desalting Plants: Review and Bibliography." Office of Saline Water Research and Development Progress Report No. 454, 1969
2Smoak, W~ G., "Spray Systems-A Method of Increasing Water Evaporation Rates to Facilitate Brine Disposal from Desalting Plants." Office of Saline Water Research and Development Progress Report No. 480, 1969
3 Day, M. E., "Brine Disposal Pond Manual," Bureau of Reclamation, 1970. Manual prepared for the Office of Saline Water
4"Feasibility Study of Chemical Sealing of Soils," Office of Saline Water Research and Development Progress Report No. 266, 1967
5,,Soil Sealing Chemicals and Techniques," Office of Saline Water Research and Development Progress, Report No. 381, 1968
6Earth Manual, Bureau of Reclamation, Denver, Colorado, 1st Edition, Revised, 1963
7Hickey, M. E., "Investigations of Plastic Films for Canal Linings," Bureau of Reclamation Water Resources Technical Publication, Research Report No. 19, 1969
s EIIsperman, L. M. "Laboratory Testing and Construction of Asphaltic Concrete Dam Facings,"
paper presented at the Conference on the Use of Asphalt in Hydraulic Construction, Pacific Coast Division, The Asphalt Institute, Bakersfield, California, May 24, 1961
9 Hickey, M. E., "Mix Design Investigation of Asphaltic Concrete for Facing Downs Protective Dike, Glen Elder Unit, Missouri River Basin Project, Kansas," Bureau of Reclamation Laboratory Report No. ChE-66, Denver, Colorado, December 29, 1966
1 0,,Linings for Irrigation Canals," Bureau of Reclamation, Department of the Interior, Washington, D.C., 1st Edition 1963
11 Holtz, W. G., and Walker, F. C., "Soil-Cement as Slope Protection for Earth Dams," Journal of the American Society of Civil Engineers, Soil Mechanics and Foundations Division, Vol. 88, No. SM6, December 1962, pp 107-134
12Willson, R. J. "Controlling Canal Seepage with Soil Sealants." Paper for Water Resources Engineering Conference of ASCE, Denver, Colorado, May 16-20, 1966. ASCE Preprint 335
13Hickey, M. E., "Evaluation of Special Liquid Asphalts for Stabilization of Sandy Soil," Bureau of Reclamation Laboratory Report No. ChE-22, Denver, Colorado, June 19, 1964
14Feuerstein, D. L., and Selleck, R. E., 'Tracers for Dispersion Measurements in Surface Waters," SERL Report No. 63-1, Sanit Engr Res Lab., University of California, Berkeley, Feb. 1963
30

Laboratory Sample No.
48D-36
48D-37
B-5876
MATERIALS LISTING
Material
Attapulgite clay formulation. Chemi- cal sealant recommended by Diamond Shamrock Company.
Carboxymethyl cellulose plus Alum mix- ture. Chemical sealant recommended by Diamond Shamrock Company.
Liquid cutback asphalt. Proprietary product formulated for deep penetra- tion.
Laboratory sample
No.
B-5576
B-5685
B-5800
B -5604
B-5605
Material
Asphaltic concrete hot-mix sample.
Sample of in-place asphaltic-concrete lining.
Chemical sealant. A modified vinyl polymer supplied at 60-percent solids in water.
Chemical sealant. A water-soluble polymer.
Chemical sealant. A particulate gel material.
31

APPENDIX I
SUMMARY OF
FIELD SEEPAGE MEASUREMENTS
TABLES 7 -15
33

From
Table 7
SEEPAGE LOSSES FOR NYLON-REINFORCED
Date To
Seepage loss, f t /yr (cm/sec x 10 -6)
BUTYL RUBBER
Average head, feet meters
6-20 6-23 35.5 2.82 0.860 6-23 6-27 4.09 2.64 0.805 6-27 7-2 1.64 2.51 0.765 7-2 7-7 3.44 2.49 0.759 7-7 7-14 0.64 2.28 0.695 7-14 7-21 0 2.13 0.649 7-29 8-4 3.96 2.91 0.887 84 8-9 4.91 2.75 0.838 8-9 8-11 28.9 2.57 0.783 8-11 8-18 53.4 2.50 0.762 8-28 9-2 0.573 2.98 0.908 9-2 9-9 0.701 2.88 0.878 9-9 9-15 0.478 2.98 0.908 9-15 9-22 0.114 2.99 0.911 9-22 9-29 0.114 2.93 0.893 9-29 10-7 0.253 3.03 0.924 10-7 10-20 0.188 3.14 0.957 10-20 10-27 0 3.19 0.972 10-27 11-3 0.057 3.21 0.978 11-3 11-10 0.172 3.22 0.981 11-10 11-17 0.409 3;19 0.972 11-17 11-24 0.348 3.19 0.972 11-24 12-1 0.057 3.18 0.969 12-1 12-8 0 3.16 0.963
35

From Date
Table 8
SEEPAGE LOSSES FOR POLYETHYLENE PLASTIC LINING
Seepage loss, Average head, To ft/yr (cm/sec x 10 -6) feet meters
5-16 5-21 2.87 2.95 0.899 5-21 5-24 1.64 2.88 0.878 5-24 5-31 1.64 2.76 0.841 6-1 6-6 6.22 2.88 0.878 6-6 6-8 5.11 2.85 0.867 6-8 6-10 3.07 2.83 0.863 6-11 6-15 2.66 2.83 0.863 6-18 6-23 3.44 2.67 0,814 6-23 6-27 0.82 2.58 0.786 6-27 7-2 0.90 2.48 0.755 7-2 7-7 5.57 2.92 0.890 7-7 7-14 3.16 2.79 0.850 7-14 7-21 5.26 2.76 0.841 7-22 7-29 4.44 2.76 0.841 7-29 84 2.72 2.79 0.850 8-4 8-11 4.04 2.80 0.853 8-11 8-18 3.16 2.94 0.896 8-18 8-25 1.93 2.80 0.853 8-25 9-2 2.35 2.88 0.878 9-2 9-9 2.40 2.86 0.871 9-9 9-15 2.94 2.95 0.899 9-15 9-22 2.80 2.95 0.899 9-22 9-29 2.51 2.84 0.866 9-29 10-7 5.17 2.99 0.911 10-7 10-20 5.89 2.99 0.911 10-20 10-27 2.69 2.91 0.887 10-27 11-3 6.73 2.98 0.908 11-3 11-10 4.15 2.89 0.881 11-10 11-17 4.44 2.80 0.853 11-17 11-24 3.62 2.72 0.829 11-24 12-1 7.42 2.95 0.899 12-1 12-7 6.34 2.83 0.863
36

From Date
SEEPAGE
To
Table 9
LOSSES FOR ASPHALTIC-CONCRETE
Seepage loss, ft/yr (cm/sec x 10 -6) feet
LINING
Average head, meters
7-7 7-14 9.58 2.84 0,866 7-14 7-21 22.8 2.87 0.875 7-22 7-29 14.5 2.80 0.852 8-18 8-25 10.9 2.90 0.884 8-25 9-2 6.45 2.89 0.881 9-2 9-9 5.1.5 2.90 0.884 9-9 9-15 2.80 2.95 0.899 9-15 9-22 3.04 2.94 0,896 9-22 9-29 3.44 2.94 0.896 9-29 10-7 3.12 2.99 0.911 10-7 10-20 2.05 3.06 0.933 10-20 10-27 2.80 3.05 0.930 10-27 11-3 2.05 3.02 0.920 11-3 11-10 2.34 3.00 0.914 11-10 11-17 2.22 2.93 0.893 11-17 11-24 1.87 2.90 0.884 11-24 12-1 1.23 2.98 0.908 12-1 12-7 0.82 2.95 0.899
37

From Date
To
Table 10
SEEPAGE LOSSES FOR SOIL-CEMENT LINING
Seepage loss, Average head, ft/yr (cm/sec x 10 -6) feet meters
6-11 6-15 14.9 2.88 0.878 6-18 6-23 9.74 2.68 0.817 6-25 6-30 11.2 2.88 0.878 6-30 7-7 7.60 2.54 0.774 7-7 7-14 8.13 2.72 0.829 7-14 7-21 8.95 2.67 0.814 7-22 7-29 5.62 2.45 0.747 7-29 8-4 7.98 2.91 0.887 8-4 8-11 6.78 2.68 0.817 8-11 8-18 6.84 2.91 0.887 8-18 8-25 6.31 2.70 0.823 8-25 9-2 6.66 2.91 0.887 9-2 9-9 7.00 2.89 0.881 9-9 9-15 6.21 2.92 0.890 9-15 9-22 9.18 2.89 0.881 9-22 9-29 7.07 2.90 0.884 9-29 10-7 7.16 2.95 0.899 10-7 10-20 6.67 2.93 0.893 10-20 10-27 5.62 2.94 0.896 10-27 11-3 5.78 2.99 0.911 11-3 11-10 5.73 2.91 0.887 11-10 11-17 5.96 2.94 0.896 11-17 11-24 5.84 2.85 0.869 11-24 12-1 6.20 2.95 0.899 12-1 12-8 5.73 2.95 0.899
38

From
6-11 6-18 6-25 7-2 7-7 7-14 7-22 7-29 8-4 8-11 8-18 8-25 9-2 9-9 9-15 9-22 9-29 10-7 10-20 10-27 11-3 11-10 11-17 11-24 12-1
Date
SEEPAGE
To
6-15 6-23 6-30 7-7 7-14 7-21 7-29 8-4 8-11 8-18 8-25 9-2 9-9 9-15 9-22 9-29 10-7 10-20 10-27 11-3 11-10 11-17 11-24 12-1 12-8
Table 11 tk
LOSSES FOR COMPACTED-EARTH LINING
Seepage loss, Average head, ft/yr (cm/sec x 10 -6) feet meters
28.9 2.94 0.896 25.0 2.81 0.856 23.8 2.79 0.850 27.2 2.80 0.853 37.4 2.80 0.853 51.7 2.78 0.847 37.6 2.82 0.860 34.8 2.85 0.869 30.8 2.66 0.811 28.8 2.82 0.860 23.5 2.76 0.841 23.2 2.87 0.875 21.2 2.76 0.841 18.8 2.81 0.856 17.4 2.82 0.860 14.8 2.83 0.863 13.7 2.87 0.875 10.6 2.90 0.884 9.42 2.91 0.887 8.02 2.98 0.908 7.42 2.93 0.893 7.13 2.93 0.893 7.02 2.80 0.853 7.07 2.94 0.896 6.02 2.94 0.896
39

Date From
8-19 8-25 9~2 9-9 9-15 9-22 9-29 10-7 10-20 10-27 11-3 11-10 11-17 11-24 12-1
To
8-25 9-2 9-9 9-15 9-22 9-29 10-7 10-20 10-27 11-3 11-10 11-17 11-24 12-1 12-7
Table 12
SEEPAGE LOSSES FOR SOIL SEALANT LINING (Carboxymethyl cellulose Plus Alum)
Seepage loss, ft/yr (cm/sec x 10 -6)
Average head, feet meters
15.9 12.4 13.8 10.1 10.0 8.60 7.58 7.12 8.36 9.01
11.10 12.2 12.3 13.3 13.9
2.85 0.869 2.83 0.863 2.83 0.863 2.90 0.884 2.91 0.887 2.88 0.878 2.95 0.899 2.91 0,887 2.92 0,890 2.96 0,902 2.90 0.884 2.88 0.878 2.68 0.817 2.88 0.878 2.89 0.881
40

Date From To
Table 13
SEEPAGE LOSSES FOR SOIL SEALANT LINING (Attapulgite Clay Formulation)
Seepage loss, Average head, ft/yr (cm/sec x 10 -6) feet meters
5-16 5-21 58 2.70 0.823 5-21 5-24 57 2.60 0.792 5-24 5-31 80 2.56 0.780 6-1 6-6 58 2.54 0.774 6-6 6-8 41 2.24 0.683 6-8 6-10 46 2.50 0.762 6-11 6-15 37 2.58 0.786 6-18 6-23 81 2.73 0.832 6-23 6-27 105 2.76 0.841 6-27 7-2 109 2.33 0.710 7-2 7-7 139 1.88 0.573 7-7 7-10 202 2.22 0.677 7-22 7-29 146 2.36 0.719 8-19 8-25 124 2.05 0.625 9-2 9-9 93 2.16 0.658 9-9 9-15 121 2.03 0.619 9-15 9-22 111 2.03 0.619 9-22 9-29 102 2.08 0.634 9-29 10-7 83 1.82 0.555 10-7 10-20 66 1.49 0.454 10-20 10-27 73 2.36 0.719 10-27 11-3 65 2.47 0.753 11-3 11-10 56 2.49 0.759 11-10 11-17 50 2.60 0.792 11-17 11-24 33 1.84 0.561 11-24 12-1 39 2.66 0.811 12-1 12-7 36 2.73 0.832
41

From
SEEPAGE
Date To
Table 14
LOSSES FOR SPRAY-APPLIED LIQUID ASPHALT B-5876
Seepage loss, Average head, ft/yr (cm/sec x 10 -6) feet meters
5-21 5-24 24.6 2.81 0.856 5-24 5-31 20.5 2.82 0.860 6-1 6-6 19.2 2.85 0.869 6-6 6-8 17.4 2.70 0.823 6-8 6-10 16.4 2.82 0.860 6-11 6-15 19.2 2.83 0.863 7-2 7-7 17.2 2.67 0.814 7-7 7-14 16.9 2.89 0.881 7" 14 7-21 14.9 2.78 0.847 7~22 7-29 16.4 2.79 0.850 7-29 8-4 15.9 2.84 0.866 84 8-11 16.9 2.78 0.847 8-11 8-18 16.5 2.85 0.869 8-18 8-25 16.1 2.83 0.863 8-25 9-2 15.1 2.84 0.866 9-2 9-9 14.5 2.83 0.863 9-9 9-15 13.4 2.87 0.875 9-15 9-22 11.8 2.87 0.875 9-22 9-29 10.9 2.87 0.875 9-29 10-7 9.16 2.93 0.893 10-7 10-20 7.18 2.89 0.881 10-20 10-27 6.78 2.93 0.893 10-27 11-3 6.49 2.98 0.908 11-3 11-10 6.02 2.89 0.881 11-10 11-17 6.55 2.93 0.893 11-17 11-24 6.55 2.82 0.860 11-24 12-1 6.49 2.84 0.866 12-1 12-7 6.14 2.95 0.899
42

From
6-18 6-23 6-27 7-22 7-29 8-19 8-25 9-2 9-9 9-15 9-22 9-29 10-7 10-20 10-27 11-3 11-10 11-17 11-24 12-1
Date To
6-23 6-27 7-2 7-29 8-4 8-25 9-2 9-9 9-15 9-22 9-29 10-7 10-20 10-27 11-3 11-10 11-17 11-24 12-1 12-7
Table 15
SEEPAGE LOSSES FOR NATURAL SOIL (Untreated)
Seepage loss, f t /yr (cm/sec x 10 -6)
Average head, feet meters
257 202 146 192 145 164 146 113 112 99 82 64 46 46 53 48 46 3O 39 36
2.34 0.713 2.48 0.756 1.83 0.558 2.17 0.661 2.44 0.744 1.77 0.539 2.20 0.670 1.98 0.604 2.15 0.655 2.13 0.649 2.11 0.643 2.26 0.689 2.16 0.658 2.60 0.792 2.48 0.756 2.59 0.789 2.64 0.805 2.00 0.610 2.64 0.805 2.68 0.817
43

APPENDIX H
LABORATORY TEST RESULTS
45

Summary of Standard Soil Tests
for Roswell and Dalpra Farm Soils
Tables 16 and 17
Figures 6 and 7
Chemical Analyses of Soil and Water
from OSW Desalination Plant
Roswell, New Mexico
Table 18
Chemical Analyses of Water from
Dalpra Farm Test Site
Table 19
47

4a ¢O
¢+
O
Identification
o~ o
~8D-
R O S W E L L , N E W M E X I C O SOIL TEST DATA
SU~BC~RY ~gANDARD PROPERTIES, PROCTOR COMPACTION AND PERMEABILITY TESTS
2 Roswel l
3 Roswell
Oq-~
C~
Table 16
Sheet 1 of 1
Grain-size Fractions Consistency Compaction Permeability In Percent Limits ~ * Test. Test
0
~ 8 ~ , o ~ ® ' ~
~ . ~ o o" ~ ~ ~ e ~o ~ o~ U3 0 0 l~
41 5 0 9 - - - - - 33 17 -- CL 7.72 108,8 17
1 , 7 . qm/cm" -3
41 4 0 19 - - - 34 16 - C L 2 , 7 7 - -
*Indicate Visual Classification by an asterisk. GPO 834301

25 MHIRI~ 7HR. 45 ;s MI~.
9 0 -
HYDROMETER ANALYSI,S SIEVE ANALYSIS' TIME READINGS U.S. STANDARD SERIES~IO . 41 60MIf~ 19MIN. 4MIN. IMIN. I~ 0 ~'100 °50 °40#30 ~16 J ~ p
i I : ! , , ~ - - ' - - "~ " - - ~ I I' i'
_z 6C
= J IlC , -
~ J
' I / " d s"J I
,f
CLEAR SOUARE OPENINO:S ~=* ~',~" ,V=" 3" " S '6"
I r If
. . . . . . . . . . . . . . . . . . . i r l i ,, i JJ )l .002 .005, ' .0()¢3 .019 .037 '.074 .149 .297 =SS(~ I.,9 38 4.76 9.52 I D I A M E T E R OF IN' RS
CLAY (PLASTLG) TO SILT (NON-PLASTIC) I SAND I ! FINE I' MEDIUM [ COARSE J 'FINE
20
GRADATION ANALYSIS
SO
LLI 40 _z
)- uJ
50 ¢= k- Z
60 3
w 7G a .
80
9O
. . . . . . . . . J' ,do 19.1 38.1 76.2 ' 121 200
152 I
GRAVEL [COBBLES I COARSE
MOISTURE-PEROENT OF DRY tVELGHT
6 Io 15 20 25
MOISTURE-DRY DENSITY 'CURVES
I l O
105
t O0
/ /
/ \
u
~P
Ln
0
0
H COMPACTION TEST GURVES
Figure 6. Standard soil properties-Roswell site.
5 0

Identification
D A L P R A F A R M
SOIL TEST DATA +
SD3@M~RY STANDARD PROPERTIES, PROCTOR COMPACTION AND PERMEABILITY TESTS
Graln-size Fractions
0 "-- 4~ -,4 ~40
%
m
In Percent ~ O .H
I • ~ .4 ~ El O 0 3 ~
03 O m
=O ~- = O " "~ = -,~ m "---" O = O U% O -~ ~- 90 ~ ~ ~ ~ ~ 03
Table 17
Sheet 1 of 1
Consistency Compactiop Permeability Limits Test Test
o • cv3 ~ 03 48D - 03 O O o
11 ! Sack sample f rom area of 17 25 58 - - - 24 7 A . H. No.
181 Sack sample f romarea of 13 16 71 - A . H. No.
27 = Sample f ron stock pile 16 23 61 . . . . .
28 Sample f ron stock pile 14 18 68 . . . . .
X 3 5 Comoosite c If 48D-27 and 14 17 69 - - - 20 3 4 8 D - 2 8 (t~ Is sample was selected as 'epresenting
~-- . 4 4-) Q)
~ - ILl
~ m
O
the soil at ~ me field test area)
SM - 119.0 12.6 - 1 91 gm/cin - ~
SM - 120.5 11.4 - 1 93 gm/ci n - 3
SM ' .2.67. 119.0 11.7 1 91 9m/cl --3
tn =z @ @ ¢+
O
*Indicate Visual Classification by an asterisk.

H Y D R O M E T E R A N A L Y S I S TIME READINGS 60MIN IgMIN. 4MiN. IMIN. ~2(0 '~" #10D
25HR 7HR, 45 MI~ IS MI~.
i I
9 0 - I , ,D ] 7O
z_ eD
5O
z
~ 30
/ /
/ 2 /,,-
U. S. STANDARD SERIEBejo #50 'W4D~=SO el6 1~8
' ~
/ / 2 ' ///"
t 48D-X35
,c ~ ~ ~ . . . . . 8 D - i 8
I(: ' ,"= " " "
.002 .005 .009 .019 X)57 .074' ' .t49 .297 590 1.19 I D I A M E T E R OF IN ,
SAND CLAY (PLASTIC) TO s ILT (NDN-PLASTIG} FINE r MEDIUM
S I E V E A N A L Y S I S 1 CLEAR SQUARE OPENINGS
~o" ~4" iv=" 3" 5"t" , ! [ r 2D
3O
uJ 4D z_
5o~ Z
7D a . t
60
. . . . . 90
' ' ' , . ; ~ , . . . . . . . . . " . . . . . . . ~o 38 . 9.52 t9.1 38.1 76.2 127 ETERb 452 I
~R~VEL J GOBBLES I CDARSE I FINE I COARSE
GRADATION ANALYSIS
MOiSTURE-PERCENT OF DRY WEIGHT
6 ID i5 . 2D.
t25= I MOISTURE-DRY DENSITY CURVES I
- - ~ D . ~ I ~ 0
/ / /
Z / f l / o Z = / w
M I I 0
z ~ _L_~____~48D.X35 w
tO5 o
J
25 J ~
I
I
u %.
I-
Q
I GOMPACTION TEST CURVES
Figure 7. Standard soil properties-Dalpra site.
52

Table 18
CHEMICAL ANALYSIS OF SOIL AND WATER FROM OSW DESALINATION Roswell, New Mexico
SOl L
ION or compound USB R test results
(calculated as oxides)
Si O2, percent 42.73 AI 2 03, percent 8.31 Fe 2 03, percent 2.04 Ca O, percent 20.17 Mg O, percent 3.03 Na 2 O, percent 1.02 K 2 O, percent 1.60 SO3, percent 0.88 LOI including CO2, percent 20.00
WATER
ION or compound USBR test results*
Ec x 106 at 21 ° C 24,133. Specific gravity 1.0125 TDS at 180 ° C 15,685. Calcium, ppm 555. Magnesium, ppm 160. Sodium, ppm 4,816. Potassium, ppm 39. Carbonate, ppm 0.0 Bicarbonate, I~pm 182. Sulfate, ppm 1,488. Chloride, ppm 7,924. Nitrate, ppm 0.0 Iron, ppm Silica, ppm pH
*Analysis of well water.
PLANT
53

Sample No.
B -5860 B-5862 B-5863 B-5864 B -5880 B -6884
B-5859 B-5861 B-5879 B-5883
*Chemical
Table 19
CHEMICAL ANALYSES OF DALPRA BRINE EFFLUENT
Conductivity Source Date K x 106 at 25 b C pH
PVC pond 11-25-68 4,783 8.3 PVC pond "5-19-69 5,520 8.2 PVC pond 6-10-69 5,930 8.2 PVC pond 7-18-69 6,033 8.0 PVC pond 8-18-69 6,965 8.5 PVC pond 9-29-69 7,059 8.0
Waste pond 11-25-68 4,783 8.3 Waste pond "5-19-69 4,653 8.0 Waste pond 8-18-69 2,862 8.3 Waste pond 9-29-69 2,402 8.1
components in brine sampled May 19, 1969.
ION or compound PVC pond (ppm) Waste pond (ppm)
Calcium 103 95 Magnesium 53 50 Sodium 1,178 938 Potassium 15 16 Carbonate 0 0 Bicarbonate 146 161 Sulfate 2,707 2,227 Chloride 128 114 Nitrate 0 0
TDS (ppm)
3,876 4,480 4,880 4,968 5,856 5,928
3,816 3,704 2,080 1,712
54

Laboratory Permeability Test Results
for Roswell and Dalpra Soils Treated
with Various Soil Sealants
Tables 20 and 21
55

O1
Table 20
SUMMARY OF PERMEABILITY TEST RESULTS
Placement density Soil Type sealant Permeant Diameter Percent
Sample Soil source used Mix water water sample PCF laboratory No. 48D- (inches) maximum
2 Roswell None Tap Tap 1 2 Roswell None Tap Tap 1 2 Roswell None Tap Tap 1 2 Roswell None Tap Tap 1 2 Roswell None Roswell synthe- Roswell synthe- 1
tic effluent tic effluent 2 Roswell None Roswell synthe- Roswell synthe- 1
tic effluent tic effluent 2 Roswell None Roswell well Roswell well 1
water water 2 Roswell None Roswell well Roswell well 1
water water 2 Roswell None Tap Tap 8 2 Roswell None Tap Tap 8 3 Diamond None Tap Tap 1
Alkali (Roswell)
3 Diamond None Tap Tap 1 Alkali (Roswell)
3 Diamond None Tap Tap 1 Alkali (Roswell)
3 Diamond None Tap Tap 1 Alkali (Roswell)
3 Diamond None Roswell synthe- Roswell synthe- 1 Alkali tic effluent tic effluent (Roswell)
3 Diamond None Roswell synthe- Roswell synthe- 1 Alkali tic effluent tic effluent (Roswell)
87.0 80 92.5 85 97.9 90
103.4 95 92.5 85
103.4 95
92.5 85
103.4 95
92.5 85 97.9 90 87.0 80
92.5
97.9
103.4
92.5
103.4
85
90
95
85
95
*Average " K " obtained after the permeabilities became nearly constant.
Permeability " K " ft/yr Initial Final Average*
39.9 5.3 20.1 Trace Trace Trace
0 0 0 0 0 0 0 0 0
0 0 0
Trace Trace Trace
0 0 0
65.1 29.3 40.6 5.5 4.0 4.2
13.2 3.2 4.7
Trace Trace Trace
Trace Trace Trace
0 0 0
4.4 0.5 1.8
Trace Trace Trace

Table 20-Continued
SUMMARY OF PERMEABILITY TEST RESULTS
Placement density Soil Type sealant Permeant Diameter Percent
Sample Soil source used Mix water water sample PCF laboratory No. 48D- (inches) maximum
3 Diamond Alkali (Roswell)
3 Diamond Alkali (Roswell)
* *2 Roswell
* *2 Roswell
* *2 Roswell
* *2 Roswell
None Roswell well water
None Roswell well water
0.3 )ercent sodium silicate
0.3 )ercent sodium silicate
0.3 )ercent sodium silicate
0.3 ~ercent sodium silicate
Roswell well 1 water
Roswell well water
Roswell well 1 water
Roswell well water
Roswell well water
Roswell well water
* *2 Roswell 0.3 percent Roswell well sodium water silicate
* *2 Roswell 0.3 ~ercent sodium silicate
* *2 Roswell 0.3 ~ercent sodium silicate
**2 Roswell 0.3 percent Roswell well sodiu m water silicate
2 Roswell None Roswell well water
Roswell well water
Roswell wd l wa~r
92.5 85
103.4 95
Tap 1 87.0 80
Initial Permeability " K " f t /yr
Final Average*
Roswell synthe- 1 tic effluent
Roswell synthe- 1 tic effluent
Roswell synthe- 1 tic effluent
Roswell synthe- 1 tic effluent
*Average " K " obtained after the permeabilities became nearly constant. **Test results unreliable because sealant gelled before application to soil.
Roswell synthe- 1 tic effluent
Roswell synthe- 1 tic effluent
87.0 80
87.0 80
97.9 90
97.9 90
103.4 95
103.4 95
87.0 80
Roswell synthe- 1 tic effluent
Tap 1 87.0 80 206 486 312
Trace Trace Trace
129 356 245
81 433 202
64 341 176
36 280 116
13 35 27
16 139 54
7 31 20
308 48 65
Trace Trace Trace

O1 (D
Soil Sample No. 48D-
Soil source Type sealant
used
2 Roswell None
2 Roswell None
2 Roswell None
2 Roswell None
2 Roswell 10 percent lignin
2 Roswell 10 percent lignin
2 Roswell 10 percent lignin
2 Roswell 1 percent methyl cellulose
2 Roswell 1 percent methyl cellulose
2 Roswell 1 percent methyl cellulose
2 Roswell 1 percent methyl cellulose
2 Roswell 0.3 percent sodium silicate
2 Roswell 0.3 percent sodium silicate
Table 20-Continued
SUMMARY OF PERMEABILITY TEST RESULTS
Mix water
Placement density Permeant Diameter Percent
water sample PCF laboratory (inches) maximum
Roswell water
Roswell water
Roswell water
Roswell water
Roswell water
Roswell water
Roswell water
Roswell water
well
well
well
well
well
well
well
well
Roswell synthe- 1 87.0 80 tic effluent
Roswell synthe- 1 97.9 90 tic effluent
Roswel I synthe- 1 103.4 95 tie effluent
Roswell synthe- 1 103.4 95 tic effluent
Roswell synthe- 1 87.0 80 tic effluent
Roswell synthe- 1 87.0 80 tic effluent
Roswell synthe- 1 103.4 95 tic effluent
Roswell synthe- 1 87.0 80 tic effluent
Roswell well water
Roswell synthe- 1 tic effluent
87.0 80
Roswell well water
Roswell synthe- 1 tic effluent
103.4 95
Roswell well water
Roswell synthe- 1 tic effluent
103.4 95
Tap Tap 1 87.0 80
Tap Tap 1
Permeability " K " ft/yr Initial Final Average*
245 47 65
3.3 0.6 0.7
0 0 0
0 0 0
72 23 30
139 24 38
55 15 26
0 0 0
0 0 0
0 0 0
0 0 0
21 0 0.8
87.0 80 70 0 0.8
*Average " K " obtained after the permeabilities became nearly constant.

Soil Sample Soil source No. 48D-
2 Roswell
2 Roswell
2 Roswell
8
2 Roswell
2 Roswell
2 Roswell
Type sealant used
0.3 )ercent sodium silicate
0.3 )ercent sodium silicate
0.3 }ercent sodium silicate
0.3 )ercent sodium silicate
0,3 )ercent sodium silicate
0.3 )ercent sodium silicate
None
Tap
Table 20-Continued
SUMMARY OF PERMEABILITY TEST R ESU LTS
Tap
Tap
Tap
Tap
Tap
2 Roswell
2 Roswell 0.3 percent sodium silicate
2 Roswell 0.3 percent Tap sodium silicate
Placement density Permeant Diameter Percent
Mix water water sample PCF laboratory (inches) maximum
Roswell synthe- 1 tic effluent
Roswell synthe- 1 tic effluent
Roswell synthe- 1 tic effluent
Roswell synthe- 1 tic effluent
Roswell synthe- 1 tic effluent
Roswell synthe- 1 tic effluent
87.0 80
87.0 80
Roswell well water
Roswell well water
97.9 90
97.9 90
103.4 95
103.4 95
Roswell synthe- 8 87.0 80 tic effluent
Roswell synthe- 8 87.0 80 tic effluent
Roswell synthe- 8 tic effluent
87.0 80
Permeability " K " ftJyr Initial Final Average*
114 0 0.6
Trace Trace Trace
0 0 0
0 0 0
0 0 0
0 0 0
566 494 522
506 417 453
20 11 14
*Average " K " obtained after the permeabilities became nearly constant.

. . b
Table 21
SUMMARY OF PERMEABILITY TEST RESULTS
Soil Sample No. 48D-
Soil source Type sealant
used
Placement density Permeant Diameter Percent
Mix water water sample PCF laboratory (inches) maximum
11 Dalpra Farm None
11 Dalpra Farm None
18 Dalpra Farm None
18 Dalpra Farm None
18 Dalpra Farm None
X35 Dalpra Farm None
X35 Dalpra Farm None
X35 Dalpra Farm 2 percent 48D-36
X35 Dalpra Farm 2 percent 48D-36
X35 Dalpra Farm 0.25 percent 48D-37 plus 0.5 percent alum
X35 Dalpra Farm 0.25 percent 48D-37 plus 0.5 percent alum
X35 Dalpra Farm B-5604 (800 Ib/acre) 2
X35 Dalpra Farm B-5604 (800 Ib/acre) 2
X35 Dalpra Farm None q
Sealant placed dry on soil.
Tap
Tap
Tap
Tap
Tap
Tap
Tap
Tap
Tap
Tap
Dalpra Farm 1 effluent
Dalpra Farm 1 effluent
Dalpra Farm 1 effluent
Dalpra Farm 1 effluent
Dalpra Farm 1 effluent
Dalpra Farm 1 effluent
Dalpra Farm 1 effluent
Dalpra Farm 1 effluent
Dalpra Farm 1 effluent
Dalpra Farm 1 effluent
Tap Dalpra Farm 1 effluent
Tap
Tap
Tap
Dalpra Farm 1 effluent
Dalpra Farm 1 effluent
Tap 1
2Sealant placed as slurry on soil. *Average "K" obtained after the permeabilities became nearly constant.
107.1 90
110.8 Field density
114.5 95
108.4 90
107.2 Field density
107.0 90
107.0 90
107.0 90
107.0 90
107.0 90
107.0 90
107 90
107 90
107.0 90
Permeability "K" ft/yr Initial Final Average*
1.6 0.6 0.6
0 0 0
14 11 19
106 72 125
115 71 142
104 5 10
185 22 34
63 6 10
65 4 10
26 4 6
16 4 6
263 0 0
292 0 0
292 51 73

(3) I%1
Table 21 -Continued
SUMMARY OF PERMEABILITY TEST RESULTS
Soil Type sealant Sample Soil source used No. 48D-
Mix water
Placement density Permeant Diameter Percent
water sample PCF laboratory (inches) maximum
X35 Dalpra Farm B-5605 (800 Tap I b/acre) 1
X35 Dalpra Farm B-5605 (400 Tap Ib/acre) 1
X35 Dalpra Farm B-5604 (600 Tap Ib/acre) 2
X35 Dalpra Farm B-5604 (600 Tap Ib/acre) 2
X35 Dalpra Farm B-5604 (100 Tap Ib/acre) 2
X35 Dalpra Farm B-5604 (100 Tap Ib/acre) 2
X35 Dalpra Farm None Tap
X35 Dalpra Farm None Tap
X35 Dalpra Farm B-5605 (400 Tap Ib/acre)
X35 Dalpra Farm B-5605 (400 Tap I b/acre) l
X35 Dalpra Farm B-5604 (800 Tap I b/acre) 1
X35 Dalpra Farm B-5604 (800 Tap I b/acre) 1
X35 Dalpra Farm B-5604 (100 Tap Ib/acre) ]
X35 Dalpra Farm B-5604 (100 Tap Ib/acre) 1
X35 Dalpra Farm B-5605 (800 Tap Ib/acre) 2
Tap 1
Tap 1
Tap 1
Tap 1
Tap 1
Tap 1
Dalpra Farm 1 effluent
Dalpra Farm 1 effluent
Dalpra Farm 1 effluent
Dalpra Farm 1 effluent
Dalpra Farm 1 effluent
Dalpra Farm 1 effluent
Dalpra Farm 1 effluent
Dalpra Farm 1 effluent
Dalpra Farm 1 effluent
107.0 90
107.0 90
107.0 90
107.0 90
107.0 90
107.0 90
107.0 90
107.0 90
107.0 90
107.0 90
107.0 90
107.0 90
107 90
107 90
107 90
z Sealant placed dry on soil. 2-Seaiant placed as Slurry on soil. *Average "K" obtained after the permeabilities became nearly constant.
Permeability "K " ft/yr Initial Final Average*
312 5 7
178 2 4
241 0 0
255 0 0
212 0 0
190 0 0
212 48 63
286 42 56
252 14 40
108 14 28
204 0 0
144 0 0
139 0 0
224 3 3
204 28 33

I I I ~ •
Soil Type sealant Sample Soil source used No. 48D-
X35 DalpraFerm B-5605 (800 Tap Ib/acre) 2
X35 Dalpra Farm B-5605 (400 Tap Ib/acre) 2
X35 Dalpra Farm B-5605 (400 Tap Ib/acre) 2
X35 Dalpra Farm B-5605 (800 Tap Ib/acre) 1
X35 Dalpra Farm B-5605 (800 Tap Ib/acre) 1
X35 Dalpra Farm None Tap
X35 Dalpra Farm B-5605 (800 Tap I b/acre) l
X35 Dalpra Farm B-5604 (100 Tap Ib/acre) 2
X35 Dalpra Farm B-5604 (100 Tap Ib/acre) 2
354 Dalpra Farm B-5876 Tap 2 gal/yd 2
3 54 Dalpra Farm B-5800 0.25 Tap gal/yd 2
Table 21-Continued
SUMMARY OF PERMEABILITY TEST
Mix water Permeant Diameter
water sample (inches)
Dalpra Farm 1 effluent
Dalpra Farm 1 effluent
Dalpra Farm 1 effluent
Dalpra Farm 1 effluent
Dalpra Farm 1 effluent
Dalpra Farm 8 effluent
Dalpra Farm 8 effluent
Dalpra Farm 1 effluent
Dalpra Farm 1 effluent
Dalpra Farm 8 effluent
Dalpra Farm 8
R ESU LTS
Placement density Percent Permeability "K " ft/yr
PCF laboratory Initial Final Average* maximum
107 90 232 40 51
107 90 255 25 32
107 90 159 18 24
107.0 90 71 0 0
107.0 90 261 13 21
107.0 90 81 36 17
107.0 90.0 29 0.8 0.9
107.0 90 195 7 8
107.0 90 513 2 7
107.0 90 Test results not reliable because of suspected piping.
107.0 90 0.12 0.02 0.06
1 Sealant placed dry on soil. 2Sealant placed as slurry on soil. 348D-54 from same source as 48D-X35 and is nearly identical. *Average " K " obtained after the permeabilities became nearly constant.

Physical Properties Test Results for
Flexible Membrane Linings
Polyvinyl-Chloride Plastic
Polyethylene Plastic
Nylon-Reinforced Butyl Rubber
Tables 22 to 25
65

Table 22
PHYSICAL PROPERTIES OF POLYVINYL-CHLORIDE LINING INSTALLED AT THE DALPRA FARM TEST SITE
Bureau of Reclamation Specifications Are Also Listed for Comparison
Property
1. Thickness
2. Tensile strength, each direction, minimum
3. Bonded factory seam strength each direction minimum percent of tensile strength
4. Ultimate elongation each direction, percent minimum
5. Resistance to soil burial: Tensile strength loss, each direction-
percent, maximum Elongation loss, each direction--percent maximum
6. Water extraction, percent weight loss, maximum
7. Tear resistance (Elmendorf), each direction, mi nimu m average
8. Low temperature impact, O ° F (-17.8 ° C), + 3.6 ° F (2 ° C)
USBR requirements
10 mils (0.25 mm) + 10 percent
2,000 psi (140 kg/cm 2)
80
250
Laboratory test results Test method
10 mils (0.25 mm)
2,600 psi ( 182 kg/cm 2) L
2,800 psi (196 kg/cm 2) T
80 plus
ASTM: D 374, Method C
ASTM: D 882
ASTM: D 882
334 L 307 T
5 Pass See note below
20 Pass
1.0 Gain 0.32 ASTM: D 1239
160 g/mil (64 n/mm) 200 g/mil (80 n/mm) L ASTM: D 1922 275 g]mil (110 n/mm) T
Not more than 2 No failures ASTM: D 1790 specimens out of 10 shall fail
Note: L denotes longitudinal direction T denotes transverse direction
Test method for resistance to soil burial is described in Appendix IV.
67

1,
2.
Table 23 PHYSICAL PROPERTIES OF POLYETHYLENE LINING
INSTALLED AT THE DALPRA FARM TEST SITE Tentative Bureau of Reclamation Requirements Are Also Listed for Comparison
Property
Thickness
USBR requirement Laboratory test results
Tensile strength, minimum Longitudinal
Transverse
3. Ultimate elongation, percent minimum Longitudinal Transverse
4. Elmendorf Tear Resistance, minimum average Longitudinal Transverse
5. Low temperature impact, O ° F (-17.8°C), + 3.6 ° F (2 ° C)
. Water extraction, percent weight loss, maximum
12 mils (0.30 mm) + 25 percent
1,700 psi (119 kg/cm 2)
1,200 psi _ (84 kg/cm 2)
6.2 mils (0.16 mm)*
1,970 psi 138 kg/cm 2)
2,020 psi _ (141 kg/cm 2)
225 540 350 420
100 g/mil (40 n/mm) 100 g/mil (40n/mm) Not more than 2 specimens out of 10 shall fail
1.0
135 g/rail (54 n/mm) 235 g/mil (94 n/mm) No failures
0.11 (gain)
*A 6-mil-(0.15-mm-) thick lining was evaluated at Dalpra Farm.
Test method
ASTM: D 374 Method C
ASTM: D 882
ASTM: D 882
ASTM: D 1922
ASTM: D 1790
ASTM: D 1239
6 8

Table 24
PUNCTURE RESISTANCE PRESSURE CELL TEST RESULTS
Laboratory Type of material Sample No.
Test condit ion* Over 3 /4- to 1 and 1/2-inch-
Over No. 8 (2.38-mm) to No. 4 (19.1- to 38.1-mm) Thickness (4.76-mm) sieve size rock base size rock base
Water pressure at Water pressure at puncture T ime** puncture T ime**
mils mm psi kg/cm 2 hours psi kg/cm 2 hours
B-6006 Polyvinyl chlor ide*** 10 0.25 - - - 22.5 1.6 7 B-5878 Polyethylene*** 6 0.15 12.5 0.9 3.5 - -- _ B-4391 Polyvinyl chloride 10 0,25 - - - 27.5 1.9 1 B-3141 Polyethylene 6 0.15 10 0.7 Immediate - - -
*Water pressure increased by 2.5-psi (0.175-kgJcm 2) increments at 4-hour intervals. **Time of puncture after reaching highest water pressure. * * *L in ing installed at the Dalpra Farm test site.
I
Samples No. B-4391 and B-3141 are listed for comparison.
Remarks- Small holes are punc- tures less than 1/16-
inch (l.6-mm) average length
6 small holes • 20 small holes
2 small holes

Table 25
PHYSICAL PROPERTIES OF NYLON-REINFORCED BUTYL-RUBBER LINING INSTALLED AT THE DALPRA FARM TEST SITE
Property Laboratory test results
Thickness Weight Mullen hydrostatic
46 mils (1.14 mm) 42.3 oz/yd 2 (1.44 k~/m 2) 193 psi (13.5 kg/cm z)
Breaking strength L (Grab) T
122.2 ppi (21.8 kg/cm) 114.5 ppi (20.5 kg/cm)
Elongation L T
10.3 percent 10.7 percent
Tear strength L (Tongue) T
Heat aging-115.6 ° F, 7 days Original hydrostatic Original breaking strength Original elongation
Ozone-Degree of cracking 37.8 ° C, 7 days, 50 pphm (Procedure B)
21.0 Ib (9.5 kg) 20.8 Ib (9.4 kg)
Minus 0.3 percent Minus 1.3 percent Plus 3.9 percent
Cracked in 3 days
Bond tests Seam breaking strength (cutstrip method) Peel strength
100 percent of sheet strength 2.9 ppi (0.52 kg/cm)
Note: L denotes longitudinal direction T denotes transverse direction
ASTM test method
D 751 D 751 D 751
D 751 Method A
D 751
D 751 Method B
D 573 and D 751
D 1149 and D 518
D 751 Method B
D 1876
70

ASPHALTIC-CONCRETE LINING
Tables 26 to 30
71

Table 26
ASPHALTIC-CONCRETE LINING-DALPRA FARM Asphalt Cement Properties-Laboratory Sample No. B-5685
Specification Tests requirements* Laboratory results
Penetration At 25 ° C, 100 g, 5 sec At 0 ° C, 200 g, 60 sec At 46.1° C, 50 g, 5 sec
40-50 No requirement No requirement
41 16 173
Ductility At 25 ° C, 5 cm/min Not less 40 cms Plus 100 cms
Softening point (ring and ball) I L
*.Federal Specification SS-A-706b.
40 ° C-60 ° C 54.5
73

Table 27
ASPHALTIC-CONCRETE LINING-DALPRA FARM Aggregate Gradation-Laboratory Sample No. B-5685
Sieve size Dry Cumulative percent passing
Washed Specification limits
3/4-inch (19.1-mm) 100.0 100.0 100 1/2-inch (12.7-mm) 90.3 90.4 85-100 3/8-inch (9.52-mm) 80.5 80.6 No. 4 (4.76-mm) 65.0 65.2 55-80 No. 10 (2.0-mm) 55.1 55.4 35-60 No. 40 (0.42-mm) 26.3 28.3 18-30 No. 100 (0.15-mm) 10.2 13.5 No. 200 (0.074-mm) 6.1 9.6 5-12
74
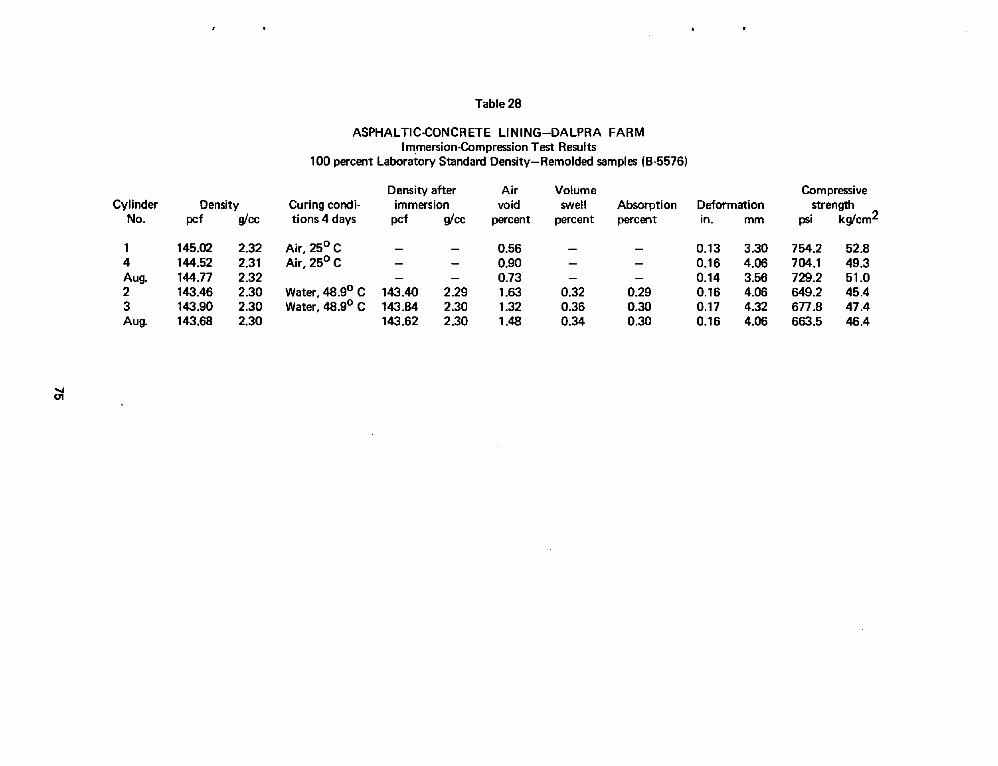
Cylinder Density No. pcf g/cc
1 145.02 2.32 4 144.52 2.31 Aug. 144.77 2.32 2 143.46 2.30 3 143.90 2.30 Aug. 143.68 2.30
Table 28
ASPHALTIC-CONCRETE L IN ING-DALPRA FARM Immersion-Compression Test Results
100 percent Laboratory Standard Density-Remolded samples (B-5576)
Density after Ai r Volume Curing condi- immersion void swell Absorption tions 4 days pcf gJcc percent percent percent
Air, 25 ° C - - 0.56 - - Air, 25 ° C - - 0.90 - -
- - 0.73 - - Water, 46.9 ° C 143.40 2.29 1.63 0.32 0.29 Water, 46.9 ° C 143.84 2.30 1.32 0.36 0.30
143.62 2.30 1.48 0.34 0.30
Deformation in. mm
Compressive strength
psi kg/cm 2
0.13 3.30 754.2 52.8 0.16 4.06 704.1 49.3 0.14 3.56 729.2 51.0 0.16 4.06 649.2 45.4 0.17 4.32 677.8 47.4 0.16 4.06 663.5 46.4
O1

Cylinder Density No.
pcf g/cc
Table 29
ASPHALTIC-CONCRETE LINING-DALPRA FARM Test of Flow Under Sustained Load
Remolded samples (B-5576)
Tem- pera- Load Deformation
Percent ture LSD* °C psi kg/cm 2 inch mm
Test results, hours
Stabilized Failed
1 145.08 2.32 100.4 25 3.0 0.21 0.02 0.51 60 5.0 0.35 0.01 0.25 60 7.5 0.52 0.02 0.51 60 10.0 0.70 0.03 0.76 60 15.0 1.05 0.02 0.51
Total 0.10 2.54
16 24 24 24
2 145.33 2.33 100.5 25 3.0 0.21 0.01 0.25 16 60 5.0 0.35 0.02 0.51 24 60 7.5 0.52 0.01 0.25 24 60 10.0 0.70 0.02 0.51 24 60 15.0 1.05 0.02 0.51 24 60 17.5 1.22 0.02 0.51 72 60 20.0 1.40 0.02 0.51 24
Total 0.12 3.05
*LSD, Laboratory Standard Density, 144.57 pcf (2.31 g/cc), is based on the average of eight cylinders molded at 3,000 psi (210 kg/cm 2) held for 2 minutes.
76

Table 30
ASPHALTIC-CONCRETE LINING-DALPRA FARM Test of Permeability
Core specimens from in-place lining sample (B-5685)
Density Specimen
No. pcf g/cc Percent Air voids Thickness LSD* percent in. cm psi
1 144.40 2.31 99.9 0.98 2.3 5.84 15
2 144.46 2.31 99.9 0.98 2.3 5.84 20
Note: Core specimens were cylindrical, 3 inches (7.62 cm) in diameter.
*LSD, Laboratory Standard Density, 144.57 pcf (2.31 g/cc)
Load Permeability kg/cm 2 ft ]yr cm/sec
1.05 0 0
1.40 0 0
77

Soil-Cement Lining
Table 31
Figures 8 to 11
79

O0 . - t
Cement content Percent by Percent dry weight by volume
6 7.05
8 9.12
10 11.3
Table 31
SOIL-CEMENT Summary of Unconfined Compression and Permeability Test Data
Specimen placement conditions Density Moisture
Percent of content maximum pcf gm/cm - 3 percent
Unconfined compressive strength 3-day 7-day 28<lay _
psi kg/cm - 2 psi kg/cm - 2 psi kg/cm -2
98 117.2 1.88 10.5 282 19.8 316 22.2 458 32.9 297 20.9 332 23.3 472 33.2 282 19.8 332 23.3 466 32,8
Avemgevalues
98 117.2 1.88 10.5
287 20.2 326 22.9 469 33.0
352 24.7 465 32.7 653 45.9 371 26.1 481 33.8 641 45.1 370 26.0 479 33.7 646 45.4
Average values 364 25.6 475 33.4 647 45.5
98 117.2 1.88 10.5 470 33.0 574 40.4 856 60.2 458 32.2 574 40.4 825 58.0 468 32.9 557 39.2 831 58.4
Permeability (K) ft/yr cm/sec
2.60 2.6 x 10 - 6
Average values 465 32.7 568 39.9 837 58.8 0.25 25 x 10 -7

2 8 0 0
E ~
24OO
2200
u =ooo
i-I 1800
Z 1600
l - m_ ~4oo
w
z
IL
8 ~
400
EO0
0 6 I 0 18 2 0
M O I S T U R E - P E N E T R A T I O N R E S I S T A N C E CURVE .=
28 30
M O I S T U R E - P E R C E N T OF DRY WEIGHT
t ~ b ~
I1-O
| 1 5 , , " X /
f ,
t i c ' "" n . *
m
~OO'
_ _ COMPACTION
BLO1ffl PER LAYER
LAY[Ra
b l , HAMMER
IN, DROP
I0
i
,,,~j %
I
18 20 28 30
M O I S T U R E - D R Y D E N S I T Y o U R V E S
k ° **
I b
i
D E N S I T Y T E S T CURVE
I THEORETIGAL CURVE AT COMPLETE SATURATION (NUMERAL8 INDICATE PER- CENTAGE OF TOTAL VOLUME OCCUPIED BY WATER ill ~VOID8]
_ _ SOIL PROPERTIES
_ _ IPI[01FI0 0RA¥1TY
_ _ lOlL OI.ASISIFKIATION
I/eLAN@IN THAN TI[STI[D
Ibl X, STD, DRY DINmTY (P,O. F.)
_ _ O~T IIOINTUNI[ {~11| i I~
_ _ . - . , + T - , , + + i i
i__
- I __ I
SOIL-CEMENT 48D--X35 PLUS ............ 0 % cement --X-- 6 % cement - - - e - - - 8 % cement-- --0--- ]0 % cement
-hO ~ - - - - o~
t.8
UNITED S T A T E S OEPARTMENT OF THE iNTERIOR
BUREAU OF RtOLAMAT~ON
COMPACTION TEST CURVES
DRAWN . . . . . . . . . . . . . . . . . . . . . ONI[OKED . . . . . . . . . . . . . . . . DATE . . . . . . . . . . . . . . . . . . . .
Figure 8. Compaction test curves.
82

ZS,
Z6
) I I I I I
CURED 7 DAYS BEFORE CYCLES STARTED
2 4
2 2
2O
t8
l b $
0
IO
8
6
4
0 0
) /
/ .J
/
J /
/ /
F
) /
/ /
f
J f
/
F
,Y
¢,
I I
/ /
/ i I
FI/~I/ /
/
iV I 2 WET-DRY TEST5
TAP WA'r E I~..
C Y C L E T I M ' E =2 . . D A Y 5
3 ~ ~ ~ 7 ~ 9 Io ~J It.
T E ~ T C Y C L E 5 .c'I~'E2~-'THAW TEST5
r,.,---....~ T A P W A " r I ~ . .
C'~ t C L ~ TS P'I~" ~ 2 . D A Y ~
CEME.NT CONTENT = 6 %
118.0 p c f ( 1 .89 LL~/cm ) , 10./+ % w a t e r
Figure 9. Soil-cement tests-Dalpra farm.
83

Z8
26
| [ 1 ! 1 1
CURED 7 DAYS BEFORE CYCLES STARTED
2,*
2 2
2 0
18
16 $ I 14
0
i 0 '
6
i s "[ l
, ,, _ ~ J
4
r ,,~-i ,.,.,.--~m , ~ . . ~ . , . - ~ p---
0 0 I 2 :3 ~, ~ 6 7 8 9 I0 ! J i£
WET-DRY TEST5
o - - - - - - 0 B m . : N K CYC i , S T I M ' B = ~. DAY'S
11%7 pcf ( 1.89 Fm/cm ) ,
T E S T C Y C L E 5 FRCC2'E'-THAW' TESTS
T A P W A" r I¢ ~..
T I ~ E ,= 7- D A Y S
CEPtKNTCONTENT = 8 o/o
10.5 % water
Figure 10. Soil-cement tests-Dalpra farm.,
84

Z8
24
CURED 7 DAYS BEFORE CYCLES STARTED |
I
. . . . . . . . . . . "1 .....
22
2O
16 $
0 J2
|0'
8
6
4"
.4
4Sp -~ i i r " i
0 I 2 3 4 ~ 6 7 8 9 J0 ~; It.
WET-DRY T E 5 T 5
e- - - - - - -e TAP WAT=R. O--- - --O B~.INK. CYCLE TIM'~ = 2, DAY5
11B.I per ( I.B9 ~/cm ) ,
T E S T CYCLF.~ Ff~EE?E-VHAW TEST5
T " r A P w A - r E ~ -
CEH F_ NT CONTE N T =/D °/o
10.4 % water
Figure 11. Soil-cement tests-Dalpra farm.
85
Spray-applied Liquid Asphalt BJ5876
Tables 32 to 35
87

Table 32
PHYSICAL PROPERTIES OF LIQUID ASPHALT
Tests
Flash point o C (C.O.C.) Viscosity at 60 ° C, CS Specific gravity
Distillation Distillate (percent of total distillate to 360 ° C) to 190 ° C to 225 ° C to 260 ° C to 315 ° C
Residue from distillation to 360 ° C, volume percent by difference
Tests on distillation residue Penetration, 0 ° C, 200g, 60 sec Penetration, 25 ° 100 g, 5 sec Penetration, 46.1 ° C, 50 g, 5 sec
Ductil i ty, 25 ° C, cms
Softening point, o C (ring and ball method)
B-5876
Test results
65 plus 84 0.950
0 6.0 54.2 91.6
58.5
5 17 105
100 plus
67
89

Table 33
PENETRATION TEST RESULTS
Application rate gsy m/I
Penetration into 2-inch- (5.08-cm-) high cylinders* Duration of
in. cm test hours
Volume of cutback asphalt penetrated,
percent
0.5 2.3
1.0 4.6
2.0 9.2
4 75 0.6 1.52 8 100
4 50 8 75
1.1 2.79 24 100 4 25 8 50
1.6 4.06 24 100
*2- by 2-i_nch (5.08- by 5.08-cm) cylinders of Dalpra soil (48D-X35) compacted by 715-psi (50-kg/cm 2) loading for 1 minute.
90

¢D
Table 34
UNCONFINED COMPRESSIVE STRENGTH TEST RESULTS FOR DALPRA SOIL TREATED WITH LIQUID ASPHALT B-5876
Samples Were Air Cured at 23 ° C and 50 Percent Relative Humidity
Soil Liquid Application and
content* application rate percent
Compressive strength of 2- by 2-inch (5.08- by 5.08-cm) cylinders after various ages of curing
3 days 7 days 14 days 28 days psi kg/cm 2 psi kg/cm 2 psi kg/cm 2 psi kg/cm 2
48D-X35 1 6.7 Mixed 87.4 6.1 109.4 7.7 128.0 9.0 145.6 10.2 2 5.0 1 gsy (4.6 I/m 2)
48D-X35 1 1.7 Mixed 57.8 4.0 88.2 6.2 127.6 8.9 141.3 9.9 2 10.0 2 gsy (9.2 I/m 2)
48D-X35 1 1.7 Penetrated 105.2 7.4 109.8 7.7 118.4 8.3 126.0 8.8 2 10.0 2 gsy (9.2 I/m 2)
48D-54 1 11.7 Mixed 363.0 25.4 396.0 27.7 432.0 30.2 443.0 31.0 2 0 Control
*Optimum moisture content is 11.7 percent based on dry weight of sand. No. 1 is water content and No. 2 is the cutback asphalt content. All samples were fabricated at 715-psi (50.1-kg/cm 2) loading held for 1 minute.

r, ID
Table 35
UNCONFINED COMPRESSIVE STRENGTH TEST RESULTS FOR DALPRA SOIL TREATED WITH LIQUID ASPHALT B-5876
Samples Were Oven Cured at 60 ° C
Soil Liquid Application and
content* application rate percent
Compressive strength of 2- by 2-inch (5.08- by 5.08-cm) cylinders after various ages of curing
3 days 7 days 14 days 28 days psi kg/cm 2 psi kg/cm 2 psi kg / cm 2 psi kg/cm2
48D-X35 1 6.7 Mixed 155.3 10.9 16619 11.7 244.9 17.1 318.6 22.3 2 5.0 1 gsy (4.6 I/m 2)
48D-X35 1 1.7 Mixed 204.8 14.3 276.8 19.4 484.3 33.9 598.1 41.9 2 10.0 2 gsy (9.2 I/m 2)
48D-X35 1 1.7 Penetrated 220.2 15.4 280.0 19.6 366.5 25.7 498.6 34.8 2 10.0 2 gsy (9.2 I/m 2)
48D-54 1 11.7 Mixed 418.2 29,3 430.0 30.1 488.0 34.2 547.0 38.3 2 0 Control
*Optimum moisture content is 11.7 percent based on dry weight of sand. No. 1 is water content and No. 2 is the cutback asphalt content. All samples were fabricated at 715-psi (50.1-kg/cm 2) loading held for 1 minute.

APPENDIX III
Construction of Test Ponds
Photographs 4 and 5
Table 36
Figure 12
93

APPENDIX III
CONSTRUCTION OF TEST PONDS
General
Briefly, the construction of the tests ponds consisted of: (1) preparation of drainage pads, (2) installation of required base linings on the drainage pads, and (3) erection of metal tanks. The construction sequence is shown in Photographs 4 and 5.
Nine drainage pads were prepared by excavating native soil 1 foot (0.3 m) deep, and backfilling with sand over a 25-foot (7.6-m) square area. The required base linings were then installed on the sand pads. Trenches were excavated for the base of the metal tanks and the tanks were erected. The tanks consisted of nine arch sections bolted together to form an 18-foot- (5.5-m) diameter tank. A mastic, recommended by the manufacturer of the tanks, was applied in the seams of the bolted sections to provide watertight joints. After assemblage of the tanks, the trenches were backfilled with native soil, tamped, and the backfill inside the tanks treated with asphaltic materials to seal against water loss. A rubber liner was then installed on the interior vertical surface of each tank to insure uniform evaporation conditions.
Installation of Linings
Flexible membrane linings.-Shop-fabricated sheets of PVC and nylon-reinforced butyl rubber and a custom roll of polyethylene were obtained in sizes large enough to cover the base as well as the sides of the tanks. The linings were placed with sufficient slack to prevent undue stresses when subjected to the brine waterload.
Compacted-earth lining.-Selected native soil was moistened to a 11 percent content, mixed, placed on the sand pad, and then compacted in two lifts to a 12-inch- (30.4-cm-) thick layer at 95 percent maximum density.
Soil sealants.-Carboxymethyl cellulose at a 0.25 percent content and alum at a 0.05 percent content were dry mixed into native soil. Water was mixed into the soil mixture at a moisture content of 10 percent. The soil mixture was then spread on the sand pad and a vibrating roller used to compact the material into a layer 6 inches (15.2 cm) thick to a minimum of 95 percent maximum density. The 6-inch- (15.2-cm-) thick lining containing the 2 percent attapulgite clay formulation was constructed in the same manner.
After Tank No. 6 was erected and the trench backfilled and tamped, the natural soil inside the tank was smoothed and treated with the liquid asphalt. The material was spray-applied at a rate of 1.5 gsy (6.8 I/m 2) for the first treatment. After a curing period of 5 days, a second applicatiowl of 0.5 gsy (2.3 I/m 2) was applied. Except for several small areas on the shaded side of the tank, good penetration was noted.
Compaction Control Tests
Field tests were performed to determine that the soil linings were compacted to the specified 95 percent of maximum density, 119 pcf (1.91 g/cc). The density determinations were made using the balloon method, Photograph 4, a common field test for this purpose. Tests were run in areas of the lining outside the tank perimeter so as not to introduce a possible seepage area.
Asphaltic concrete.-Hot-mix asphaltic concrete was placed on the sand pad. The mix was spread, rolled and compacted to a 2-inch- (5-cm-) thick lining. Laboratory tests conducted on samples of the in-place lining indicated satisfactory compaction was used.
Results of these tests, summarized in Table 36 of this Appendix, showed the linings for the chemically sealed ponds, the soil-cement lined and the compacted-earth lined ponds to meet or exceed the specified 95 percent of maximum density criteria.
Soil-cement l in ing.-Type I portland cement was dry mixed with a rototil ler at 8 percent by weight into selected native soil. Mixing was accomplished in a separate area. Water was added as shown in Photograph 4 to give an optimum moisture content of 12 percent. The soil-cement mixture was then spread on the sand pad and a pneumatic tire roller, as shown in Photograph 4, used to compact the material into a 6-inch- (15.2-cm-) thick layer to a minimum of 95 percent maximum density. The surface of the lining was then moistened and covered with a protective layer of wet earth for a 7-day curing period.
Although density control was not required for the sand pads underlying the linings, they were compacted. Density tests run on the compacted sand showed it to be at about 80 percent relative density, 114 pcf (1.83 g/cc), which is normally an acceptable condition for backfill and other construction purposes and was satisfactory for this job. Field control tests for the sand pads are summarized in Table 36 and Figure 12 of this Appendix.
95

Mixing water into lining material prior to compaction, Photo P800-713-48NA
Compaction of lining with pneumatic tire roller, Photo P800-713-49NA
Field density test using balloon method. Photo P800-713-40NA
Photograph 4. Typical compacted lining construction sequence.
96

Excavating 1-foot (0.3-m) wide trench through lining and sand pad prior to tank placement. Photo P800-713-39NA
E r e c t i o n o f tank . Photo P800-713 -43 NA
Completed tank with a flexible membrane lining in place. Photo PX-D-67365
97 Photograph 5. Typical tank installation sequence.

Table 36
SUMMARY OF IN-PLACE DENSITY TESI~ FOR COMPACTION CONTROL
(0 CO
Type of tank lining
Compacted earth
Soil-cement
Chemical see[am
Sand-pad (dTainage layer) -
Properties of materials
CompacU(m test
Max. density
~z
119 1.91 11
120 1.92 12
116 1.8~ 14
116 1.86 14
Specified placement conditions
Relative de.dry test
Min. deputy Max. density
~ - 3
. . . . 113 1.81
. . . . 114 133
. . . . 110 1.67
. . . . 110 1.67
105 1.68 119 1.91
= % in (cm)
95 11 12 (30.5)
95 12 6 (16.2)
95 10 6 (15.2)
95 10 6 (15.2)
6 (15.2)
*Not r, pedfied
I n-ple~e conditions
i % %
117 1.87 98 11
117 1.87 9~ 12
110 1.71 95 10
110 1.67 95 10 --
114 1.83 -- 3 80
in (crn)
12 - (30.5)
6 (16,2)
6 (15.2)
6 (15.2)
6 (15.2)

( 0 CO
E L - 5 9 7 (9-69) B u r e a u o f R e c l a m a t i o n
M ECHAN ICAL A N A L Y S I S PLOT
25 HR, 7 HR, 45 MIN. 15 MIN. 100
HYDROMETER ANALYSIS I TIME READINGS
60 MIN. 19 MIN. 4 MIN. i MIN. #200 #100
90
80
70
O z 6 o
o. 1 - 5 0 Z IJu U , , ,40 O.
30
20
10
0
.001 . ~ 2 .MS . 0 ~ .019 .~7
C L A Y (PLASTIC) TO SILT (NON-PLASTIC)
#50
/ /
SIEVE ANALYSIS B
U.S. STANDARD SERIES ] C L E A R SQUARE OPENINGS #40 #30 #16 #10#8 #4
, , / I I ' I I
, / I
I I I I I
I i
' / 48D-30 l Sand used I I
I I I I
l I I I ,,/
!
I I I I
I t I I ! J
3 /8 " 3 /4 " 1½"
as base in ponds
.074 .149 .297 .590 1.19 2.38 4.76 9.52 19.1 38.1
DIAMETER OF PARTICLE IN MILLIMETERS r SAND
FINE I MEDIUM GRAVEL
FINE I COARSE
3" 5 " 6" 8 "
0
I 10 I I ! 20 I I I I 3O I I r~
I 1 -
3 O , ~ " I 1 - I Z
U
I m a .
I f I I I
I I !
11111
76.2 127 152 200
I COBBLES
Figure 12. Mechanical analysis plot.

APPENDIX IV
Laboratory Test Methods
Photographs 6 to 11
Figure 13
101

APPENDIX IV
LABORATORY TEST METHODS
General
The laboratory evaluation was conducted using either tests developed in the laboratory for specific USBR requirements or standard ASTM test methods. The tests are briefly described in the following paragraphs and, where appropriate, referenced to provide additional information.
Soil Testing
A. Visual classification.-The soils were classified using the "Unif ied Soil Classification System," page 379 in the USBR Earth Manual, First Edition, Revised. 6
B. Gradation.-This term, as applied to soils, refers to the distribution and size of grains. The test procedure is given in Designation E-6. 6 A soil is said to be well graded if there is a good representation of all particle sizes from the largest to the smallest, and poorly graded if there is an excess or deficiency of certain particle sizes within the size range, or if the range of predominant size is extremely narrow.
C. Consistency.-Depending upon the water content, fine soils or the fine fraction of coarse-grained soils can vary from a viscous liquid when wet to a hard condition when dry. Four states are recognized for describing the consistency of soils. In terms of decreasing water content these are: liquid, plastic, semisolid, and solid. Laboratory tests were conducted in accordance with Designation E-76 to determine the water content limits for these states of consistency. The water contents are reported as liquid l imit (LL), the plastic l imit (PL), and shrinkage l imit (SL). The water content over which a soil is in the plastic state (LL-PL) is defined as the plasticity index (PI). These tests, also known as Atterberg Tests, are useful to identify and classify soils and to estimate certain soil properties.
D. Compaction.-The Proctor Compaction Test Designation E-116, was conducted to evaluate the density and moisture-density relationships of Dalpra and Roswell soils. The test is performed to determine the maximum density of soil by compacting soil specimens at several water contents into a standard-size cylindrical mold using a standard compactive effort.
E. P e r m e a b i l i t y . - P e r m e a b i l i t y tests were conducted on Roswell and Dalpra soils treated with various soil sealants. Three techniques were used to apply the sealants: mixtures with the soil and compaction to achieve seepage reduction, surface application, and ponding. The tests were run using three test methods described below:
1. O n e - i n c h - ( 2 . 5 4 - c m - ) d i a m e t e r permeameters.-Most of the testing was done in this size permeameter, a standard test used to evaluate soil sealants for use in irrigation canals. The soil specimens in these permeameters, Photograph 6a, were 1 inch (2.54 cm) in diameter and 12 inches (30.5 cm) long, in acrylic resin plastic tubes 18 inches (45.7 cm) long. A piece of No. 50 screen was fastened on the bottom of the permeameter tubes by melting the screen into the plastic on an electric hotplate. A one-half-inch (1.27-cm) filter of No. 16 to 30 sand was placed on the screen. The soil was compacted in 2-inch (5.08-cm) layers at optimum moisture. A constant waterhead above the soil specimen surface was maintained by head tanks operating on the Mariotte principle. Each head tank supplied liquid to two duplicate soil specimens. Since the head tanks were volumetrically calibrated, average permeabilities of two specimens were computed directly from head tank volume readings during recorded time per iods. The permeabilities of individual specimens were obtained at intervals by measuring the liquid caught in containers below the specimens.
The saturation of the specimens with carbon dioxide gas prior to the start of the permeability tests, which would be dissolved by the first water of the test and tend to produce gas-free voids, was considered. However, the soil was found to be calcareous, and there was the possibility of some of the calcareous material being leached out by the carbonic acid formed by water and carbon dioxide. This would possibly affect the soil structure sufficiently to change the soil permeability. Therefore, the carbon dioxide gas was not used.
2. Eight-inch- (20.3-cm-) diameter standard permeameter.--To treat a larger size soil specimen for comparison with the results obtained from the small l-inch- (2.54-cm-) diameter specimens, tests were made in a
60p. cit. p. 1.
103

standard 8- inch- (20.3-cm-) d iameter permeameter test apparatus shown in Photograph 6b. The procedure for this type of permeability test is presented in Designation E-136. The 8-inch- (20.3-cm-) diameter specimens were compacted in 1-inch (2.54-cm) layers to a 5 inch (12.7 cm) height. The specimens were spring-loaded and 1-psi (0.07-kg/cm 2) load was applied. In this type of permeameter, the water f lows upward through the soil from a constant-head tank. In this particular test, the porous stones,commonly used at the top and bottom of the soil' specimen were replaced by sand filters which were less likely to be plugged with sealant than would the porous stones.
3. Eight-inch- (20.3-cm-) diameter plastic permeameters.-In some of the tests where the sealant was placed on the surface of the soil, and where the sealant was mixed with the soil, 8-inch- (20.3-cm) diameter by 8-inch- (20.3-cm-) long plastic permeameter cylinders were used (Section 9, page 486, of Designation E-136). This permeameter, Photograph 6c, allows the use of a much larger soil specimen than the 1-inch- (2.54-cm-) diameter permeameters, and it is the type usually used for canal lining soils where no load during the test is required.
Plastic Linings
Samples of the 10-mil (0.25-mm) PVC and 6-mil (0.15-mm) polyethylene linings installed at Dalpra Farm were obtained for laboratory testing. Physical property testing consisted of:
A. Tensile strength, elongation, and bonding strength.-These properties were determined as specified in ASTM: D 882, Method A. This testing was accomplished in an electronic recorder-type testing machine housed in an environmental control chamber which provides precisely controlled temperature, humidity, and cleanliness conditions meeting ASTM and USBR specifications testing requirements. These facilities are shown in Photographs 7 and 8.
B. Soil burial.-Standard test specimens are buried in soil rich in cellulose-destroying micro-organisms to determine their resistance to bacteriological deterioration. 7 At different ages of soil burial, the tensile strength and elongation of the test specimens are determined. The soil burial test cabinet is shown in Photograph 9. The microbiological activity of the soil is frequently checked by burying untreated
6 7Op" cit. p. 1.
10-ounce cotton duck for 1- and 2-week periods. Satisfactory activity is indicated by tensile strength losses above 70 percent of strength in 1 week and above 90 percent in 2 weeks.
C. Water extraction.-The percent loss in weight from extraction by distilled water was determined in accordance with ASTM: D 1239.
D. Elmendorf tear resistance.-The tear resistance of the plastic films was determined as specified in ASTM: D 689.
E. Low temperature impact.-The resistance of the plastic films to impact at low temperatures was conducted in accordance with ASTM: D 1790. The test was conducted at 0 ° F (-17.8 ° C) plus or minus 3.6 ° F (2 ° C).
F. Puncture resistance.-To determine puncture resistance, plastic specimens, 2 feet (0.6 m) in diameter were tested under water pressure over graded aggregate acting as a simulated subgrade. The test was conducted using the laboratory equipment shown in Photograph 10. Either a coarse aggregate, 3/4 to 1 and 1/2 inch (1.9 to 3.8 cm), or a fine aggregate, sieve size No. 4 (4.8 mm) to 3/8 inch (9.5 mm), were used in the test. Of the two, the coarse aggregate simulated a more severe test condition. The test is started at a low water pressure of 2.5 psi (0.175 kg/cm 2) and then increased in increments of 2.5 psi (0.175 kg/cm 2) for fixed periods until failure. 7
Rubber Lining
Samples of the 45-mil (1.14-mm) nylon-reinforced butyl-rubber sheeting installed at Dalpra Farm were obtained for laboratory testing. Since there are no standard specifications developed yet for this type lining, the laboratory evaluation was limited primarily to the testing methods contained in ASTM: D 751, Testing Coated Fabrics:
A. Hydrostatic resistance.-The Mullen Hydrostatic Testing Machine was used to determine the hydrostatic resistance.
B. Breaking strength.-Tensile breaking strength was obtained with the universal testing machine shown in Photograph 8. Elongation was obtained by recording differential grip motion.
C. Heat aging.-Test specimens were placed in a 240 ° F (115.5 ° C) oven for 7 days to determine the
104

(a) Standard 1 inch (2.54 cm) diameter permeameters. Photo PX-D-67366
(b) Standard 8-inch (20.3 cm) diameter permeameter. Photo P X - D - 6 7 3 6 8
(c) 8-inch diameter plastic permeameter. Photo PX-D-67367
Photograph 6. Equipment used in laboratory permeability studies.
105

Photograph 7, Environmental control chamber where physical properties testing of plastics is conducted under closely controlled temperature and humidity conditions. Photo PX-D-61982
Photograph 8. Universal testing machine with recorder and extensometer equipment for measuring tensile strength and elongation properties of plastics. Photo PX-D-61983
106

Photograph 9. Soil burial test cabinet for aging of specimens set in composted soil placed in plastic containers. A constant temperature of 90 ° F and 80 percent relative humidity is maintained in the test cabinet. Photo PXoD-60275
107

A. Plastic samples placed over coarse aggregate'(3/4- to 1-1/2-inch size) in one test cell and over fine aggregate (No. 8 to No. 4 sieve size) in second test cell. Photo PX-D-61984
B. Test in progress with water pressure introduced on top of plastic samples. Photo PX-Do61985
Photograph 10. Pressure cell equipment for testing puncture resistance of plastic membrane lining. Photos PX-D-56556NA and PX-D-56557NA
108

relative resistance to age deterioration. The heat aging test followed ASTM: D 573 for the heat environment and ASTM: D 751 for tensile breaking strength after heating. The grab method was used for both original and aged specimens.
D. Ozone test.-This test was conducted using the standard loop.specimen of Procedure B in ASTM: D 518.
E. Tearing strength.-The tearing strength of the reinforced material was determined by the tongue tear procedure, Method B, in ASTM: D 751.
F. Bonded seam strength.-The seam breaking strength was determined by Method B, cut strip method of ASTM: D 751; The peel strength of the seams was determined according to ASTM: D 1876.
Asphaltic-Concrete Lining
Samples of both the hot-mix (B-5576) and in-place asphaltic~'oncrete lining (B-5685) installed at Dalpra Farm were obtained for laboratory testing.
A. Mix composition.-Solvent extraction was used to remove the asphalt from the mixed sample. The percentage of asphalt was based on the dry weight of aggregate. After the solvent was removed by distillation, standard physical properties tests were conducted on the asphalt residue. The aggregate portion obtained from the extraction tests was subjected to the standard laboratory gradation test. This test is performed on the aggregate washed on the No. 200 sieve (0.074 mm) to accurately determine the quantity of f i l ler material.
B. Laboratory standard density.-Standard test cylinders 4 inches (10.16 cm) in diameter by 4 inches (10.16 cm) high of the sampled mix, B-5576, were molded using a universal testing machine and the double plunger method while the mix was held at a temperature of 300 ° F (149 ° C). A compressive load of 3,000 psi (210 kg/cm 2) was applied for 2 minutes for compacting the cylinders. The average density obtained for the cylinders by this method of fabrication is considered the Laboratory Standard Density (LSD). The average densities of the in-place samples were compared to the LSD to determine if adequate compaction was used during construction of the lining.
C. Immersion-compression test.-This test is based upon ASTM: D 1074 and D 1075, and is used to de te rmine the compressive st rength of
9Op. cit. p. 1.
asphaltic-concrete mixes for both air and water-cured conditions. Four standard test cylinders were fabricated as described above. Two specimens were water cured at 120 ° F (48.9 ° C) for 4 days prior to testing. The other two were air cured at room temperature for comparison to the immersion test. At the end of the curing period, the water-immersed specimens were tested for volume change and absorption. The specimens were also inspected for clay popouts or blisters at the surface. The compressive strengths of the four cylinders were then determined. 9
D. Sustained-load test.-This test is conducted to determine the stability of asphaltic-concrete mixes for placement on slopes. 9 Standard cylinders are tested at 140 ° F (60 ° C) in the sustained-load apparatus shown in Photograph 11.
Soil cement
Because one of the ponds was to be lined with soil cement it was necessary to obtain data for determining the percent cement required. Freeze-thaw, wet-dry and unconfined compression tests were run for this purpose. Three cement Contents were tested; 6, 8 and 10 percent of the dry weight. Al l of the test specimens were compacted to 98 percent of maximum density, 117.2 pcf (1.88 g/cc), and at optimum moisture of 10.5 percent. Permeability tests were also conducted on the soil cement.
A. Freeze-thaw and wet-dry tests.-The freeze-thaw test (Methods of Freezing and Thawing of Compacted Soil-Cement Mixtures, ASTM D 560), and wet-dry test (Methods of Wetting and Drying Tests of Compacted Soil-Cement Mixtures, ASTM D 559) simulate internal expansion and shrinkage forces similar to those produced by changes in moisture content and temperature. The tests determine the minimum cement content to produce a structural material that wil l withstand these forces. These tests are evaluated in terms of weight loss after a prescribed number of test cycles.
Six specimens were prepared for the freeze-thaw tests, two at each of the three cement contents..At each cement content one of the specimens was prepared using tapwater in making the specimen and for the free-water source; for the other specimen, tapwater was used in making the specimen but brine was used as the free-water source. The six specimens prepared for the wet-dry tests were identical to the freeze-thaw specimens.
109

PX-D-56556NA P X-D-56557NA
Photograph 11. Sustained-load test showing test cylinder before and after failure.
B . U n c o n f i n e d c o m p r e s s i o n test.-Compressive-strength tests (Making and Curing Soil-Cement Compression and Flexure Test Specimens in the Laboratory, ASTM: D 1632, and Compressive Strength of Molded Soil-Cement Cylinders, ASTM: D 1633) are generally made as supplementary to the freeze-thaw and wet-dry tests. Compressive-strength test data are used to determine the increase in strength with time. Tests are evaluated from the pressure needed to fail specimens after 3, 7, and 28 days of curing.
For the unconfined compression tests, three specimens were prepared at each of the three cement contents. Tapwater was used for fabricating these specimens.
C. Permeability tests (Radial Flow Method).-The tests were performed on soil-cement specimens, prepared the same as those for unconfined
compression tests. The specimens were prepared for testing and tested in the following manner:
1. After 28 days of curing in the 100 percent relative humidity room, one-half-inch- (1.27-cm-) diameter holes were drilled lengthwise through the center of the specimen.
2. A 2.75-inch- (6.99¢m-) diameter by 0.25-inch- (0.61¢m-) thick plates with holes in the center for 0.125-inch- (0.3-cm-) pipe threads were epoxied to the top and bottom of each specimen. A pressure valve was attached to the bottom plate, and a connection for 0.26-inch (0.61-cm) compression fitting to the top plate.
3. The soil-cement specimen was then submerged in a container of water. A constant bore head tank with water was connected to the top 0.25-inch (0.61¢m) compression fitting. The
110

desired water head was maintained by closing the bottom valve on the specimen and applying air to the water surface in the head tank through a precise regulator.
4. A series of readings were obtained at the following heads: 4.617 feet (1.407 m), 9.235 feet (2.815 m), 13.852 feet (4.222 m), 18.47 feet (5.63 m) and 23.087 feet (7.037 m).
Permeability equipment is shown in Figure 13.
Spray-applied Liquid Asphalt
Laboratory tests were conducted primarily to determine three factors: penetration of the liquid asphalt in Dalpra soil, curing characteristics of Dalpra treated soil, and permeability of the treated soil. Physical properties of the special cut-back asphalt, B-5876, were determined and are summarized in Table 32 of Appendix I1.
A. Fabrication of test cylinders.-Soil samples used in the laboratory evaluation were 2 inches (5.08 cm) in diameter by 2 inches (5.08 cm) high in size. The cylinders were fabricated using double-plunger-type molds and a compactive effort of 715 psi (50 kg/cm 2) held for 1 minute. For tests where the liquid asphalt was mixed into the soil, the mixing was accomplished in a mechanical mixer prior to cylinder fabrication.
B. Penetration tests.-To determine the penetrating capabilities of the liquid asphalt into Dalpra soil, standard test cylinders were compacted in 4-inch- (10.16-cm-) high molds. A 2-inch (5.08-cm) portion of the mold extending above the soil cylinder provided a reservoir for applying the liquid asphalt. The liquid asphalt was heated to 140 ° F (60 ° C) as recommended by the manufacturer, and poured into the top of the molds in quantities to produce application rates of 0.5, 1.0, and 2.0 gsy (2.3, 4.6, and 9.2 I/m2). The depth of penetration and percentage of liquid asphalt that penetrated the soil cylinders were measured after 4, 8, and 24 hours.
C. Curing characteristics.-The compressive strength of both mixed and penetrated soil samples was used to measure the relative curing and binding characteristics of the liquid asphalt. The tests involved curing conditions of 140°F (60 ° C) oven and 50 percent relative humidity at 73.4 ° F (23 ° C) for ages 3, 7, 14, and 28 days. 13
D. Permeability test.-This test, as described under soil testing, Subparagraph e., was conducted on an 8-inch- (20.3~m-) diameter soil sample treated with the liquid asphalt. The liquid asphalt was applied in two applications: 1.5 gsy (6.8 I/m 2) for the first treatment, and then after a 3-day curing period the second application of 0.5 gsy (2.3 I/m2).
130p. cit. p. 1.
111

P P E 3 S U R E , @ [ ~ U L A T O R -- I
I
- VAL VE 5 M P P L Y
EPOXY 5FA L -
A / I P P,~I-SSU, qE P I A I N T A I N E D T O DESIIqED HEAD
i
~ ~" • ~.. . ,'. ~,
-~ i...l .'~". • I.. I .'~,'. -~
~ , . .~ . . .. ~ .. ~ ~ - - I # A T E E ~
• , ~ )..I.'~." '-" I " I' ,~ :, -"
- . . i . ) ) k r ) . _ . . . ._. " "~ l i ' , '
• " ~.' ) \ .k.: ' ,, ~ , . ' y I I . . . . . . . = ~
" - ' - " ':'- ~L ' "-"
YAI VE J "- PEDESTAL FOR SPECII~EH
(For/sleeo//ng a i r Prom h a l e dur)~ solurahbn)
TAN~ /For submergJ~.e £peumen dur/n~ t e s t )
C E N T E R H O L E ( o . 5 " O / q n ~ . )
~AOIAL FIO~I PEPMEASI/-/TY TE3T
Figure 13. Radial f l o w permeabi l i ty test.
112

QIOaOOIOQOQWOOOOOOBOOOQOOOOO~6BOQdI~OOOO~OOQ . . . . . . . 0 0 Q O O I ~ I . . . . . . . . . QSO60QQDO~OOOOOQBQOOOOOOOaQOIQOtOQWOIOeOQQQ . . . . . . . . . . . . . OI~000Q~OOQDQOOOO~OQOOOOQ~OOODOQDDOOBDgQ
ABSTRACT
A field and laboratory evaluation of lining materials proposed for usa in brine disposal ponds was conducted. Flexible membrane linings were the most effective for seepage control, followed by hard-surface linings, compacted earth, and soil sealants. The investigation and other studies show that soil sealants only reduce seepage and do not affect a complete seal, and that the service life of soil sealants is questionable. Recommendations on a monitoring system for measuring seepage losses from brine disposal ponds are included.
Q
°°°~..°°°....°°..°...°-....'.'.....-'.'..'...'...................~'.................°°...°..°..............°.........-..................'.....'...°.°...~.°°...°°°°°°°
ABSTRACT
A field and laboratory evaluation of lining materials proposed for usa in brine disposal ponds was conducted. Flexible membrane linings were the most effective for seepage control, followed by hard-surface linings, compacted earth, and soil sealants. The investigation and other studies show that soil sealants only reduce seepage and do not affect a complete seal, and that the service life of soil sealants is questionable. Recommendations on a monitoring system for measuring seepage losses from brine disposal ponds are included.

R EC-OCE-70-30 Morrison, W R; Dodge, R A, Merriman, J; et al POND LININGS FOR DESALTING PLANT EFFLUENTS Bur Reclam Rep REC-OCE-70-30, Div Res, Sept 1970. Bureau of Reclamation, Denver, 112 p, 13 fig, 11 photo, 39 tab, 14 ref, 4 append
DESCRIPTORS-/ *research and development/ *linings/ seepage/ soil tests/ *ponds/ earth linings/ flexible linings/ *soil treatment/ polyethylenes/ laboratory tests/ *field tests/ soil cement/ asphaltic concrete/ seepage losses/ asphalt/ disposal/ *plastics/ *instrumentation/ *brine disposal/water stage recorders/temperature sensors/*soil sealants IDENTIFIERS--/Office of Saline Water/polyvinyl chloride/permeability tests
R EC-OCE-70-30 Morrison, W R; Dodge, R A; Merriman, J; et al POND LININGS FOR DESALTING PLANT EFFLUENTS Bur Reclam Rep REC-OCE-70-30, Div Res, Sept 1970. Bureau of Reclamation, Denver, 112 p, 13 fig, 11 photo, 39 tab, 14 ref, 4 append
DESCRIPTORS-/ *research and development/ *linings/ seepage/ soil tests/ *ponds/ earth linings/ flexible linings/ *soil treatment/ polyethylenes/ laboratory tests/ *field tests/ soil cement/ asphaltic concrete/ seepage losses/ asphalt/ disposal/ *plastics/ *instrumentation/ *brine disposal/water stage recorders/temperature sensors/*soil sealants I DENTI F I ERS-/Off ice of Saline Water/polyvinyl chloride/permeability tests
R EC-OCE-70-30 Morrison, W R; Dodge, R A; Merriman, J; et al POND LININGS FOR DESALTING PLANT EFFLUENTS Bur Reclam Rep REC-OCE-70-30, Div Res, Sept 1970. Bureau of Reclamation, Denver, 112 p, 13 fig, 11 photo, 39 tab, 14 ref, 4 append
DESCRIPTORS-/ *research and development/ *linings/ seepage/ soil tests/ *ponds/ earth linings/ flexible linings/ *soil treatment/ polyethylenes/ laboratory tests/ *field tests/ soil cement/ asphaltic concrete/ seepage losses/ asphalt/ disposal/ *plastics/ *instrumentation *brine disposal/water stage recorders/temperature sensors/*soil sealants IDENTIFIERS--/Office of Saline Water/polyvinyl chloride/permeability tests
R EC-OCE-70-30 Morrison, W R; Dodge, R A; Merriman, J; et al POND LININGS FOR DESALTING PLANT EFFLUENTS Bur Reclam Rep REC-OCE-70-30, Div Res, Sept 1970. Bureau of Reclamation, Denver, 112 p, 13 fig, 11 photo, 39 tab, 14 ref, 4 append
DESCRIPTORS-/ *research and development/ *linings/ seepage/ soil tests/ *ponds/ earth linings/ flexible linings/ *soil treatment/ polyethylenes/ laboratory tests/ *field tests/ soil cement/ asphaltic concrete/ seepage losses/ asphalt/ disposal/ *plastics/ *instrumentation/ *brine disposal/water stage recorders/temperature sensors/*soil sealants IDENTIFIERS-/Off ice of Saline Water/polyvinyl chloride/permeability tests

7-17S0 ( 1 - 7 0 )
Bc~reau of Reclamatio~
C O N V E R S I O N F A C T O R S - - B R / T I S H T O M E T R I C UNITS O F M E A S U R E M E N T
T h e fo l lowing c o n v e r s i o n f a c t o r s adop ted by the B u r e a u of R e c l a m a t i o n a r e t h o s e p u b l i s h e d by the A m e r i c a n Soc ie ty f o r Testin:~ and Materials (ASTM Metric Practice Guide, E 380-88) except that additional factors (*) commonly used in the Bureau have been added. Further discussion of definitions of quantities and units is given in the ASTM Metric Practice Guide.
The metric units and conversion factors adopted by the ASTM are based on the "International System of Units" (designated SI for Systeme International d'Unites), fixed by the International Committee for Weights and Measures; this system is also known as the Giorgi or IV[KSA (meter-kilogram (mass)-second-ampere) system. This system has been adopted by the international Organization for Standardization in ISO RecommenQation R-31.
The metric technical unit of force is the kilogram-force; this is the force -which, when applied to a body having a mass Of 1 kg, gives it an acceleration of 9. 80665 m/sec/sec, the standard acceleration of free fall toward the earth's center for sea level at 45 deg latitude. The metric unit of force In SI units is the newton (hi), which is defined as that force which, when applied to a body having a mass of 1 kg, gives it an acceleration of 1 m/sec/sec. These units must be distinguished from the (in=onsiant) local weight of a body having a mass of I kg; that is, the weight of a body is that force with which a body is attracted to the earth and is equal to the mass of a body multiplied by the acceleration due to gravity. However, because it is general practice to use "pound" rather than the technically correct term "pound-force. " the term "kilogram" (or derived mass unit) has been used in this guide Instead of "kilogram- force" in expressing the conversion factors for forces. The newton unit of force will fInd increasing use, and is essential in SI units.
Where approximate or nominal English units are used to express a value or range of values, the converted metric units in parentheses are also approximate or nominal. Where precise English units are used, the converted metric units are expressed as equally significant values.
Table I
QUANTITIES AND UNITS OF SPACE
Mul t ip ly By
L E N G T H
I n c h e s . . . . . . . . . . .
Feet
Y a r d s . . . . . . . . . . . M i l e s ( s ta tu te ) . . . . . . . .
• • • • . . . . . . . .
S q u a r e i n c h e s . . . . . . . . S q u a r e f e e t . . . . . . . . .
S q u a r e y a r d s . . . . . . . . A c r e s . . . . . . . . . . .
• ° . . . . . . . . .
• • • • • • . . . . •
Square miles . , .', . , , ,
Cubic i n c h e s . . . . . . . . Cubic feet. ....... . . Cubic y a r d s , . . . . . . . .
Fluid o u n c e s (U. S, ) ....
Liquid pints (U. S. ) ....
Quarts (U. S. ) ....... • • • • • • •
Gallons (U. S. ) .......
Gallons (U. K. ) .......
Cubic f e e t . . . . . . . . .
To obtain
2 5 . 4 (exac t ly ) . . . . . . . . M i c r o n 2 5 . 4 (e~mctly). M i l l i m e t e r s
2 . 5 4 ( exac t ly )* . . . . . . . C e n t i m e t e r s 3 0 . 4 8 (exac t ly) . . . . . . . Cent imeters
0. 3048 (em~ctly)* . . . . . . M e t e r s 0.0(303048 ( exac t ly )* . . . . K i l o m e t e r s 0. 9144 (exac t ly) . . . . . . M e t e r s
1 ,609 . 344 ( e x a c t l y ) " . . . . . . M e t e r s 1 .609344 (exac t ly) , . . . . K i l o m e t e r s
AREA
6. 4516 (exac t ly) . . . . . . S q u a r e c e n t i m e t e r s 9 2 9 . 0 3 * . . . . . . . . . . . S q u a r e c e n t i m e t e r s
0. 092903 . . . . . . . . . S q u a r e m e t e r s 0. 836127 . . . . . . . . . S q u a r e m e t e r s 0. 40469* . . . . . . . . . H e c t a r e s
4 ,046 . 9* . . . . . . . . . . . S q u a r e m e t e r s 0. 0040469" . . . . . . . . S q u a r e k i l o m e t e r s 2,58999~ . . . . . . . . , Square kUometers
VOLUME
16. 3871 . . . . . . . . . . Cubic c e n t i m e t e r s 0. 0283168 . . . . . . . . . Cubic m e t e r s 0. 764555 . . . . . . . . . Cubic m e t e r s
C A P A C I T Y
29. 5737 . . . . . . . . . . Cub ic c e n t i m e t e r s 29. 5729 . . . . . . . . . . M i l l i l i t e r s
0. 473179 . . . . . . . . . Cub ic d e c i m e t e r s 0 . 4 7 3 1 6 6 . . . . . . . . . L i t e r s
948. 358* . . . . . . . . . . Cub ic c e n t i m e t e r s 0. 946331* . . . . . . . . . L i t e r s
3 , 7 8 5 . 4 3 * . . . . . . . . . . Cub ic c e n t i m e t e r s 3 . 78543 . . . . . . . . . . Cubic d e c i m e t e r s 3. 78533 . . . . . . . . . . L i t e r s 0. 00378543* . . . . . . . . Cub ic m e t e r s 4. 54609 . . . . . . . . . Cub ic d e c i m e t e r s 4. 54596 . . . . . . . . . L i t e r s
28. 3160 . . . . . . . . . . L i t e r s Cubic y a r d s . . . . . . . . 764. 55* . . . . . . . . . . . L i t e r s A c r e - i e e t . . . . . . . . . 1 , 2 3 3 . 5 * . . . . . . . . . . . Cub ic m e t e r s
T ....... ~ Ij 233,500" Liters

Table H
QUANTITIES AND trNITS OF MECHANIC3
~aatlp~y
M A , ~
TO o b t a i n
Grains (I/7,0C0 ]b) ......... 64.79891 (em%ctly) ...... Mtll~gran~ Troy ounces (480 grains) ....... 31.1035 . . . . . . . . . . . Grams Ounces (avdp) . . . . . . . . . . . . 28.34~ ...... ~ .... Grams pounds (avdp) . . . . . . . . . . . . 0. 45359237 (exactly) ..... Kilograms 3hort t o n s (2,0(]0 lb) . . . . . . . . . 907.185 . . . . . . . . . . . K ~ o g r a m s
......... 0. 907185 . . . . . . . . . . Metr ic t o n s Lon~ tc~s (2,240 lb) . . . . . . . . . 1,018.05 . . . . . . . . . . . . K11oqrams
FORCE/m~ZA
P o u n d s p e r square inch ....... 0. 070807 . . . . . . . . . . Kilograms p e r square c e n t i m e t e r . . . . . . . 0 . 689476 . . . . . . . . . . N e w t o n s p e r s q u a r e c e n t i m e t e r
P o u n d s p e r s q u a r e foot . . . . . . . 4 . 88243 . . . . . . . . . . K i l o g r a m s p e r s q u a r e m e t e r . . . . . . . 47. 8883 . . . . . . . . . . . N e w t o n s p e r ~ a r e m e t e r
~ / V O L U m E (DENSITY)
O u n c e s p e r c u b i c i n c h . . . . . . . . 1. 72999 . . . . . . . . . . G r a m s p e r c u b i c c e n t i m e t e r P o u n d s p e r c u b i c foot ........ 16. 0186 .......... Kilograms p e r c u b i c m e t e r
. . . . . . . . 0. 0180185 . . . . . . . . . G r a m s p e r c u b i c c e n t i m e t e r T o n s (lonq} p e r c u b l c y a r d . . . . . . 1 . 32894 . . . . . . . . , G r a m s p e r c u b i c c e n t i m e t e r
MASS/CAPACITY
o u n c e s p e r ~ 1 o ~ (u . a ) . . . . . . 7. 4 s i n . . . . . . . . . . . G r a m s p e r n t e r O u n c e s p e r ga l l on (U. K. ) . . . . . . 6 . 2 3 6 2 . . . . . . . . . . . G r a m s p e r t l t e r P o u n d s p e r ga l l on (U. S. ) . . . . . . 119. 829 . . . . . . . . . . . G r a m s p e r l i t e r p o u n d s p e r ga l l on (U. K, ) . . . . . . ' 99. 779 . . . . . . . . . . . G r a m s p e r l i t e r
BENE~G MOMENT OR TOI~UE
Inch-pounds . . . . . . . . . . . . 0. 011521 .......... Meter-k~lograms . . . . . . . . . . . . I. 12~5 x i06. Celztlmeter-dyses
Fost-ponnds . . . . . . . . . . . . 0.138255.. 7 ........ Meter-kiloqrams . . . . . . . . . . . . I. 35582 x i0 . C e n t i m e t e r - d y n e s
Foot-pounds per inch ........ 5.4431 . . . . . . . . . . . Centlmeter-kflograms per ceutlmeter Ounce- hlches . . . . . . . . . . . . 72. 008 . . . . . . . . . . . Gram-ce~Emeters
V E L O C I T Y
F e e t p e r s e c o n d . . . . . . . . . . . 30. 48 ( exac t ly ) . . . . . . . . ~ t e r s p e r s e c o n d ,. . . . . . . . . . . 0. 3048 (e~mctly)* ...... Meters p e r second
Feet per year . . . . . . . . . . . . 0. 965873 x 10-6" ...... Centimeters per second Mlles per hour . . . . . . . . . . . 1. 609344 (exactly) ...... Kilometers-per hour
. . . . . . . . . . . 0. 44704 (enctly) ...... Meters per second
A C C E L E R A T I O N *
F e e t p e r second 2 . . . . . . . . . . 0. 3048* .......... M e t e r s p e r s e c o n d 2
FLOW
Cubic f e e t p e r s e c o n d ( s e c o n d - feet ) . . . . . . . . . . . . . . . 0 . 028317* . . . . . . . . . C u b i c m e t e r s p e r s e c o n d
Cub ic f e e t p e r m i n u t e . . . . . . . . 0 . 4719 . . . . . . . . . . Liters p e r s e c o n d C, allcms (U, 8, ) per mlm~te . ~ . . , . 0. 06309 Liters per second
FORCE*
P o u n d s . . . . . . . . . . . . . . . 0. 453592* ......... Kilograms . . . . . . . . . . . . . . . 4. 4482* Newtons , , , . . , . , ....... 4. 4482 x 10 - 5 . ....... Dynes
~ult~z By
WORK AND ENERGY ~
T o obtain
British theruml units (B~) ...... 0. 252* . . . . . . . . . . Kilogram calories ...... 1,055.06 . . . . . . . . . . . Joules
B~u per pound. . . . . . . . . . . . 2. 328 (exactly) ....... ~c~les per gram Foot-pounds ~ , . , .... , , . . 1.35582 * ......... , ~oules
POWER
H o r s e p o w e r . . . . . . . . . . . . 745 .700 . . . . . . . . . . . W a t t s B ~ p e r h o ~ r . . . . . . . . . . . . 0 . 293071 . . . . . . . . . . W a t t s F o o t - p o u n d s p e r s e c o n d . . . . . . . 1 .35582 . . . . . . . . . . W a t t s
H E A T T R A h ~ F E R
Bm in./hr ft 2 deg F (k, thermal conductivity) ....... 1. 442 .... ....... MiUlwatte/cm deg C
mu~2degF . . [ ~ ~ ~ [ [ ~ 0.1240 ........... Zg~Vhrmd~C Btu/hr ft degF(C, thermal 1.4880" . . . . . . . . . . Kgca/ m/hr m2degC
conductance) . . . . . . . . . . . 0. 568 Mtlllwatts/cm 2 deq C
D e g F h r R 2 / B ~ ( ~ . t l ~ . n ~ l . . . . . 4 . 8 8 2 . . . . . . . . . . Kg c a I / h r m Z d e g ( ~
resistance) . . . . . . . . . . . . i. 761 . . . . . . . . . . Deg C cm2/mllilwatt B t e / t b d e g F (c, h e a t c a p a c i t y ) . . . . 4 . 1 8 6 8 . . . . . . . . . . ~ / g d e g C Bt l t / ib d e g F . . . . . . . . . . . . 1 . 0 0 0 . . . . . . . . . . . C a l ~ g r a m d e g C F t z f ~ (therum/dlffualvlty) . i " ' " 0. 2581 C~ /sec
. . . . 0. 09290" . . . . . . . . . . M~/hr
W A T E R VAPOR T R A N S M I S S I O N
Gralns/hr R 2 (water vapor transmission) . . . . . . . . . . . 18.7 . . . . . . . . . . . Grams/24 hr m 2
Perms (permeance) ......... 0. 859 . . . . . . . . . . . Metric perme Perm-tsches (permeabJ3dty) . .... I. 87 , . . . . . . . . . . Metric perm-c~,H~Atp~s
T a b l e m
OTHER QUANTrn~ AND uNrrs
Multiply By To obtain
• Cubic feet per square foot per d a y ( s e e p a g e ) . . . . . . . . . . . 3 0 4 . 8 * . . . . . . • . . . . . L i t e r s p e r s q u a r e m e t e r p e r d a y
P o t m d - s e c o n d s p e r s q u a r e foot (v i s cos i t y ) . . . . . . . . . . . . 4. 8824* . . . . . . . . . . K l l o g r a m s e c o n d p e r s q u a r e m e t e r
Square feet per second (viscosity)... 0. 092~03. ......... Square meters per second Fahrenheit degrees (cl'~ange)* . . . . . 5/9 ezset/y . . . . . . . . Celsius or Kelvin degrees (chsnqe)* Vol te p e r roll . . . . A . . . . . . . 0 . 03937. . . . . . . . . . K i l o v o l t s p e r m i l l i m e t e r L u m e n s p e r square foot (foot-
c a n d l e s ) . . . . . . . . . . . . . 10. 764. . . . . . . . . . . L u m e n s p e r s q u a r e m e t e r O h m - c l r c u l s z m i l s p e r font . . . . . 0. 001662 . . . . . . . . . O h m - s q u a r e m i l l i m e t e r s p e r m e t e r M i l l i c u r l e s p e r c u b i c foot . . . . . . 3 5 . 3 1 4 7 " . . . . . . . . . M l l l i c u r i e s p e r c u b i c m e t e r
p e r s q u a r e foot . . . . . . 10. 7639* . . . . . . . . . ~ p e r s q u a r e m e t e r Ga l l ons p e r s q u a r e y a r d . . . . . . . 4 . 527219* . . . . . . f " . L i t e r s p e r s q u a r e m e t e r P o u n d s p e r ~ . . . . . . . , . . 0 . 1 7 8 5 8 * . . . . . ~ , ~ . K l l o q r a m s p e r c e - H m p t e r