Embed Size (px)
Citation preview
PAGE 1
Industrial Process Pond/Impoundment Closures: Business-Case Opportunities to Create Ecosystem Services
Jonathon Weier
PAGE 2
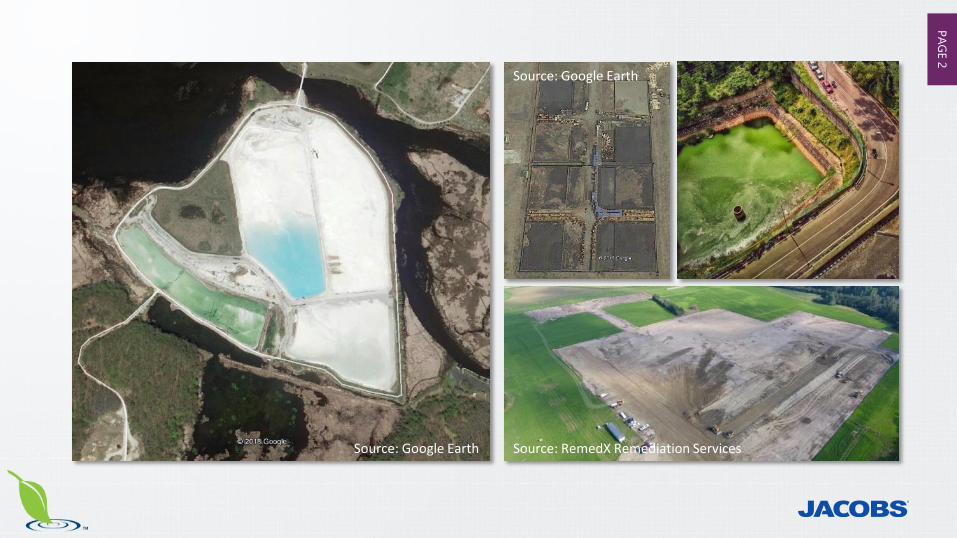
Source: Google Earth
Source: Google Earth
Source: RemedX Remediation Services
PAGE 3Traditional Isolation Cap
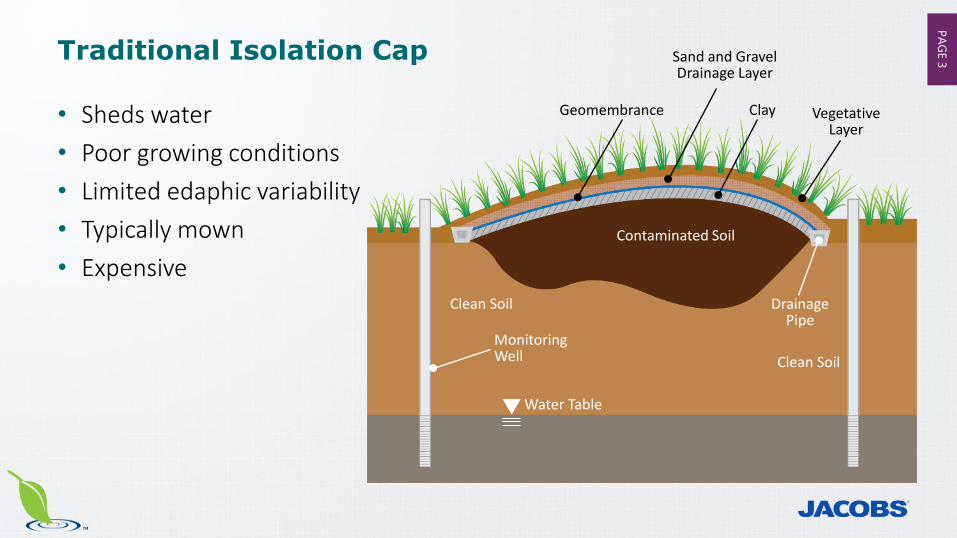
• Sheds water• Poor growing conditions• Limited edaphic variability• Typically mown• Expensive
Vegetative Layer
Contaminated Soil
Clay
Sand and GravelDrainage Layer
Geomembrance
Water Table
Clean Soil
Drainage Pipe
Clean Soil
Monitoring Well
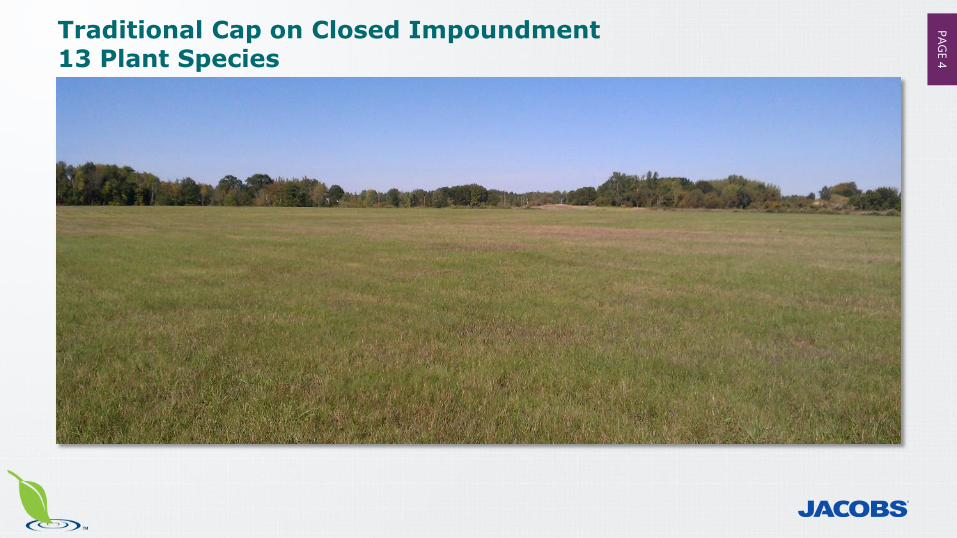
PAGE 4Traditional Cap on Closed Impoundment13 Plant Species
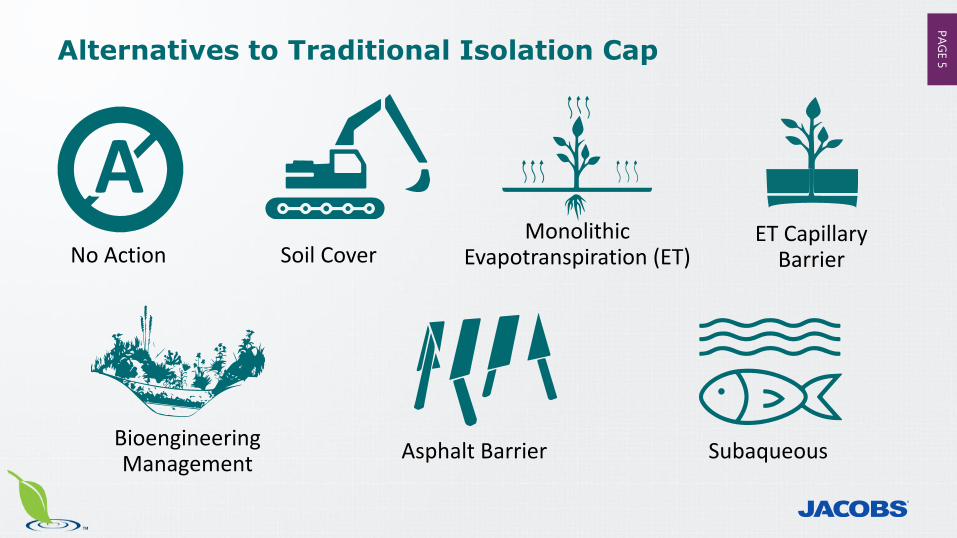
PAGE 5Alternatives to Traditional Isolation Cap
MonolithicEvapotranspiration (ET)Soil Cover
ET CapillaryBarrier
BioengineeringManagement Asphalt Barrier Subaqueous
No Action
A
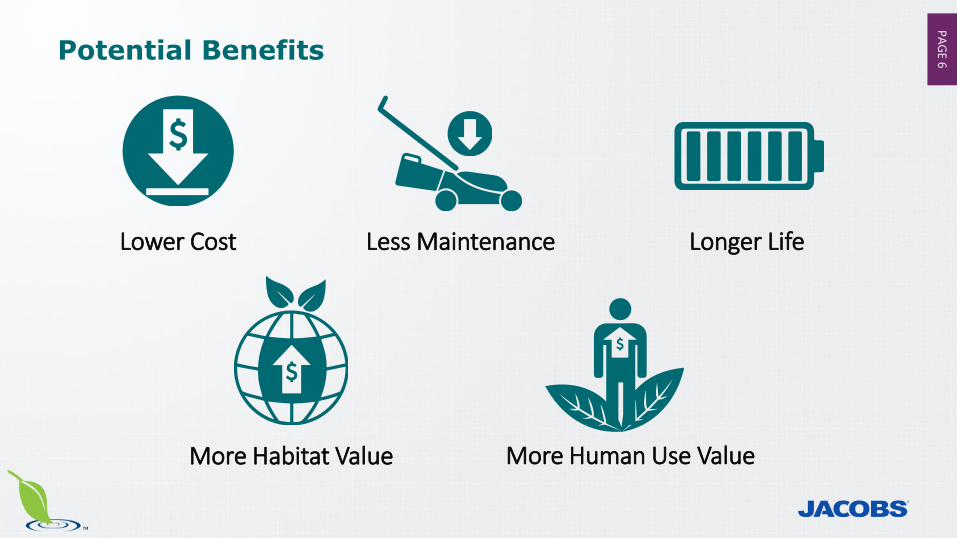
PAGE 6Potential Benefits
Lower Cost Less Maintenance Longer Life
More Habitat Value More Human Use Value
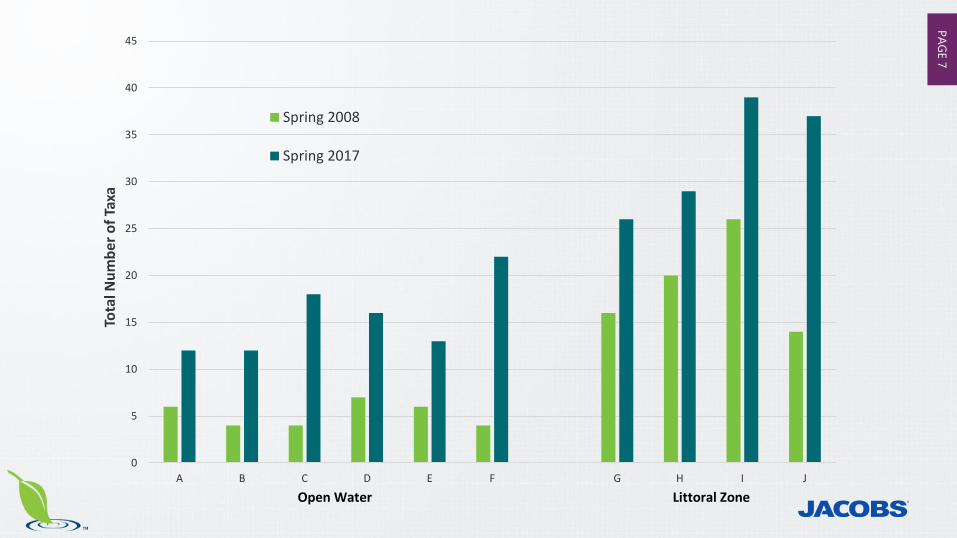
PAGE 7
0
5
10
15
20
25
30
35
40
45
A B C D E F G H I J
Tota
l Num
ber o
f Tax
aSpring 2008
Spring 2017
Open Water Littoral Zone
PAGE 8
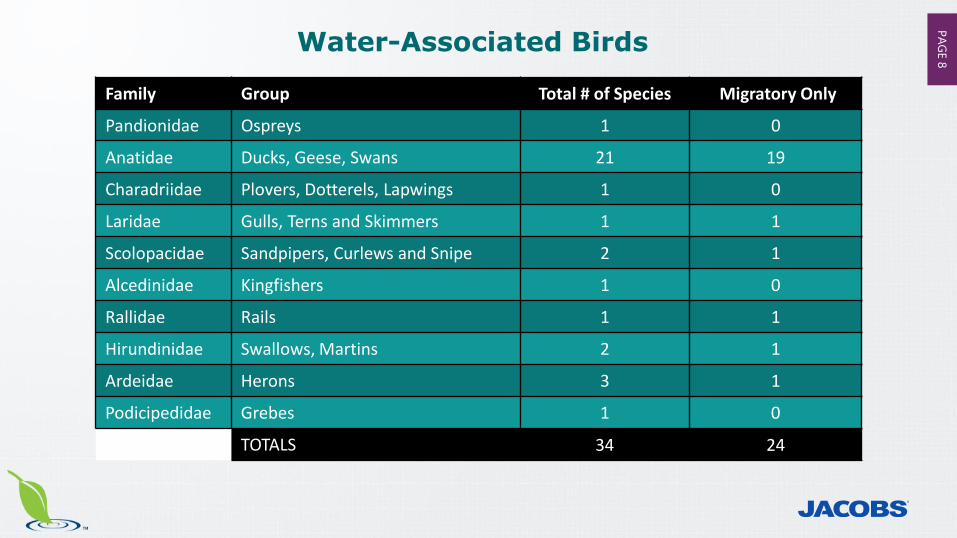
Water-Associated Birds
Family Group Total # of Species Migratory Only
Pandionidae Ospreys 1 0
Anatidae Ducks, Geese, Swans 21 19
Charadriidae Plovers, Dotterels, Lapwings 1 0
Laridae Gulls, Terns and Skimmers 1 1
Scolopacidae Sandpipers, Curlews and Snipe 2 1
Alcedinidae Kingfishers 1 0
Rallidae Rails 1 1
Hirundinidae Swallows, Martins 2 1
Ardeidae Herons 3 1
Podicipedidae Grebes 1 0
TOTALS 34 24
PAGE 9
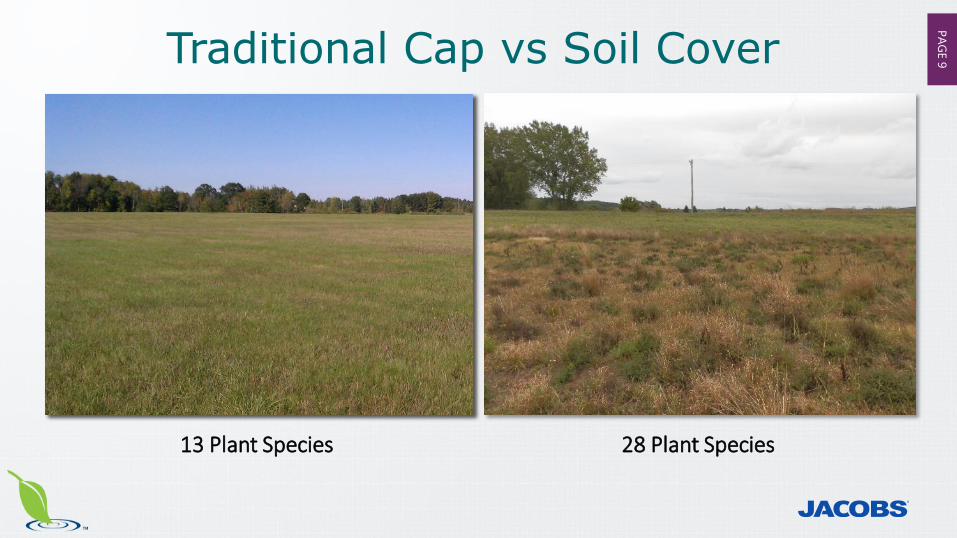
13 Plant Species 28 Plant Species
Traditional Cap vs Soil Cover
PAGE 10
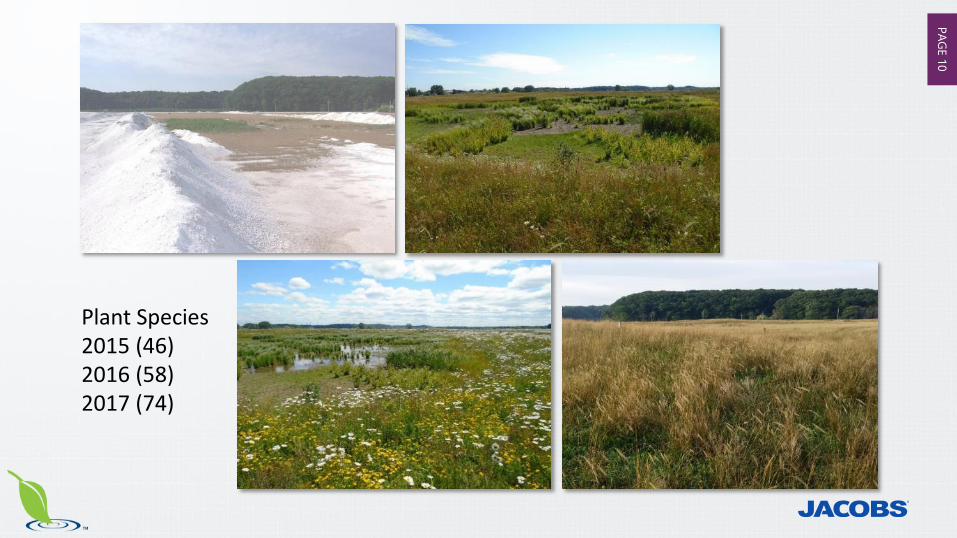
Plant Species2015 (46)2016 (58)2017 (74)
PAGE 11
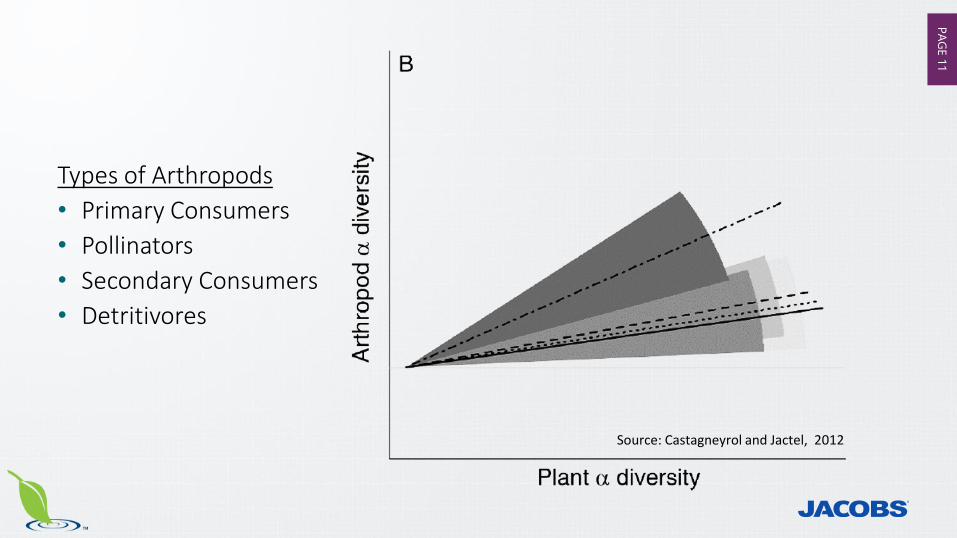
Types of Arthropods• Primary Consumers• Pollinators• Secondary Consumers• Detritivores
Source: Castagneyrol and Jactel, 2012
PAGE 12
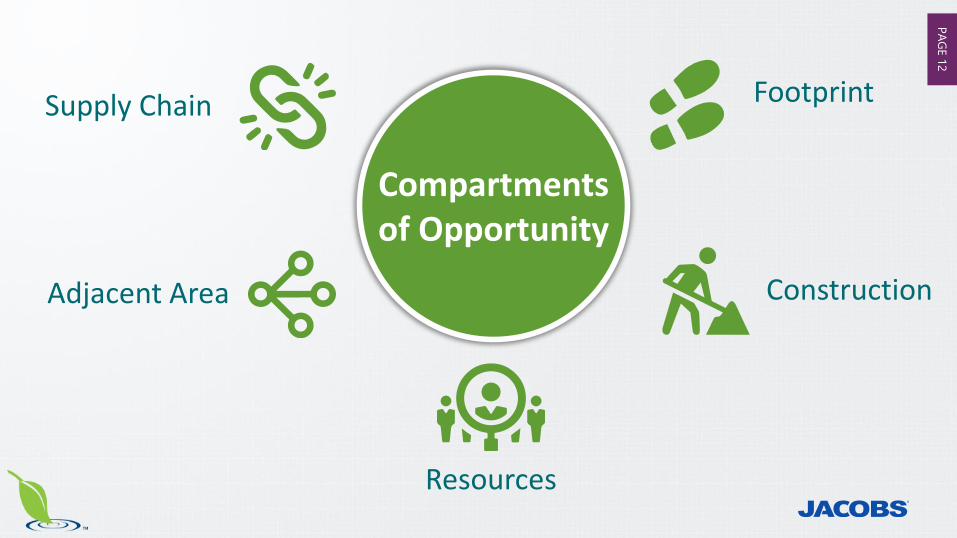
Construction
Resources
Adjacent Area
Supply Chain
Compartmentsof Opportunity
Footprint
PAGE 13Challenges
EcologyRegulatory approval of alternative closuresConcerned stakeholders Successful implementation of innovative/nonconventional designs
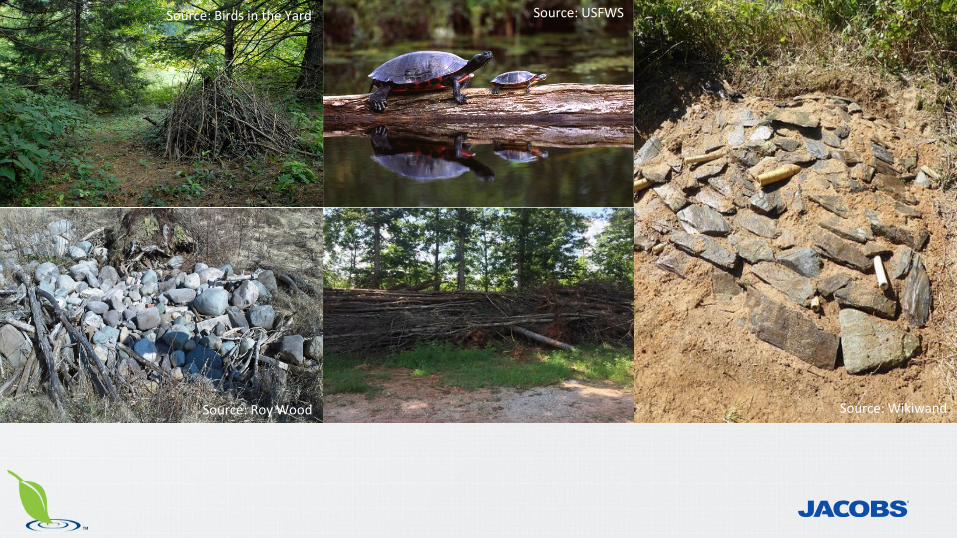
PAGE 14Source: Birds in the Yard
Source: WikiwandSource: Roy Wood
Source: USFWS
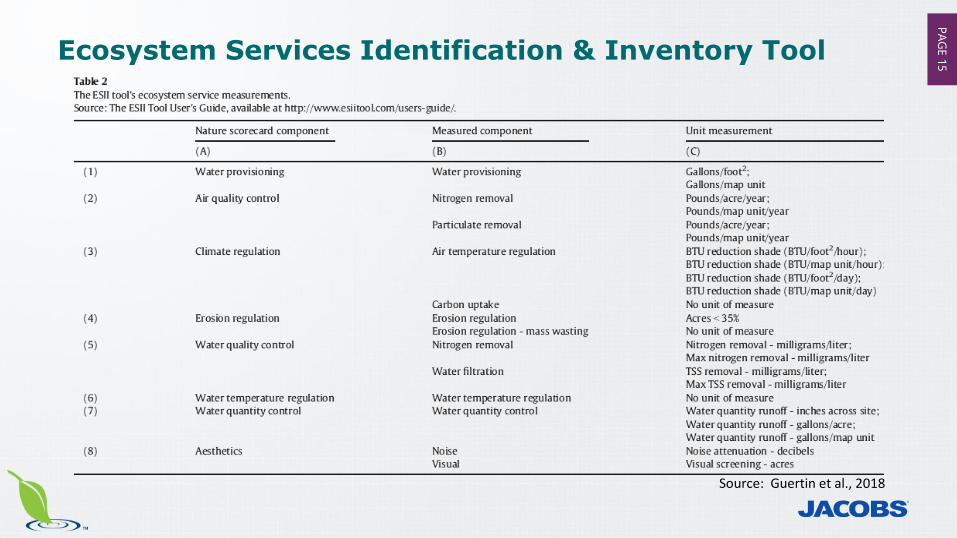
PAGE 15
Source: Guertin et al., 2018
Ecosystem Services Identification & Inventory Tool
PAGE 16
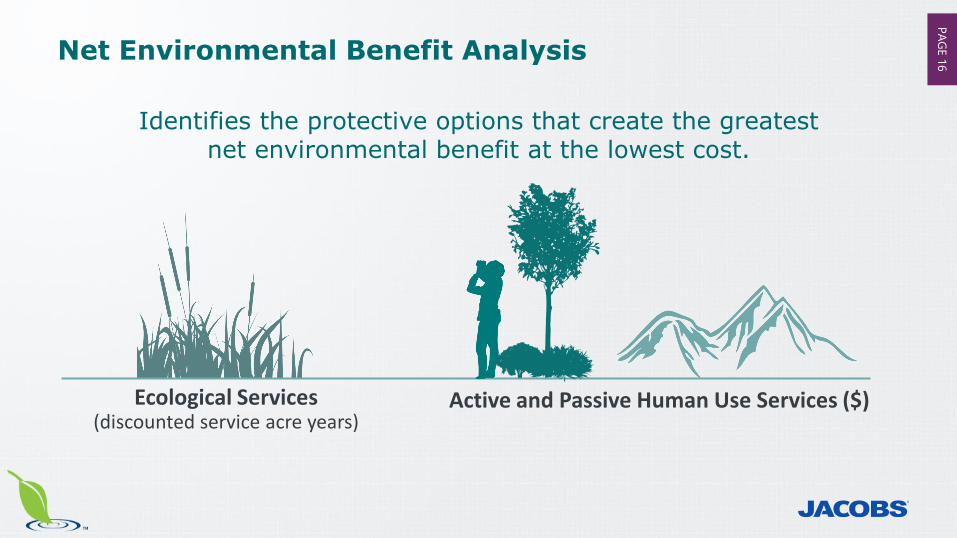
Active and Passive Human Use Services ($)
Identifies the protective options that create the greatest net environmental benefit at the lowest cost.
Ecological Services(discounted service acre years)
Net Environmental Benefit Analysis
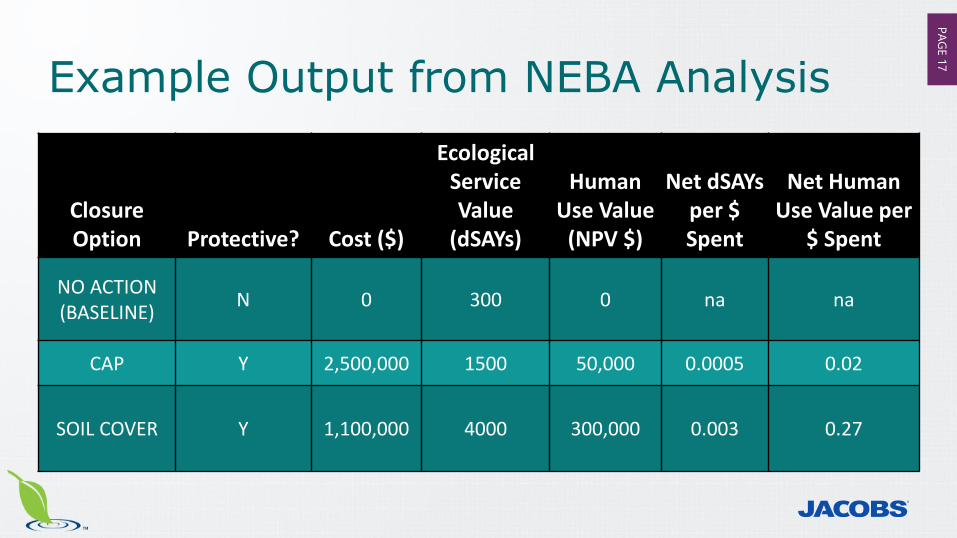
PAGE 17
Closure Option Protective? Cost ($)
Ecological Service Value
(dSAYs)
Human Use Value
(NPV $)
Net dSAYsper $ Spent
Net Human Use Value per
$ Spent
NO ACTION (BASELINE) N 0 300 0 na na
CAP Y 2,500,000 1500 50,000 0.0005 0.02
SOIL COVER Y 1,100,000 4000 300,000 0.003 0.27
Example Output from NEBA Analysis
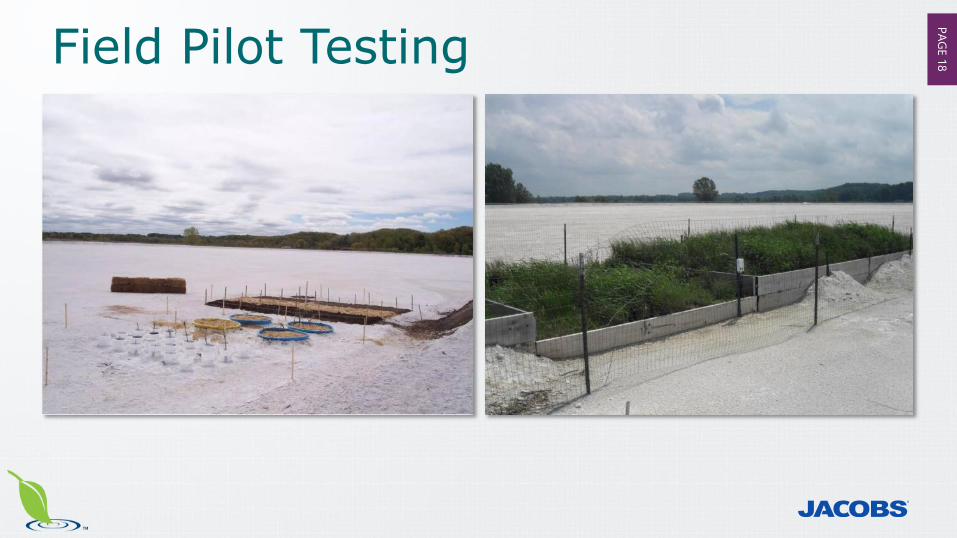
PAGE 18Field Pilot Testing
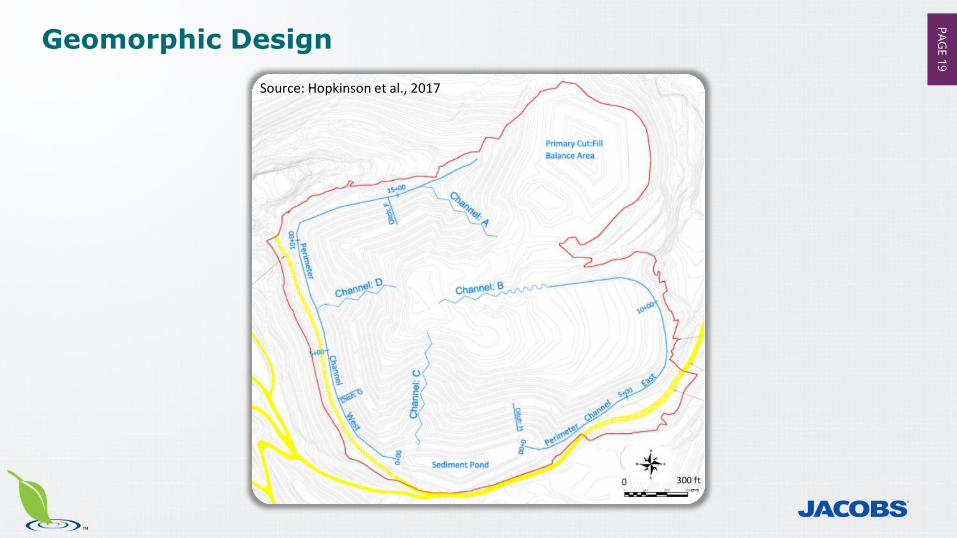
PAGE 19
Geomorphic DesignSource: Hopkinson et al., 2017
PAGE 20
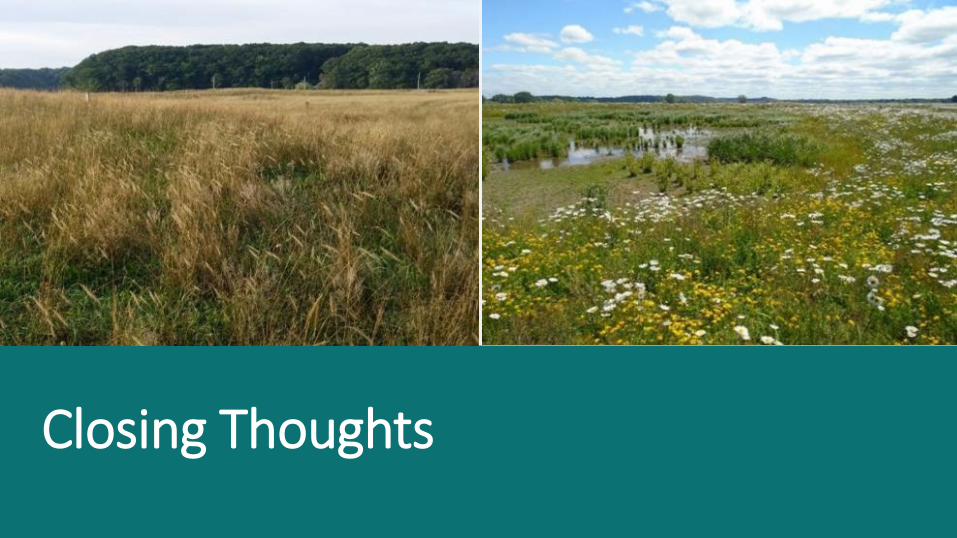
Closing Thoughts