Embed Size (px)
Citation preview

California State University, San Bernardino California State University, San Bernardino
CSUSB ScholarWorks CSUSB ScholarWorks
Electronic Theses, Projects, and Dissertations Office of Graduate Studies
5-2021
POOR ACADEMIC PERFORMANCE CAUSED BY SOCIAL ANXIETY POOR ACADEMIC PERFORMANCE CAUSED BY SOCIAL ANXIETY
Erin Tayag Cal State University - San Bernardino
Leea Gonzales Cal State University - San Bernardino
Follow this and additional works at: https://scholarworks.lib.csusb.edu/etd
Part of the Social Work Commons
Recommended Citation Recommended Citation Tayag, Erin and Gonzales, Leea, "POOR ACADEMIC PERFORMANCE CAUSED BY SOCIAL ANXIETY" (2021). Electronic Theses, Projects, and Dissertations. 1229. https://scholarworks.lib.csusb.edu/etd/1229
This Project is brought to you for free and open access by the Office of Graduate Studies at CSUSB ScholarWorks. It has been accepted for inclusion in Electronic Theses, Projects, and Dissertations by an authorized administrator of CSUSB ScholarWorks. For more information, please contact [email protected].

POOR ACADEMIC PERFORMANCE
CAUSED BY SOCIAL ANXIETY
A Project
Presented to the
Faculty of
California State University,
San Bernardino
In Partial Fulfillment
of the Requirements for the Degree
Master of Social Work
by
Erin Tayag
Leea Gonzales
May 2021

POOR ACADEMIC PERFORMANCE
CAUSED BY SOCIAL ANXIETY
A Project
Presented to the
Faculty of
California State University,
San Bernardino
by
Erin Tayag
Leea Gonzales
May 2021
Approved by:
Dr. Herbert Shon, Faculty Supervisor, Social Work
Dr. Armando Barragán, M.S.W. Research Coordinator

© 2021 Erin Tayag and Leea Gonzales

iii
ABSTRACT
Social anxiety can have consequential effects on college students’
academic performance. Many students’ college experiences will involve some
levels of anxiety. However, social anxiety is very distinct from natural anxiety.
Considering the effects of social anxiety in a college setting, there are students
whose grades can decrease due to non-performance in specific class activities or
unfortunately discontinuing school. This research project desired to identify if
social anxiety indeed affects college students’ academic performance. This study
utilized a quantitative design by providing existing social anxiety scales to
students through email and social media platforms. Within this design, three
analyses were used: Independent samples t-test, One-Way ANOVA, and
Pearson r Correlation Coefficient. The findings of these analyses did not support
the hypothesis of this study, however results showed that in the sample more
college students do not experience problems with social anxiety while in college
and there is no correlation between college students’ GPA and social anxiety.
Limitations of the study and suggestions for future research are discussed.

iv
ACKNOWLEDGEMENTS
I would like to acknowledge my research partner, Leea Gonzales, for
being there every step of the way to finish this research. Your friendship,
kindness, and contributions have been very helpful and greatly appreciated
There were many nights where we thought we would not be able to see the light
at the end of the tunnel, but I am immensely proud of us for being able to
motivate and push each other to finish the last few months of our program strong.
Thank you to my parents for all their love, patience, and understanding to help
me get through this challenging last two years. Without your support, I would not
be the person I am proud to be today. Lastly, thank you to the School of Social
Work for making this research possible and a special thank you to Dr. Shon for
assisting us and supervising our research project. -Erin Tayag
I would like to acknowledge my research partner, Erin Tayag, for being
there throughout this journey. Not only was Erin my research partner, but she is
my friend, and I wouldn’t have been able to get through this program without her.
Thank you, Erin, for all of your hard work and commitment to working on this
study with me! I would also like to acknowledge my entire cohort for all of the
support throughout graduate school. Thank you to my research advisor Dr. Shon
for guiding Erin and I throughout this study. Lastly, I would like to thank my
parents, grandparents, siblings, my two aunts, my cousin and my boyfriend for
being my main support system and helping me get through this journey against
all odds.
-Leea Gonzales

v
DEDICATION
This research study is dedicated to all the college students who have been
impacted or are currently facing struggles with social anxiety. We would like to
dedicate this to every individual who had to adjust to being a student through
virtual platforms. Being a student and learning remotely has presented a lot of
challenges but nonetheless we commend you all for persevering and being
resilient despite the barriers that were faced. Congratulations to the class of 2020
and 2021 for all their hard work, dedication, and tenacity to push through despite
the circumstances and we wish everyone luck on their future endeavors.
-Erin Tayag and Leea Gonzales

vi
TABLE OF CONTENT
ABSTRACT .......................................................................................................... iii
LIST OF TABLES ............................................................................................... viii
CHAPTER ONE: INTRODUCTION ...................................................................... 1
CHAPTER TWO: LITERATURE REVIEW ............................................................ 5
College Students Who Experience Social Anxiety ..................................... 5
Features of Social Anxiety .............................................................. 5
The Influence of Substance Use ..................................................... 7
Cannabis Use.................................................................................. 7
The Outcome of Academic Performance ........................................ 9
Theories Guiding Conceptualization ........................................................ 12
CHAPTER THREE: METHODS ......................................................................... 15
Introduction .............................................................................................. 15
Study Design ........................................................................................... 15
Sampling ....................................................................................... 16
Data Collection and Instruments .............................................................. 17
Procedures .............................................................................................. 18
Protection of Human Subjects ................................................................. 19
Data Analysis ........................................................................................... 19
Summary ................................................................................................. 20
CHAPTER FOUR: RESULTS ............................................................................. 21
Introduction .............................................................................................. 21
Demographics .......................................................................................... 21
Findings of Social Anxiety ........................................................................ 24

vii
Presentation of Findings .......................................................................... 27
Engaged in Services ................................................................................ 29
Outcome of Services................................................................................ 32
Conclusion ............................................................................................... 33
CHAPTER FIVE: DISCUSSION ......................................................................... 34
Introduction .............................................................................................. 34
Discussion ............................................................................................... 34
Limitations ................................................................................................ 37
Implications for Social Work Practice and Policy ..................................... 38
Conclusion ............................................................................................... 39
APPENDIX A: INFORMED CONSENT .............................................................. 40
APPENDIX B: QUESTIONNAIRE ...................................................................... 43
APPENDIX C: INSTITUTIONAL REVIEW BOARD APPROVAL LETTER ......... 54
REFERENCES ................................................................................................... 57
viii
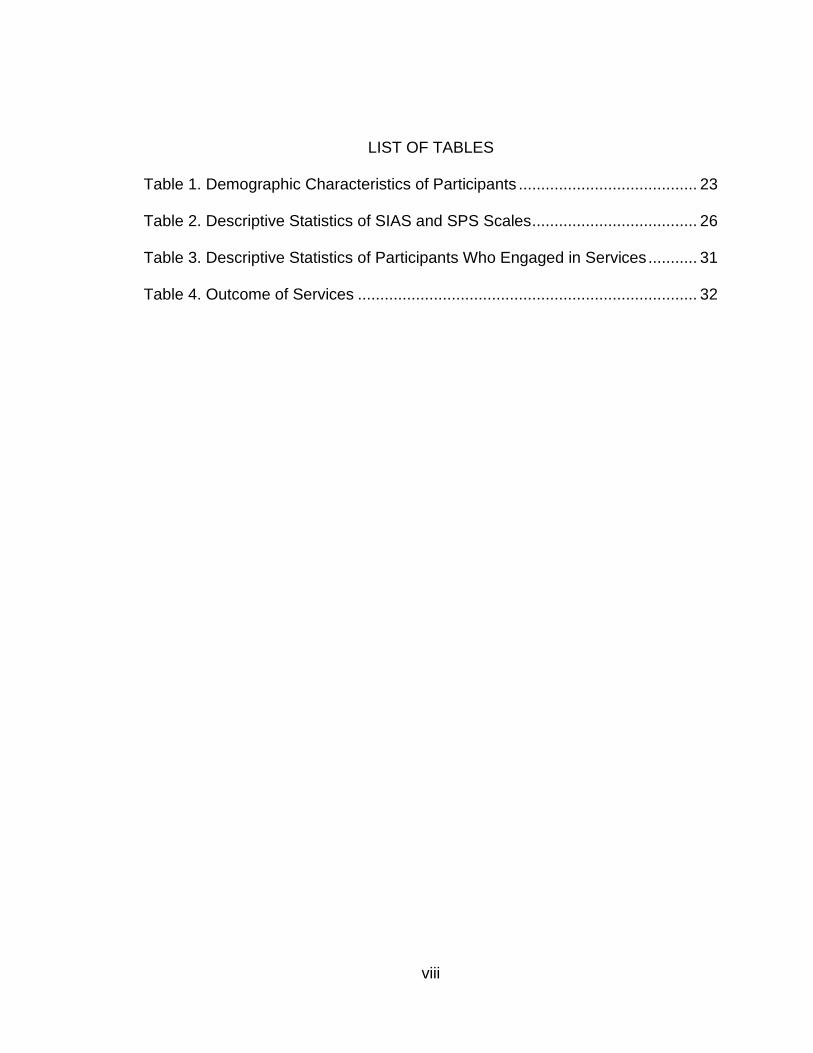
LIST OF TABLES
Table 1. Demographic Characteristics of Participants ........................................ 23
Table 2. Descriptive Statistics of SIAS and SPS Scales ..................................... 26
Table 3. Descriptive Statistics of Participants Who Engaged in Services ........... 31
Table 4. Outcome of Services ............................................................................ 32

1
CHAPTER ONE:
INTRODUCTION
Problem Formulation
Social anxiety amongst college students continues to increase, causing
difficulty with social skills as well as academic performance. It can be defined as
extreme distress and/or avoidance of situations in which the individual fears
criticism or embarrassment (Strahan, 2003). Undergraduate and graduate
students are unaware that social anxiety is significantly high in the college
population. There are some differences in cognitions and physiological
responses between nonclinical participants with more social anxiety symptoms
than those students who are diagnosed with social phobia (anxiety) (Strahan,
2003).
Entry into college is an exciting, eventful, and life-altering experience.
However, for those socially anxious, entry into college may be dissatisfying.
There are 19%-33% of undergraduates who have experienced high levels of
social anxiety that have reported symptoms (Campbell et al., 2016). In another
study, 91% of a sample with social phobia reported interference with their
academic performance (Strahan, 2003). Considering these different findings, it
shows that social anxiety is a rising social issue.
Studying the effects of academic performance due to high levels of social
anxiety can cause consequences on both a micro and macro level. At a micro

2
level, one common problem amongst college students who experience social
anxiety is that they invest in heavy substance use consumption (Villarosa et al.,
2014). These findings can help discover preventative strategies to help assist
those students who feel a sense of security when consuming alcohol or relying
on another substance such as cannabis. Another impactful strategy that can be
helpful on a micro level is discovering how students have generally dealt with
their social anxiety and what methods have helped them cope with their specific
symptoms. Solutions to issues should not only be surface level since
circumstances can be unique and the answers are not catered to fit each
individual's needs. This study will further assess what college students
individually need to thrive in their environment and what can help them alleviate
social anxiety in their everyday activities of living to enhance their quality of life.
On a macro level, a common consequence of students who experience
social anxiety is the need for services but the lack of knowledge behind receiving
the help they need. College campuses provide mental health services to their
students but there continues to be a misconception on the type of services
actually being provided (Michaels et al., 2015). The result of the ineffective use of
mental health services may lead to ongoing barriers posed by social anxiety and
poor academic functioning. Social workers raising awareness within campuses
on how to utilize these resources and promote wellness between personal and
academic functioning will potentially help the retention of student success and
lessen complications managing social anxiety (Michaels et al., 2015). This study

3
can aid in pushing social workers to advocate and challenge current practices
and implement new policies to enhance the needs of the population.
College students who face mental health issues are part of a growing
public health concern (Kenney et al., 2018). Social workers help contribute
towards the success of an individual to thrive in an academic setting. Currently,
there are social workers who practice at school districts and college campuses to
provide support or intervene in various ways that students may need help in
certain areas. This could impact current policies set into place by the University
by the need to implement, enhance, and provide additional ways to serve the
population based on the increased need for mental health services. Social
workers are trained to provide professional mental health and counseling
services (Alvarado et al., 2003). Social anxiety is a mental health disorder;
therefore, it requires the attention of social workers.
The findings from this study can contribute to social work practice because
it will provide further clarification and insight as to how the presence of social
anxiety can impact an individual’s life. Social workers will be able to use these
findings to understand how high levels of social anxiety may be detrimental to the
overall functioning of an individual in a college setting and potentially inhibit an
individual to academically thrive. The presence of social anxiety has been found
to correlate with lower quality of life, discontent, and frustrations with
achievement and performance (Sudir et al., 2012). Based on the findings, there
will be a grasp of how a mental health disorder can present as a challenge.

4
This study will assess what can be done in order to meet college student’s
needs to enhance their academic performance while living with social anxiety.
This study can give an opportunity to figure out the disconnect that college
students have to be successful in their academic and social environment. This
information is helpful and can help prevent students from dropping out by utilizing
services and receiving additional support that they may need in order to be
successful in their academic careers while living with social anxiety. Therefore,
the research question of this study is: How does social anxiety impact academic
performance in college students?

5
CHAPTER TWO:
LITERATURE REVIEW
College Students Who Experience Social Anxiety
Engagement and involvement in social and academic activities in a
college setting are key to successful academic achievement; however, the
symptoms of social anxiety can hinder this experience in college (Brook &
Willoughby, 2015). Brook and Willoughby (2015), whose study was more recent,
found as high as a 33% rate but no lower than 10% rate of social anxiety in
college students compared to 7-13% in the general population. There have been
various studies analyzing the effects of social anxiety but not many have tied it to
academic performance and achievement. This literature will provide a clear
understanding and justification of the proposed study. It will address how social
anxiety, influences of substance use, and the outcome of academic performance
correlates with one another.
Features of Social Anxiety
The requirement of forming new social networks in the college setting
causes some social anxiety and difficulty. However, for some, the levels of social
anxiety are severely high that these individuals experience greater loneliness and
distress, have more difficulty interacting with others, and partake in avoidant
strategies, which then interferes with their learning (Campbell, Bierman &
Molenaar, 2016). Additionally, college students who are socially anxious tend to
6
evaluate themselves negatively in social situations (Campbell et al., 2016).
College students tend to have a high frequency of negative self-statements,
negatively criticizing the quality of their social performance, and noticing their
“wrongs” rather than their “rights” in social situations (Purdon et al., 2001). They
are constantly thinking of how others are evaluating them, and “engaging in
excessive self-monitoring of their presentation to others” (Purdon et al., 2001).
Although there have been high rates of social anxiety amongst the college
population, there also has been evidence of positive results for those college
students who pursued mental health services for their social anxiety.
Coming from a college students’ perspective, an individual’s self-esteem
can go through negative and positive stages. It can be understood how social
anxiety and self-esteem correlate due to the fact that an individual with a social
anxiety disorder is fearful of acting in an embarrassing or humiliating way (Weiss,
2013). An average college student, without a diagnosis of social anxiety disorder,
has a natural instinct of wondering how they presented an assignment or project
to their fellow classmates. In turn, if given positive feedback, the students’ self-
esteem will rise.
A main feature of social anxiety is the fear of being negatively evaluated
however, social anxiety also includes the fear of positive evaluation as well
(Weiss, 2013). Connecting the fear of positive and negative evaluation of others,
one would not normally think that perfectionism plays a role in social anxiety. In a
hierarchical relationship between perfectionism and social anxiety, it’s been
found that negative social feedback and rumination are associated with

7
perfectionism and perfectionistic self-representation (Weiss, 2013, p. 15). The
need to be represented socially perfect aims to avoid interpersonal injuries,
mistreatment, or even humiliation (Weiss, 2013, p. 15).
It is usually someone’s best interest to convey certain types of
impressions in the presence of others (Schlenker & Leary, 1982). Although all
students want to make a virtuous impression in front of their professors,
classmates, or even other authority figures, social anxiety will and can occur in
anyone. It is important for universities and community colleges to implement
strategies to engage their socially anxious students in class activities.
The Influence of Substance Use
Substance use behavior is a predictor of social anxiety. Two common
substances often used by college students are alcohol and cannabis. There are
various studies with connotations that increased substance use results in
increased social anxiety. Findings showed that social anxiety was more prevalent
for unaccompanied cannabis users compared to those who use in a social setting
(Buckner et al., 2016).
Cannabis Use
Cannabis use is more common to socially anxious individuals who use
alone, there are other analyses that show the influence of peers and parents that
claims the opposite. Peer and parent perception play a role in socially anxious
individuals having a higher rate of cannabis use (Foster et al., 2016). These
individuals are more inclined to have participation in cannabis when given

8
permission, which makes using more socially acceptable. Social and
environmental factors contribute to the frequent use of cannabis
(Foster et al., 2016). These findings show that increased social anxiety has
association to higher cannabis use (Foster et al., 2016).
When determining the impact social anxiety has with cannabis use,
individuals with social anxiety are more likely to encounter cannabis use issues
(Ecker et al., 2014). These findings portrayed that college students with social
anxiety feel more inclined and influenced to use cannabis (Ecker et al.,
2014). Individuals with social anxiety base their feelings about the current
situation that causes them anxiety to signify their performance. Therefore, when
an individual has feelings of anxiousness, they automatically assume the worst
outcome. To make a situation more bearable, these individuals engage in
substance use to mask their social anxiety.
Individuals who experienced higher levels of social anxiety are more
susceptible to engage in alcohol use. Social anxiety has an impact on negative
consequences such as alcohol consumption in mass amounts and harmful
drinking (Villarosa et al., 2014). College students with social anxiety engage in
drinking as a motive to enhance being accepted by their peers and a mask to
hide their social anxiety. Individuals who consume alcohol experience irrational
fear, negative evaluation, and distress when put in a social setting (Villarosa et
al., 2014).
9
Alcohol Use
Anxiety is linked to alcohol use, alcohol dependency, and alcohol
consequences (Kenney et al., 2018). The influences of these individuals are
internal influences (e.g. their own personal thoughts, beliefs, and perceptions)
and external influences (e.g. fear of others’ thoughts, beliefs, perceptions, and
negative evaluations of them). Alcohol consumption is prevalent for college
students as it can be used as a coping mechanism (Chimwemwe et al., 2017).
College students with social anxiety experience high distress and heightened
levels of negative affect which creates difficulty in avoiding drinking outcomes as
drinking is used as a way to escape their negative thoughts, emotions, and
underlying tension (Kenney et al., 2018). Drinking is also deemed as socially
acceptable and the presence of alcohol is involved in many after school events.
College students drink to reduce anxiety which increases the likelihood of
alcoholic intentions (Scalzo & Martinez, 2017). The various factors that can
influence alcohol use are the college environment, psychological distress, and
problems with academics (Chimwemwe et al., 2017).
The Outcome of Academic Performance
Anxiety has an effect on college students’ academic performance
(Strahan, 2003). College students are susceptible to facing social pressures
(Schry, Roberson-Nay, & White, 2012). Various forms of anxiety, such as
generalized anxiety or social anxiety, often go undiagnosed and untreated within
the college population. These cases of students being undiagnosed and
10
untreated negatively conflicts the adjustment that students with social anxiety will
need in order to be academically successful. Although academic success was
measured by grade point average (GPA) or academic achievement in the past, it
is different today. Measuring academic success must include a holistic approach
as a student can come from a very diverse, complicated and interconnected
background. Considering the importance of how academic success should be
measured, there has been a high percentage found of those who have had
difficulty academically adjusting in college due to their social anxiety. A high rate
of 91% of a sample reported interference with their academic adjustment
(Strahan, 2003). Highlighting that this finding was collected over ten years ago, a
high rate of college students are still experiencing difficulty or interference with
adjusting to their academic life.
Another negative consequence in a variety of research sources is the high
rate of students who drop out of school due to their social anxiety. Particularly
difficult social activities such as public speaking, giving oral reports, asking
questions, and participating in extracurricular activities/events have impaired
female student’s social interaction leading to avoidant behaviors and increased
rates of drop out (Baptista et al., 2012). The normal assignments that are given
to college students cause those who are severely socially anxious to socially
withdraw from their professors and peers. When a social interaction or social
situation arises, those who are socially anxious stray away from these
interactions (Campbell, Bierman & Molenaar, 2016). They do this by remaining
focused on themselves and their immediate feelings by detaching themselves

11
from associating and subconsciously disregarding the feelings of others
(Campbell, Bierman & Molenaar, 2016). The more frequent these students
disengage themselves in social interactions, the more it becomes a pattern which
will then lead the students to believing that they are not adjusting to college life
and eventually are more inclined to drop out.
Since college students with social anxiety fear receiving negative
evaluations from others, this can lead them to avoid situations that will put them
through any potential distress, therefore, potentially putting pressure on
themselves to overcompensate (Purdon et al., 2001). Social anxiety derives from
the need to maintain high standard social interactions and performance, so these
individuals try to maintain their scores in academia to diminish negative
evaluations (Purdon et al., 2001).
There is a different perspective in relation to social anxiety and academic
success. Constantly believing negative assumptions can take a toll on an
individual’s academic performance due to the fear of being perceived as
incompetent or incapable. This can potentially push them in the direction to do
well in academics by excessive self-monitoring. Granted that, there have been
studies that said that social anxiety has no correlation to grade point average and
academic success (Strahan, 2003).

12
Theories Guiding Conceptualization
Two theories used to guide and conceptualize this study will be Ivan
Pavlov’s classical conditioning theory and Albert Bandura’s social learning
theory. The classical conditioning model (also known as respondent or Pavlovian
conditioning) is a model that presents the understanding of when a person learns
to respond to new stimulus that does not naturally cause a response (Zastrow,
Kirst-Ashman, & Hessenauer, 2019). The new stimulus is referred to as a
conditioned or learned stimulus. There is also an unconditioned stimulus, which
is just a natural stimulus. The new and natural stimulus pair together causing a
natural response resulting in an individual learning how to connect a new
stimulus with a specific response. An important behavioral technique that
connects to the study is the term systematic desensitization which is “a
procedure in which a person with a phobia practices relaxation while imagining
scenes of the fear-producing stimulus” (Zastrow, Kirst-Ashman, & Hessenauer,
2019, p. 176).
This model can be used to guide this study because social anxiety is a
type of phobia that an individual can learn to manage and cope with. An
unconditioned stimulus in this study could be the humiliating, embarrassing, or
excessive fearful situation or experience, while the conditioned stimulus can be a
group of people such as a classroom (Lissek et al., 2008). The conditioned
stimulus is a group of people since individuals learns that this is what causes
their social anxiety. The unconditioned stimulus is the embarrassing or
humiliating experience, which, is a natural response to a group of people.
13
Systematic desensitization can be used in study by practicing relaxation
techniques with those who have a social phobia.
The social learning theory proposes that an individual’s behavior can be
learned and can be changed. Social learning can occur through modeling
behaviors, imitation, observation of emotions, attitudes, and reactions. Social
learning theory emphasizes the important contributions of observational learning,
role play, symbolic representation, and self-regulation which implies how an
individual changes their behavior (Bandura, 1977). Anticipating reinforcement
aids in strengthening retention after observation. Reinforcement helps more
when individuals are informed but the reward does not directly influence their
grasp (Bandura, 1977). It is assumed that behavior is learned by influences of
possible consequences from performing certain actions, and by indirect
reinforcement and self-reinforcement (Bandura, 1977).
This theory can be used to guide this study since many factors of social
anxiety are rooted based on the fear of self-perception and performance.
Individuals who have social anxiety have created a consensus and conception of
who they are based on feedback through social settings. These individuals
perceive themselves based on others observation and evaluation of them, which
negatively impacts their mental health and causes them to avoid these high
stress situations or compensate in self destructing ways (e.g. unhealthy coping
mechanisms). Incorporating social learning theory into this study will guide the
research in understanding why college students developed anxiety in a social
setting or situation (Brooks et al., 2008). This theory will guide to help and seek
14
what environmental influences and/or life experiences triggered the onset and
ongoing symptoms of social anxiety.

15
CHAPTER THREE:
METHODS
Introduction
This particular study used a quantitative methodology to best evaluate the
problem of how social anxiety impacted academic performance within the college
population. Using a quantitative design worked best to test the hypothesis and
determine the outcomes of the results that helped draw a generalizable
conclusion. A quantitative design was utilized to operationalize the variables
which helped determine the variable’s attributes. The process of operationalizing
the concept helped the variables to be easily observed and measured.
Quantitative design helped determine internal validity, external validity, the
reliability of the measurements and research when using a measurement
procedural approach.
Study Design
Using quantitative design was beneficial for the large amount of data
collected that was condensed into numbers. Using questionnaires helped
distinguish which participants were diagnosed with social anxiety disorder and
which specific symptoms of social anxiety were experienced since it was found
that there are many college students who were undiagnosed with this disorder
and had different experiences. Although most college students may have

16
experienced similar symptoms of social anxiety, each participant was unique in
their own way. The data collected was from participants’ answers that were then
coded into numerical values that helped determine the common themes and
patterns within the study.
Due to most quantitative studies being explanatory, this study will also be
explanatory. This was a strength to the research since analyzing data means to
identify, describe and explain the sequence of the pattern. Quantitative and
explanatory designs aimed to test the hypothesis through measuring the
variables’ relationship and statistically analyzing the data.
Sampling
The sample for this study was obtained through advertising on social
media. The sample consisted of college students who were of different age,
gender, ethnicity, and religious affiliations. The only factor that was not applicable
to every college student was occupational status because it was common for
college students to not be employed while in school. The number of the sample
consisted of 213 college students who have completed at least their bachelor’s
degree from any university. The data was directly collected from the students in
the sample through them filling out a questionnaire. While the students were the
study’s sampling units, their experiences with social anxiety were the elements.
The sampling method used in this study was based on probability. Every
college student’s response shared more similarities than differences between
their personal experience with social anxiety. In order to make the sampling
process more efficient and easier, this study narrowed down the random

17
sampling strategy to stratified random sampling. Stratified random sampling
worked in this study because the participants in this study all had at least a
bachelor's degree.
Data Collection and Instruments
The independent variable (IV) is the presence of social anxiety and the
dependent variable (DV) is the college students’ academic performance. A data
source that was used to measure the independent variable of social anxiety was
determined by using a Social Interaction Anxiety Scale (SIAS) and a Social
Phobia Scale (SPS). The Social Interaction Anxiety Scale (SIAS) is a self-report
scale that measures or assesses social interactional anxiety which is measuring
how distressed an individual is when conversing with friends, strangers, or any
type of authority figures (Brown et al., 1997). The Social Interaction Anxiety Scale
(SIAS) questionnaire consists of 20 items where depending on the response the
answer can be scored from a zero to four. If the total score is higher than a 43 it
will indicate that the individual has traditional social anxiety.
The Social Phobia Scale (SPS) assesses and measures the anxiety that
an individual experiences as they are being observed or anticipating being
observed by others as well as when they are undertaking activities in the
presence of others (Brown et al., 1997). The Social Phobia Scale (SPS)
questionnaire consists of 20-items that answers a score between zero to four.
Based on the responses given and are totaled up, a raw score will range from
18
zero to 80. The higher the score the higher the presence or severity of the
anxiety.
The best data source that was used to measure the independent
variable was collecting self-reports from each participant. In order to do this, we
created a questionnaire combining the SIAS and SPS scales that measured and
assessed the independent variable. Self-reports included the participants
reporting their estimated cumulative GPA. Given that these individuals are
socially anxious, confidential questionnaires were created in order to receive the
data without provoking more anxiety.
Procedures
The procedure began by providing the Social Interaction Anxiety Scale
(SIAS) and the Social Phobia Scale (SPS) to participants who have at least
obtained a bachelor’s degree. These research tools consisted of self-reported
questionnaires. Students received these questionnaires through their school
emails and through an anonymous questionnaire link. Within the school email,
the student researchers provided a brief description of the purpose of the study.
The participants were provided with informed consent before they were able to
proceed and answer the questionnaire. Usually, the data would be collected on
campus, but due to national circumstances the data was collected electronically
to the researchers. After the data collection, the researchers each had access to
the data and proceeded with the next necessary step which was done by

19
exporting the data and findings into the statistical software program called
Statistical Package for the Social Sciences (SPSS).
Protection of Human Subjects
This study adhered to the privacy and confidentiality requirements in
social work research. The confidentiality and anonymity of our participants were
protected from the beginning when the researchers abided and worked by some
of the main principles of protecting human subjects in research which meant
respect for persons, beneficence, and justice. Researching and keeping these
principles apparent helped the researchers complete this study without biases
arising. Researchers kept their participants protected by providing informed
consent, emphasizing that this is a voluntary study, and that they were welcomed
to discontinue their participation at any time without any consequences.
Participants were also allowed to skip a question if they were uncomfortable.
Researchers followed HIPAA guidelines and did not share any obtained
information with anyone as well as with each other through email or any form of
risky technical systems.
Data Analysis
The presence of social anxiety (IV) and the college student’s academic
performance (DV) was statistically analyzed using a descriptive statistical
software program (SPSS). Variables that were considered and coded was the

20
participants current age, gender, ethnicity, religious affiliation, and the year they
obtained at least their bachelor’s degree and their current level of education.
Descriptive statistics helped organize the variables which determined the
percentage breakdown. Level of measurement of each variable gathered had
different attributes. Age is a ratio measurement, gender is a nominal
measurement, ethnicity is considered a nominal measurement, religious
affiliation is a nominal measurement, level of education is an ordinal
measurement, and having obtained a bachelor’s degree is a ratio measurement.
After analyzing the data, descriptive measures of the mean, median, and mode
(central tendency) determined the important information applicable to the study.
Thus, the evaluation of the hypothesis was concluded.
Summary
The method of the study was to further investigate the research. Based on
the findings and data obtained, the research problem and hypothesis were able
to be tested. The outcomes were then evaluated to conclude a conclusion from
the results. Through the process of identifying a specific target population and
using various instruments, the researchers were able to gather relevant data that
was pertinent to the study.
21
CHAPTER FOUR:
RESULTS
Introduction
In this chapter, the demographics and characteristics of college students
whose academic performance was impacted by social anxiety will be presented.
The demographics of the participants, their level of education, their academic
performance, students’ engagement in mental health services and social anxiety
scores will be presented as well. The researchers will also review the data and
explain the findings.
Demographics
In this study, there were a total of 213 participants in this study. Table 1
portrays the demographic characteristics of the participants in this study. Among
the 213 participants, 61% identified as female, 30% identified as male and 1.4%
identified as non-binary. There were various ethnicities of participants, the
highest being 34.3% who identify as Latinx, followed by 29.1% identified as
Asian, 8.9% identified as Caucasian, 4.7% identified as African American, 4.7%
identified as Pacific Islander participants, and 0.5% identified as Native
American. The remainder are 6.1% for two or more races, 2.8% as other or
unknown, and 1.4% who preferred not to answer.
22
There was a wide age range of participants in the study between the ages
of 20-70 years old. From the sample collected, 39.8% were between the ages of
20-25, 20.8% were between the ages 26-31, 18.9% were between the ages 32-
40, 9.9% were between the ages 43-56, and 12.3% were between the ages 57-
70. When asked what religion the participants were affiliated with, there were
46% of the sample who reported that they were practicing Catholicism, 17.8%
reported Christianity, 0.9% reported Buddhism, 0.5% reported Islam, 0.5%
reported Judaism, 3.8% reported other, 18.3% reported none, and 4.2%
preferred not to say what religion they practice.
Additionally, the years of the participants who obtained a bachelor’s
degree are within a 40-year timeframe, beginning in 1971 and ending in 2021.
There were 7.5% who graduated within 1971 to 1981, 9.7% who graduated
within 1982-1993, 4.8% who graduated within 1995-2005, 22.6% who graduated
within 2006-2015, 54.8% who graduated within 2016-2021. When assessing for
the participants current level of education, 53.5% have reported that they have
only obtained a bachelor’s degree, 21.6% reported that they are currently in
graduate school, and 20.7% have completed both degrees. The remaining 4.2%
of the participants did not report their current level of education. Furthermore, the
participants were asked to provide an estimate of their overall undergraduate
Grade Point Average (GPA). There was a wide range of GPAs as well. 3.1%
ranged between 2.0-2.4 GPA, 10% ranged between 2.6-2.9 GPA, 51.6% ranged
between a 3.0-3.5 GPA, 35.3% ranged between 3.6-4.0.

23
Table 1. Demographic Characteristics of Participants
Variable Frequency (N) Percentage (%)
Gender Female 130 61 Male 64 30 Non-binary 3 1.4
Ethnicity Latinx 73 34.3 Asian 62 29.1 Caucasian 19 8.9 African American 10 4.7 Pacific Islander 10 4.7 Native American 1 0.5 Two or more races 13 6.1 Unknown/other 6 2.8 Preferred not to answer 3 1.4
Age 20-25 84 39.8 26-31 44 20.8 32-40 40 18.9 43-56 21 9.9 57-70 26 12.3
Religion Catholicism 98 46.0 Christianity 38 17.8 Islam 1 0.5 Buddhism 2 0.9 Judaism 1 0.5 Other 8 3.8 None 39 18.3 Preferred not to say 9 4.2
Year Obtained Bachelor’s Degree 1971-1981 14 7.5 1982-1993 18 9.7 1995-2005 9 4.8 2006-2015 42 22.6 2016-2021 102 54.8
Grade Point Average (GPA) 2.0-2.4 6 3.1 2.6-2.9 19 10 3.0-3.5 98 51.6 3.6-4.0 67 35.3

24
Findings of Social Anxiety
The participants answered two scales, the social interaction anxiety
(SIAS) scale and the Social Phobia Scale (SPS). Table 2 shows the descriptive
statistics of what the participants scored in both scales, whether they were
professionally diagnosed with social anxiety, whether they experienced problems
with social anxiety while in college, and if social anxiety has played a negative
impact on their academic performance.
For the SIAS scale, 29.8% participants scored between 3-10, 33.4%
scored between 11-21, 21.2% scored between 21-33, 9.09% scored between 34-
41, and 1% scored between 43-49. For the SPS scale, 68.9% of the participants
scored between 0-10, 14.8% scored between 11-21, 10.7% scored between 21-
32, and 3.06% scored between 34-50. When asked if the participants have been
professionally diagnosed with social anxiety, 5.6% reported yes, 85.8% reported
no, and 0.5% preferred not to say. When asked if they were not diagnosed with
social anxiety and asked the chances that the participants may have some
problems pertaining to social anxiety while in college, 31.5% reported a very
good chance, 27.2% reported some chance, 23.5% reported very little chance,
and 9.9% reported no chance at all. Among the participants who answered a
very good chance (31.5%) or some chance (27.2%), the participants were asked
a follow up question to assess the chance of how social anxiety negatively
affected their ability to perform their best in college and earn higher grades. From

25
that, it was found that 20.2% reported a very good chance, 25.45% reported
some chance, 12.7% reported very little chance, 1.4% reported no chance at all.

26
Table 2. Descriptive Statistics of SIAS and SPS Scales
Variable Frequency (N) Percentage (%)
SIAS Scores 3-10 29.8 11-21 33.4 21-33 21.2 34-41 9.09 43-49 1.0
SPS Scores 0-10 68.9 11-21 14.8 21-32 10.7 34-50 3.06
Professionally Diagnosed Yes 12 5.6
No 183 85.9 Preferred Not to Say 1 0.5
Not diagnosed but experienced Social Anxiety Very good chance 67 31.5 Some chance 58 27.2 Very little chance 50 23.5 No chance at all 21 9.9
Chance of Social Anxiety’s Negative Impact Very good chance 43 20.2 Some chance 54 25.45 Very little chance 27 12.7 No chance at all 3 1.4

27
Presentation of Findings
In this study there were three analyses performed for the collected data:
Independent samples t-test, Pearson r correlation test, and One-Way ANOVA.
An independent t-test was conducted to compare females’ and males’
means on the two anxiety scales. This test was also conducted to compare
college students' academic performance in a college environment determining
levels of social anxiety. Regarding the means of females versus males, there
was a significant difference in the scores for the SIAS scale, females (M=19.6,
SD=10.3) and males (M=13.8, SD=8.3). For the SPS scale, females showed
(M=10.0, SD=9.9) and males showed (M=4.4, SD=7.4). There was no significant
difference in scores between males and female’s academic performance;
females (M=3.3, SD=0.44) and males (M=3.3, SD=0.42). Lastly, the values
related to the t-test will be presented. Setting aside gender, there was no
significant difference in scores for the SIAS and the SPS showing a t(191)=-3.85,
p=0.00 for the SIAS and a t(190)=-3.94, p=0.00 for the SPS. These results show
that there were more females than males who experience social anxiety while in
college, although there was no difference in their GPA. It was also shown that
there was no major difference between the scores in each SIAS and SPS.
A Pearson r correlation coefficient test was performed to assess college
students’ estimated GPA and the two anxiety scales to portray if there is a linear
relationship. There was no correlation between GPA and the SIAS (r = -.119, n =
189, p = .104). In addition, there was also no correlation between GPA and the
SPS (r = -.151, n = 188, p = .039]. Overall, the reason for no correlation between
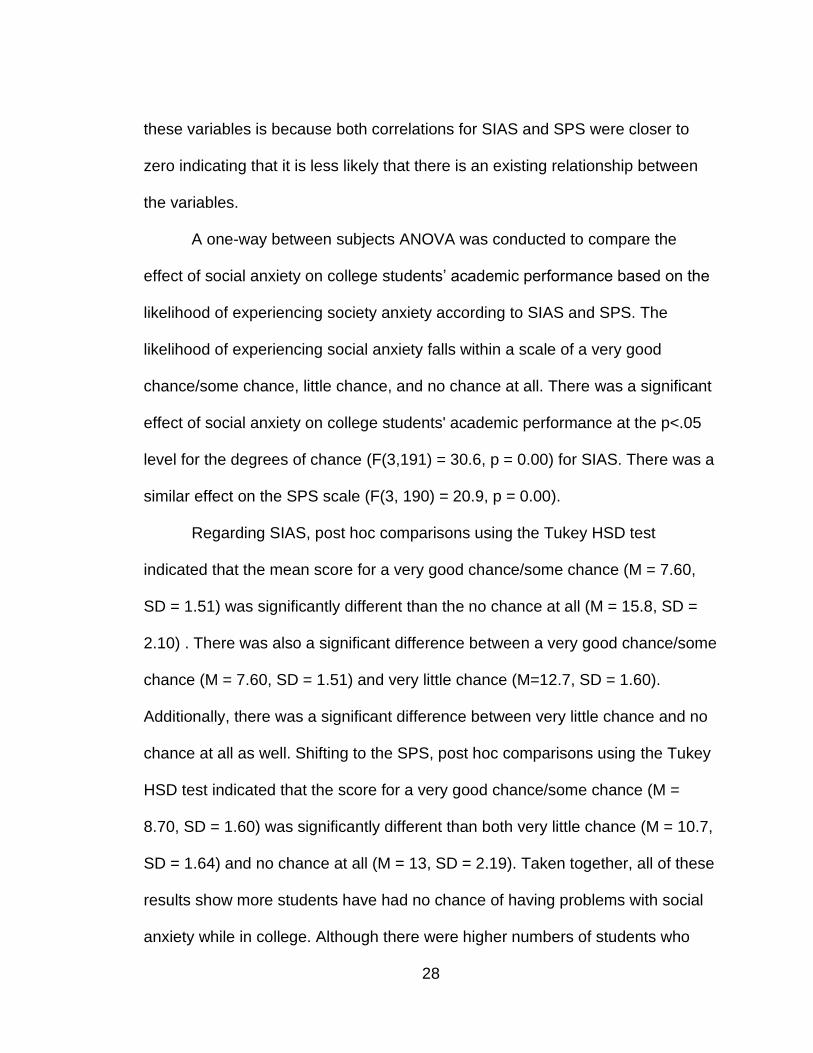
28
these variables is because both correlations for SIAS and SPS were closer to
zero indicating that it is less likely that there is an existing relationship between
the variables.
A one-way between subjects ANOVA was conducted to compare the
effect of social anxiety on college students’ academic performance based on the
likelihood of experiencing society anxiety according to SIAS and SPS. The
likelihood of experiencing social anxiety falls within a scale of a very good
chance/some chance, little chance, and no chance at all. There was a significant
effect of social anxiety on college students' academic performance at the p<.05
level for the degrees of chance (F(3,191) = 30.6, p = 0.00) for SIAS. There was a
similar effect on the SPS scale (F(3, 190) = 20.9, p = 0.00).
Regarding SIAS, post hoc comparisons using the Tukey HSD test
indicated that the mean score for a very good chance/some chance (M = 7.60,
SD = 1.51) was significantly different than the no chance at all (M = 15.8, SD =
2.10) . There was also a significant difference between a very good chance/some
chance (M = 7.60, SD = 1.51) and very little chance (M=12.7, SD = 1.60).
Additionally, there was a significant difference between very little chance and no
chance at all as well. Shifting to the SPS, post hoc comparisons using the Tukey
HSD test indicated that the score for a very good chance/some chance (M =
8.70, SD = 1.60) was significantly different than both very little chance (M = 10.7,
SD = 1.64) and no chance at all (M = 13, SD = 2.19). Taken together, all of these
results show more students have had no chance of having problems with social
anxiety while in college. Although there were higher numbers of students who

29
have no problems with social anxiety while in college, there were very close
numbers of those who showed very little chance of having problems with social
anxiety.
Engaged in Services
Participants in the study were asked whether or not they engaged in
services for experiencing social anxiety while in college. If the participant states
“yes” then they were given extra questions to assess which services they sought
help from. Table 3 shows the descriptive statistics of whether or not the
participants sought for help and which of the 10 services that the participants
engaged in while a student. 83.1% of the participants reported no and 8.9%
reported yes. When asked if they reached out to a psychiatrist, 2.3% reported
yes and 6.1% reported no. When asked if they reached out to a psychologist
4.7% reported yes and 4.7% reported no. When asked if they reached out to a
social worker, 0.9% reported yes and 7.5% reported no. When asked if they
reached out to a marriage and family therapist, 2.8% reported yes and 5.6%
reported no. When asked if they reached out to a college counselor, 4.7%
reported yes and 4.2% reported no. When asked if they reached out to a
professional at their institution (academic advisor, professor/instructor,
supervisor, mentor etc.), 3.8% reported yes and 5.2% reported no. When asked if
they reached out to a religious leader (reverend, priest or clergyperson, etc.),
3.8% reported yes and 5.2% reported no. When asked if they reached out to a

30
family member, 3.8% reported yes and 5.2% reported no. When asked if they
reached out to a friend or classmate, 7.5% reported yes and 1.9% reported no.
When asked if they reached out to a significant other whether it is a boyfriend,
girlfriend, or partner, 4.7% reported yes and 4.7% reported no.

31
Table 3. Descriptive Statistics of Participants Who Engaged in Services
Variable Frequency (N) Percentage (%)
Sought for services Yes 19 9.7 No 177 83.1
Psychiatrist Yes 5 2.3 No 13 6.1
Psychologist Yes 10 4.7 No 10 4.7
Social Worker Yes 2 0.9 No 16 7.5
Marriage and Family Therapist Yes 6 2.8 No 12 5.6
College Counselor Yes 10 4.7 No 9 4.2
Professional in Institution Yes 8 3.8 No 11 5.2
Religious Leader Yes 2 0.9 No 17 8.0
Family Member Yes 8 3.8 No 11 5.2
Friend/Classmate Yes 16 7.5 No 4 1.9
Significant Other Yes 10 4.7 No 10 4.7

32
Outcome of Services
The participants in the study were followed up with a question that asked
overall how helpful the sources they sought out services were for them. Table 4
portrays the descriptive statistics on which of the sources the participants found
out to be helpful. 3.3% reported that it was extremely helpful, 3.3% reported it
was very helpful, 2.3% reported that it was somewhat helpful, 0.5% reported that
it was slightly helpful, and 0.5% reported that it was not helpful at all. Overall, a
significant percentage believed it was helpful to reach out to a source to alleviate
social anxiety.
Table 4. Outcome of Services
Variable Frequency (N) Percentage (%)
Helpfulness Extremely helpful 7 3.3 Very helpful 7 3.3 Somewhat helpful 5 2.3 Slightly helpful 1 0.5
Not at all helpful 1 0.5

33
Conclusion
This chapter addressed the demographics of the participants within this
study, services that participants did or did not engage in, and the significant
findings from the data collection. After reviewing the analyses’ used, findings
showed that there was no significant difference between the two anxiety scales
(SIAS and SPS) used for this study. Additionally, it was found that there was no
relationship between GPA and SIAS or SPS. Lastly, there was a higher
percentage of students’ who did not seek services for social anxiety problems.
34
CHAPTER FIVE:
DISCUSSION
Introduction
This chapter will provide an in-depth overview of the data that has been
collected from the questionnaire regarding the impact of social anxiety on college
students’ academic performance. There will also be evidence provided whether
researchers previous literature found matched this study’s results. Additionally,
this section will expand and discuss the findings of the study, point out the
limitations, and address the implications for social work practice and policy.
Discussion
Through the literature, it was found that the presence of social anxiety is
continuing to increase within college students which, in turn, can create
challenges for students’ academic performance (Strahan, 2003). Due to this, it
has been found in previous studies that social anxiety has the likelihood to pose
extreme distress and/or avoidance for situations that put students in the position
of fear of criticism or even embarrassment (Strahan, 2003). In this study, the
research question aimed to assess: how does social anxiety impact academic
performance in college students? The researchers were curious to see how the
participants involved have experienced struggles with social anxiety, if they
sought out for help, how likely they are to possibly be diagnosed with social

35
anxiety, how all these factors played a role in impacting their overall academic
performance within their University, and what their grade point average (GPA)
was when they graduated. Researchers found it interesting that in this study
there was a high percentage of college students’ who had no problems with
social anxiety while completing a bachelor’s degree, currently in graduate school,
or have completed both degrees.
Within the questionnaire, there were two scales to assess their level of
anxiety utilizing the Social Interaction Anxiety Scale (SIAS) and the Social Phobia
Scale (SPS). For SIAS, a score of 43 or greater indicated that the participant has
social anxiety and for the SPS, the score of 34-42 indicates that the participant
experiences social phobia. Based on the findings of this study, only 1% of the
participants had a positive score indicating that they experience social anxiety
and 3.06% of the participants had a positive score indicating that they experience
social phobia. These results indicate that there were no significant findings of
social anxiety for the college students’ participants. There were 31.5% of
participants who reported that they are not diagnosed with social anxiety but
reported a very good chance that they had problems dealing with in college. This
finding indicates that although there were no significant findings of positive
scores within the SIAS and SPS scale that social anxiety does interfere at a
certain level.
When looking at the participants grade point average (GPA), the highest
percentage of participants who averaged a 3.0 to 3.5 GPA was 51.6%. These
results indicate that the presence of social anxiety does not impact their

36
academic performance. Furthermore, these results mean that there is no
relationship between GPA and the participants scores from SIAS and SPS. The
findings demonstrate that there were no difficulties for students to achieve a
higher-grade point average. In alignment with Weiss’ (2013) study that states that
individuals with social anxiety are fearful of negative social feedback, therefore,
engage in perfectionism and even perfectionistic self-representation, the
researchers interpreted that the participants who reported a high GPA most likely
are unable to recognize the features of social anxiety to admit that it has a
negative effect. In order to avoid negative evaluation, humiliation, and
mistreatment, the researchers believe that the participants are able to use that as
fuel to excel in their academics. Although the overall findings were not consistent
with the literature, the researchers factored in the ethnicities of the sample that
have the possibility of playing a role in the outcome of the findings. Out of the
participants in the study, 34.3% identified themselves as Latinx and 29.1%
identified as Asian. Considering that Latinx and Asian college students are
minorities, the researchers concluded that these participants are dealt with a lot
of pressure to achieve higher whether they are first generation college students
or experience pressures within their home environment to be successful.

37
Limitations
There were various limitations that were found in this study. The study
was performed during a global pandemic therefore there were virtual methods
conducted in order to complete the study. The researchers utilized an online
questionnaire platform, Qualtrics, to create a virtual questionnaire. The
researchers resulted in gathering participants and distributing the questionnaires
through social media platforms such as Instagram, Facebook, and through their
current university that they attend.
The researchers found that what could have helped the findings was to
assess for more questions such as whether the participant was a first-generation
college graduate and whether they experienced pressure from their home
environment to achieve higher grades. Additionally, the contribution of a high-
grade point average reported could be from the requirements of the participants
to have obtained at least a bachelor’s degree to participate. There were
participants who are currently in graduate school and have obtained both
degrees which can contribute towards why the average GPA was high.
Furthermore, the researchers factored in the time period of when the study was
conducted. If the study were to be conducted in a different time period, the data
and findings could have portrayed different results.
Despite the limitations that were presented, the researchers were able to
point out strengths from the study. The virtual method of distribution contributed
towards a large sample size of 213 participants, a wide range of ages (20-70
years old), and a 40-year timeframe of the year each participant obtained their

38
bachelor’s degree. Additionally, there were diverse participants within religious
and ethnic backgrounds.
Implications for Social Work Practice and Policy
This study can be helpful in informing professionals of how social anxiety
can play a role in the outcome of a college students’ academic performance. The
findings of this study can aid in providing more resources for college students to
utilize in situations where social anxiety impairs their ability to perform
academically. Additionally, there can be a further understanding of what social
anxiety is and how to recognize it. Majority of the participants reported that they
have not sought out services so this can mean that these individuals are
unaware of mental health services that are in place. There continues to be a lack
of understanding of how mental health plays a role in overall quality of life and
ability to reach achievements. The results of this study provides professionals an
idea of how the college population is affected by social anxiety and opportunities
for improvement on how college students can learn to ask for help when needed.
Professionals can use this study to acknowledge that there needs to be more
mental health advocacy and psychoeducation in order for college students to
understand the extent of social anxiety and other mental health disorders.
Continued research will aid in understanding the college population and how
mental health disorders can influence academic performance.

39
Conclusion
The intended purpose for conducting this study was to investigate whether
the presence of social anxiety impacted the academic performance of college
students. This study included the participants’ experience of how they feel when
put in situations that can result in features of social anxiety. The findings
portrayed that the demographic information such as gender, age, and religion
affiliation did not play a significant role in whether social anxiety impacted
academic performance. Overall, the results of the study were not consistent with
the literature therefore the researchers’ hypothesis has been rejected.
Researchers suggest and encourage there to be further studies to be conducted
to assess the impact of social anxiety on academic performance as it seems to
vary based on where the sample is being pulled from.

40
APPENDIX A:
INFORMED CONSENT

41
INFORMED CONSENT
The study in which you are asked to participate is designed to examine how
social anxiety affects the academic performance of graduate students at
California State University of San Bernardino. The study is being conducted by
Leea Gonzales and Erin Tayag, graduate students, under the supervision of Dr.
Herbert Shon, Assistant Professor in the School of Social Work at California
State University, San Bernardino (CSUSB). The study has been approved by the
Institutional Review Board at CSUSB.
PURPOSE: The purpose of the study is to examine how social anxiety affects the academic performance of graduate students at CSUSB. DESCRIPTION: Participants will be given questionnaires about their academic experience and experience with social anxiety as well as how it goes hand in hand in impacting their academic performance. The questionnaire will also include a 20-item Social Interaction Anxiety Scale (SIAS) and a 20-item Social Phobia (SPS) scale.
PARTICIPATION: Your participation in the study is totally voluntary. You can refuse to participate in the study or discontinue your participation at any time without any consequences.
CONFIDENTIALITY: Your responses will remain confidential. The data that will be collected in this study will be reported in a group format.
DURATION: It will take 15 to 20 minutes to complete the questionnaire.
RISKS: Although not anticipated, there may be some discomfort in answering some of the questions. You are not required to answer every single question and can skip the question or end your participation. BENEFITS: There will not be any direct benefits to the participants. CONTACT: If you have any questions about this study, please feel free to contact Dr. Shon at [email protected] RESULTS: Results of the study can be obtained from the Pfau Library ScholarWorks database (http://scholarworks.lib.csusb.edu/) at California State University, San Bernardino after July 2021.

42
I understand that I must be 18 years of age or older to participate in your study, have read and understand the consent document and agree to participate in your study. ______________________________ ________________________ Place an X mark here Date

43
APPENDIX B:
QUESTIONNAIRE

44
What is your current age in years? (provide a numerical number, e.g., 25, 32, 45, etc.) (If you are not at least 18 years of age, please stop and discontinue this survey now. Only those aged 18 and older may participate in this research study) Have you completed your bachelor’s degree from a University?
Yes (continue with survey) No (Thank you for your willingness to participate in this research, but please stop and discontinue the survey now. Participation in this research study requires the completion of at least a bachelor’s degree in college/university) Please select the answer option for each of the following questions that best describes your answer. I get nervous if I have to speak with someone in authority (teacher, boss, etc.) Not at all
Slightly Moderate
Very
Extremely
I have difficulty making eye contact with others. Not at all
Slightly Moderate
Very
Extremely
I become tense if I have to talk about myself or my feelings. Not at all
Slightly Moderate
Very
Extremely
I find it difficult to mix comfortably with the people I work with. Not at all
Slightly Moderate
Very
Extremely
I find it easy to make friends my own age. Not at all
Slightly

45
Moderate
Very
Extremely
I tense up if I meet an acquaintance in the street. Not at all
Slightly Moderate
Very
Extremely
When mixing socially, I am uncomfortable. Not at all
Slightly Moderate
Very
Extremely
I feel tense if I am alone with just one other person. Not at all
Slightly Moderate
Very
Extremely
I am at ease meeting people at parties, etc. Not at all
Slightly Moderate
Very
Extremely
I have difficulty talking with other people. Not at all
Slightly Moderate
Very
Extremely
I find it easy to think of things to talk about. Not at all
Slightly Moderate
Very
Extremely
46
I worry about expressing myself in case I appear awkward. Not at all
Slightly Moderate
Very
Extremely
I find it difficult to disagree with another’s point of view. Not at all
Slightly Moderate
Very
Extremely
I have difficulty talking to attractive persons of the opposite sex. Not at all
Slightly Moderate
Very
Extremely
I find myself worrying that I won't know what to say in social situations. Not at all
Slightly Moderate
Very
Extremely
I am nervous mixing with people I don’t know well. Not at all
Slightly Moderate
Very
Extremely
I feel I’ll say something embarrassing when talking. Not at all
Slightly Moderate
Very
Extremely
When mixing in a group, I find myself worrying I will be ignored. Not at all

47
Slightly Moderate
Very
Extremely
I am tense mixing in a group. Not at all
Slightly Moderate
Very
Extremely
I am unsure whether to greet someone I know only slightly. Not at all
Slightly Moderate
Very
Extremely
I become anxious if I have to write in front of other people. Not at all
Slightly Moderate
Very
Extremely
I become self-conscious when using public toilets. Not at all
Slightly Moderate
Very
Extremely
I can suddenly become aware of my own voice and of others listening to me. Not at all
Slightly Moderate
Very
Extremely
I get nervous that people are staring at me as I walk down the street. Not at all
Slightly Moderate
Very

48
Extremely
I fear I may blush when I am with others. Not at all
Slightly Moderate
Very
Extremely
I feel self-conscious if I have to enter a room where others are already seated. Not at all
Slightly Moderate
Very
Extremely
I worry about shaking or trembling when I’m watched by other people. Not at all
Slightly Moderate
Very
Extremely
I would get tense if I had to sit facing other people on a bus or a train. Not at all
Slightly Moderate
Very
Extremely
I get panicky that others might see me to be faint, sick or ill. Not at all
Slightly Moderate
Very
Extremely
I would find it difficult to drink something if in a group of people. Not at all
Slightly Moderate
Very
Extremely
It would make me feel self-conscious to eat in front of a stranger at a restaurant.

49
Not at all
Slightly Moderate
Very
Extremely
I am worried people will think my behavior is odd. Not at all
Slightly Moderate
Very
Extremely
I would get tense if I had to carry a tray across a crowded cafeteria. Not at all
Slightly Moderate
Very
Extremely
I worry I’ll lose control of myself in front of other people. Not at all
Slightly Moderate
Very
Extremely
I worry I might do something to attract the attention of others. Not at all
Slightly Moderate
Very
Extremely
When in an elevator I am tense if people look at me
Not at all
Slightly Moderate
Very
Extremely
I can feel conspicuous standing in a queue. Not at all
Slightly Moderate

50
Very
Extremely
I get tense when I speak in front of other people. Not at all
Slightly Moderate
Very
Extremely
I worry my head will shake or nod in front of others. Not at all
Slightly Moderate
Very
Extremely
I feel awkward and tense if I know people are watching me. Not at all
Slightly Moderate
Very
Extremely
Have you been professionally diagnosed with Social Anxiety?
Yes
No
Prefer not to say
Even if you were NOT diagnosed with Society Anxiety, what is the chance that you may have had some problems with Social Anxiety while in college?
A very good chance
Some chance
Very little chance
No chance at all If you answered “A very good chance” or “Some chance” to the previous question, what is the chance that Social Anxiety may have negatively affected your ability to perform at your very best level in college and earn higher grades?
A very good chance
Some chance
Very little chance
No chance at all

51
If you ever experienced Society Anxiety while in college, did you ever seek help for it?
Yes (Please answer the following questions) No (Please skip to the question, “What year did you obtain your bachelor's degree from a University?”)
Please answer whether you sought help from any of the following sources of help: Psychiatrist Yes
No
Psychologist Yes
No
Social worker Yes
No
Marriage and family therapist Yes
No
A counselor at your college / college counselor Yes
No
An academic advisor, professor/instructor, or some other professional at my undergraduate institution (e.g., volunteer coordinator/supervisor, mentor, etc.) Yes
No
A reverend, priest, clergyperson, etc. Yes
No
Family member Yes
No

52
Friend / classmate
Yes
No
Significant other / boyfriend / girlfriend
Yes
No
What year did you obtain your bachelor's degree from a University? (example: 20XX format)
What is your current level of education?
I completed a bachelor's degree I completed a bachelor’s degree plus some graduate course work
I completed both a bachelor’s degree and completed a graduate degree
If you were to estimate your overall undergraduate Grade Point Average (GPA), what would it be? (provide a numerical answer, e.g., 3.00, 2.65, 3.85, etc.) What gender do you identify as?
Male Female
Nonbinary/Non-conforming
Transgender Prefer not to say
What race/ethnicity do you identify as?
Caucasian Latinx African American
Native American
Asian
Pacific Islander Two or more races
Other/unknown race
Prefer not to answer Please specify your religious affiliation. Catholicism
Christianity
Islam
Buddhism
Hinduism
Judaism
Other

53
none Prefer not to say
Social Anxiety Interaction Scale and Social Phobia Scale created by R.P. Mattick
and J.C. Clarke (1998) and demographic questions created by Erin Tayag and
Leea Gonzales (2021).
54
APPENDIX C:
INSTITUTIONAL REVIEW BOARD APPROVAL LETTE

55

56
57
REFERENCES
Alvarado, B., & Peebles-Wilkins, W. (2003). Social work in early college high
schools? Children & Schools, 25(3), 131.
Bandura, A. (1977). Social learning theory. Englewood Cliffs, NJ: Prentice Hall.
Baptista, C. A., Loureiro, S. R., de Lima Osório, F., Zuardi, A. W., Magalhães, P.
V., Kapczinski, F., Filho, A. S., Freitas-Ferrari, M. C., & Crippa, J. A.
(2012). Social Phobia in Brazilian university students: prevalence, under-
recognition and Academic impairment in women. Journal of affective
disorders, 136(3), 857–861. https://doi.org/10.1016/j.jad.2011.09.022
Brook, C. A., & Schmidt, L. A. (2008). Social Anxiety disorder: a review of
environmental risk factors. Neuropsychiatric disease and treatment, 4(1),
123–143. https://doi.org/10.2147/ndt.s1799
Brook, C. A., & Willoughby, T. (2015). The social ties that bind: Social Anxiety
and Academic Achievement across the university years. Journal of Youth
and Adolescence, 44(5), 1139-1152.
Brown, E. J., Turovsky, J., Heimberg, R. G., Juster, H. R., Brown, T. A., &
Barlow, D. H. (1997). Validation of the social interaction anxiety scale and
the social phobia scale across the anxiety disorders. Psychological
Assessment, 9(1), 21-27.
Buckner, J., Ecker, A., & Dean, K. (2016). Solitary cannabis use frequency
mediates the relationship between social anxiety and cannabis use and
related problems. American Journal on Addictions, 25(2), 99-104.

58
Campbell, C., Bierman, K., & Molenaar, P. (2016). Individual Day-to-Day Process
of Social Anxiety in Vulnerable College Students. Applied Developmental
Science, 20(1), 1-15.
Chimwemwe Tembo, Sharyn Burns, & Fatch Kalembo. (2017). The association
between levels of alcohol consumption and mental health problems and
academic performance among young university students. PLoS ONE,
12(6), E0178142.
Ecker, A., Richter, A., & Buckner, J. (2014). Cannabis-related impairment: The
Impacts of social anxiety and misconceptions of friends' cannabis-related
problems. Addictive Behaviors, 39(12), 1746-1749.
Foster, D., Garey, L., Buckner, J., & Zvolensky, M. (2016). Social Anxiety and
Cannabis-Related Impairment: The Synergistic Influences of Peer and
Parent Descriptive and Injunctive Normative Perceptions. Substance Use
& Misuse, 51(7), 912-921.
Kenney, S., Napper, L., LaBrie, J., & Vaughn, P. (2018). Reasons for Utilizing
Mental Health Services as Predictors of College Students’ Alcohol Risk.
Journal of College Counseling, 21(2), 125-138.
Lissek, S., Levenson, J., Biggs, A. L., Johnson, L. L., Ameli, R., Pine, D. S.,
Grillon, C. (2008). Elevated Fear Conditioning to Socially Relevant
Unconditioned Stimuli in Social Anxiety Disorder. American Journal of
Psychiatry, 165(1), 124-132.
Mattick, R.P. & Clarke, J.C. (1998). Social Anxiety Interaction Scale and Social
Phobia Scale.

59
Michaels, P., Corrigan, P., Kanodia, N., Buchholz, B., & Abelson, S. (2015).
Mental health priorities: stigma elimination and community advocacy in
college settings. Journal of College Student Development, 56(8), 872-875.
Purdon, C., Antony, M., Monteiro, S., & Swinson, R. P. (2001). Social anxiety in
college students. Journal of Anxiety Disorders, 15(3), 203-215.
Scalzo, A., & Martinez, J. (2017). Not All Anxiety is the Same: How Different
"Types" of Anxiety Uniquely Associate with College Students' Drinking
Intentions. Journal of College Student Development, 58(6), 943-947.
Schlenker, L. R., & Leary, M. R. (1982). Social Anxiety and Self-Presentation: A
Conceptualization and Model. Psychological Bulletin, 92(3), 641-669.
Schry, A., Roberson-Nay, R., & White, S. (2012). Measuring Social Anxiety in
College Students: A Comprehensive Evaluation of the Psychometric
Properties of the SPAI-23. Psychological Assessment, 24(4), 846-854.
Strahan, E. (2003). The effects of social anxiety and social skills on academic
performance. Personality and Individual Differences, 34(2), 347-366.
Sudhir, P., Sharma, M., Mariamma, P., & Subbakrishna, D. (2012). Quality of life
in anxiety disorders: Its relation to work and social functioning and
dysfunctional cognitions: An exploratory study from India. Asian Journal of
Psychiatry, 5(4), 309-314.
Villarosa, M., Madson, M., Zeigler-Hill, V., Noble, J., & Mohn, R. (2014). Social
Anxiety Symptoms and Drinking Behaviors Among College Students: The

60
Mediating Effects of Drinking Motives. Psychology of Addictive Behaviors,
28(3), 710-718.
Weiss, D. E. (2013). The Relationship between Internet Social Networking, Social
Anxiety, Self-Esteem, Narcissism, and Gender among College Students
(Publication No. 3570710) [Doctoral Dissertation, Pace University]. UMI
Dissertation Publishing.
Zastrow, C., Kirst-Ashman, K., & Hessenauer, S. (2019). Understanding Human
Behavior and the Social Environment. Cengage.

61
ASSIGNED RESPONSIBILITIES
The responsibility of this study and paper was shared between the
partnership of Erin Tayag and Leea Gonzales. Both individuals have equal
contributions in all areas such as: data collection, data entry and analysis, writing
the report and presentation of findings, methods, results, and discussion. Both
had equal joint effort in research and documentation among other activities
included in the study.