Embed Size (px)
Citation preview

Poorly Forecast Convection During the Evening of 20 July 2008 in
Southern North Dakota
Justin Turcotte
Meteorologist
Meridian Environmental Technology
Grand Forks, North Dakota
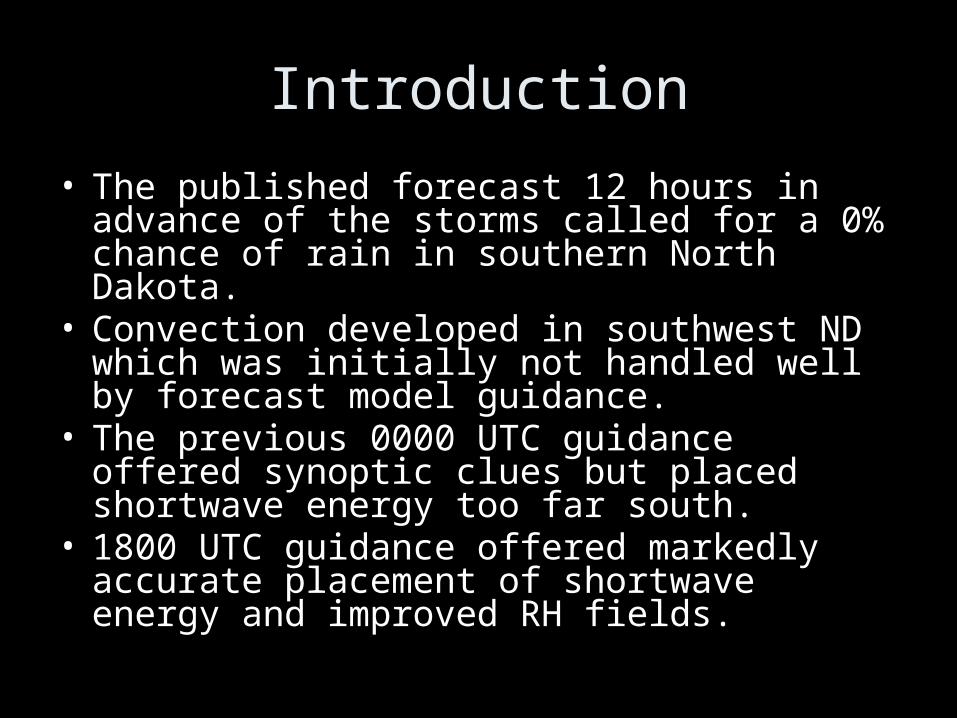
Introduction
• The published forecast 12 hours in advance of the storms called for a 0% chance of rain in southern North Dakota.
• Convection developed in southwest ND which was initially not handled well by forecast model guidance.
• The previous 0000 UTC guidance offered synoptic clues but placed shortwave energy too far south.
• 1800 UTC guidance offered markedly accurate placement of shortwave energy and improved RH fields.
0600 UTC NAM Output
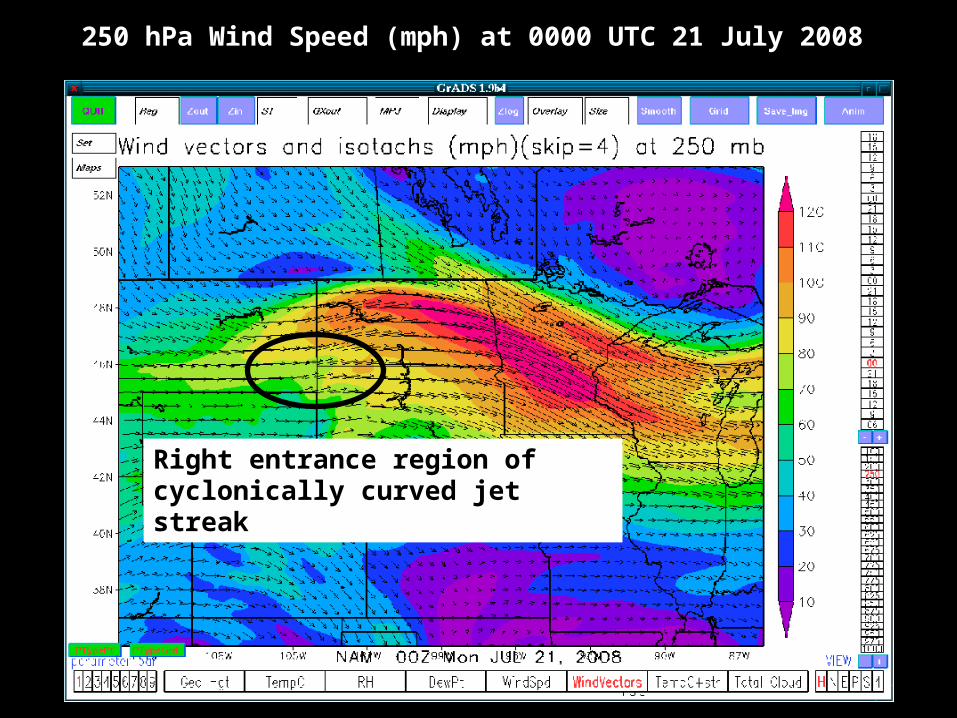
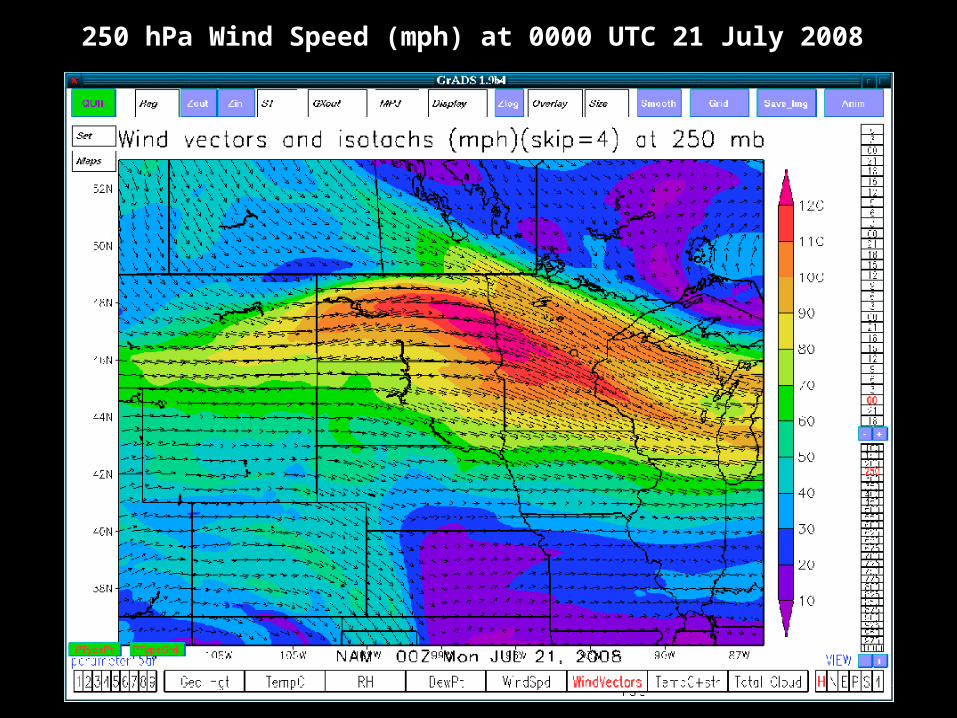
250 hPa Wind Speed (mph) at 0000 UTC 21 July 2008
Right entrance region of cyclonically curved jet streak
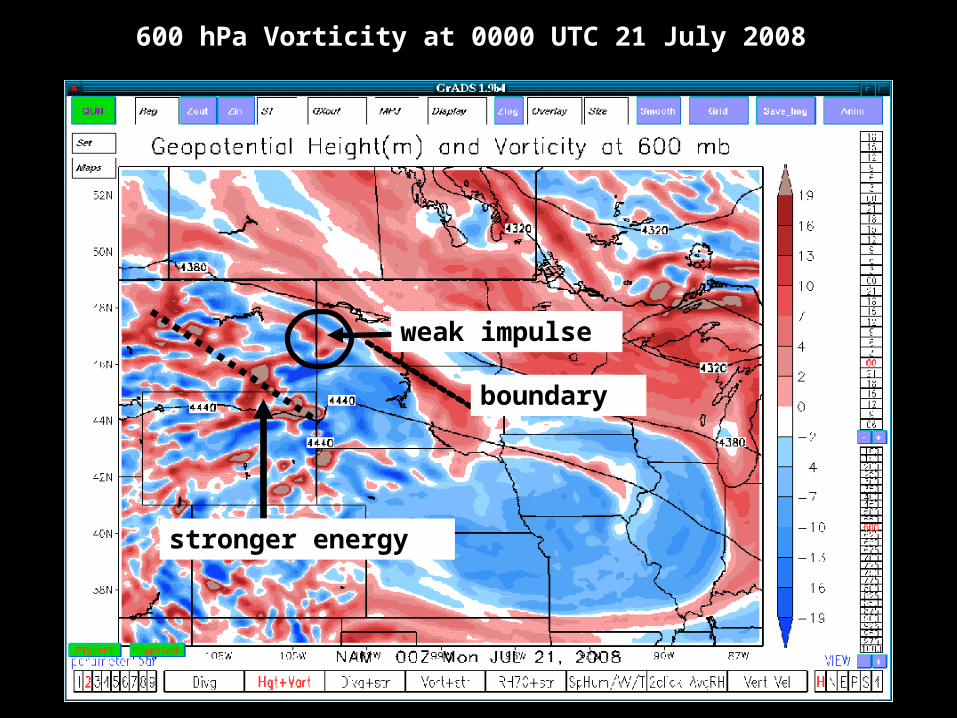
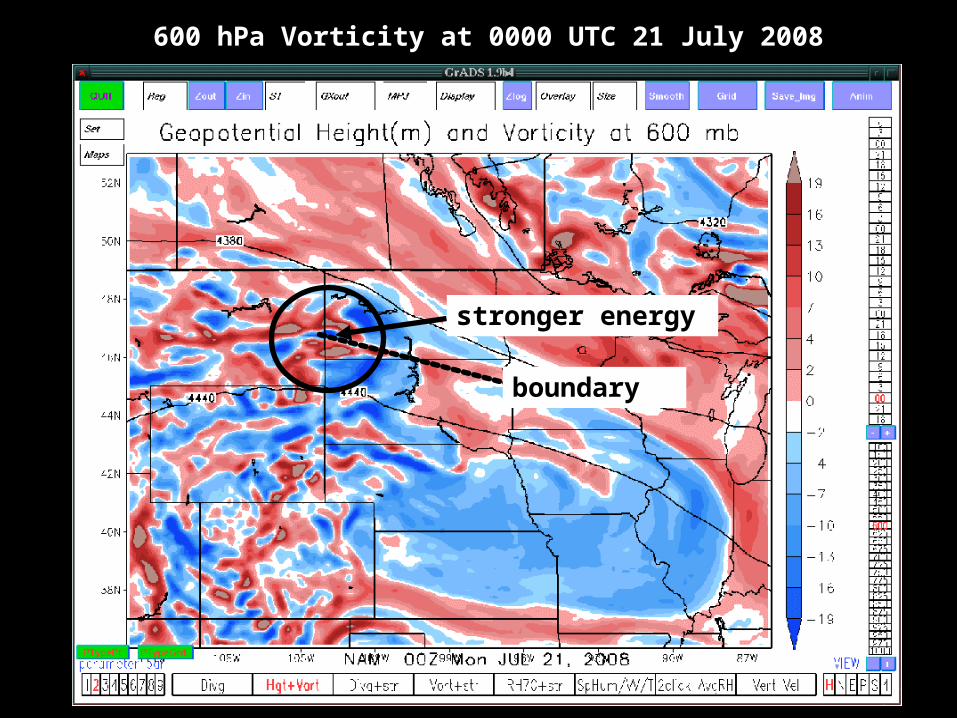
600 hPa Vorticity at 0000 UTC 21 July 2008
weak impulse
stronger energy
boundary
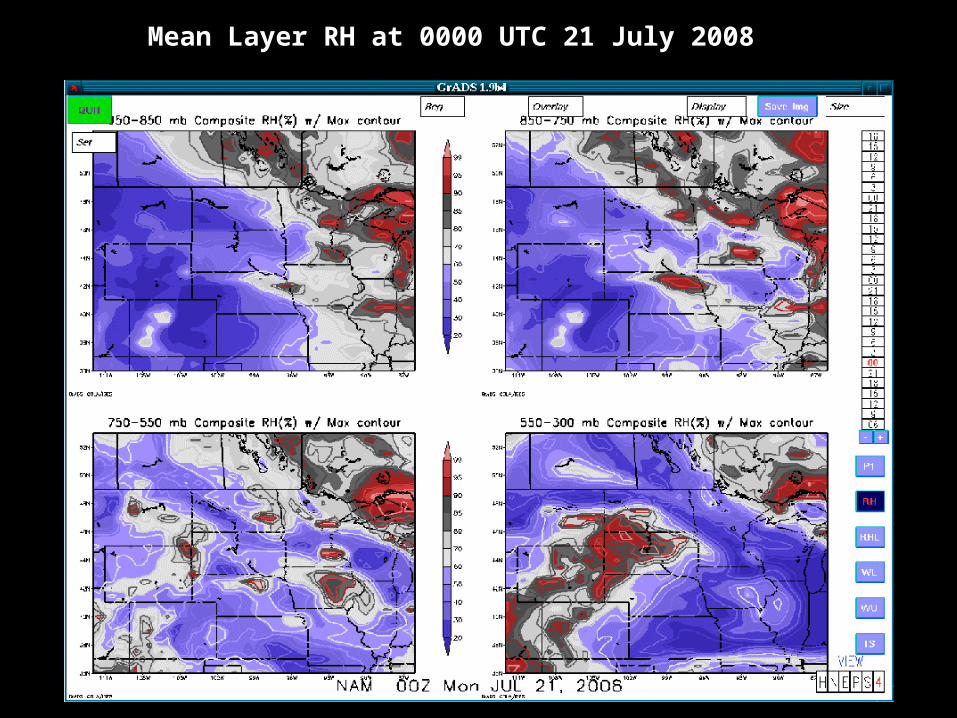
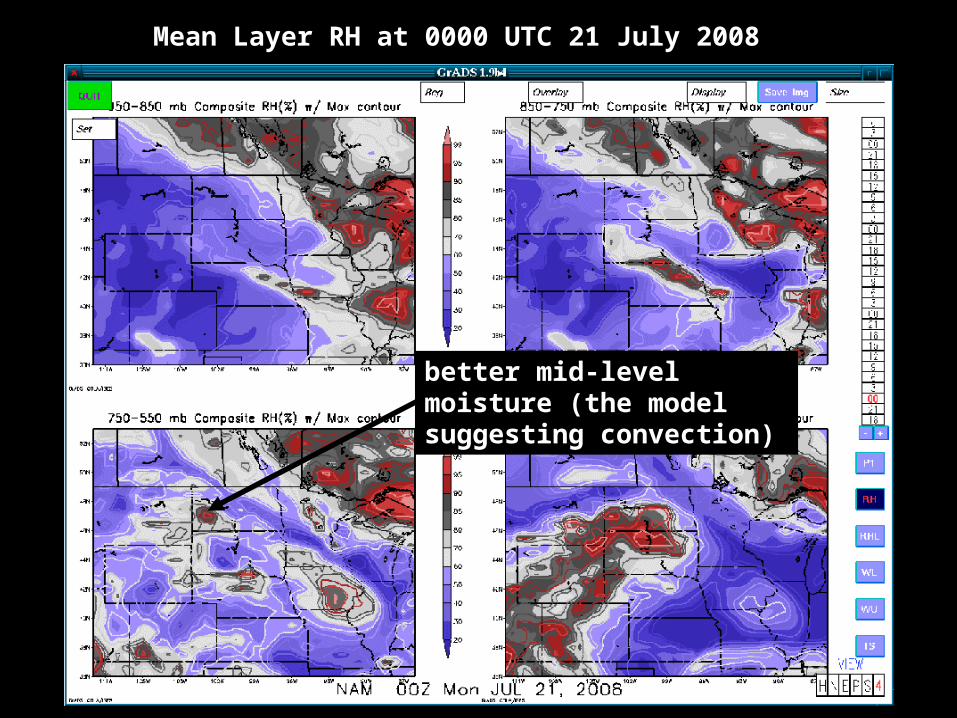
Mean Layer RH at 0000 UTC 21 July 2008
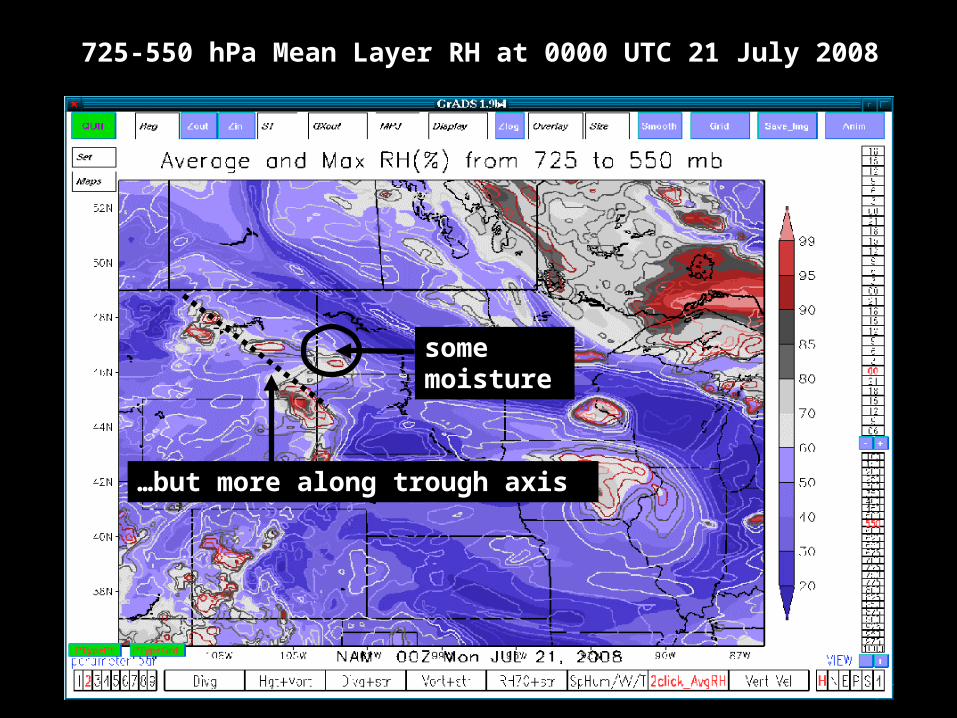
some moisture
…but more along trough axis
725-550 hPa Mean Layer RH at 0000 UTC 21 July 2008
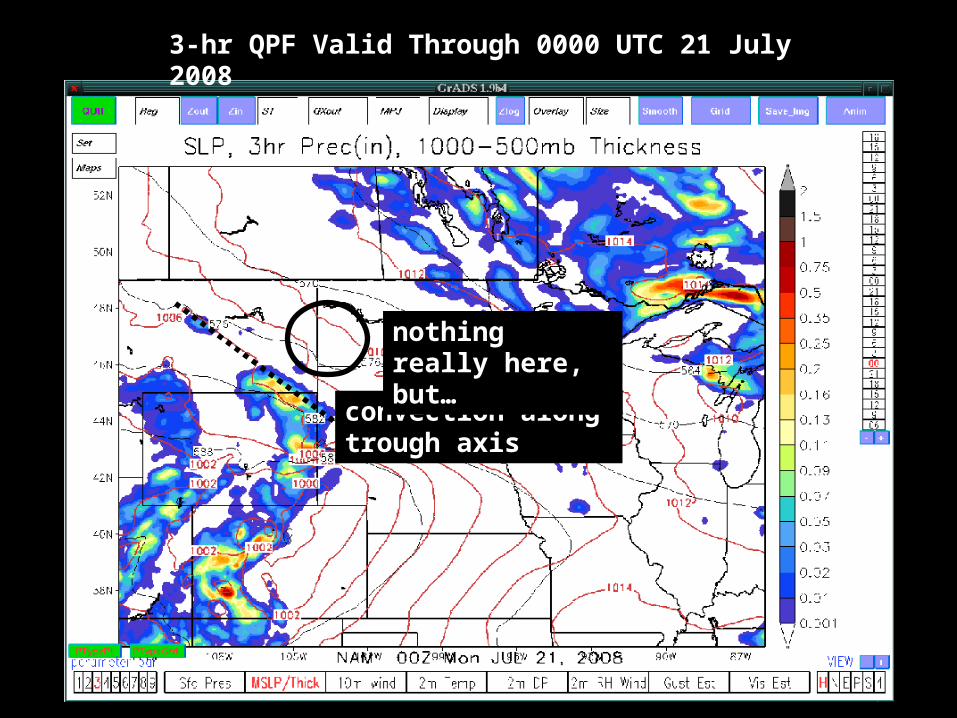
3-hr QPF Valid Through 0000 UTC 21 July 2008
convection along trough axis
nothing really here, but…
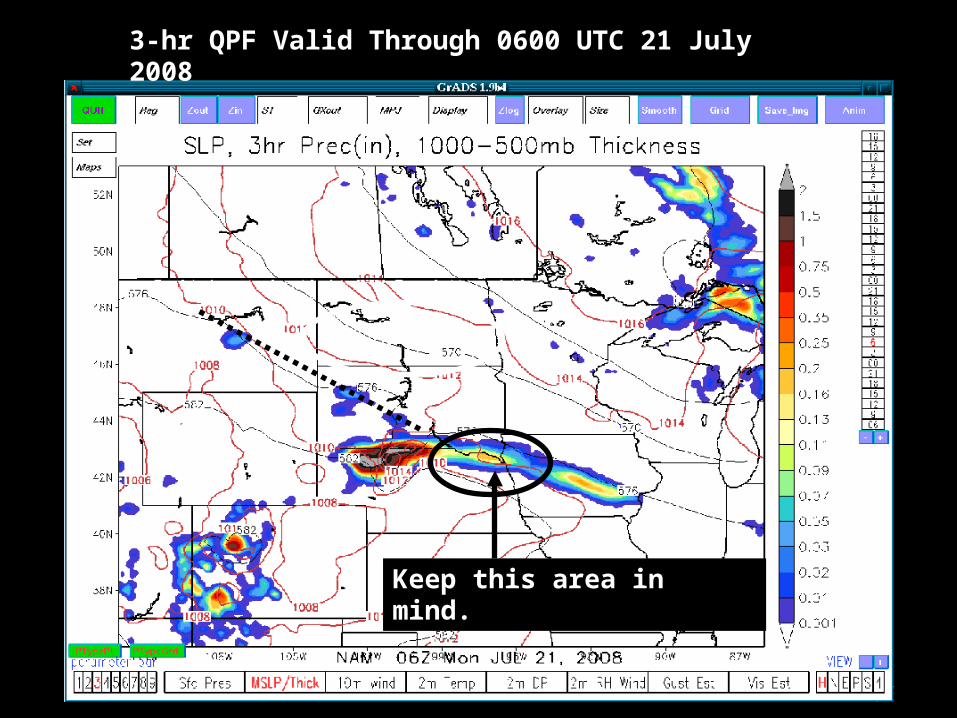
3-hr QPF Valid Through 0600 UTC 21 July 2008
Keep this area in mind.
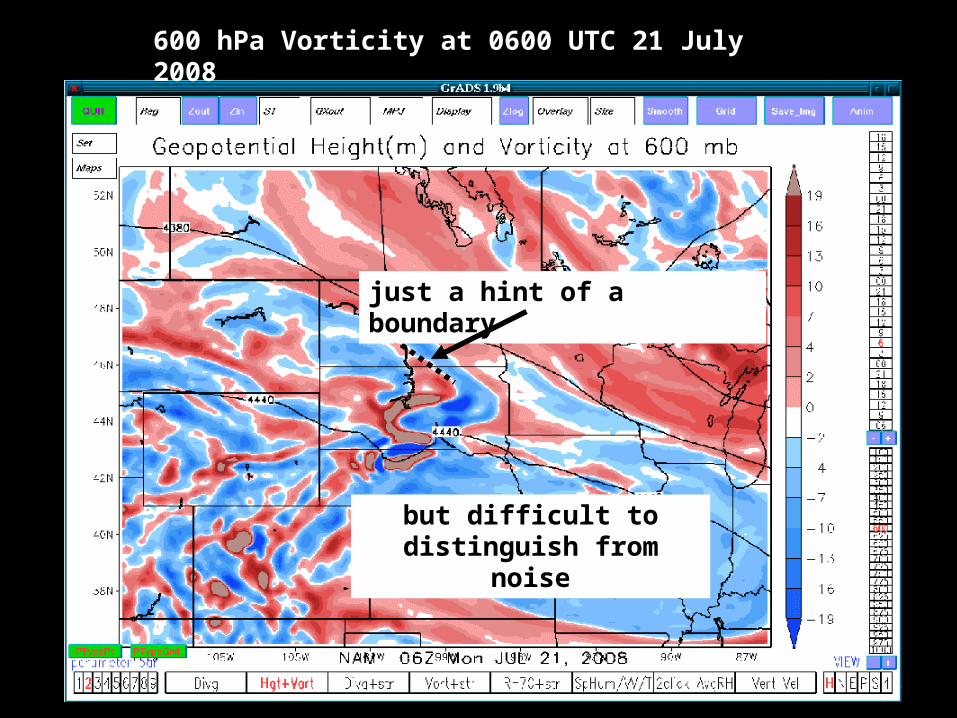
600 hPa Vorticity at 0600 UTC 21 July 2008
just a hint of a boundary
but difficult to distinguish from noise
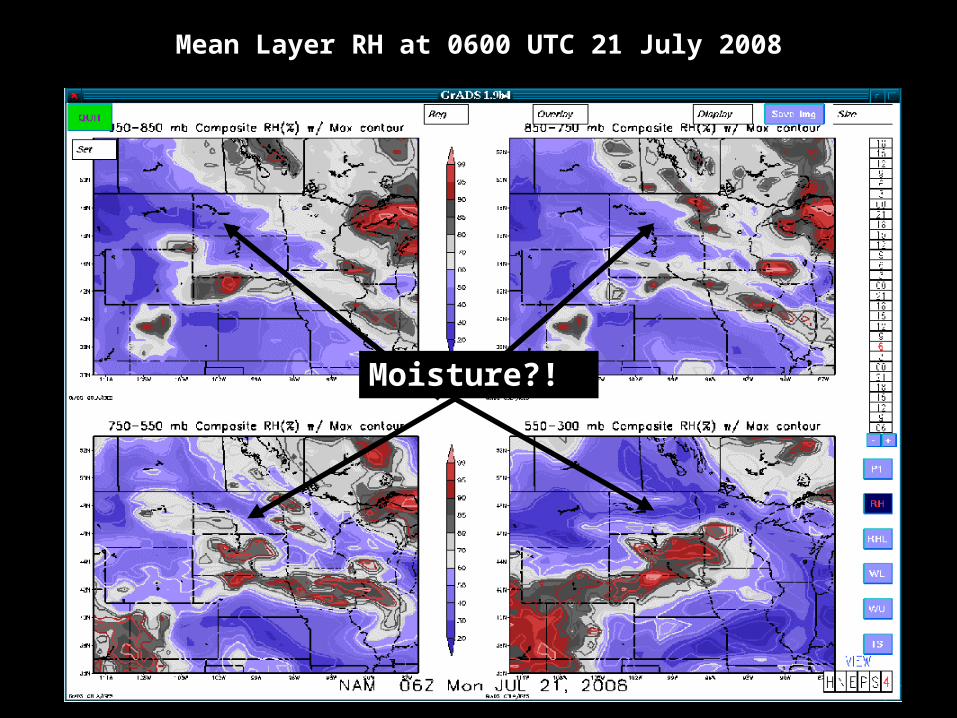
Mean Layer RH at 0600 UTC 21 July 2008
Moisture?!
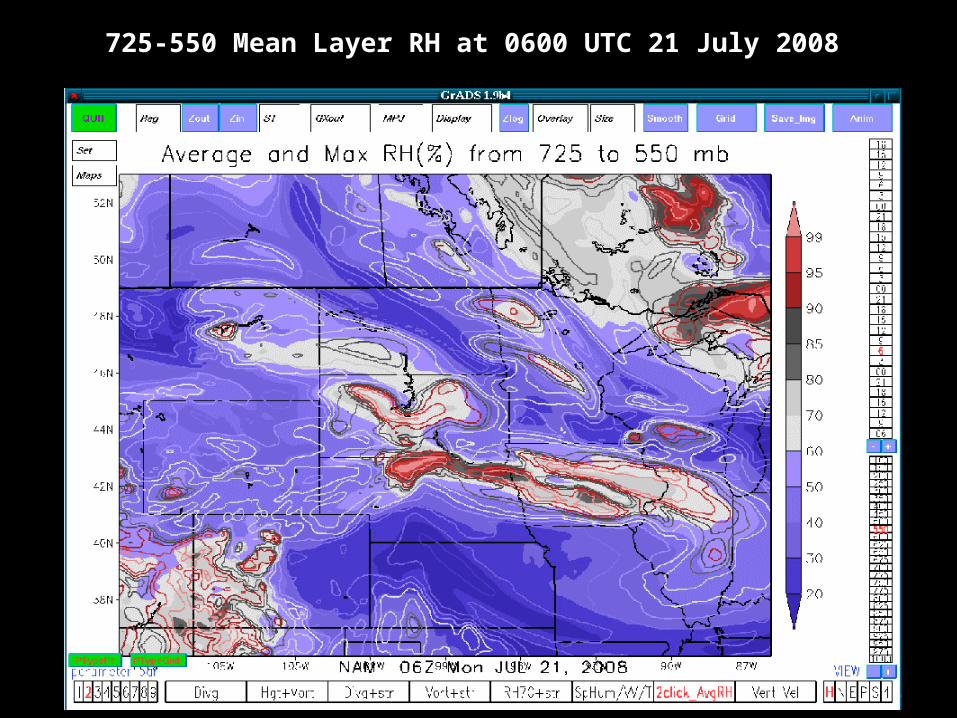
725-550 Mean Layer RH at 0600 UTC 21 July 2008
Notes• Jet streak clearly evident otherwise support
lower down diffuse or displaced to the south.
• GFS QPF guidance (not shown) also did not suggest a threat of precipitation in southern North Dakota.
• The 6am published forecast offered a 0% POP between 00 and 06 UTC in southern ND.
• Would you adjust the 9am published forecast based on the 06 UTC model output?
Notes• Subsequent NAM model runs trended toward an
increased threat of precipitation in southern North Dakota.
• The 1200 UTC NAM (not shown) and the 1800 UTC NAM continued to maintain the strong jet streak and advertised a stronger and less diffuse shortwave moving into southwest North Dakota during the late afternoon.
• The day shift forecaster would ultimately have the benefit of more accurate model data to work with in this case should he choose to believe it.
1800 UTC NAM Output
250 hPa Wind Speed (mph) at 0000 UTC 21 July 2008
600 hPa Vorticity at 0000 UTC 21 July 2008
stronger energy
boundary
Mean Layer RH at 0000 UTC 21 July 2008
better mid-level moisture (the model suggesting convection)
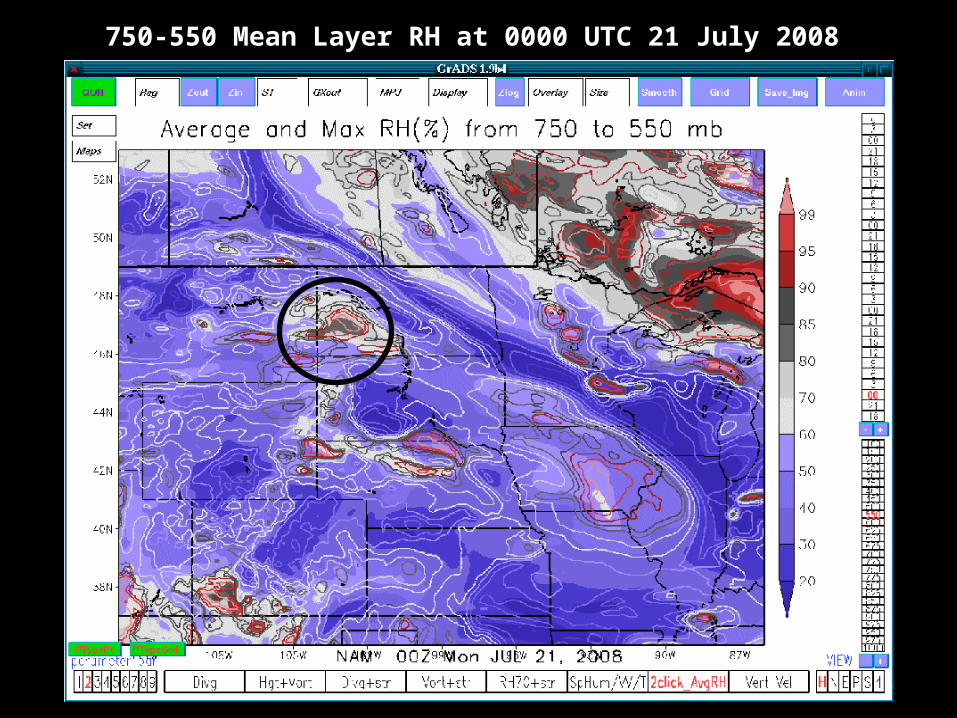
750-550 Mean Layer RH at 0000 UTC 21 July 2008
How about some older data?
• A caffeine deficit must have resulted in me not saving the 21 July 1800 UTC NAM QPF but I did capture the the previous day 1800 UTC NAM QPF for the period of discussion.
• Note this particular run does have some semblance of precipitation in southwest ND prior to 0000 UTC and in southeast ND prior to 0600 UTC
• Later guidance shifted the convection advertised for the MCI vicinity to the SUX area.
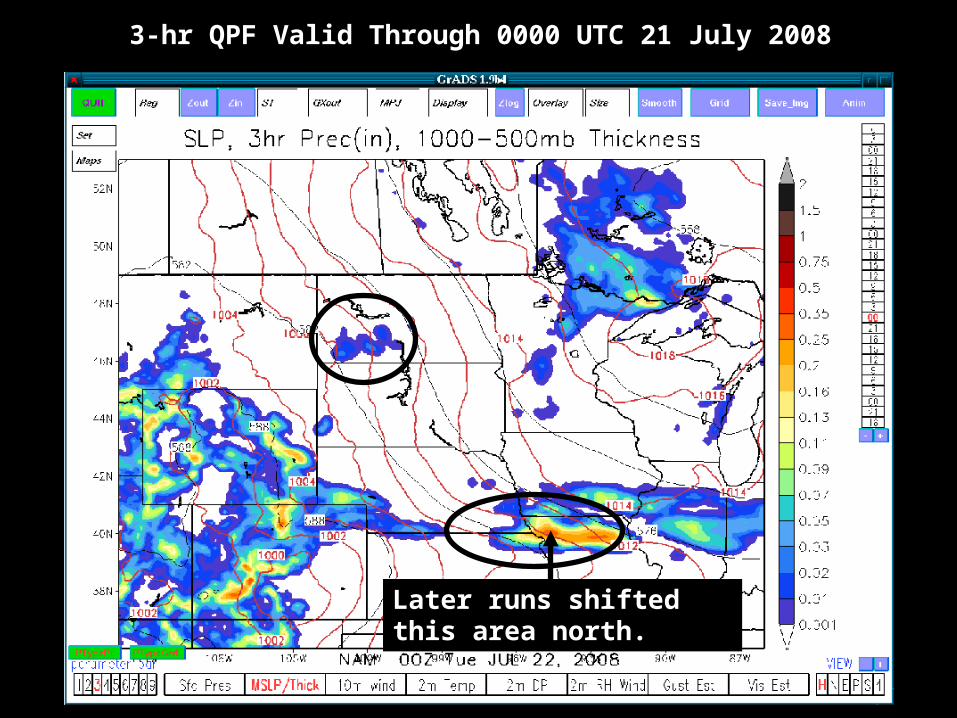
3-hr QPF Valid Through 0000 UTC 21 July 2008
Later runs shifted this area north.
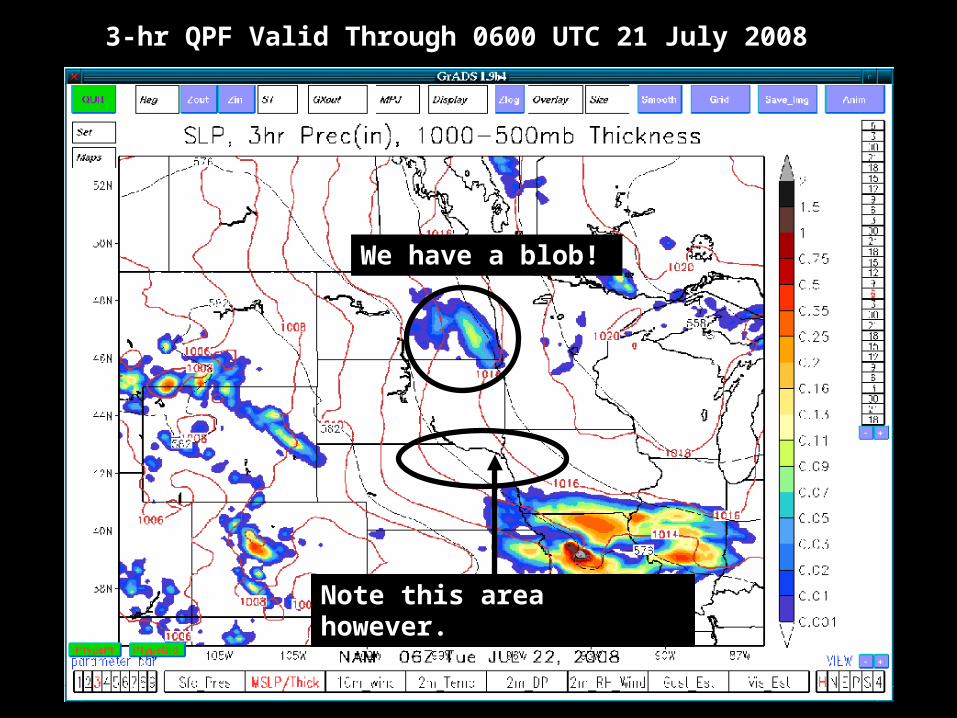
3-hr QPF Valid Through 0600 UTC 21 July 2008
We have a blob!
Note this area however.
Notes• The 1200 UTC (not shown) and to a greater extent 1800 UTC
NAM runs suggested the threat for precipitation was not zero. The 1800 UTC NAM run from the previous day also hinted at precipitation.
• Additional data may also have been useful for determining the threat of precipitation (satellite, surface obs, SPC mesoanalysis) as surface heating continued through the day.
• The 1800 UTC 20 July NAM QPF field was reasonably placed in ND but area of convection advertised for NE/KS/IA was well south of where the band set-up.
• Perhaps most intriguing was how well the 1800 UTC NAM verified in North Dakota when viewing mean layer RH and 600 hPa vorticty...
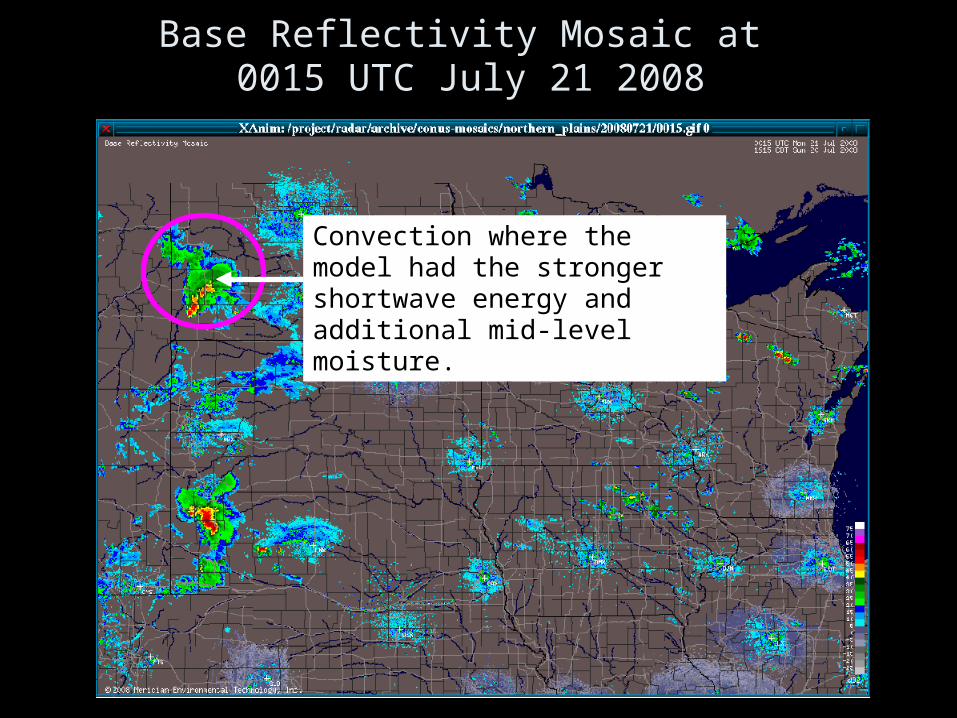
Base Reflectivity Mosaic at 0015 UTC July 21 2008
Convection where the model had the stronger shortwave energy and additional mid-level moisture.
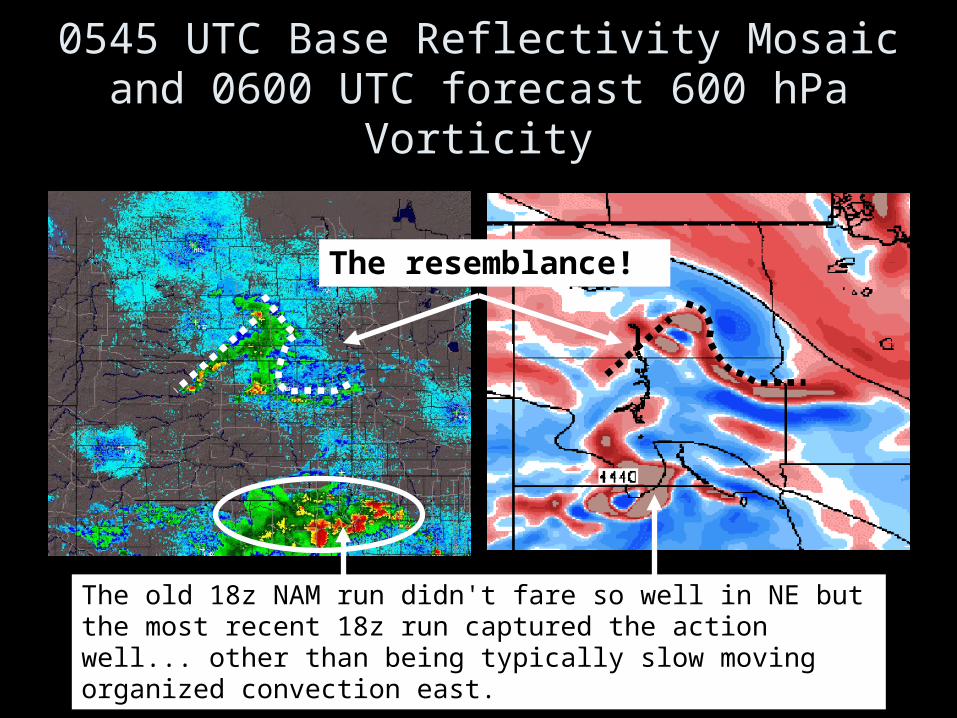
0545 UTC Base Reflectivity Mosaic and 0600 UTC forecast 600 hPa Vorticity
The resemblance!
The old 18z NAM run didn't fare so well in NE but the most recent 18z run captured the action well... other than being typically slow moving organized convection east.
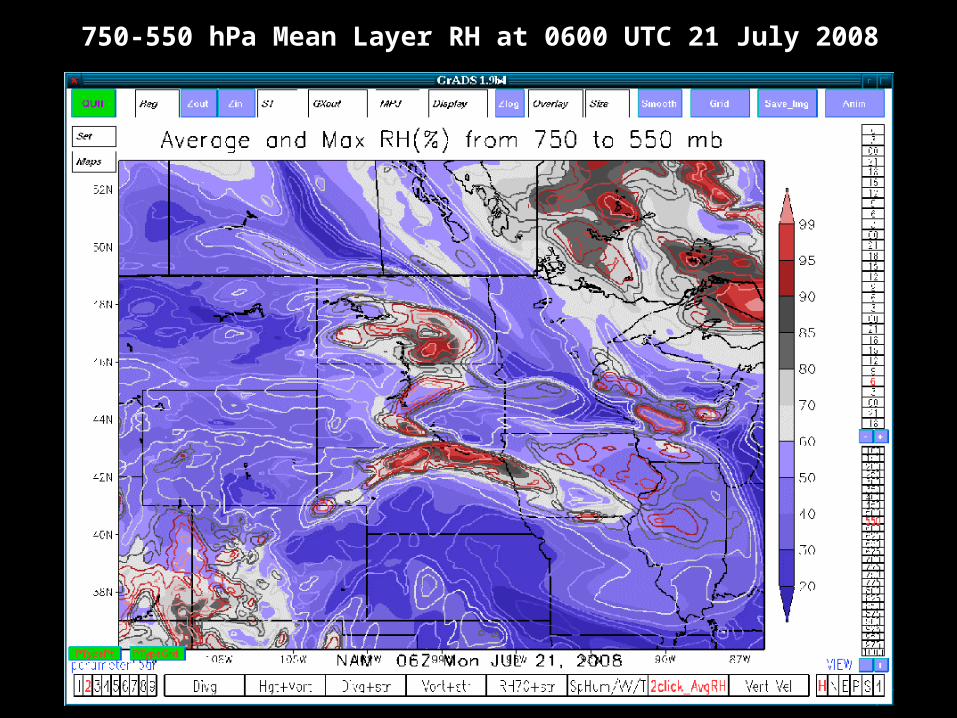
750-550 hPa Mean Layer RH at 0600 UTC 21 July 2008
Summary
• NAM vorticity and RH fields can indicate the potential for precipitation even though the QPF fields are empty or potentially out of place.
• Changes in small features from one model run to the next shouldn’t be ignored, but…
• It can be difficult at times to distinguish between potential reality and background noise.
• Older model runs can at times/places be better than the most recent model runs.
• Should you ignore subtle shortwaves too often your forecast users may come to the following conclusion…

They know nothing!!!


![Temperate deciduous forest [Meteorologist] Ariana](https://img.pdfslide.net/doc/110x75/56649dab5503460f94a9a551/temperate-deciduous-forest-meteorologist-ariana.jpg)