Embed Size (px)
Citation preview

POP BANK GROUP
HALF-YEAR FINANCIAL REPORT 1 JANUARY – 30 JUNE 2021

2R E V I E W K E Y F I G U R ES H A L F -Y E A R R E P O RT N OT ES
CONTENTS
CEO’s review ..........................................................................................................................................................................3POP Bank Group and the amalgamation of POP Banks .................................................6Operating environment ............................................................................................................................................ 7Key events during the first half of the year .....................................................................................8POP Bank Group’s earnings and balance sheet .....................................................................10POP Bank Group key figures and ratios ...........................................................................................10Operating segments ..................................................................................................................................................11POP Bank Group’s risk and capital adequacy management and risk position .............................................................................................................................................................14Summary of Capital Adequacy ...................................................................................................................18Responsibility .....................................................................................................................................................................19Outlook for the second half of the year .......................................................................................... 19Events after the review period ...................................................................................................................... 19
HALF-YEAR REPORT FOR 1 JANUARY – 30 JUNE 2021 ...................................................20POP Bank Group’s income statement ................................................................................................20POP Bank Group’s statement of other comprehensive income .........................20POP Bank Group’s balance sheet ............................................................................................................. 21Statement of changes in the POP Bank Group’s equity .............................................22POP Bank Group’s cash flow statement ...........................................................................................23
NOTES ...... ...........................................................................................................................................................................................24NOTE 1 The POP Bank Group and the scope of IFRS Financial Statements ........................................................................................................................24NOTE 2 POP Bank Group’s accounting policies ....................................................................26NOTE 3 POP Bank Group’s operating segments .................................................................. 28NOTE 4 Net interest income ...........................................................................................................................33NOTE 5 Net commissions and fees .......................................................................................................33NOTE 6 Net investment income ............................................................................................................... 34NOTE 7 Insurance income .................................................................................................................................. 34NOTE 8 Classification of financial assets and liabilities .............................................35NOTE 9 Fair value measurements by valuation technique ........................................37NOTE 10 Impairment losses on financial assets................................................................... 42NOTE 11 Liabilities to Credit Institutions and Customers ......................................... 47NOTE 12 Insurance contract liabilities ............................................................................................... 47NOTE 13 Debt securities issued to the public ..........................................................................48NOTE 14 Collateral given ...................................................................................................................................49NOTE 15 Off-balance sheet commitments ................................................................................49NOTE 16 Related parties ..................................................................................................................................49
FURTHER INFORMATION ...........................................................................................................................................50
POP Bank Group’s Half-Year Financial Report for 1 January – 30 June 2021 is a translation of the original Finnish version “POP Pankki -ryhmän puolivuosikatsaus 1.1.–30.6.2021”. In case of discrepancies, the Finnish version shall prevail.

3R E V I E W K E Y F I G U R ES H A L F -Y E A R R E P O RT N OT ES
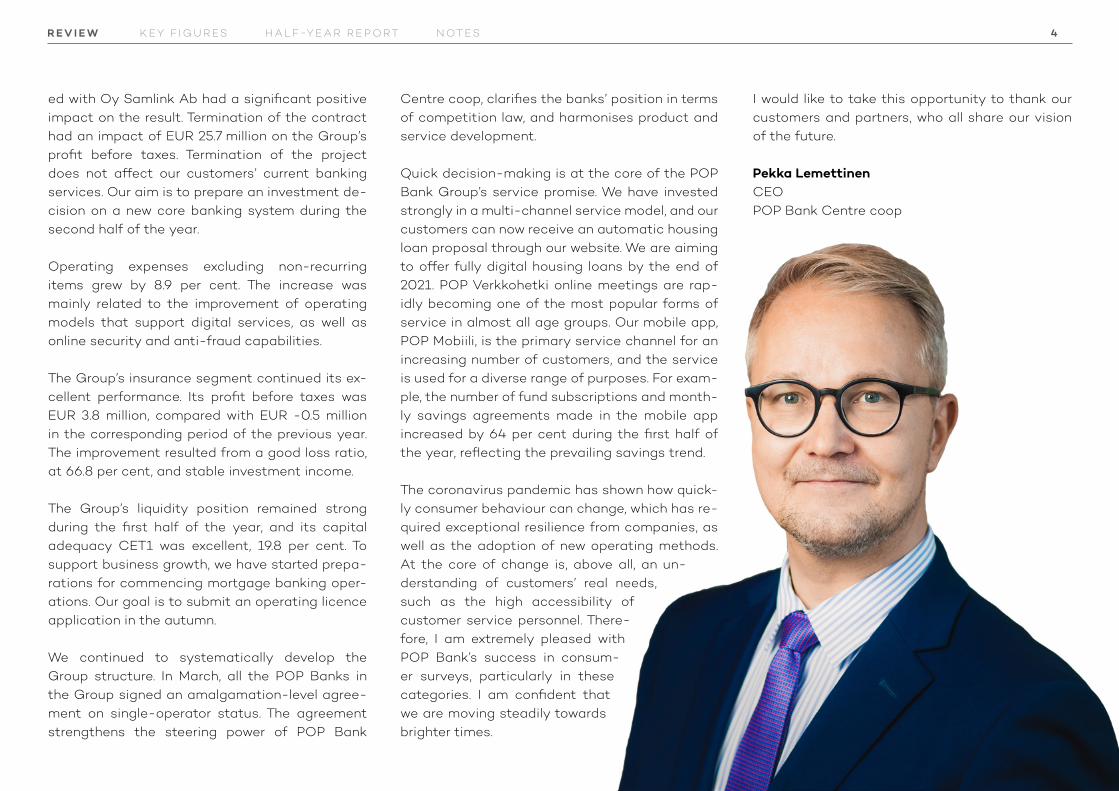
CEO’S REVIEW
T he POP Bank Group’s profit before taxes for the first half of the year was a record EUR 49.0 million. The volume and number
of customers in banking and insurance operations developed favourably, the increase was support-ed by market recovery and improved consumer confidence. In line with the Group’s strategy, we focused on growing our operations in the corpo-rate customer segment and on personal service in digital channels. Customer satisfaction is high in both our banking and our insurance operations. In the EPSI Rating customer satisfaction survey, POP Bank has been ranked as Finland’s best bank ten times.
All of the Group’s operating income items in-creased during the first half of the year. Compared to the previous reporting period, the POP Bank Group’s profit excluding non-recurring items was EUR 23.3 million, representing an increase of EUR 21.8 million. Of the Group’s key sources of revenue, net interest income increased to EUR 37.6 mil-lion. Net commission income was EUR 18.3 million – a significant increase of 15.8 per cent. Net in-vestment income was EUR 8.9 million, which rep-resents an increase of EUR 14.6 million compared to the previous reporting period. The increase was due to stabilisation after the major market chang-es caused by the coronavirus pandemic.
One-off compensation for the termination of the core banking system reform project implement-
4R E V I E W K E Y F I G U R ES H A L F -Y E A R R E P O RT N OT ES
ed with Oy Samlink Ab had a significant positive impact on the result. Termination of the contract had an impact of EUR 25.7 million on the Group’s profit before taxes. Termination of the project does not affect our customers’ current banking services. Our aim is to prepare an investment de-cision on a new core banking system during the second half of the year.
Operating expenses excluding non-recurring items grew by 8.9 per cent. The increase was mainly related to the improvement of operating models that support digital services, as well as online security and anti-fraud capabilities.
The Group’s insurance segment continued its ex-cellent performance. Its profit before taxes was EUR 3.8 million, compared with EUR -0.5 million in the corresponding period of the previous year. The improvement resulted from a good loss ratio, at 66.8 per cent, and stable investment income.
The Group’s liquidity position remained strong during the first half of the year, and its capital adequacy CET1 was excellent, 19.8 per cent. To support business growth, we have started prepa-rations for commencing mortgage banking oper-ations. Our goal is to submit an operating licence application in the autumn.
We continued to systematically develop the Group structure. In March, all the POP Banks in the Group signed an amalgamation-level agree-ment on single-operator status. The agreement strengthens the steering power of POP Bank
Centre coop, clarifies the banks’ position in terms of competition law, and harmonises product and service development.
Quick decision-making is at the core of the POP Bank Group’s service promise. We have invested strongly in a multi-channel service model, and our customers can now receive an automatic housing loan proposal through our website. We are aiming to offer fully digital housing loans by the end of 2021. POP Verkkohetki online meetings are rap-idly becoming one of the most popular forms of service in almost all age groups. Our mobile app, POP Mobiili, is the primary service channel for an increasing number of customers, and the service is used for a diverse range of purposes. For exam-ple, the number of fund subscriptions and month-ly savings agreements made in the mobile app increased by 64 per cent during the first half of the year, reflecting the prevailing savings trend.
The coronavirus pandemic has shown how quick-ly consumer behaviour can change, which has re-quired exceptional resilience from companies, as well as the adoption of new operating methods. At the core of change is, above all, an un-derstanding of customers’ real needs, such as the high accessibility of customer service personnel. There-fore, I am extremely pleased with POP Bank’s success in consum-er surveys, particularly in these categories. I am confident that we are moving steadily towards brighter times.
I would like to take this opportunity to thank our customers and partners, who all share our vision of the future.
Pekka LemettinenCEOPOP Bank Centre coop

R E V I E W K E Y F I G U R ES H A L F -Y E A R R E P O RT N OT ES
Operating income
109.2EUR million
CET 1 capital ratio
19.8 %Loan portfolio
4.1EUR billion
Profit before tax
49.0EUR million
Total customers
419,800
Net interest income
37.6EUR million
5R E V I E W K E Y F I G U R ES H A L F -Y E A R R E P O RT N OT ES

6R E V I E W K E Y F I G U R ES H A L F -Y E A R R E P O RT N OT ES
POP BANK GROUP AND THE AMALGAMATION OF POP BANKS
The POP Bank Group is a Finnish financial group that offers retail banking services for private cus-tomers, small and medium-sized enterprises and agricultural, forestry and bioeconomy companies, in addition to providing private customers with non-life insurance services. The POP Banks’ mis-sion is to promote its customers’ financial well-be-ing and prosperity, as well as local success.
STRUCTURE OF THE POP BANK GROUP The POP Bank Group comprises of POP Banks and POP Bank Centre coop, and the entities under their control. The most significant companies with customer operations in the POP Bank Group are:
● 21 member cooperative banks of POP Bank Centre coop that use the marketing name POP Bank
● Bonum Bank Plc, which is the central credit institution of POP Banks and a subsidiary of POP Bank Centre coop
● Finnish P&C Insurance Ltd, which uses the auxiliary business name POP Insurance.
The POP Banks are cooperative banks owned by their member customers POP Bank Centre coop, the central institution, is responsible for the group steering and supervision in accordance with the Act on the Amalgamation of Deposit Banks (24 June 2010/599) (hereinafter referred to as the “Amalgamation Act”). In accordance with the
Amalgamation Act, the central institution shall prepare financial statements as a combination of the financial statements or the consolidated fi-nancial statements of the central institution and its member credit institutions in accordance with the International Financial Reporting Standards (IFRS). In addition to the organizations that belong to the amalgamation of POP Banks, the POP Bank
Companies included in the banks’
consolidation groups
POP HOLDING LTD
FINNISH P&C INSURANCE LTD
MEMBER COOPERATIVE BANKS
Member credit institutions
POP BANK CENTRE COOPCentral institution
BONUM BANK PLCCentral credit institution, member credit institution
THE POP BANK GROUP
AMALGAMATION OF POP BANKS
JOINT LIABILITY
Group comprises POP Holding Ltd and its wholly owned company Finnish P&C Insurance Ltd. Nei-ther of these are included in the scope of joint li-ability.
The following chart presents the structure of the POP Bank Group and the entities included in the amalgamation and scope of joint liability.

7R E V I E W K E Y F I G U R ES H A L F -Y E A R R E P O RT N OT ES
CHANGES IN POP BANK GROUP’S STRUCTUREOne merger was completed within the POP Bank Group during the review period. At the end of Feb-ruary 2021, Reisjärven Osuuspankki merged with Siilinjärven Osuuspankki, and the name of the bank was changed to Järvi-Suomen Osuuspank-ki. After the merger, the POP Bank Group consists of 21 cooperative banks. The merger was an in-tra-Group arrangement and had no impact on the POP Bank Group’s consolidated financial informa-tion.
OPERATING ENVIRONMENT
The Finnish economy started to recover in early 2021 after a challenging 2020, a year character-ised by the coronavirus pandemic. The decrease in total economic output in Finland was among the smallest in the eurozone in 2020, and production has rapidly returned to the pre-crisis level in many sectors. Driven by the export industry, this trend also improved the situation of companies in the domestic market. Increased economic activity has been seen in brisk corporate loan demand. In some sectors, the recovery rate has been slowed by a global shortage of components and raw materi-als. For example with renovation and construction picking up, prices of the various materials have increased, and its availability has decreased. The tourism, catering and event sectors in particular continued to suffer from various restrictions dur-ing the first half of the year, but even these sec-tors are expected to fare better in the second half.
Consumer confidence has improved, and the re-covery of consumption has also been driven by the additional savings accumulated last year. Fur-thermore, because interest rates continue to be at a very low level, the sales of various durable goods, as well as apartments and holiday homes, were at a good level during the first half of the year. How-ever, business owners and employees in sectors heavily affected by the pandemic are at a disad-vantage in these circumstances. While unemploy-ment decreased during the first half of the year, the number of long-term unemployed increased.
The rapid recovery of the economy and the re-lease of growing consumption, combined with the shortage of components, have been factors be-hind the rise in inflation that started in the first half of the year. The European Central Bank’s highly expansionary policy, including securities purchases, funding for banks under special condi-tions and low interest rates, have had a similar im-pact. Housing prices in growth centres, as well as share prices, have continued to rise. Outside the growth centres in Finland, housing price rises have been moderate in recent years, but the number of deals has increased somewhat.
Earlier of the year, inflation in the euro area was faster than before and also in Finland, the price in-creases accelerated. In Finland, compared to the previous year, especially the prices of the fuel and town house properties as well as costs of the ba-sic renovations speeded up the inflation. In the beginning of the July, in the pursuit of price stabil-ity, ECB decided to aim to the symmetric inflation target of two per cent over the medium period, whereas earlier the aim was below two per cent.
In the public sector, indebtedness increased sig-nificantly last year and this year, and is at a mark-edly higher level than before. However, the short-term negative impacts of the pandemic have been successfully mitigated by targeting state aid at companies and municipalities. Nevertheless, Fin-land’s structural problems remain unresolved, and, although the direct cost impacts of indebtedness are small in a low-interest environment, as interest
8R E V I E W K E Y F I G U R ES H A L F -Y E A R R E P O RT N OT ES
rates rise the already high rate of taxation does not allow any leeway without negatively affecting economic growth.
THE IMPACT OF THE CORONAVIRUS PANDEMIC ON BUSINESS OPERATIONSDemand for housing loans and corporate loans was very high during the first half of the year, de-spite the coronavirus pandemic. The capital mar-kets have also recovered to pre-pandemic levels, which has supported demand for savings prod-ucts. The coronavirus pandemic has accelerat-ed the transition from traditional face-to-face services to digital service channels, in which the number of visitors has grown significantly during 2020 and 2021. The coronavirus pandemic has not affected the availability of the services provided by the non-life insurance company, which oper-ates online.
There have been no major changes in the quali-ty of the loan portfolio during the pandemic. The Group’s capital adequacy position continues to be strong, and its risk position continues to be mod-erate.
STRUCTURAL CHANGES IN THE POP BANK GROUP AND CLOSER COOPERATION A structural shift towards larger member credit in-stitutions, which has long been in progress with-in the Group, continued with a bank merger in the review period. In addition, the POP Banks signed an agreement on single-operator status in March. This provides POP Bank Centre coop with steering power over the banks’ business decisions, such as pricing, product selection and areas of operation.
The decision clarifies the competitive position be-tween the banks in the Group and enables more efficient business development as a Group.
NEW PARTNERSIn June, POP Bank introduced Laskuraha, a new service for its corporate customers, in cooperation with Puro Finance Oy. The service enables funding backed by invoice receivables. This new funding service helps companies to respond to demand in a market that is recovering from the coronavirus pandemic, while also supporting the Group’s stra-tegic targets of increasing operations in the cor-porate customer segment.
TERMINATION OF THE CORE BANKING SYSTEM REFORM PROJECTIn June, the POP Bank Group and Oy Samlink Ab decided to terminate the agreement they had signed in 2019 on the reform of the core banking system. Oy Samlink Ab paid compensation to the POP Bank Group for terminating the agreement. The POP Bank Group continues to be a custom-er of Samlink. While termination of the agreement does not affect the banking services current-ly supplied to the POP Bank Group’s customers, it had an impact of EUR 25.7 million on the result for the review period.
CREDIT RATINGSIn January 2021, S&P Global Ratings has affirmed Bonum Bank Plc’s long-term investment grade to ‘BBB’ and short-term investment grade to ‘A-2’. At the same time, the agency revised the bank’s out-look from negative to stable.
KEY EVENTS DURING THE FIRST HALF OF THE YEAR

R E V I E W K E Y F I G U R ES H A L F -Y E A R R E P O RT N OT ES
4,500
4,000
3,500
3,000
2,500
2,000
1,500
1,000
500
30.6.2020 31.12.2020 30.6.2021
0
3,756,9 3,868,14,068,1
30.6.2020 31.12.2020 30.6.2021
BALANCE SHEET (EUR MILLION)
5,000
4,000
3,000
2,000
1,000
0
4,868,25,099,4
5,274,4
CET1 CAPITAL RATIO (%)
19.9 19.9 19.820
15
10
5
0
30.6.2020 31.12.2020 30.6.2021
50
45
40
35
30
25
20
15
10
5
0
49.0
1.5
1-6/2020 1-6/2021
9R E V I E W K E Y F I G U R ES H A L F -Y E A R R E P O RT N OT ES
PROFIT BEFORE TAX (EUR MILLION)
LOAN PORTFOLIO (EUR MILLION)

10R E V I E W K E Y F I G U R E S H A L F -Y E A R R E P O RT N OT ES
POP BANK GROUP’S EARNINGS AND BALANCE SHEET
POP BANK GROUP KEY FIGURES AND RATIOS
Key income figures (EUR 1,000) 1 Jan - 30 Jun 2021 1 Jan - 30 Jun 2020 1 Jan-31 Dec 2020
Net interest income 37,647 36,937 74,099
Net commissions and fees 18,298 15,801 31,049
Insurance income 7,384 5,149 11,611
Net investment income 8,911 -5,670 1,298
Personnel expenses -24,568 -21,200 -43,531
Other operating expenses -27,503 -26,454 -50,738
Impairment losses on financial assets 2,282 -3,695 -7,468
Profit before tax 49,035 1,544 13,393
Key balance sheet figures (EUR 1,000) 30 Jun 2021 30 Jun 2020 31 Dec 2020
Loan portfolio 4,068,107 3,756,935 3,868,147
Deposit portfolio 4,179,482 3,887,484 4,086,045
Insurance contract liabilities 50,381 44,130 43,915
Equity capital 556,741 502,251 518,114
Balance sheet total 5,274,361 4,868,157 5,099,270
Key ratios 30 Jun 2021 30 Jun 2020 31 Dec 2020
Cost to income ratio 57.2 % 90.8 % 83.2 %
Return on assets, ROA % 1.6 % 0.0 % 0.2 %
Return on equity, ROE % 15.1 % 0.4 % 2.2 %
Equity ratio, % 10.6 % 10.3 % 10.2 %
Common equity Tier 1 capital ratio, (CET1) % 19.8 % 19.9 % 19.9 %
Capital adequacy ratio, (TC) % 19.8 % 20.1 % 19.9 %
The calculation formulas for key indicators are presented on pages 29-30 of the Board of directors’ report and the consolidat-ed IFRS financial statements of the POP Bank Group on 31 December 2020.
POP BANK GROUP’S EARNINGS PERFORMANCEThe POP Bank Group’s profit before taxes was EUR 49.0 million, compared with EUR 1.5 million in the corresponding period of the previous year. The profit for the review period was EUR 40.6 (1.1) million.
Operating income increased by EUR 52.0 million to EUR 109.2 (57.2) million. Net interest income rose by 1.9 per cent to EUR 37.6 (36.9) million. In-terest income totalled EUR 40.7 (39.5) million in the review period, and interest expenses amount-ed to EUR 3.1 (2.5) million. Net commission in-come and expenses increased by 15.8 per cent year-on-year, amounting to EUR 18.3 (15.8) mil-lion.
Net investment income was EUR 8.9 million (EUR -5.7 million in the comparison period). The net amount of valuation gains and losses recognised during the first half of the year was EUR 5.5 (-6.9) million. As a result of the improved loss ratio, net insurance income increased year-on-year, amounting to EUR 7.4 (5.1) million. Other operat-ing income totalled EUR 37.0 (4.9) million. The sig-nificant increase consisted of 31.7 million euro of non-recurring items.
Total operating expenses increased by 20.4 per cent to EUR 62.5 (51.9) million. Expenses in-

11R E V I E W K E Y F I G U R E S H A L F -Y E A R R E P O RT N OT ES
creased significantly as a result of the recogni-tion of EUR 6.0 million in non-recurring cost items related to the termination of the core banking system project. Personnel expenses were EUR 24.6 (21.2) million, and other operating expenses were EUR 27.5 (26.5) million. Depreciation and im-pairment on tangible and intangible assets was EUR 10.4 (4.2) million.
An impairment loss of EUR 2.3 million on finan-cial assets was recognised in the review period, while EUR 3.7 million in impairment losses was recognised as a cost in the comparison period. The impairment losses consisted of changes in the recognised expected credit losses on receiv-ables and debt securities, and the actual credit losses. In the review period, EUR 5.0 million was recognised in expected credit losses (ECL), while the provision increased by EUR 1.3 million in the comparison period. The amount of the ECL pro-vision in the financial statements was reduced by the reversal of provisions based on the manage-ment’s estimate concerning debt securities, and by the new definition of “default”, which was in-troduced in the calculation of capital adequa-cy and the ECL provision at the beginning of the year. Final credit losses for the first half of the year totalled EUR 2.7 (2.4) million.
POP BANK GROUP’S BALANCE SHEETThe POP Bank Group’s balance sheet total was EUR 5,274.4 million at the end of the review peri-od (5,099.3 million at the beginning of the review period). During the review period, the Group’s loan portfolio increased by 5.2 per cent to EUR 4,068.1
OPERATING SEGMENTS
The POP Bank Group monitors its business opera-tions in two segments: banking and insurance.
BANKING
The POP Bank Group’s banking segment includes the POP Banks engaged in retail banking and Bonum Bank Plc, the central credit institution of the amalgamation. At the end of the review period, the POP Bank Group had 254,500 bank customers (253,700 at the beginning of the review period), of whom 85.3 (85.5) per cent were private customers, 8.8 (8.6) per cent were corporate customers and 2.8 (2.8) per cent were customers in agriculture and forestry. The POP Banks had 75 branches and ser-vice points at the end of the review period. In ad-dition, customers have access to mobile and on-line banking services and online appointments. In the EPSI Rating customer satisfaction survey, POP Bank has been ranked as Finland’s best bank ten times. According to the NPS survey, which meas-ures customers’ willingness to recommend various services, POP Bank’s index is 75, while the average in the Finnish banking sector is around 30.
After the exceptional times caused by the corona-virus pandemic, the POP Bank Group continued its sales development programme at full capacity. The programme started in 2019. As a result of the pro-gramme, the Group’s commission income and loan portfolio are growing significantly. Its total loan portfolio grew by 5.2 per cent during the first half of the year, and corporate loans increased by 11.6 per
(3,868.1) million, and deposits rose by 2.3 per cent to EUR 4,179.5 (4,086.0) million.
The POP Bank Group’s equity totalled EUR 556.7 (518.1) million at the end of the review peri-od. The cooperative capital, which consists of the POP Banks’ cooperative contributions and POP Shares, amounted to EUR 65.1 (66.0) million at the end of the review period. The POP Banks have decided to pay EUR 1.3 (1.3) million in in-terest on cooperative capital for 2020. The POP Banks’ distribution of profits meets the recom-mendation issued by the Financial Supervisory Authority on 18 December 2020. POP Shares are investments in the cooperative bank’s equity in accordance with the Co-operatives Act. In total, the POP Banks have issued EUR 55.1 (56.1) million in POP Shares.

12R E V I E W K E Y F I G U R E S H A L F -Y E A R R E P O RT N OT ES
cent. In June, a new funding solution, POP Laskura-ha, was added to the selection of services for cor-porate customers. The service was implemented in cooperation with Puro Finance Oy, a new partner.
The extensive digitisation of banking services and customer service is one of the key focus areas of the POP Bank Group’s new strategic renewal pro-gramme. The number of users of the Group’s mo-bile application, POP Mobiili, has increased stead-ily. At the end of the review period, the number of mobile bank users was more than two-thirds of the total number of online and mobile bank users. Nearly half of all mobile bank users use the appli-cation daily, and it has become the main service for taking care of daily banking within a short pe-riod of time. For the second consecutive year, POP Mobiili was ranked among the best products in app stores based on star ratings by customers.
In June, the entire Group introduced a new digital service, Asuntolainalupaus, for digital housing loan offers. The service provides customers with quick responses to their funding needs and enables the bank to process large amounts of housing loan applications efficiently. The digitisation of housing sales is also continuing at a brisk rate. The number of transactions completed through DIAS, a digital housing sales platform, is increasing promisingly.
BANKING EARNINGSEarnings from banking operations increased sig-nificantly year-on-year. The profit before taxes was EUR 44.8 (1.3) million. The termination of the core banking system project had an impact of EUR
25.7 million on the result. The cost-to-income ratio of banking operations was 54.1 (90.3) per cent.
All income items in banking operations increased during the review period. Operating income in-creased by EUR 47.8 million, amounting to EUR 101.1 (53.3) million. Net interest income rose from the comparison period, amounting to EUR 37.3 (36.7) million. Net commission income increased by 15.5 per cent to EUR 18.5 (16.0) million. The in-crease mainly results from changes in the prices of banking services and higher lending volumes. Net investment income in banking operations was EUR 7.9 (-4.3) million. Other operating income to-talled EUR 37.3 (4.9) million. The significant increase in income includes EUR 31.7 million in non-recurring items.
Operating expenses from banking operations grew by 21.1 per cent to EUR 58.5 (48.3) million. Expenses increased as a result of EUR 6.0 million in non-re-curring cost items. Personnel expenses in bank-ing operations amounted to EUR 16.8 (15.1) mil-lion, while other operating expenses were EUR 33.3 (30.9) million. Depreciation and impairment on tan-gible and intangible assets were EUR 8.4 (2.4) mil-lion. Expenses increased as a result of investments in service models that enable quick decision-mak-ing, as well as online security and the strengthen-ing of processes to prevent money laundering and fraud.
An impairment loss of EUR 2.3 million on financial assets was recognised in the review period, while EUR 3.7 million in impairment losses was recog-
nised as a cost in the comparison period. The de-crease in impairment was attributable to the gen-eral stabilisation of economic growth outlooks and changes in the definition of “default” which was implemented on 1 January 2021, as the criteria previously applied by the POP Bank Group when recognising receivables in ECL Stage 3 were strict-er. The amount of expected credit losses related to loan receivables and off-balance sheet credit commitments decreased by EUR 4.0 (0.6) million in the review period, ending at EUR 29.1 (33.1) million.
Expected credit losses related to debt securities decreased by EUR 1.0 million to EUR 2.2 (3.2) mil-lion during the review period. During the review pe-riod, EUR 0.5 million in management judgement on investments was derecognized, after which provi-sions based on management judgement concern-ing debt securities totalled EUR 1.0 (1.4) million.
Final credit losses for the first half of the year to-talled EUR 2.7 (2.4) million.
THE BANKING SEGMENT’S ASSETS AND LIABILITIESThe banking segment’s assets increased by 3.2 per cent during the first half of the year, amounting to EUR 5,279.9 million at the end of the review peri-od (5,114.4 at the beginning of the review period). The banking segment’s loan portfolio increased by 5.2 per cent during the review period, amounting to EUR 4,070.1 (3,870.2) million. Loans granted to pri-vate customers represented 65.5 (67.1) per cent of the loan portfolio. The proportion of companies in-creased from 17.5 to 19.7 per cent, while the pro-

13R E V I E W K E Y F I G U R E S H A L F -Y E A R R E P O RT N OT ES
portion of agricultural business owners decreased from 16 to 14.8 per cent. Deposits increased by 2.3 per cent and stood at EUR 4,183.2 (4,089.3) million at the end of the review period.
INSURANCE
The insurance segment of the POP Bank Group comprises Finnish P&C Insurance Ltd, which pro-vides non-life insurance for private customers. The insurance company offers the most common types of non-life insurance policies, which are sold to pri-vate customers mainly through digital channels.
During the review period, the number of Finnish P&C Insurance customers rose from 156,500 at the beginning of the review period to 163,500 at its end. The company gained 3,500 new insurance customers per month on average during the first half of the year. According to the results of an NPS survey, which measured customers’ willingness to recommend, the company is a leader in its field. Operating in electronic channels, the company serves customers widely throughout Finland.
Most of its non-life insurance policies are issued through its own sales channels. The most impor-tant distribution partners are the POP Bank Group and the Savings Bank Group, as well as car deal-erships and vehicle testing stations serving as agents. Finnish P&C Insurance Ltd is responsible for marketing its own products. The company fo-cuses on online marketing in particular and directs
customers to its online store. Its bank partners al-so mainly direct their customers to the company’s online store. Car dealerships and vehicle testing stations provide car insurance policies in their ca-pacity as agents.
Insurance operations are a key part of the POP Bank Group’s digital business operations.
INSURANCE EARNINGSDuring the first half of the year, the operating ex-pense ratio in insurance operations continued to improve year-on-year. This was due to scalability benefits in particular. The company further devel-oped its claims handling systems, service accessi-bility and new pricing models, for example, and in-troduced the first phase of its new claims system.
The profit before taxes for the review period was EUR 3.8 (-0.5) million. The strong profitability of business operations and the result of investment activities had a particularly positive impact on the result. The insurance segment’s loss ratio improved by 8.2 percentage points to 66.8 (75.0) per cent, and its operating expenses ratio improved by 3.8 percentage points to 20.7 (24.5) per cent.1
Net insurance income amounted to EUR 7.4 (5.1) million, an improvement of 43.4 per cent on the previous year. Premiums written (gross) increased by 1.9 per cent on the comparison period, to EUR 25.4 (24.9) million, and the claims incurred totalled EUR 14.9 (15.4) million, representing a decrease of
1 The operating expense ratio and the consolidated cost ratio have been calculated based on Finnish P&C Insurance Ltd’s national financial information.
3.7 per cent year-on-year. Net investment income from insurance operations increased significantly, amounting to EUR 1.2 (-1.0) million. Operating ex-penses totalled EUR 5.2 (4.8) million.
THE INSURANCE SEGMENT’S ASSETS AND LIABILITIESThe assets of the insurance segment increased by 13.9 per cent to EUR 91.8 million (80.7 million at the beginning of the review period). Insurance liabilities stood at EUR 44.1 (43.9) million at the end of the period. The liabilities of non-life insurance opera-tions totalled EUR 56.4 (49.2) million.
14R E V I E W K E Y F I G U R E S H A L F -Y E A R R E P O RT N OT ES
POP BANK GROUP’S RISK AND CAPITAL ADEQUACY MANAGEMENT AND RISK POSITION
The objectives, principles and organisation of POP Banks’ risk management and capital adequacy management are described in Note 4 to the POP Bank Group’s financial statements for 2020. No material changes were made in the review period to the objectives, principles or organisation de-scribed in the financial statements.
BANKING RISKS
CREDIT RISKThe credit risk position remained stable in banking operations, and the risk level remained moderate, although the uncertainty related to the coronavi-rus pandemic and the limited availability of reli-able information pose exceptional challenges for monitoring the credit risk position. The number of customers that applied for instalment-free peri-ods decreased to a normal level during the finan-cial period, and the key indicators related to over-due receivables remained at a moderate level. The proportion of the credit portfolio taken up by credits granted to private customers remained at the same level as at the end of the year, while the proportion of credits granted to corporate cus-tomers increased. The industry and customer risks of the amalgamation of POP Banks are diversified.
The credit portfolio increased by 5.2 per cent from the end of the year, amounting to EUR 4,068.1
(3,868.1) million. Lending mainly focuses on low-risk credits to private customers. Expected credit losses (ECL) on loans and receivables and off-bal-ance sheet credit commitments decreased by 12.0 per cent to EUR 29.1 (33.1) million. The amount of receivables in ECL-stage 1, of which the credit risk has not increased significantly since the initial recognition, was 91.8 (90.3) per cent of the loan portfolio. The amount of receivables in ECL-stage 2, with a significant increase in credit risk, was 6.1 (6.8) per cent of the loan portfolio. The amount of defaulted receivables in ECL-stage 3 was 2.1 (3.0) per cent of the loan portfolio.
Credit risk monitoring is based on the continuous monitoring of non-performing receivables, late payments and forbearance, and on monitoring the quality of the credit portfolio. The validation of the calculation principles for expected credit losses (ECL) and the monitoring and analysis of changes are essential parts of credit risk management.
LIQUIDITY RISKThe POP Bank Group’s liquidity position remained strong during the review period. The short-term li-quidity position is monitored by means of the Li-quidity Coverage Ratio (LCR) requirement, for which the indicator must be at least 100 per cent. The amalgamation’s LCR ratio was 176.0 (191.4) per cent on 30 June 2021. At the end of June, the amalgamation of POP Banks had EUR 565.5 (621,9) million in LCR-eligible liquid assets before haircuts, of which 68.2 (63.0) per cent consisted of cash and receivables from the central bank, 26.3 (32.4) per cent consisted of liquid Level 1 securi-
ties. In addition, outside the amalgamation’s LCR portfolio unencumbered securities eligible for cen-tral bank funding totalled to EUR 28.6 (71.1) million.
The POP Bank Group’s funding position remained strong throughout the review period. The propor-tion of deposits of the credit portfolio remained high, with the total amount of deposits increas-ing by 2.3 per cent during the reporting period. With respect to the bond programme of the cen-tral credit institution, Bonum Bank Plc, EUR 205.0 (225.0) million was outstanding, with respectively to the certificate of deposit programme of EUR 22.0 (41.5) million. In addition, Bonum Bank Plc has a loan programme of EUR 35 million with the Nor-dic Investment Bank (NIB). During the review pe-riod, Bonum Bank Plc participated in the Europe-an Central Bank’s TLTRO III financing operation for EUR 78.4 million. At the end of the reporting peri-od, Bonum Bank had TLTRO III financing totalling EUR 128.4 (50.0) million.
The requirement for net stable funding, NSFR, be-came binding in 2021 (28 June 2021) as part of CRR II Regulation 2019/876. The minimum lev-el of the requirement is 100 per cent. The NSFR measures the maturity mismatch of assets and liabilities on the balance sheet and ensures that the ongoing funding is sufficient to meet fund-ing needs over a one-year period, thus prevent-ing over-reliance on short-term wholesale funding. The amalgamation’s NSFR ratio on June 30, 2021 was 133.0 per cent.
Based on permission from the Financial Supervi-

15R E V I E W K E Y F I G U R E S H A L F -Y E A R R E P O RT N OT ES
sory Authority, the member credit institutions are exempted, by a decision of the central institution, from the liquidity requirements set out in Part Six of the Regulation (EU) 575/2013 and 2019/876 of the European Parliament and of the Council. Ac-cording to the permit, the regulatory requirements for LCR and NSFR must be met only at the amal-gamation level. The Bonum Bank as a credit in-stitution of the amalgamation is responsible for meeting the regulatory requirements.
MARKET RISKThe key market risk of the banking segment is the interest rate risk of the banking book, which is monitored and limited using both the present val-ue and income risk models. Interest rate risk arises from the banking books of member credit institu-tions, consisting of lending and deposits, whole-sale market funding and investment and liquidi-ty portfolios. The interest rate risk exposure of the POP Banks’ amalgamation is moderate in relation to the limits set to it.
The market risk related to investing activities is limited through asset class allocation and coun-terparty-specific risk limits. The business opera-tions of the member credit institutions do not in-clude trading on their own behalf or for customers. Their investing activities are primarily undertaken in order to invest financial surplus and manage li-quidity. A member credit institution needs permis-sion from the amalgamation’s risk control function in order to make direct currency-denominated in-vestments, or structured product investments, or derivative contracts to hedge against interest
rate risks related to the financial account.
OPERATIONAL RISKSThe materialisation of operational risks is min-imized by identifying and assessing the risks, by evaluating the effectiveness and adequacy of control and management mechanisms, by contin-uously training the personnel and providing com-prehensive operating instructions, as well as by internal control measures.
The operational risks associated with the key products, services, functions, processes and sys-tems are identified in the process of assessing a new product or service. The process involves the preparation of impact assessments, in which the different functions of the amalgamation take part. The member credit institutions belonging to the amalgamation assess the likelihood and impact of the materialisation of operational risks through self-assessments prepared on the basis of the key business processes. Certain operational risks are hedged against through insurance. Risks caused by malfunctions in information systems are pre-pared for through continuity planning. As custom-er encounters move to mobile and online, securi-ty risks also increase. The number of online scams has been growing significantly during the first half of the year. The POP Bank Group has recognized that the activities of online scammers have be-come more professional and have grown very rap-idly. The management of POP Bank centre coop has updated the situation related to the threat and strengthened both technical capabilities and proactive measures related to fraud detection and
customer communication.
INSURANCE RISKS
During the period under review, the most signifi-cant insurance risks were associated with busi-ness profitability development with particular fo-cus with the development of pricing and customer selections, and the sufficient increase in business volumes, taking the profitability aspect into ac-count.
Key operational risks still related to the building of IT systems and the controlled scaling and de-velopment of insurance business processes as the sales, customer and claim volumes have in-creased.
Information security risks are significant for an online company, and therefore, the compa-ny is strongly investing in their management. The key risks related to investing activities concern changes in the value of equity and interest rate instruments – which changes affect the compa-ny’s capital adequacy and the result of its invest-ing activities. These risks are controlled by means such as investment limits and the quality require-ments for investment assets, taking into account the maturity of the insurance contract liabilities.
CRISIS RESOLUTION PLAN
Directive 2014/59/EU of the European Parliament and of the Council establishing a framework for the recovery and resolution of credit institutions

16R E V I E W K E Y F I G U R E S H A L F -Y E A R R E P O RT N OT ES
and investment firms came into effect in Finland in 2015. The Financial Stability Authority was es-tablished to implement the Act on the Resolution of Credit Institutions and Investment Firms (Act on the Financial Stability Authority, 1195/2014). The Financial Stability Authority serves as the na-tional crisis resolution authority in Finland as part of the EU’s common crisis resolution mechanism.
Serving as the crisis resolution authority for the POP Bank Group, the Financial Stability Authori-ty specified the minimum amount of equity and subordinated debt (MREL requirement) in accord-ance with chapter 8, section 7 of the Act on the Resolution of Credit Institutions and Investment Firms (1194/2014), to take effect as of 31 Decem-ber 2019. In accordance with this decision, the MREL requirement is 19.8 per cent of the total risk exposure.
On 28 April 2021, the Financial Stability Authori-ty updated the MREL requirement of the amalga-mation of POP Banks. The new requirement is 19.39 per cent of the total amount of risk or 5.91 per cent of the total amount of exposures used in the cal-culation of the minimum capital adequacy ratio. The new requirement will take effect on January 1, 2022. The POP Bank Group’s current requirement and the requirement, which will take effect on 1 January 2022, will be covered by own funds and unsecured senior bonds.
CAPITAL ADEQUACY MANAGEMENT
The capital adequacy of the amalgamation of
POP Banks was at a good level. The amalgama-tion’s capital adequacy ratio was 19.8 per cent (19.9 on 31 December 2020), and its CET1 capital ratio was 19.8 (19.9) per cent. The amalgamation does not include the profit for the financial period in own funds.
The purpose of capital adequacy management at the amalgamation of POP Banks is to ensure a sufficient level and quality of capital and its ef-ficient use. A sufficient level of capital covers the material risks arising from the implementation of the amalgamation’s business strategy and plan, as well as securing the uninterrupted operation of the amalgamation in the case of unexpected loss-es. The goal is pursued through a documented and systematic capital adequacy management pro-cess – a process that forms an integral part of the strategy process, business planning and manage-ment of the amalgamation, and its member credit institutions.
The member credit institutions comprehensively identify and assess the risks related to their op-erations and adjust their risk-bearing capacity to the total amount of risks. To ensure its capital ad-equacy, the bank sets risk-based capital targets and prepares a capital plan to meet the targets. To prepare a capital plan, the member credit insti-tutions of the amalgamation use consistent cal-culation methods determined by the risk control function of the central institution. Based on per-mission from the Financial Supervisory Authority, the member credit institutions are exempted, by a decision of the central institution, from the own
funds requirement for intra-Group items, and from the restrictions imposed on major counterparties concerning items between the central credit insti-tution and the member credit institutions. Based on permission from the Financial Supervisory Au-thority, the intra-Group items have been excluded from the total exposure measure for calculating the leverage ratio as of 31 December 2020.
Totalling EUR 527.8 (513.0) million, the own funds of the amalgamation of POP Banks consist of coop-erative contributions, POP Shares, retained earn-ings and other non-restricted reserves. The amal-gamation’s capital adequacy requirement con-sists of the following items:
● Capital Requirements Regulation minimum of 8 %
● Additional Pillar 2 capital requirement of 1.25 %
● Capital conservation buffer of 2.5 % ● Country-specific capital requirements for foreign exposures
From Capital Requirements Regulation Minimum requirement 4.5 per cent must be Common Equi-ty Tier 1 (CET1) capital and all additional capital requirements must be covered with CET1 Capital. The Financial Supervisory Authority released the systemic risk buffer capital requirement of 1 per cent 6th April 2020.
CRR II Regulation 2019/876, which reformed the solvency regulation 575/2013 of the European

17R E V I E W K E Y F I G U R E S H A L F -Y E A R R E P O RT N OT ES
Parliament and of the Council, has been applied since 28 June 2021. According to the regulation the capital requirement for SME exposures re-duced and CIU investments have been taken into account by risk-weighting all the fund’s underly-ing assets as if they are direct exposures to the amalgamation or alternatively higher risk weight was used.
Amalgamation has implemented definition of default in accordance with Article 178 of the EU Capital Requirements Regulation 575/2013. Changes in definition of default increased number of defaulted receivables in capital adequacy and thus led to the increase in reported credit risk to-gether with the increase in amalgamation’s credit portfolio.
The leverage ratio, LR, became binding in June as part of the amendment to the EU Solvency Reg-ulation (CRR II). The minimum level of the require-ment is 3 per cent. The amalgamation’s LR ratio on June 30, 2021 was 9.9 per percent.
18R E V I E W K E Y F I G U R E S H A L F -Y E A R R E P O RT N OT ES
SUMMARY OF CAPITAL ADEQUACY
(EUR 1,000) 30 Jun 2021 31 Dec 2020
Own funds
Common Equity Tier 1 capital before deductions 543,739 536,352
Deductions from Common Equity Tier 1 capital -15,903 -23,306
Total Common Equity Tier 1 capital (CET1) 527,837 513,046
Additional Tier 1 capital before deductions - -
Deductions from Additional Tier 1 capital - -
Additional Tier 1 capital (AT1) - -
Tier 1 capital (T1 = CET1 + AT1) 527,837 513,046
Tier 2 capital before deductions - -
Deductions from Tier 2 capital - -
Total Tier 2 capital (T2) - -
Total capital (TC = T1 + T2) 527,837 513,046
Total risk weighted assets 2,662,016 2,578,449
of which credit risk 2,434,570 2,349,874
of which credit valutaion adjustment risk (CVA) - -
of which market risk (foreign exchange risk) 19,729 20,858
of which operational risk 207,717 207,717
(EUR 1,000) 30 Jun 2021 31 Dec 2020
CET1 Capital ratio (CET1-%) 19.8 % 19.9 %
T1 Capital ratio (T1-%) 19.8 % 19.9 %
Total capital ratio (TC-%) 19.8 % 19.9 %
Capital Requirement
Total capital 527,837 513,046
Capital requirement * 312,938 302,968
Capital buffer 214,899 210,031
Leverage ratio
Tier 1 capital (T1) 527,837 513,046
Leverage ratio exposure 5,357,666 5,146,910
Leverage ratio, % 9.9 % 10.0 %
* The capital requirement is comprised of the minimum requirement of 8.0 %, the additional Pillar 2 requirement of 1.25 %, the capital conservation buffer of 2.5 % and country-specific countercyclical capital requirements for foreign exposures. FIN-FSA released the systemic risk buffer capital requirement (1%) 6th April 2020.

19R E V I E W K E Y F I G U R E S H A L F -Y E A R R E P O RT N OT ES
RESPONSIBILITY
Social responsibility in the POP Bank Group is based on cooperative values, local operations and long-term business activity. Responsibility means compliance with the principles of sustain-able development in all of the Group’s operations, and concerns every employee’s day-to-day work and decisions. The POP Bank Group’s responsibil-ity work is guided by its responsibility programme, which was updated at the end of 2020. Its key themes are: 1) promoting sustainable financing and investing and thereby mitigating climate change; 2) supporting local success, vitality and well-be-ing; 3) transparent business operations; 4) ensuring the equality of employees and promoting diversity and well-being at work; and 5) preventing a shad-ow economy, corruption and money laundering.
During the review period, the POP Bank Group contributed to sustainability webinars organised by Finance Finland on digital guidance and ac-cessibility. The Group’s experts participated as speakers in the webinars. The POP Bank is partici-pating in the national Responsible Employer cam-paign in Finland for the second consecutive year. The Group’s banks have also continued their multi-faceted cooperation with educational institutions, as well as extensively supporting local providers of sports and cultural services. In addition, the Group has product and service development projects in progress to expand its funding and lending solu-tions for both consumers and corporate custom-ers, taking into account the European Commis-sion’s Green Deal strategy.
OUTLOOK FOR THE SECOND HALF OF THE YEAR
Finland’s GDP is expected to increase by around 3 per cent in 2021, and the Euribor rates are expect-ed to remain negative for a long time as a result of the European Central Bank’s support meas-ures. Demand is increasing as a result of stimu-lus measures and the release of savings accumu-lated during the coronavirus crisis. Small invest-ments, in particular, are expected to increase, with companies seeking to meet growing demand. The high level of activity in the housing market sup-ports construction. Economic growth is hindered to some extent by a component shortage in in-dustry and problems related to the availability of labour in service sectors. New virus variants and stricter restrictions may affect the rate of eco-nomic recovery and inflation development.
The POP Bank Group’s result is expected to im-prove significantly on 2020 (previous estimate at the same level as the 2020 result). The most sig-nificant uncertainties related to earnings arise from the valuation of financial assets and from impairment.
All forecasts and estimates presented in this half-year financial report are based on management’s current view of economic developments, and ac-tual results may differ materially due to a number of factors, including the development of the coro-na pandemic.
EVENTS AFTER THE REVIEW PERIOD
S&P Global Ratings confirmed in August Bonum Bank Plc’s current credit review.
No such significant business transactions have taken place at the POP Bank Group after the re-view period that would have a material impact on the financial information presented for the review period.
20R E V I E W K E Y F I G U R ES H A L F -Y E A R R E P O RT N OT ES
HALF-YEAR REPORT FOR 1 JANUARY – 30 JUNE 2021
POP BANK GROUP’S INCOME STATEMENT
(EUR 1,000) Note1 Jan -
30 Jun 20211 Jan -
30 Jun 2020
Interest income 40,738 39,478
Interest expenses -3,091 -2,541
Net interest income 4 37,647 36,937
Net commissions and fees 5 18,298 15,801
Net investment income 6 8,911 -5,670
Insurance income 7 7,384 5,149
Other operating income 36,969 4,943
Total operating income 109,209 57,160
Personnel expenses -24,568 -21,200
Other operating expenses -27,503 -26,454
Depreciation and amortisation -10,389 -4,242
Total operating expenses -62,460 -51,896
Impairment losses on financial assets
10 2,282 -3,695
Associate´s share of profits 3 -25
Profit before tax 49,035 1,544
Income tax expense -8,396 -424
Profit for the period 40,639 1,120
Attributable to
Equity owners of the POP Bank Group
40,636 1,120
Non-controlling interests 2 0
Total 40,639 1,120
POP BANK GROUP’S STATEMENT OF OTHER COMPREHENSIVE INCOME
(EUR 1,000)1 Jan -
30 Jun 20211 Jan -
30 Jun 2020
Profit for the period 40,639 1,120
Other comprehensive income
Items that will not be reclassified to profit or loss
Net changes in fair value
Equity instruments at FVOCI 218 22
Items that may be reclassified to profit or loss
Movement in fair value reserve
Liability instruments at FVOCI 47 -4,250
Other comprehensive income for the period
40,903 -3,109
Attributable to
Owners of the POP Bank Group 40,901 -3,108
Non-controlling interests 2 0
Total other comprehensive income for the period
40,903 -3,109
21R E V I E W K E Y F I G U R ES H A L F -Y E A R R E P O RT N OT ES
POP BANK GROUP’S BALANCE SHEET
(EUR 1,000) Note 30 Jun 2021 31 Dec 2020
Assets
Liquid assets 385,912 391,544
Loans and advances from credit institutions
8 11 71,030 64,166
Loans and advances from customers 8 11 4,068,107 3,868,147
Investment assets 12 661,232 688,871
Investments in associates 198 195
Intangible assets 13,674 20,549
Property, plant and equipment 32,011 32,138
Other assets 36,465 28,553
Tax assets 5,732 5,108
Total assets 5,274,361 5,099,270
(EUR 1,000) Note 30 Jun 2021 31 Dec 2020
Liabilities
Liabilities to credit institutions 8 13 171,905 97,219
Liabilities to customers 8 13 4,179,482 4,086,045
Non-life insurance liabilities 14 50,381 43,915
Debt securities issued to the public 15 226,932 266,346
Supplementary cooperative capital 11,287 11,287
Other liabilities 46,608 51,991
Tax liabilities 31,026 24,353
Total liabilities 4,717,620 4,581,156
Equity capital
Cooperative capital
Cooperative contributions 10,000 9,909
POP Shares 55,098 56,121
Total cooperative capital 65,098 66,030
Reserves 165,008 166,497
Retained earnings 326,188 285,142
Total equity attributable to the owners of the POP Bank Group
556,294 517,670
Non-controlling interests 447 444
Total equity capital 556,741 518,114
Total liabilities and equity capital 5,274,361 5,099,270

22R E V I E W K E Y F I G U R ES H A L F -Y E A R R E P O RT N OT ES
STATEMENT OF CHANGES IN THE POP BANK GROUP’S EQUITY
(EUR 1,000)Cooperative
capitalFair value
reserveOther
reservesRetained earnings Total
Non-controlling interests Total equity
Balance at 1 Jan 2021 66,030 4,905 161,592 285,142 517,670 444 518,114
Comprehensive income for the period
Profit for the financial period - - - 40,636 40,636 2 40,639
Other comprehensive income - 265 - - 265 - 265
Total comprehensive income - 265 - 40,636 40,901 2 40,903
Transactions with shareholders
Change in cooperative capital -1,162 - - - -1,162 - -1,162
Profit distribution - - - -1,051 -1,051 - -1,051
Transfer of reserves 230 - -1,754 1,523 - - -
Transactions with shareholders total
-932 - -1,754 472 -2,213 - -2,213
Other changes - - - -63 -63 - -63
Balance at 30 Jun 2021 65,098 5,169 159,839 326,188 556,294 447 556,741
(EUR 1,000)Cooperative
capitalFair value
reserveOther
reservesRetained earnings Total
Non-controlling interests Total equity
Balance at 1 Jan 2020 66,745 3,761 156,934 280,566 508,006 429 508,435
Comprehensive income for the period
Profit for the financial period - - - 1,120 1,120 0 1,120
Other comprehensive income - -4,228 - - -4,228 - -4,228
Total comprehensive income - -4,228 - 1,120 -3,108 0 -3,109
Transactions with shareholders
Change in cooperative capital -1,794 - - - -1,794 - -1,794
Profit distribution - - - -1,280 -1,280 - -1,280
Transfer of reserves 192 - 3,586 -3,778 - - -
Transactions with shareholders total
-1,602 - 3,586 -5,059 -3,074 - -3,074
Other changes - - -1 - -1 - -1
Balance at 30 Jun 2020 65,143 -467 160,519 276,627 501,822 429 502,251
The Financial Supervisory Au-thority recommended on 18 De-cember 2020 that banks should exercise extreme caution in dis-tributing profits until 30 Sep-tember 2021 and recommended that banks should comply with the European Central Bank’s recommended maximum prof-it distribution. The cooperative banks of the POP Bank Group has complied with the recom-mendations regarding the prof-it distribution of profits paid for 2020. Profit distribution of the POP Banks’ does not have a material impact on the capital level of the POP Banks’ or the ability to offer financing to their customers.
23R E V I E W K E Y F I G U R ES H A L F -Y E A R R E P O RT N OT ES
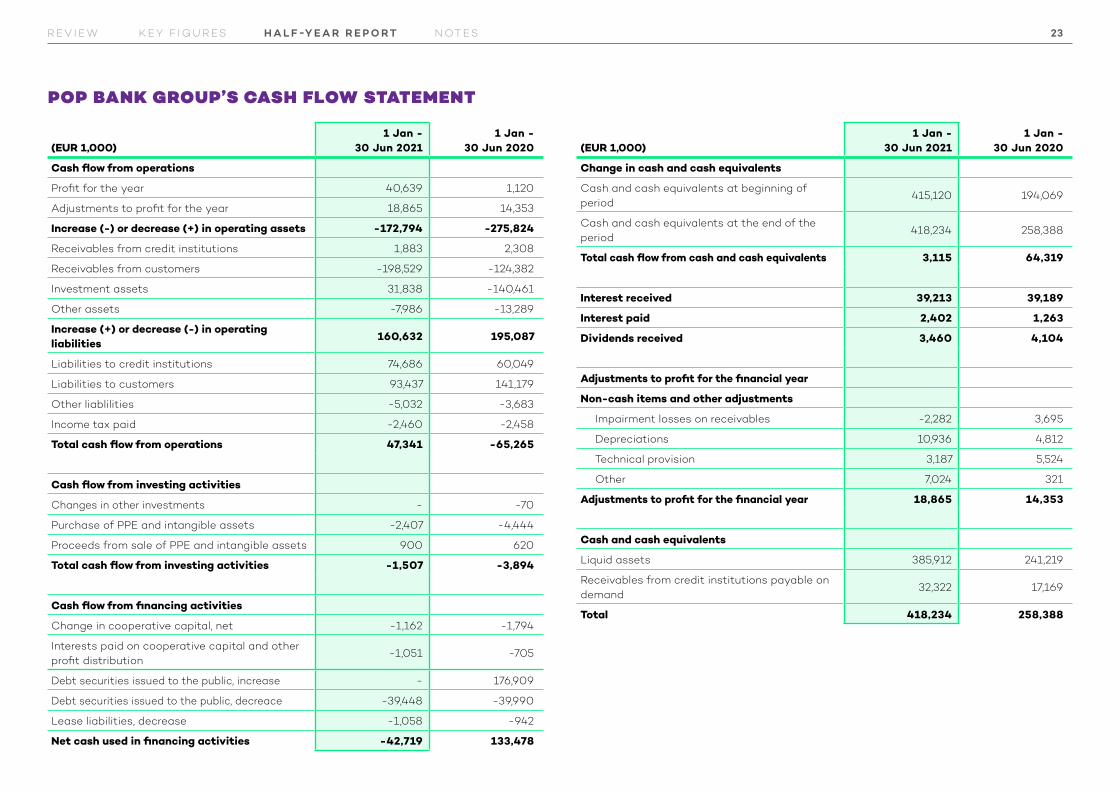
POP BANK GROUP’S CASH FLOW STATEMENT
(EUR 1,000)1 Jan -
30 Jun 20211 Jan -
30 Jun 2020
Cash flow from operations
Profit for the year 40,639 1,120
Adjustments to profit for the year 18,865 14,353
Increase (-) or decrease (+) in operating assets -172,794 -275,824
Receivables from credit institutions 1,883 2,308
Receivables from customers -198,529 -124,382
Investment assets 31,838 -140,461
Other assets -7,986 -13,289
Increase (+) or decrease (-) in operating liabilities
160,632 195,087
Liabilities to credit institutions 74,686 60,049
Liabilities to customers 93,437 141,179
Other liablilities -5,032 -3,683
Income tax paid -2,460 -2,458
Total cash flow from operations 47,341 -65,265
Cash flow from investing activities
Changes in other investments - -70
Purchase of PPE and intangible assets -2,407 -4,444
Proceeds from sale of PPE and intangible assets 900 620
Total cash flow from investing activities -1,507 -3,894
Cash flow from financing activities
Change in cooperative capital, net -1,162 -1,794
Interests paid on cooperative capital and other profit distribution
-1,051 -705
Debt securities issued to the public, increase - 176,909
Debt securities issued to the public, decreace -39,448 -39,990
Lease liabilities, decrease -1,058 -942
Net cash used in financing activities -42,719 133,478
(EUR 1,000)1 Jan -
30 Jun 20211 Jan -
30 Jun 2020
Change in cash and cash equivalents
Cash and cash equivalents at beginning of period
415,120 194,069
Cash and cash equivalents at the end of the period
418,234 258,388
Total cash flow from cash and cash equivalents 3,115 64,319
Interest received 39,213 39,189
Interest paid 2,402 1,263
Dividends received 3,460 4,104
Adjustments to profit for the financial year
Non-cash items and other adjustments
Impairment losses on receivables -2,282 3,695
Depreciations 10,936 4,812
Technical provision 3,187 5,524
Other 7,024 321
Adjustments to profit for the financial year 18,865 14,353
Cash and cash equivalents
Liquid assets 385,912 241,219
Receivables from credit institutions payable on demand
32,322 17,169
Total 418,234 258,388
24R E V I E W K E Y F I G U R ES H A L F -Y E A R R E P O RT N OT E S
POP Bank Group (hereinafter also referred to as the “Group”) is a financial Group comprising POP Banks and POP Bank Centre Coop and their sub-sidiaries and jointly controlled entities that oper-ates in Finland. POP Banks are independent, re-gionally and locally operating cooperative banks. POP Bank Centre Coop functions as the central institution of the Group. POP Bank Group offers retail banking services to retail customers, small and medium-sized enterprises, agricultural, for-estry and bioeconomy companies, as well as non-life insurance services to retail customers.
The member credit institutions of POP Bank Cen-tre Coop are the 21 cooperative banks and the central credit institution of the member cooper-ative banks, Bonum Bank Plc. The amalgamation of POP Banks is an economic entity referred to in the Act on the Amalgamation of Deposit Banks (hereinafter referred to as the “Amalgamation Act”) the members of which and the central insti-tution are jointly liable for each other’s debts and commitments. The amalgamation of POP Banks is formed by the central institution POP Bank Centre Coop, its member credit institutions, the companies included in their consolidation Groups and those credit institutions, financial institu-tions and service companies in which entities in-cluded in the amalgamation jointly hold over 50 per cent of the votes. The companies included in the consolidation Groups of NOTE 1 POP Bank
Group and the scope of IFRS Financial State-ments the member credit institutions are primar-ily real estate companies.
POP Bank Group also includes other entities be-sides the entities included in the amalgama-tion of POP Banks. The most significant entities that do not belong to the POP Bank Group are POP Holding Ltd and its wholly-owned subsidiary Finnish P&C Insurance Ltd, which are not in the scope of joint liability.
POP Bank Group does not form a Group of companies referred to in the Accounting Act (1336/1997) or a consolidation Group referred to in the Act on Credit Institutions (610/2014). POP Bank Centre Coop or its member cooper-ative banks do not exercise control pursuant to IFRS accounting standards on each other, and therefore no parent company can be determined for the Group. In accordance with the Amalga-mation Act, the Board of Directors has specified the Group’s accounting policies suitable for this structure to the extent that the IFRS account-ing standards do not acknowledge the Group’s structure. The accounting policies that include a description of the technical parent company consisting of the member cooperative banks are presented in Note 2 of the IFRS financial state-ments 2020.
The following chart presents the structure of the POP Bank Group and the entities included in the amalgamation and the scope of joint liability.
NOTES
NOTE 1 THE POP BANK GROUP AND THE SCOPE OF IFRS FINANCIAL STATEMENTS

25R E V I E W K E Y F I G U R ES H A L F -Y E A R R E P O RT N OT E S
Companies included in the banks’
consolidation groups
POP HOLDING LTD
FINNISH P&C INSURANCE LTD
MEMBER COOPERATIVE BANKS
Member credit institutions
POP BANK CENTRE COOPCentral institution
BONUM BANK PLCCentral credit institution, member credit institution
THE POP BANK GROUP
AMALGAMATION OF POP BANKS
JOINT LIABILITY
During the financial period, one internal merg-er in the POP Bank Group took place. At the end of February, Reisjärven Osuuspankki merged with Siilinjärven Osuuspankki and the bank’s name was changed to Järvi-Suomen Osuuspankki. Follow-ing the merger, the POP Bank Group includes 21 member banks. The mergers are intra-group ar-rangements, and they do not have an impact on the POP Bank Group’s consolidated financial in-formation.

26R E V I E W K E Y F I G U R ES H A L F -Y E A R R E P O RT N OT E S
NOTE 2 POP BANK GROUP’S ACCOUNTING POLICIES
The consolidated financial statements of the POP Bank Group have been prepared in accordance with the International Financial Reporting Stand-ards (IFRS) and the related interpretations (IFRIC).
The half-year financial report for 1 January – 30 June 2021 has been prepared in accordance with IAS 34 Interim Financial reporting and the ac-counting policies presented in the POP Bank Group’s consolidated IFRS financial statements 31 December 2020.
The figures disclosed in the half-year financial re-port are unaudited. The figures in the half-year fi-nancial report are in thousand euros, unless oth-erwise stated. The figures in the calculations and tables are rounded, whereby the sum total of indi-vidual figures may deviate from the sum total pre-sented. The operating currency of all of the com-panies belonging to the POP Bank Group is euro.
Copies of the financial statements and half-year financial report of the POP Bank Group are avail-able at the office of the central institution, ad-dress Hevosenkenkä 3, FI02600 Espoo, Finland, and online at www.poppankki.fi. The POP Bank Group only publishes one interim financial report.
Changes in the accounting policies The new amendments to the IFRS-standards that were adopted at the beginning of the financial year have not had an impact on the POP Bank Group’s financial information.
Definition of defaultAt the beginning of 2021, the POP Bank Group adopted a new definition of default in calculation of expected credit losses, in accordance with Arti-cle 178 of the EU Capital Requirements Regulation 575/2013. Liabilities are classified in stage 3 of ex-pected credit losses calculation, when they meet the default criteria.
The effect of the new definition of default is in-cluded in Note 10 Impairment losses on financial assets.
Accounting policies requiring management judgement and uncertainties related to estimatesThe application of IFRS requires the management to make estimates and assumptions concerning the future that affect the amount of items pre-sented in financial statements, as well as the in-formation provided in the notes. The manage-ment’s key estimates concern the future and key uncertainties related to the values on the bal-ance sheet date. Such key estimates are related to fair value measurement in particular, as well as the impairment of financial assets and intangible assets. More detailed information on the fair val-ues and valuation techniques of financial assets is provided in Note 9.
Due to the corona pandemic, the fair values and impairments of financial assets are subject to greater uncertainty.
Impairment on financial assetsCalculation of the expected credit losses includes parameters requiring management’s considera-tion. Management has to determine the method of taking macroeconomic information into consider-ation in the calculations, the principles of evaluat-ing significant increases in the credit risk, the as-sessment of loss in default and the credit conver-sion factors applied to credit cards.
The instalment-free periods granted in the spring 2020 in the beginning of the corona pandemic ended to a significant extent during the last finan-cial year, and no corresponding amounts of new repayment reschedules have been applied for.
Based on management’s judgement, additional impairment losses have been recognized due to the increase in credit risk associated with certain issuers of debt securities. Management has as-sessed the financial situation of these issuers on a case-by-case basis and increased impairment loss provisions since these issuers have faced fi-nancial difficulties as a result of corona pandemic.
New IFRS standards and interpretations
New IFRS 17 Insurance Contracts (effective for annual periods beginning on or after 1 January 2023).The new standard for insurance contracts and will help investors and other parties to better under-stand insurers’ risk exposure and their profitabil-

27R E V I E W K E Y F I G U R ES H A L F -Y E A R R E P O RT N OT E S
ity and financial position. The new standard will replace the current IFRS 4 Insurance Contracts. Due to a decision made by the IASB, the imple-mentation of the standard has been postponed by one year. The POP Bank Group is in the process of assessing the impacts of the standard, as well as running a project to prepare for its implemen-tation. The POP Bank Group will implement the standard starting from the annual period begin-ning on 1 January 2023, when its implementation becomes mandatory. The standard is yet to be en-dorsed by the EU.
28R E V I E W K E Y F I G U R ES H A L F -Y E A R R E P O RT N OT E S
NOTE 3 POP BANK GROUP’S OPERATING SEGMENTS
The operating segments of POP Bank Group are banking and insurance. The operating segments are reported in a way that is consistent with the internal reporting to the management. The report-ing of operating segments complies with the ac-counting policies applied to the Group’s IFRS fi-nancial statements. The policies are presented in note 2 POP Bank Group’s accounting policies un-der IFRS. The chief operating decision maker of the POP Bank Group is the Board of Directors of the Group’s central institution POP Bank Centre coop. The central institution is responsible for the alloca-tion of resources and assessing the profitability of operations.
The Banking segment includes the member coop-erative banks and Bonum Bank Plc. Cooperative banks engage in retail banking and Bonum Bank Plc acts as their central credit institution. The most significant income items of Banking are net inter-est income, fee and commission income as well as investment income. The most significant expense items consist of personnel expenses and other op-erating expenses.
The Insurance segment comprises Finnish P&C In-surance Ltd, a provider of vehicle, property and personal insurance policies to private customers. The most significant income items of Insurance are insurance premium revenue and net investment in-come. The most significant expense items of Insur-ance consist of personnel expenses and other op-erating expenses.
Internal transactions between banks included in the Banking segment are eliminated in segment reporting. Pricing between segments is based on market prices. Transactions between the Banking segment and the Insurance segment are presented in unallocated items and eliminations. Unallocated items include income statement and balance sheet items related to other operations. The most signif-icant institutions included in other operations are POP Holding Ltd and POP Bank Centre coop.

29R E V I E W K E Y F I G U R ES H A L F -Y E A R R E P O RT N OT E S
POP BANK GROUP’S OPERATING SEGMENTS 2021
INCOME STATEMENT 1 JANUARY – 30 JUN 2021
(EUR 1,000) Banking Insurance Segments totalUnallocated items
and eliminations Group total
Net interest income 37,339 314 37,652 -6 37,647
Net commissions and fees 18,543 -202 18,341 -42 18,298
Net investment income 7,937 1,211 9,148 -237 8,911
Insurance income - 7,384 7,384 - 7,384
Other operating income 37,268 246 37,514 -545 36,969
Total operating income* 101,086 8,953 110,039 -830 109,209
Personnel expenses -16,844 -3,906 -20,750 -3,817 -24,568
Other operating expenses -33,323 -216 -33,539 6,036 -27,503
Depreciation and amortisation -8,361 -1,041 -9,402 -988 -10,389
Total operating expenses -58,528 -5,163 -63,691 1,231 -62,460
Impairment losses on financial assets 2,286 -3 2,282 - 2,282
Associate´s share of profits - - - 3 3
Profit before tax 44,844 3,787 48,631 404 49,035
Income tax expense -8,312 0 -8,312 -84 -8,396
Profit for the period 36,531 3,787 40,318 321 40,639
*External share of total operating income 101,086 8,953 110,039
*Internal share of total operating income 554 - 554

30R E V I E W K E Y F I G U R ES H A L F -Y E A R R E P O RT N OT E S
BALANCE SHEET 30 JUN 2021
(EUR 1,000) Banking Insurance Segments totalUnallocated items
and eliminations Group total
Assets
Liquid assets 385,912 - 385,912 - 385,912
Loans and advances from credit institutions 64,491 9,860 74,351 -3,321 71,030
Loans and advances from customers 4,070,099 - 4,070,099 -1,992 4,068,107
Investment assets 695,842 62,173 758,015 -96,783 661,232
Investments in associates - - - 198 198
Intangible assets 7,152 4,362 11,514 2,161 13,674
Property, plant and equipment 31,083 590 31,673 338 32,011
Other assets 21,625 14,361 35,986 479 36,465
Tax assets 3,700 497 4,197 1,535 5,732
Total assets 5,279,903 91,844 5,371,747 -97,386 5,274,361
Liabilities
Liabilities to credit institutions 171,663 - 171,663 242 171,905
Liabilities to customers 4,183,239 - 4,183,239 -3,757 4,179,482
Non-life insurance liabilities - 50,381 50,381 - 50,381
Debt securities issued to the public 226,932 - 226,932 - 226,932
Supplementary cooperative capital 11,287 - 11,287 - 11,287
Other liabilities 40,610 5,324 45,934 674 46,608
Tax liabilities 30,160 694 30,854 171 31,026
Total liabilities 4,663,891 56,400 4,720,290 -2,670 4,717,620

31R E V I E W K E Y F I G U R ES H A L F -Y E A R R E P O RT N OT E S
POP BANK GROUP’S OPERATING SEGMENTS 2020
INCOME STATEMENT 1 JANUARY – 30 JUN 2020
(EUR 1,000) Banking Insurance Segments totalUnallocated items
and eliminations Group total
Net interest income 36,682 261 36,943 -6 36,937
Net commissions and fees 16,049 -208 15,841 -40 15,801
Net investment income -4,336 -1,041 -5,377 -293 -5,670
Insurance income - 5,149 5,149 - 5,149
Other operating income 4,867 237 5,103 -161 4,943
Total operating income* 53,262 4,398 57,660 -499 57,160
Personnel expenses -15,065 -3,367 -18,432 -2,767 -21,200
Other operating expenses -30,892 -461 -31,353 4,899 -26,454
Depreciation and amortisation -2,358 -1,053 -3,411 -831 -4,242
Total operating expenses -48,316 -4,881 -53,196 1,300 -51,896
Impairment losses on financial assets -3,663 -32 -3,695 - -3,695
Associate´s share of profits - - - -25 -25
Profit before tax 1,283 -515 768 776 1,544
Income tax expense -267 1 -266 -158 -424
Profit for the period 1,016 -514 502 618 1,120
*External share of total operating income 53,262 4,398 57,660
*Internal share of total operating income 197 - 197
32R E V I E W K E Y F I G U R ES H A L F -Y E A R R E P O RT N OT E S
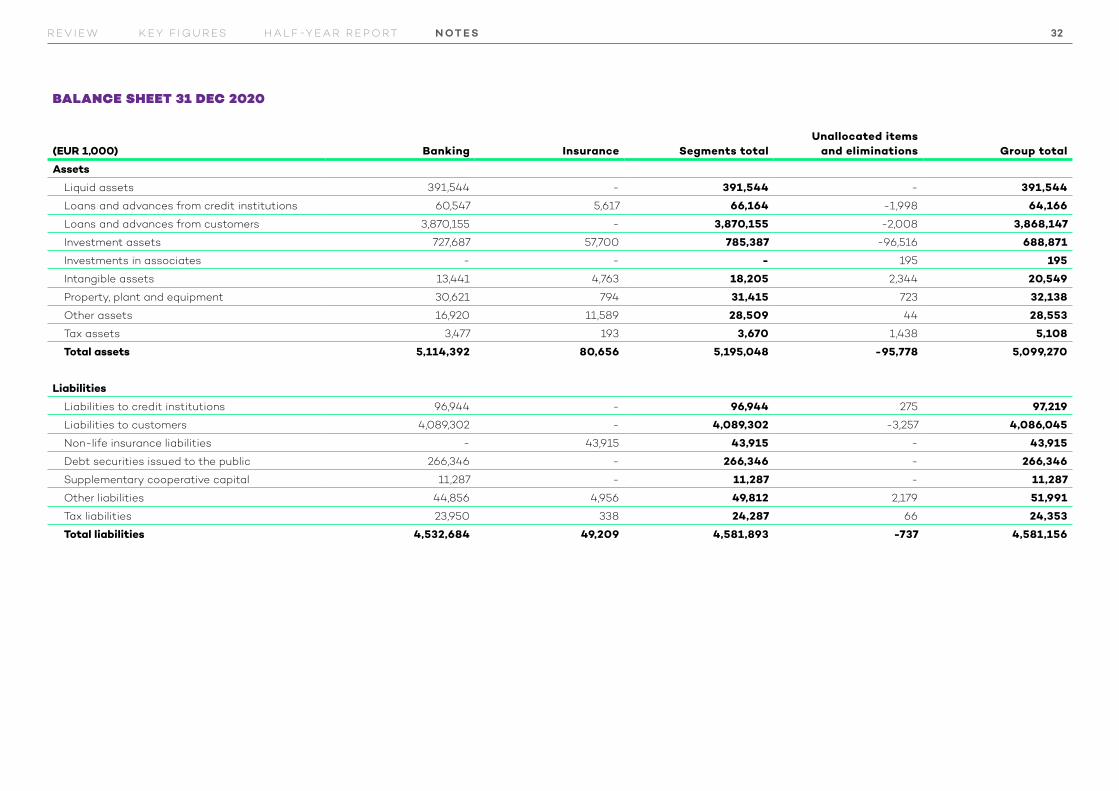
BALANCE SHEET 31 DEC 2020
(EUR 1,000) Banking Insurance Segments totalUnallocated items
and eliminations Group total
Assets
Liquid assets 391,544 - 391,544 - 391,544
Loans and advances from credit institutions 60,547 5,617 66,164 -1,998 64,166
Loans and advances from customers 3,870,155 - 3,870,155 -2,008 3,868,147
Investment assets 727,687 57,700 785,387 -96,516 688,871
Investments in associates - - - 195 195
Intangible assets 13,441 4,763 18,205 2,344 20,549
Property, plant and equipment 30,621 794 31,415 723 32,138
Other assets 16,920 11,589 28,509 44 28,553
Tax assets 3,477 193 3,670 1,438 5,108
Total assets 5,114,392 80,656 5,195,048 -95,778 5,099,270
Liabilities
Liabilities to credit institutions 96,944 - 96,944 275 97,219
Liabilities to customers 4,089,302 - 4,089,302 -3,257 4,086,045
Non-life insurance liabilities - 43,915 43,915 - 43,915
Debt securities issued to the public 266,346 - 266,346 - 266,346
Supplementary cooperative capital 11,287 - 11,287 - 11,287
Other liabilities 44,856 4,956 49,812 2,179 51,991
Tax liabilities 23,950 338 24,287 66 24,353
Total liabilities 4,532,684 49,209 4,581,893 -737 4,581,156

33R E V I E W K E Y F I G U R ES H A L F -Y E A R R E P O RT N OT E S
NOTE 4 NET INTEREST INCOME
(EUR 1,000)1 Jan -
30 Jun 20211 Jan -
30 Jun 2020
Interest Income
Loans and receivables to credit institutions 0 5
Loans and receivables to customers 37,698 37,130
Debt securities
At amortised cost 406 71
At fair value through profit or loss 116 159
At fair value through other comprehensive income
1,522 1,744
Other interest income 995 370
Total interest income 40,738 39,478
Of which negative interest expense 659 5
Interest expense
Liabilities to credit institutions -361 -46
Liabilities to customers -1,786 -2,016
Debt securities issued to the public -644 -398
Other interest expenses -301 -82
Total interest expenses -3,091 -2,541
Of which negative interest income -589 -111
Net interest income 37,647 36,937
Interest income from financial assets impaired due to credit risk (stage 3)
1,015 1,727
NOTE 5 NET COMMISSIONS AND FEES
(EUR 1,000)1 Jan -
30 Jun 20211 Jan -
30 Jun 2020
Fee and commission income
Lending 4,323 3,643
Deposits 93 100
Payment transfers 10,102 8,850
Legal services 1,092 1,069
Intermediated services 2,030 1,923
Issuing guarantees 258 234
Funds 1,610 1,486
Other 699 523
Total fee and commission income 20,207 17,828
Fee and commission expenses
Payment transfers -1,643 -1,738
Other -266 -289
Total fee and commission expenses -1,909 -2,027
Net commissions and fees 18,298 15,801
Commissions and fees are mainly accrued from the banking segment.

34R E V I E W K E Y F I G U R ES H A L F -Y E A R R E P O RT N OT E S
NOTE 6 NET INVESTMENT INCOME
(EUR 1,000)1 Jan -
30 Jun 20211 Jan -
30 Jun 2020
At fair value through profit or loss
Debt securities
Capital gains and losses -68 65
Fair value gains and losses 152 -765
Shares and participations
Dividend income 3,098 4,100
Capital gains and losses 112 -1,943
Fair value gains and losses 5,392 -6,127
Total 8,686 -4,671
At fair value through other comprehensive income
Debt securities
Capital gains and losses -51 -4
Transferred from fair value reserve to the income statement
-112 -977
Shares and participations
Dividend income 4 5
Total -159 -976
Net income from foreign exchange trading 168 219
Net income from investment property
Rental income 1,389 1,401
Capital gains and losses 281 61
Other income from investment property 132 21
Maintenance charges and expenses -1,034 -1,149
Depreciations and amortisation of investment property
-547 -570
Other expenses from investment property -5 -6
Total net income from investment property 216 -241
Net investment income total 8,911 -5,670
Net investment income includes net income from financial instruments except interest income from bonds recognised in net interest income.
NOTE 7 INSURANCE INCOME
(EUR 1,000)1 Jan -
30 Jun 20211 Jan -
30 Jun 2020
Insurance premium revenue
Premiums written 25,363 24,879
Change in the provision for unearned premiums -2,139 -3,640
Gross insurance premium revenue 23,224 21,239
Ceded to reinsurers -980 -667
Total insurance premium revenue 22,244 20,572
Claims incurred
Claims paid -13,071 -13,723
Change in provision for unpaid claims -3,091 -1,414
Total claims incurred, gross -16,163 -15,137
Ceded to reinsurers 1,302 -286
Total claims incurred -14,860 -15,423
Net insurance income 7,384 5,149

35R E V I E W K E Y F I G U R ES H A L F -Y E A R R E P O RT N OT E S
NOTE 8 CLASSIFICATION OF FINANCIAL ASSETS AND LIABILITIES
FINANCIAL ASSETS 30 JUN 2021
(EUR 1,000) At amortised costAt fair value through
profit or loss
At fair value through other comprehensive
income Expected credit loss Total carrying amount
Liquid assets 385,912 - - - 385,912
Loans and advances from credit institutions 71,031 - - -1 71,030
Loans and advances from customers 4,096,304 - - -28,197 4,068,107
Debt securities* 105,000 10,163 340,334 -38 455,460
Shares and participations - 172,806 3,642 - 176,448
Financial assets total 4,658,246 182,969 343,976 -28,235 5,156,956
Other assets 117,405
Total assets 5,274,361
*Expected credit loss of EUR 2,166 thousand from debt securities, measured at fair value through other comprehensive income, have been recorded in the fair value reserve.
(EUR 1,000) At amortised costAt fair value through
profit or loss
At fair value through other comprehensive
income Expected credit loss Total carrying amount
Liquid assets 391,544 - - - 391,544
Loans and advances from credit institutions 64,167 - - -1 64,166
Loans and advances from customers 3,900,449 - - -32,302 3,868,147
Debt securities* 105,000 9,929 368,186 -41 483,074
Shares and participations - 171,735 3,370 - 175,104
Financial assets total 4,461,159 181,663 371,556 -32,344 4,982,035
Other assets 117,235
Total assets 5,099,270
*Expected credit loss of EUR 3,140 thousand from debt securities have been recorded in the fair value reserve.
FINANCIAL ASSETS 31 DECEMBER 2020
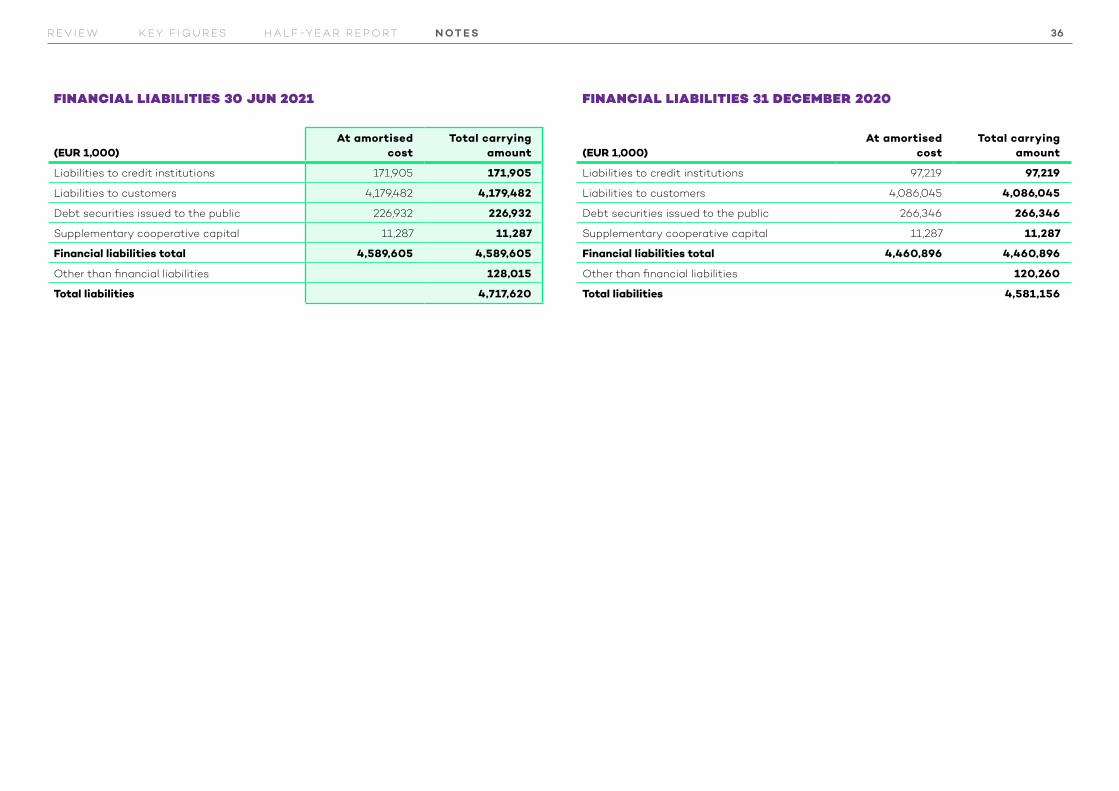
36R E V I E W K E Y F I G U R ES H A L F -Y E A R R E P O RT N OT E S
FINANCIAL LIABILITIES 30 JUN 2021
(EUR 1,000)At amortised
costTotal carrying
amount
Liabilities to credit institutions 171,905 171,905
Liabilities to customers 4,179,482 4,179,482
Debt securities issued to the public 226,932 226,932
Supplementary cooperative capital 11,287 11,287
Financial liabilities total 4,589,605 4,589,605
Other than financial liabilities 128,015
Total liabilities 4,717,620
FINANCIAL LIABILITIES 31 DECEMBER 2020
(EUR 1,000)At amortised
costTotal carrying
amount
Liabilities to credit institutions 97,219 97,219
Liabilities to customers 4,086,045 4,086,045
Debt securities issued to the public 266,346 266,346
Supplementary cooperative capital 11,287 11,287
Financial liabilities total 4,460,896 4,460,896
Other than financial liabilities 120,260
Total liabilities 4,581,156

37R E V I E W K E Y F I G U R ES H A L F -Y E A R R E P O RT N OT E S
NOTE 9 FAIR VALUE MEASUREMENTS BY VALUATION TECHNIQUE
FINANCIAL ASSETS
30 Jun 2021 31 Dec 2020
(EUR 1,000) Carrying amount Fair value Carrying amount Fair value
Liquid assets 385,912 385,912 391,544 391,544
Loans and receivables from credit institutions 71,030 71,219 64,166 64,358
Loans and receivables from customers 4,068,107 4,160,791 3,868,147 3,986,180
Debt securities 455,460 459,238 483,074 484,610
Shares and participations 176,448 176,448 175,104 175,104
Total 5,156,956 5,253,607 4,982,035 5,101,796
FINANCIAL LIABILITIES
30 Jun 2021 31 Dec 2020
(EUR 1,000) Carrying amount Fair value Carrying amount Fair value
Liabilities to credit institutions 171,905 171,570 97,219 98,127
Liabilities to customers 4,179,482 4,175,840 4,086,045 4,074,582
Debt securities issued to the public 226,932 230,829 266,346 270,944
Supplementary cooperative capital 11,287 11,287 11,287 11,287
Total 4,589,605 4,589,526 4,460,896 4,454,940

38R E V I E W K E Y F I G U R ES H A L F -Y E A R R E P O RT N OT E S
FAIR VALUE HIERARCHY LEVELS OF ITEMS RECURRENTLY RECOGNISED AT FAIR VALUE
ITEMS RECURRENTLY MEASURED AT FAIR VALUE 30 JUN 2021
(EUR 1,000) Level 1 Level 2 Level 3 Total fair value
At fair value through profit or loss
Shares and participations 163,003 - 9,803 172,806
Debt securities 3,050 - 7,114 10,163
At fair value through other comprehensive income
Shares and participations - - 3,642 3,642
Debt securities 250,571 89,199 564 340,334
Total 416,624 89,199 21,122 526,945
ITEMS RECURRENTLY MEASURED AT FAIR VALUE 31 DECEMBER 2020
(EUR 1,000) Level 1 Level 2 Level 3 Total fair value
At fair value through profit or loss
Shares and participations 162,735 - 9,000 171,735
Debt securities 2,665 - 7,263 9,929
At fair value through other comprehensive income
Shares and participations - - 3,370 3,370
Debt securities 260,540 107,647 - 368,186
Total 425,940 107,647 19,633 553,220

39R E V I E W K E Y F I G U R ES H A L F -Y E A R R E P O RT N OT E S
FAIR VALUE DETERMINATION OF FINANCIAL ASSETS AND FINANCIAL LIABILITIESFinancial assets are recorded in the balance sheet either at fair value or at amortized cost. The classification and measurement of financial in-struments is described in more detail in IFRS fi-nancial statemets of the POP Bank Group’s on 31 December 2020 in Note 2 POP Bank Group’s ac-counting policies.
FAIR VALUE HIERARCHIESLevel 1 includes financial instruments that are measured on the basis of quotations obtained from liquid markets. A market is considered as liquid if quotations are regularly available. This group included all securities with publicly quoted prices.
Level 2 includes financial instruments measures using generally approved measurement tech-niques or models which are based on assump-tions made on the basis of observable market prices. For example, the fair value of a financial in-stument allocated to Level 2 may be based on the value derived from the market quotation of com-ponents of an instrument. This group includes in-terest derivatives and other instruments that are not traded in liquid markets.
Level 3 includes financial instruments and oth-er assets and liabilities that are not meas-ured using market quotations or values deter-mined on the basis of observable market pric-es using measurement techniques or models. The assumptions applied in the measurement
teghniques often involve insecurity. The fair val-ue of assets allocated to Level 3 is often based on price information obtained from a third party. This group includes unlisted shares and funds and investment properties.
TRANSFERS BETWEEN FAIR VALUE HIERARCHIESTransfers between hierarchy levels are considered to have taken place on the date of the occurrence of the event that caused the transfer or the date when the circumstances changed.
During the reporting period, securities of EUR 672 (186) thousand have been transferred from hier-archy level 1 to hierarchy level 3 due to small trad-ing volumes in the markets. Securities from hier-archy level 3 have returned EUR 160 (0) thousand to hierarchy level 1 due to the normalization of trading volumes.

40R E V I E W K E Y F I G U R ES H A L F -Y E A R R E P O RT N OT E S
(EUR 1,000)At fair value through
profit or lossAt fair value through other
comprehensive income Total
Carrying amount 1 Jan 2020 15,132 2,448 17,580
+ Purchases 1,900 120 2,020
- Sales -514 -366 -880
- Matured during the financial year -91 -300 -391
+/- Realised changes in value recognised in income statment -123 -27 -150
+/- Unrealised changes in value recognised in the income statement -378 - -378
+/- Changes in value recognised in other comprehensive income - 1,309 1,309
+ Transfers to levels 3 1,128 186 1,314
- Transfers to levels 1 and 2 -791 - -791
Carrying amount 31 Dec 2020 16,264 3,370 19,633
CHANGES IN FINANCIAL ASSETS RECURRENTLY MEASURED AT FAIR VALUE CLASSIFIED INTO LEVEL 3
(EUR 1,000)At fair value through
profit or lossAt fair value through other
comprehensive income Total
Carrying amount 1 Jan 2021 16,264 3,370 19,633
+ Purchases 1,113 - 1,113
- Sales -53 -83 -136
- Matured during the financial year -376 - -376
+/- Realised changes in value recognised in income statment -24 7 -17
+/- Unrealised changes in value recognised in the income statement 152 - 152
+/- Changes in value recognised in other comprehensive income - 240 240
+ Transfers to levels 3 - 672 672
- Transfers to levels 1 and 2 -160 - -160
Carrying amount 30 Jun 2021 16,916 4,206 21,122

41R E V I E W K E Y F I G U R ES H A L F -Y E A R R E P O RT N OT E S
The sensitivity of financial assets recurrently measured at fair value at level 3 has been calcu-lated for interest rate linked investments by as-suming a 1 percentage points change in interest rates and for other investments by assuming the market price of the security to change by 15%.
SENSITIVITY ANALYSIS OF FINANCIAL ASSETS AT LEVEL 3
30 JUN 2021 Possible effect on equity capital
(EUR 1,000) Carrying amount Positive Negative
At fair value through profit or loss 16,916 1,542 -1,542
At fair value through other comprehensive income 4,206 552 -552
Total 21,122 2,093 -2,093
31 DECEMBER 2020 Possible effect on equity capital
(EUR 1,000) Carrying amount Positive Negative
At fair value through profit or loss 16,264 1,423 -1,423
At fair value through other comprehensive income 3,370 505 -505
Total 19,633 1,928 -1,928
The POP Bank Group does not have assets meas-ured non-recurrently at fair value.

42R E V I E W K E Y F I G U R ES H A L F -Y E A R R E P O RT N OT E S
NOTE 10 IMPAIRMENT LOSSES ON FINANCIAL ASSETS
IMPAIRMENT LOSSES RECORDED DURING THE REPORTING PERIOD
(EUR 1,000) 1 Jan - 30 Jun 2021 1 Jan - 30 Jun 2020
Change of ECL due to write-offs 1,428 1,344
Change of ECL, receivables from customers and off-balance sheet items 2,557 -1,912
Change of ECL, debt securities 977 -762
Final credit losses -2,680 -2,366
Impairment losses on financial assets total 2,282 -3,695
During the financial year, EUR 2,680 (2,366) thou-sand was recognized as final credit loss. The growth of final credit losses is partly explained due to a credit loss of EUR 1,831 (812) thousand recorded on unsecured consumer loans.
Changes in expected credit loss (ECL) during the fi-nancial period are presented in the tables below. Stage 1 represents financial instruments whose credit risk has not increased significantly since the initial recog-nition. Expected credit losses are determined for such financial instruments based on expected loan losses for 12 months. Stage 2 represents financial instruments whose credit risk has increased significantly after the initial recognition on the basis of qualitative or quantitative criteria and, for stage 3, financial in-struments whose counterparty has been declared as default. Expected credit losses are determined for financial instruments classified in Stage 2 and 3 based on the expected credit losses over the entire life of the instrument.
The principles for calculating expected credit loss-es are presented in IFRS financial statements of the POP Bank Group’s on 31 December 2020 in section 3.4 Impairment of financial assets of Note 2 of POP Bank Groups IFRS Financial statements.
At the beginning of 2021, the POP Bank Group im-plemented a definition of default in accordance with Article 178 of EU Capital Requirements Regulation 575/2013. The implementation of the new definition of default reduced the number of receivables to be classified in stage 3, as the criteria previously ap-plied by the POP Bank Group for recording receiva-bles in ECL stage 3 were stricter.

43R E V I E W K E Y F I G U R ES H A L F -Y E A R R E P O RT N OT E S
RECEIVABLES FROM CUSTOMERS
(EUR 1,000) Stage 1 Stage 2 Stage 3 Total
ECL 1 Jan 2021 5,359 3,539 23,405 32,303
Transfers to stage 1 192 -1,112 -2,378 -3,298
Transfers to stage 2 -229 1,299 -2,711 -1,641
Transfers to stage 3 -99 -90 2,923 2,734
Increases due to origination 1,487 593 1,011 3,090
Decreases due to derecognition -672 -357 -3,269 -4,299
Changes due to change in credit risk (net) -969 -198 1,903 736
Decreases due to write-offs - - -1,428 -1,428
Total -291 135 -3,949 -4,106
ECL 30 Jun 2021 5,068 3,674 19,455 28,198
DEBT SECURITIES
(EUR 1,000) Stage 1 Stage 2 Stage 3 Total
ECL 1 Jan 2021 169 939 2,073 3,181
Transfers to stage 1 7 -251 -36 -280
Transfers to stage 2 0 1,151 -1,596 -445
Increases due to origination 23 82 - 105
Decreases due to derecognition -20 -75 -48 -143
Changes due to change in credit risk (net) 147 124 - 271
Impact of the management's estimate -165 -321 - -485
Total -8 712 -1,680 -977
ECL 30 Jun 2021 160 1,651 393 2,204
The largest change in expected credit losses on receivables from customers is from decreases due to derecognition total EUR 4,299 (9,578) thousand. Transfers to stage 3 totaled EUR 2,734 (4,681) thousand.
The additional provision for debt securities based on management’s judgement was derecog-nized EUR 485 thousand, as the financial conditions of certain issuers recovered, ending at EUR 963 (1,449) thousand.
OFF-BALANCE SHEET COMMITMENTS
(EUR 1,000) Stage 1 Stage 2 Stage 3 Total
ECL 1 Jan 2021 331 138 319 788
Transfers to stage 1 7 -92 -40 -125
Transfers to stage 2 -5 8 -5 -2
Transfers to stage 3 0 -1 27 26
Increases due to origination 349 132 17 499
Decreases due to derecognition -21 -10 -61 -91
Changes due to change in credit risk (net) -138 -10 -39 -187
Total 192 28 -100 120
ECL 30 Jun 2021 523 167 219 908
(EUR 1,000) Stage 1 Stage 2 Stage 3 Total
ECL 1 Jan 2021 5,859 4,617 25,797 36,272
ECL 30 Jun 2021 5,751 5,491 20,067 31,310

44R E V I E W K E Y F I G U R ES H A L F -Y E A R R E P O RT N OT E S
RECEIVABLES FROM CUSTOMERS
(EUR 1,000) Stage 1 Stage 2 Stage 3 Total
ECL 1 Jan 2020 4,761 3,351 25,693 33,804
Transfers to stage 1 167 -1,157 -2,883 -3,874
Transfers to stage 2 -352 1,109 -1,309 -551
Transfers to stage 3 -203 -222 5,106 4,681
Increases due to origination 2,526 1,250 3,461 7,237
Decreases due to derecognition -1,088 -640 -7,849 -9,578
Changes due to change in credit risk (net) -450 -152 4,727 4,124
Decreases due to write-offs - - -3,540 -3,540
Total 599 188 -2,288 -1,501
ECL 31 Dec 2020 5,359 3,539 23,405 32,303
DEBT SECURITIES
(EUR 1,000) Stage 1 Stage 2 Stage 3 Total
ECL 1 Jan 2020 117 1,125 360 1,603
Transfers to stage 1 1 -4 - -3
Transfers to stage 2 -7 63 - 57
Transfers to stage 3 -3 -272 340 65
Increases due to origination 73 26 40 140
Decreases due to derecognition -19 -175 - -193
Changes due to change in credit risk (net) 6 26 33 65
Changes due to management estimates - 149 1,299 1,449
Total 51 -186 1,713 1,578
ECL 31 Dec 2020 169 939 2,073 3,181
OFF-BALANCE SHEET COMMITMENTS
(EUR 1,000) Stage 1 Stage 2 Stage 3 Total
ECL 1 Jan 2020 375 75 238 688
Transfers to stage 1 4 -44 -26 -67
Transfers to stage 2 -14 48 -5 28
Transfers to stage 3 -1 0 22 20
Increases due to origination 166 75 53 294
Decreases due to derecognition -44 -8 -35 -87
Changes due to change in credit risk (net) -155 -7 73 -89
Total -44 63 81 100
ECL 31 Dec 2020 331 138 319 788
(EUR 1,000) Stage 1 Stage 2 Stage 3 Total
ECL 1 Jan 2020 5,253 4,551 26,291 36,095
ECL 31 Dec 2020 5,859 4,617 25,797 36,272

45R E V I E W K E Y F I G U R ES H A L F -Y E A R R E P O RT N OT E S
BALANCE SHEET ITEM BY STAGE 30 JUN 2021
(EUR 1,000) Stage 1 Stage 2 Stage 3 Total
Receivables from customers
Private 2,521,146 128,436 32,419 2,682,001
Corporate 721,338 57,857 28,675 807,870
Agriculture 515,908 65,404 25,121 606,433
Receivables from customers total 3,758,391 251,697 86,215 4,096,304
ECL 30 Jun 2021 5,068 3,674 19,455 28,198
Coverage ratio % 0.13 % 1.46 % 22.57 % 0.69 %
Off-balance sheet commitments
Private 232,342 5,028 387 237,757
Corporate 88,221 6,805 484 95,510
Agriculture 24,769 2,565 172 27,506
Off-balance sheet commitments total 345,332 14,398 1,043 360,773
ECL 30 Jun 2021 523 167 219 908
Coverage ratio % 0.15 % 1.16 % 21.00 % 0.25 %
Debt securities
Banking segment 373,808 26,695 - 400,503
Insurance segment 31,246 13,585 - 44,831
Debt securities total 405,055 40,280 - 445,334
ECL 30 Jun 2021 160 1,651 393 2,204
Coverage ratio % 0.04 % 4.10 % - 0.49 %
Credit risk by stages total 4,508,777 306,375 87,258 4,902,411
The table above summarizes the exposure to credit risk and the amount of ECL in relation to the amount of the exposure in stages. The coverage ratio illustrates the relative share of the ECL in the amount of exposure. There were no significant changes in the coverage ratio during the period.
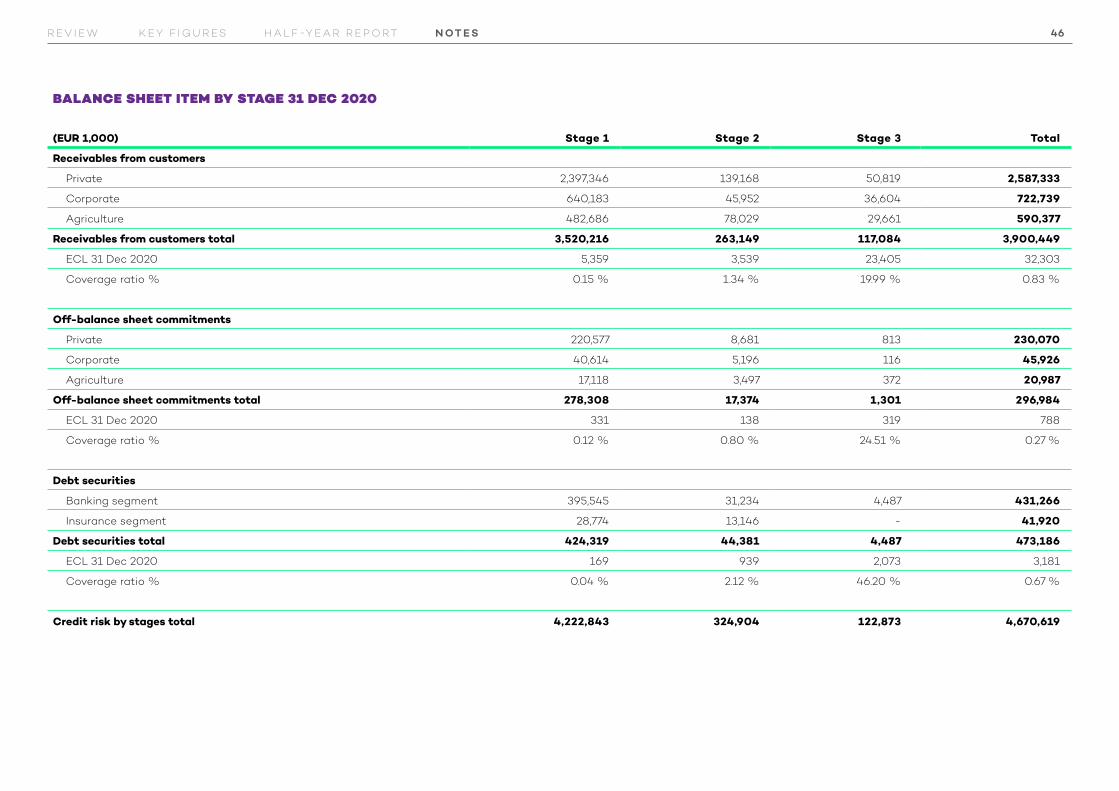
46R E V I E W K E Y F I G U R ES H A L F -Y E A R R E P O RT N OT E S
BALANCE SHEET ITEM BY STAGE 31 DEC 2020
(EUR 1,000) Stage 1 Stage 2 Stage 3 Total
Receivables from customers
Private 2,397,346 139,168 50,819 2,587,333
Corporate 640,183 45,952 36,604 722,739
Agriculture 482,686 78,029 29,661 590,377
Receivables from customers total 3,520,216 263,149 117,084 3,900,449
ECL 31 Dec 2020 5,359 3,539 23,405 32,303
Coverage ratio % 0.15 % 1.34 % 19.99 % 0.83 %
Off-balance sheet commitments
Private 220,577 8,681 813 230,070
Corporate 40,614 5,196 116 45,926
Agriculture 17,118 3,497 372 20,987
Off-balance sheet commitments total 278,308 17,374 1,301 296,984
ECL 31 Dec 2020 331 138 319 788
Coverage ratio % 0.12 % 0.80 % 24.51 % 0.27 %
Debt securities
Banking segment 395,545 31,234 4,487 431,266
Insurance segment 28,774 13,146 - 41,920
Debt securities total 424,319 44,381 4,487 473,186
ECL 31 Dec 2020 169 939 2,073 3,181
Coverage ratio % 0.04 % 2.12 % 46.20 % 0.67 %
Credit risk by stages total 4,222,843 324,904 122,873 4,670,619
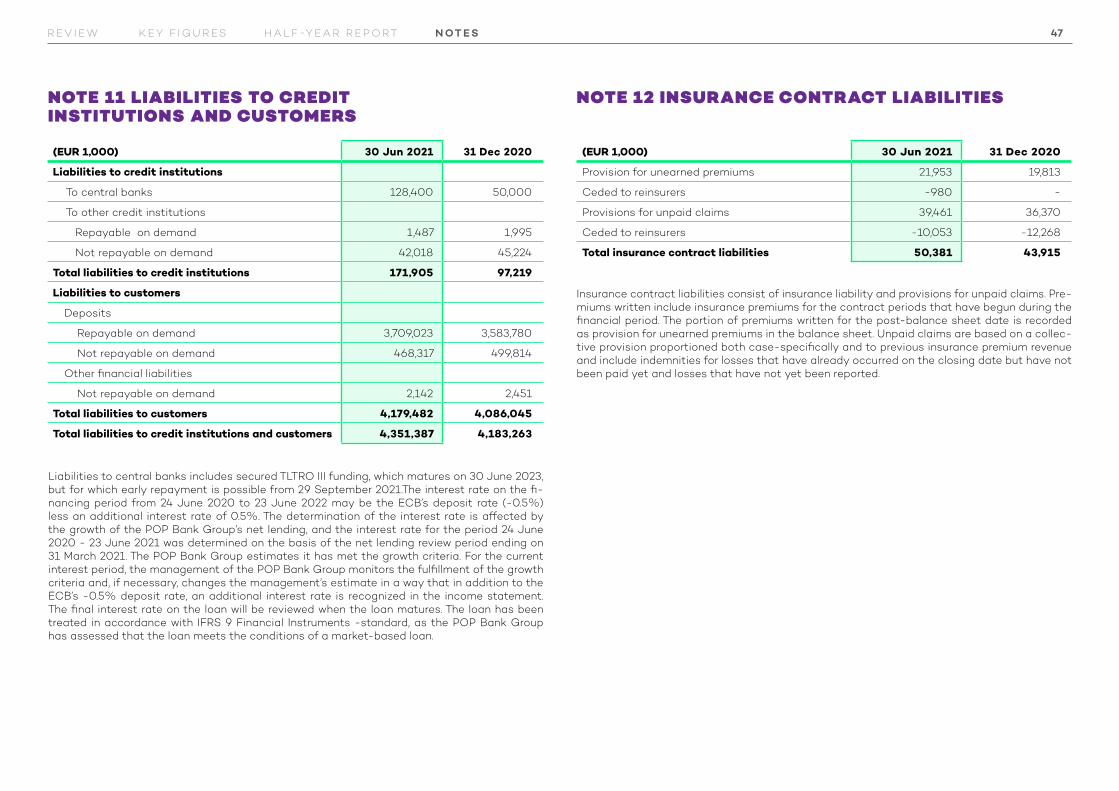
47R E V I E W K E Y F I G U R ES H A L F -Y E A R R E P O RT N OT E S
NOTE 11 LIABILITIES TO CREDIT INSTITUTIONS AND CUSTOMERS
(EUR 1,000) 30 Jun 2021 31 Dec 2020
Liabilities to credit institutions
To central banks 128,400 50,000
To other credit institutions
Repayable on demand 1,487 1,995
Not repayable on demand 42,018 45,224
Total liabilities to credit institutions 171,905 97,219
Liabilities to customers
Deposits
Repayable on demand 3,709,023 3,583,780
Not repayable on demand 468,317 499,814
Other financial liabilities
Not repayable on demand 2,142 2,451
Total liabilities to customers 4,179,482 4,086,045
Total liabilities to credit institutions and customers 4,351,387 4,183,263
Liabilities to central banks includes secured TLTRO III funding, which matures on 30 June 2023, but for which early repayment is possible from 29 September 2021.The interest rate on the fi-nancing period from 24 June 2020 to 23 June 2022 may be the ECB’s deposit rate (-0.5%) less an additional interest rate of 0.5%. The determination of the interest rate is affected by the growth of the POP Bank Group’s net lending, and the interest rate for the period 24 June 2020 - 23 June 2021 was determined on the basis of the net lending review period ending on 31 March 2021. The POP Bank Group estimates it has met the growth criteria. For the current interest period, the management of the POP Bank Group monitors the fulfillment of the growth criteria and, if necessary, changes the management’s estimate in a way that in addition to the ECB’s -0.5% deposit rate, an additional interest rate is recognized in the income statement. The final interest rate on the loan will be reviewed when the loan matures. The loan has been treated in accordance with IFRS 9 Financial Instruments -standard, as the POP Bank Group has assessed that the loan meets the conditions of a market-based loan.
(EUR 1,000) 30 Jun 2021 31 Dec 2020
Provision for unearned premiums 21,953 19,813
Ceded to reinsurers -980 -
Provisions for unpaid claims 39,461 36,370
Ceded to reinsurers -10,053 -12,268
Total insurance contract liabilities 50,381 43,915
NOTE 12 INSURANCE CONTRACT LIABILITIES
Insurance contract liabilities consist of insurance liability and provisions for unpaid claims. Pre-miums written include insurance premiums for the contract periods that have begun during the financial period. The portion of premiums written for the post-balance sheet date is recorded as provision for unearned premiums in the balance sheet. Unpaid claims are based on a collec-tive provision proportioned both case-specifically and to previous insurance premium revenue and include indemnities for losses that have already occurred on the closing date but have not been paid yet and losses that have not yet been reported.
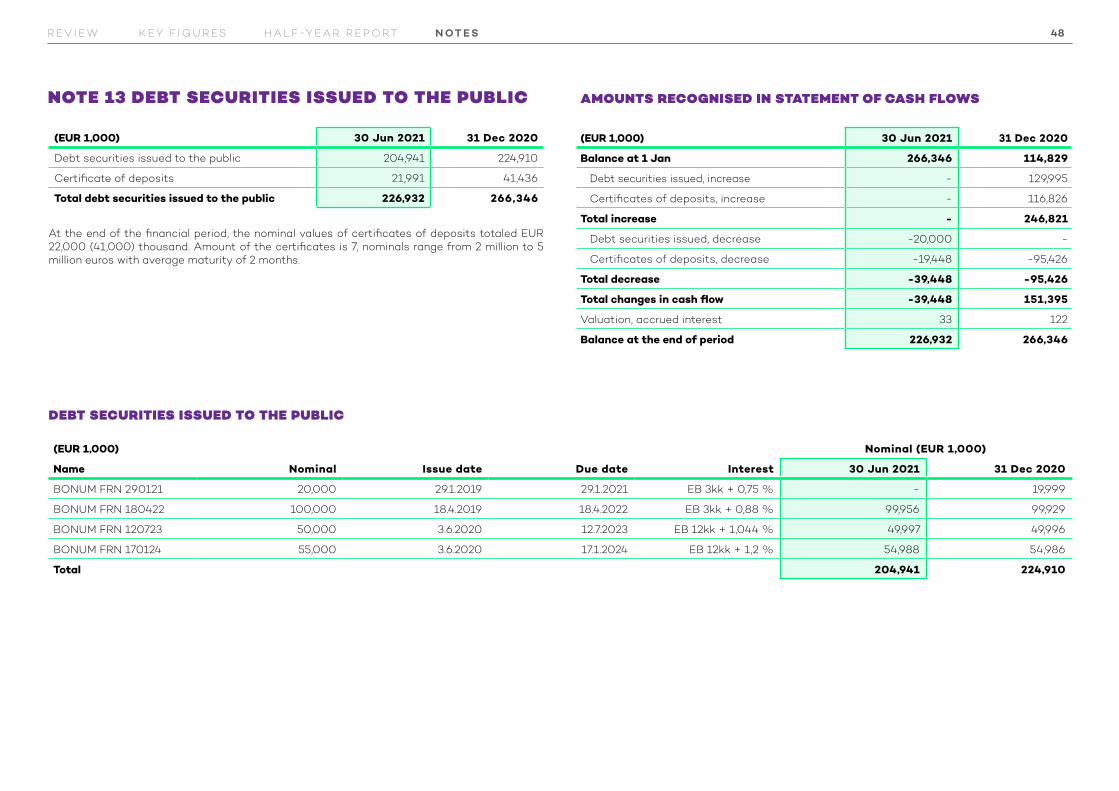
48R E V I E W K E Y F I G U R ES H A L F -Y E A R R E P O RT N OT E S
(EUR 1,000) 30 Jun 2021 31 Dec 2020
Debt securities issued to the public 204,941 224,910
Certificate of deposits 21,991 41,436
Total debt securities issued to the public 226,932 266,346
NOTE 13 DEBT SECURITIES ISSUED TO THE PUBLIC
At the end of the financial period, the nominal values of certificates of deposits totaled EUR 22,000 (41,000) thousand. Amount of the certificates is 7, nominals range from 2 million to 5 million euros with average maturity of 2 months.
(EUR 1,000) Nominal (EUR 1,000)
Name Nominal Issue date Due date Interest 30 Jun 2021 31 Dec 2020
BONUM FRN 290121 20,000 29.1.2019 29.1.2021 EB 3kk + 0,75 % - 19,999
BONUM FRN 180422 100,000 18.4.2019 18.4.2022 EB 3kk + 0,88 % 99,956 99,929
BONUM FRN 120723 50,000 3.6.2020 12.7.2023 EB 12kk + 1,044 % 49,997 49,996
BONUM FRN 170124 55,000 3.6.2020 17.1.2024 EB 12kk + 1,2 % 54,988 54,986
Total 204,941 224,910
DEBT SECURITIES ISSUED TO THE PUBLIC
AMOUNTS RECOGNISED IN STATEMENT OF CASH FLOWS (EUR 1,000) 30 Jun 2021 31 Dec 2020
Balance at 1 Jan 266,346 114,829
Debt securities issued, increase - 129,995
Certificates of deposits, increase - 116,826
Total increase - 246,821
Debt securities issued, decrease -20,000 -
Certificates of deposits, decrease -19,448 -95,426
Total decrease -39,448 -95,426
Total changes in cash flow -39,448 151,395
Valuation, accrued interest 33 122
Balance at the end of period 226,932 266,346

49R E V I E W K E Y F I G U R ES H A L F -Y E A R R E P O RT N OT E S
NOTE 14 COLLATERAL GIVEN
NOTE 15 OFF-BALANCE SHEET COMMITMENTS
(EUR 1,000) 30 Jun 2021 31 Dec 2020
Given on behalf of own liabilities and commitments
Pledges and mortagages 2,946 2,546
Collateral to the Bank of Finland 149,635 115,673
Total collateral given 152,580 118,218
(EUR 1,000) 30 Jun 2021 31 Dec 2020
Guarantees 17,364 17,064
Loan commitments 343,408 279,920
Total off-balance sheet commitments 360,773 296,984
Other commitments
Commitment to invest in venture capital funds 5,099 2,779
Total other commitments 5,099 2,779
The expected credit losses of off-balance sheet commitments are presented in Note 10.
NOTE 16 RELATED PARTIES
The related parties of POP Bank Group comprise the companies and associ-ates consolidated in the financial statements, and members of the Board of Directors and Executive Group and members of their immediate families.
The related parties of the POP Bank Group include the members of the Super-visory Board and Board of Directors of POP Bank Centre coop and their close relatives. Related parties also include the managing director and deputy man-aging director of POP Bank Centre coop. Related parties also include compa-nies over which the above-mentioned persons exercise control.
There has been no material changes in relatedparty transactions after 31 Dec 2020.

50R E V I E W K E Y F I G U R ES H A L F -Y E A R R E P O RT N OT E S
FURTHER INFORMATION
Pekka Lemettinen, CEO, POP Bank Centre coop, tel. +358 40 503 5411 Jaakko Pulli, COO, POP Bank Centre coop, tel. +358 50 420 0925
www.poppankki.fi/pop-pankki-ryhma
Espoo 16 August 2021 Board of Directors of POP Bank Centre coop
The figures disclosed in the half-year financial report are unaudited